
Abstract
An increasing number of studies have examined neighbourhood built environment attributes associated with cycling. Some of them suggest non-linear relationships between built environment attributes and cycling. This study examined the strength and shape of associations of cycling for transport with objectively measured built environment attributes. Data were from 9146 Australian adults who took part in the 2009 South-East Queensland Travel Survey. Participants (aged 18–64 years) completed a 24-hour travel survey, in which they reported modes of travel. Residential density, Walk Score and a Space Syntax measure of street integration were calculated at a neighbourhood level using geographic information systems. Multilevel logistic regression analyses examined associations of bicycle use with each built environment attribute, which was modelled continuously and categorically. All continuous measures of the built environment attributes were associated with bicycle use. Each one-decile increment in residential density, Walk Score, and street integration was associated with 13%, 16%, and 10% higher odds of bicycle use, respectively. However, the associations appeared to be non-linear, with significant odds ratios observed only for the higher categories of each built environment attribute relative to the middle category. This study found that adults living in high-density neighbourhoods with more destinations nearby and well-connected streets were more likely to cycle for transport. However, medium-level density, access to destinations and street connectivity may not be enough to facilitate bicycle use. Further studies are needed to investigate urban design threshold values above which cycling can be promoted.
Introduction
Cycling is a form of moderate-to-vigorous intensity physical activity (Ainsworth et al., 2000), with well-documented health benefits (Garrard et al., 2012; Oja et al., 2011). A recent large prospective study conducted in the UK showed cycling to work to be associated with lower risk of heart disease, cancer, and all-cause mortality (Celis-Morales et al., 2017). Since bicycle use can cover a longer distance compared with walking, it can be an alternative mode of transport to private cars, thus could reduce transport-related sitting time – which can have negative health impacts (Owen et al., 2010b; Sugiyama et al., 2016). Nevertheless, the prevalence of bicycle use is low in countries such as Australia and the USA. Data from the 2011 Australian census showed that only 1% of working population reported cycling as their mode of commuting to work (Australian Bureau of Statistics, 2011b). In contrast, some European countries such as Denmark and the Netherlands have a much higher mode share of cycling. For example, in Denmark, residents cycle for 31% of trips shorter than 2.5 km (The Danish national travel survey, 2014). Increasing cycling for transport can be an effective health promotion initiative in countries where bicycle use is currently low.
Ecological models identifying multiple levels of influence on health behaviours highlight the importance of built environment attributes in shaping behavioural choices, including bicycle use (Sallis and Owen, 2015). A growing body of literature has examined neighbourhood built environment attributes in relation to cycling (Adams et al., 2013; Beenackers et al., 2012; Chang and Chang, 2009; Christiansen et al., 2016; Forsyth and Krizek, 2011; Kim et al., 2018; Owen et al., 2010a; Rybarczyk and Wu, 2014; Winters et al., 2010). A cross-sectional study using data from 10 countries found several objectively measured built environment attributes such as land use mix, street connectivity, and residential density to be associated with cycling for transport (Christiansen et al., 2016). Another study conducted in the UK found perceived street connectivity to be associated with cycling for transport (Adams et al., 2013). A longitudinal study in Australia found the uptake of cycling for transport to be associated with increases in objectively measured street connectivity and perceived access to destinations (Beenackers et al., 2012).
Previous studies on environmental correlates of cycling tended to assume linear relationships between built environment attributes and bicycle use (Ma et al., 2014; Zhao, 2014). However, it is possible that the relationships may not be linear: there may be ‘threshold’ values above or below which the gradient differs (e.g., J-shaped or inverse J-shaped relationships). Only a few previous studies have examined the shape of associations of environmental factors with cycling (Christiansen et al., 2016; Kerr et al., 2016; Van Dyck et al., 2012), and these studies have produced mixed findings. For example, a study using pooled data from Australia, Belgium, and the USA found linear associations between perceived environmental attributes with cycling. Similarly, an international study using pooled data from 10 countries also found linear associations between objectively measured built environment attributes and transportation-related cycling (Christiansen et al., 2016). However, a non-linear association between perceived residential density and cycling for transport was observed in another international study (Kerr et al., 2016). A study in Australia also found a non-linear association between dwelling density and cycling (Boulange et al., 2017). Examining the shape of the associations of built environment attributes with physical activity, and identifying threshold values (if they exist) can be informative for urban designers and policy-makers by providing the ‘amount’ of built environment attributes that are required to facilitate physical activity (Cerin et al., 2017; Koohsari et al., 2013). However, understanding the shape of associations between built environment attributes and physical activity depends to some extent on the range of environmental attributes that are present in study locations. This means that findings of multiple studies from different locations need to be accumulated to produce evidence on the shape of associations. This study seeks to add further insights into how built environment attributes are related to cycling, using data from a location where no previous study on this topic has been carried out (South East Queensland), with an additional environmental measure (Walk Score) rarely used in relation to cycling.
This study examined the strength and shape of associations of three objectively measured neighbourhood built environment attributes (residential density, availability of destinations, and street connectivity) with cycling for transport (utilitarian cycling to get to destinations). Since research has shown gender-specific factors related to bicycle use (Heesch et al., 2012), we examined the associations separately for men and for women, as well as for the whole sample.
Methods
Data source and study setting
Cross-sectional data from the 2009 South-East Queensland Travel Survey (SEQTS), administered by the Queensland Government Department of Transport and Main Roads, were used in this study. Queensland is one of the Australian states, located in the north east of the country. The SEQTS used a multistage random sampling design in which Census Collection Districts (CCD, a geographical unit comprising of about 250 households) were first selected, followed by recruitment of households from each CCD. The median size of the selected CCDs was 0.36 km2 (interquartile range: 0.61 km2). In the 2009 SEQTS, 10,335 households (4.4% of the household in the selected CCDs) participated in this study. The response rate was about 60%. Detailed methods of sampling, recruitment and data collection have been described elsewhere (Queensland Government, 2010). The total number of participants was 27,213. Of these, this study examined those who lived in a household with a bicycle and were aged between 18 and 64 years old who reported at least one trip on the survey day (N = 9146). Participants in households without a bicycle were excluded since there were no public bike share schemes in South East Queensland in 2009. The SEQTS was administered in accordance with ethical guidelines under Queensland state government statutes and regulations. Informed consent was obtained from participants.
Measures
Outcome: Cycling for transport
All members of participating households reported their travel behaviours using a 24-hour travel diary. For each trip, the start time, end time, origin, destination, purpose and mode of travel were reported. Participants were categorised into those who used a bicycle on the survey day (bicycle users) and those who did not.
Exposures: Residential density, availability of destinations, and street connectivity
Three built-environment attributes were examined in this study. These attributes were chosen because they have been identified as salient characteristics of the built environment relevant to choice of transport modes (Buehler, 2011; Cervero and Kockelman, 1997; Sugiyama et al., 2012). Although CCDs were used to identify potential participants, Statistical Area 1 (SA1), the smallest geographic unit for Census data in Australia at the time of analysis with an average population of approximately 400, were used for analyses. SA1s tend to be more consistent in population size and homogeneous in characteristics than CCD and to be consistent with the classification of other data (Australian Bureau of Statistics, 2011a). In this study, participants lived in 1112 SA1s. The median size of SA1s in this study was 0.21 km2 (interquartile range: 0.23 km2). Residential density (gross) was calculated as the number of private dwellings per hectare for each SA1 (Australian Bureau of Statistics, 2011a). Availability of destinations was measured using Walk Score collected in 2010 (www.walkscore.com). Walk Score is a web-based, publicly available tool that, at the time of data collection, scored locations based on the proximity to various local destinations as the crow flies. Walk Score, which ranges from 0 to 100 (greater scores indicate higher walkability), was determined for each SA1, using the score obtained for the centroid of each SA1. Street connectivity was operationalised using a space syntax measure of street integration (Hillier and Hanson, 1984; Hillier et al., 1987). Street integration shows how topologically close a street segment is to all other segments within a specified street network (Hillier, 2009; Koohsari et al., 2014). One makes fewer turns to reach a more integrated segment, which is more accessible compared with less-integrated segments (Baran et al., 2008; Hillier, 2009; Hillier et al., 1993; Kostakos, 2010; Peponis et al., 1997). Street integration for each street segment was calculated using Axwoman (Jiang, 2012) and University College London DepthMap (Turner, 2004) software within a 2 km network distance from its centre. The integration score for an SA1 was the mean of integration scores of all street segments within the SA1 boundary. A higher integration score means better street connectivity. Each built environment attribute was treated continuously (deciles) and categorically (quintiles) to assess the strength and shape of associations with cycling for transport.
Covariates: Socio-demographic variables
Participants reported the following socio-demographic characteristics in the SEQTS: age, gender, employment, household structure, household income and car ownership. The Index of Relative Socio-Economic Disadvantage (IRSD) at the SA1 level was used as a measure of area-level socio-economic status (SES) (Australian Bureau of Statistics, 2008). The IRSD incorporates area-level socio-economic indicators such as income, education, and employment, with lower scores pertaining to higher levels of disadvantage.
Analysis
Multilevel logistic regression analyses were used to examine associations of residential density, Walk Score, and street integration (continuously or categorically) with any bicycle use. As discussed above, continuous and categorical environmental attributes were used to examine the strength and shape of associations, respectively. Multilevel modelling is needed to account for clustering of participants who were recruited from pre-selected areas (Merlo et al., 2005). This analytical approach is commonly used in studies on environmental correlates of cycling, where participants may be clustered by area (Boulange et al., 2017; Florindo et al., 2018; Heesch et al., 2015; Van Cauwenberg et al., 2012; Winters et al., 2010). The regression models accounted for clustering of participants at the SA1 level, and adjusted for socio-demographic variables (age, gender, employment, household structure, household income, car ownership and area-level socio-economic status). Each built environment attribute was examined separately (not mutually adjusted) to identify the independent contribution of each built environment attribute. Regression analyses stratified by gender were also carried out to identify gender differences in the associations. Analyses were conducted using Stata 14.0 (Stata Corp, College Station, TX), and the level of significance was set at p < 0.05.
Results
Table 1 shows the characteristics of the study sample. About 2.9% of participants reported any bicycle use on the survey day (about 2% for women, 4% for men). The mean (standard deviation) residential density, Walk Score, and street integration of the participating SA1s were 8.3 (6.0) dwellings/ha, 47.1 (21.5) and 179.7 (113.5), respectively. Pearson’s correlation coefficients were 0.54 between residential density and Walk Score, 0.46 between residential density and street integration, and 0.66 between Walk Score and street integration at the SA1 level (all at p < 0.01).
Characteristics of study participants (n = 9146).
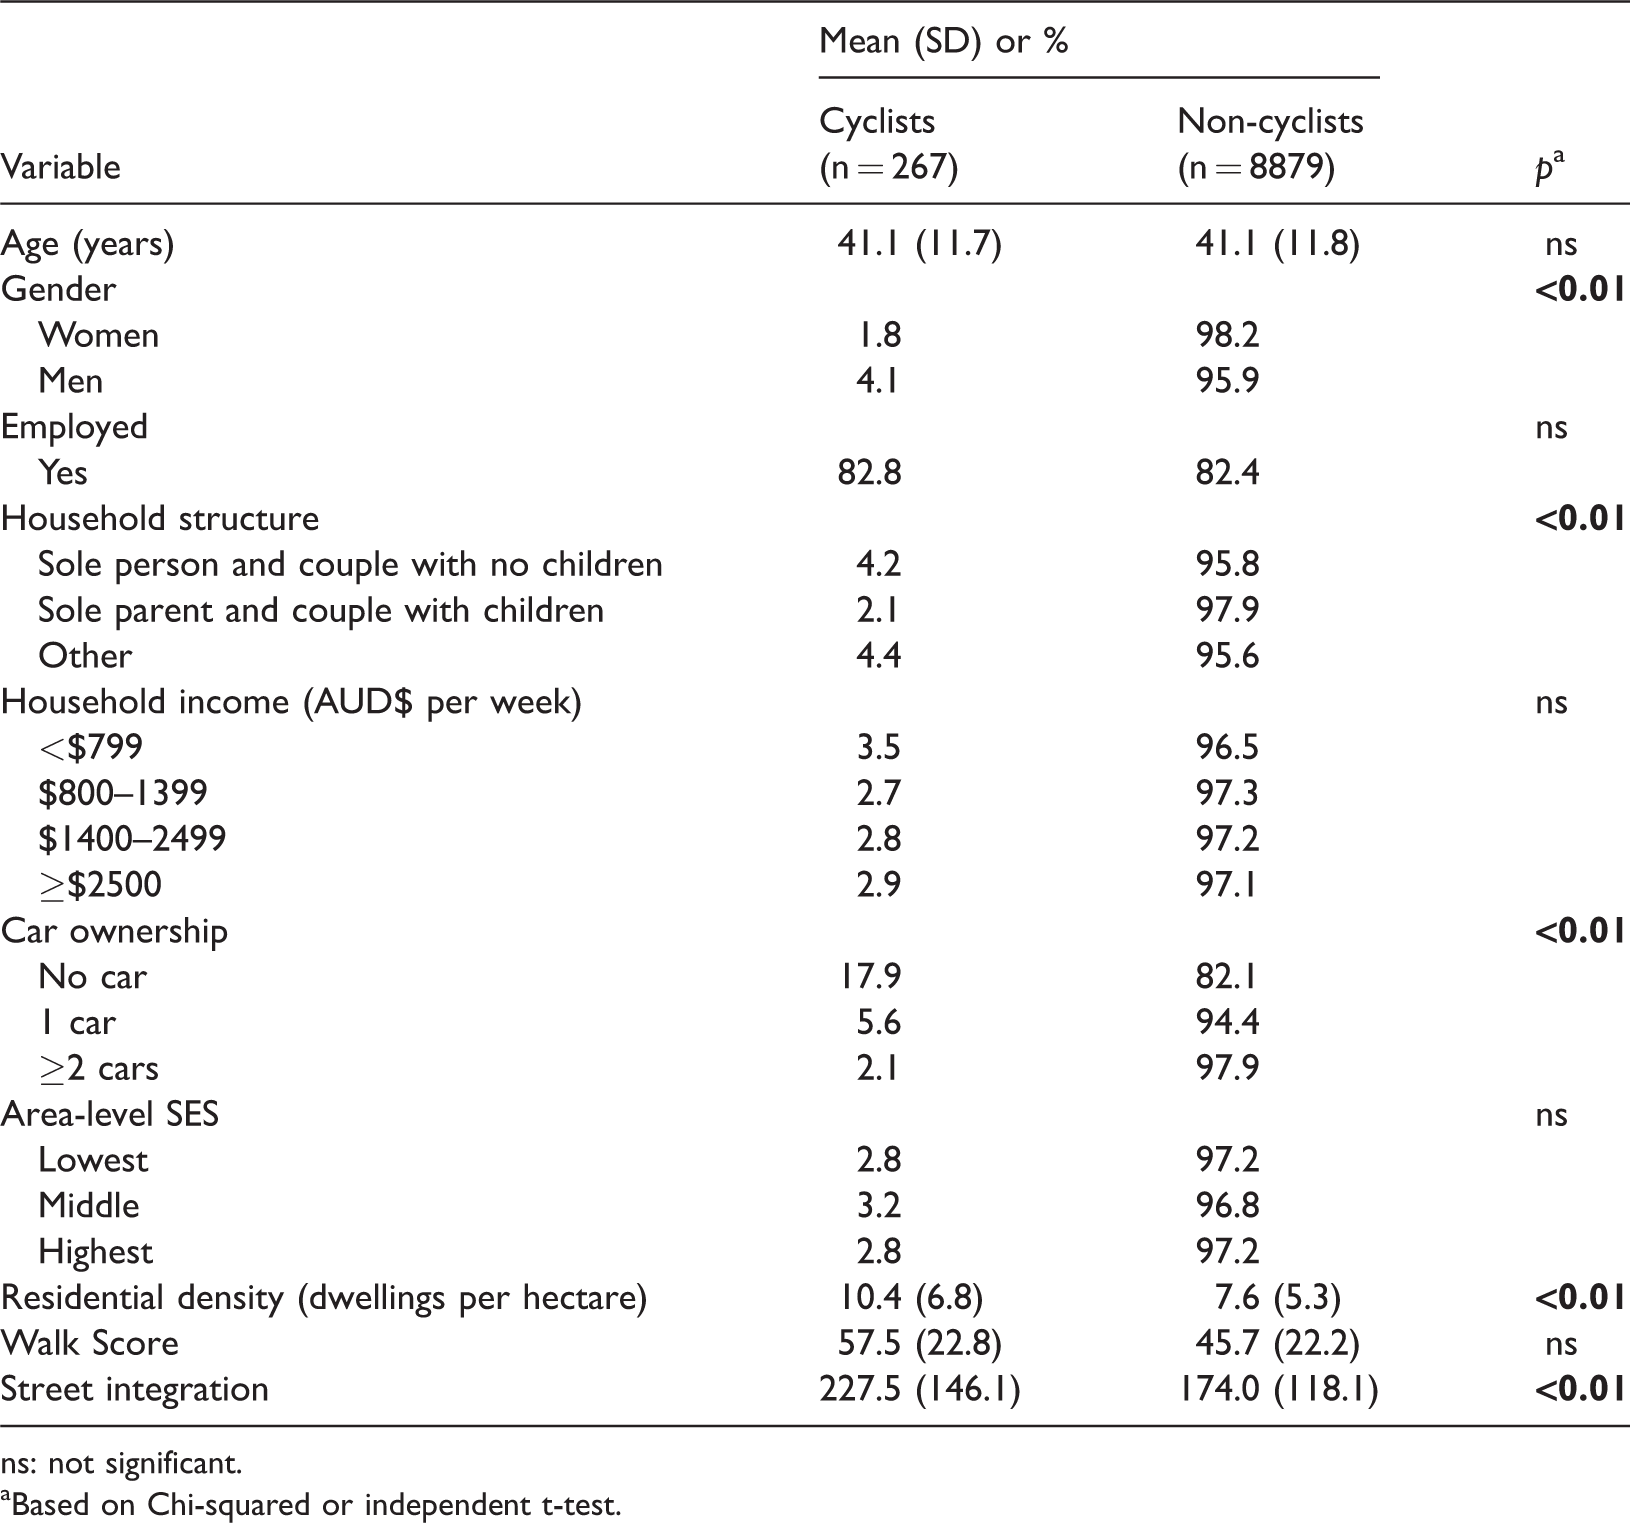
ns: not significant.
aBased on Chi-squared or independent t-test.
Table 2 shows the results of regression analyses where continuous built environment attributes were used to examine the strength of associations. There were significant associations of residential density, Walk Score, and street integration with participants’ bicycle use. In the adjusted models, each one-decile increment in residential density, Walk Score, and street integration was associated with 13%, 16%, and 10% higher odds of bicycle use, respectively. These associations were significant for both men and women, except for residential density, which was associated with cycling only for men. Table 3 shows the results of regression analysis in which categorical built environment measures were used to examine the shape of associations. The reference category was set at the middle quintile in order to assess how the lower and higher quintiles differ from the middle category. This approach using the middle group as the basis for comparison is likely to produce more conservative estimates, in comparison to the approach where the lowest or highest quintile is set as the reference. The relationships between each built environment attribute and cycling appeared to be non-linear. For residential density and street integration, associations with cycling for transport were significant only for the top quintile. For Walk Score, significantly higher odds ratios were observed for the top two quintiles. None of the lower quintiles in any built environment attributes were associated with cycling. The table also shows higher proportions of cyclists in the highest quintile (5–6%), compared to lower proportion in the lower three quintiles (around 2%). Men and women differed in the patterns of associations for residential density and Walk Score. Higher residential density was associated with men’s cycling but not with women’s cycling. The fourth quintile in Walk Score was significantly associated with higher odds of cycling only for men.
Odds ratios (95%CI) of any cycling according to residential density, Walk Score, and street integration (decile).
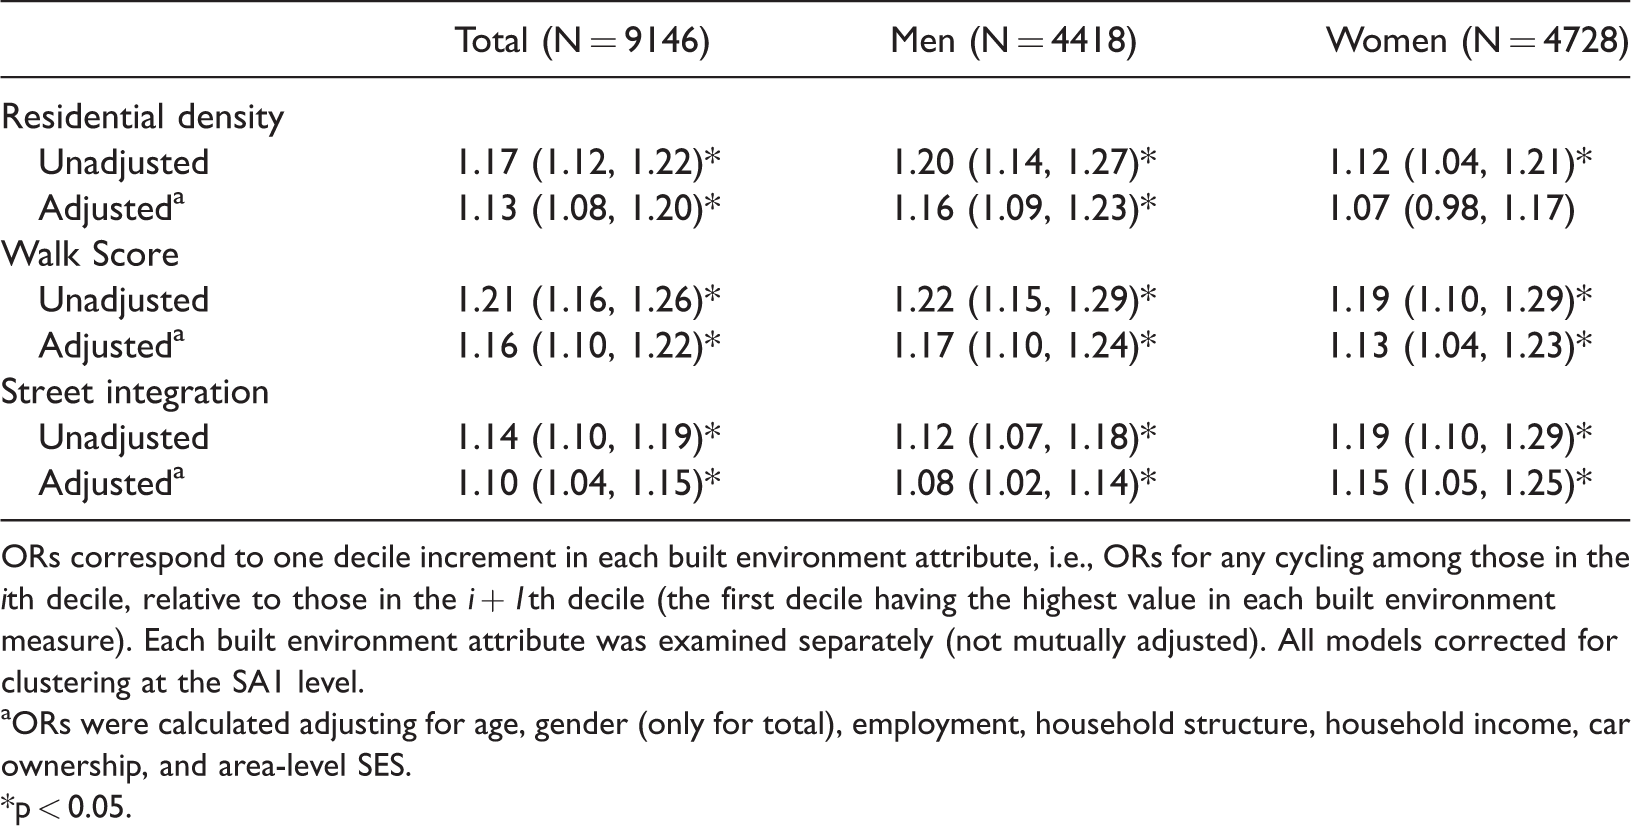
ORs correspond to one decile increment in each built environment attribute, i.e., ORs for any cycling among those in the ith decile, relative to those in the i + 1th decile (the first decile having the highest value in each built environment measure). Each built environment attribute was examined separately (not mutually adjusted). All models corrected for clustering at the SA1 level.
aORs were calculated adjusting for age, gender (only for total), employment, household structure, household income, car ownership, and area-level SES.
*p < 0.05.
Odds ratios (95%CI) of any cycling according to residential density, Walk Score, and street integration (quintile).
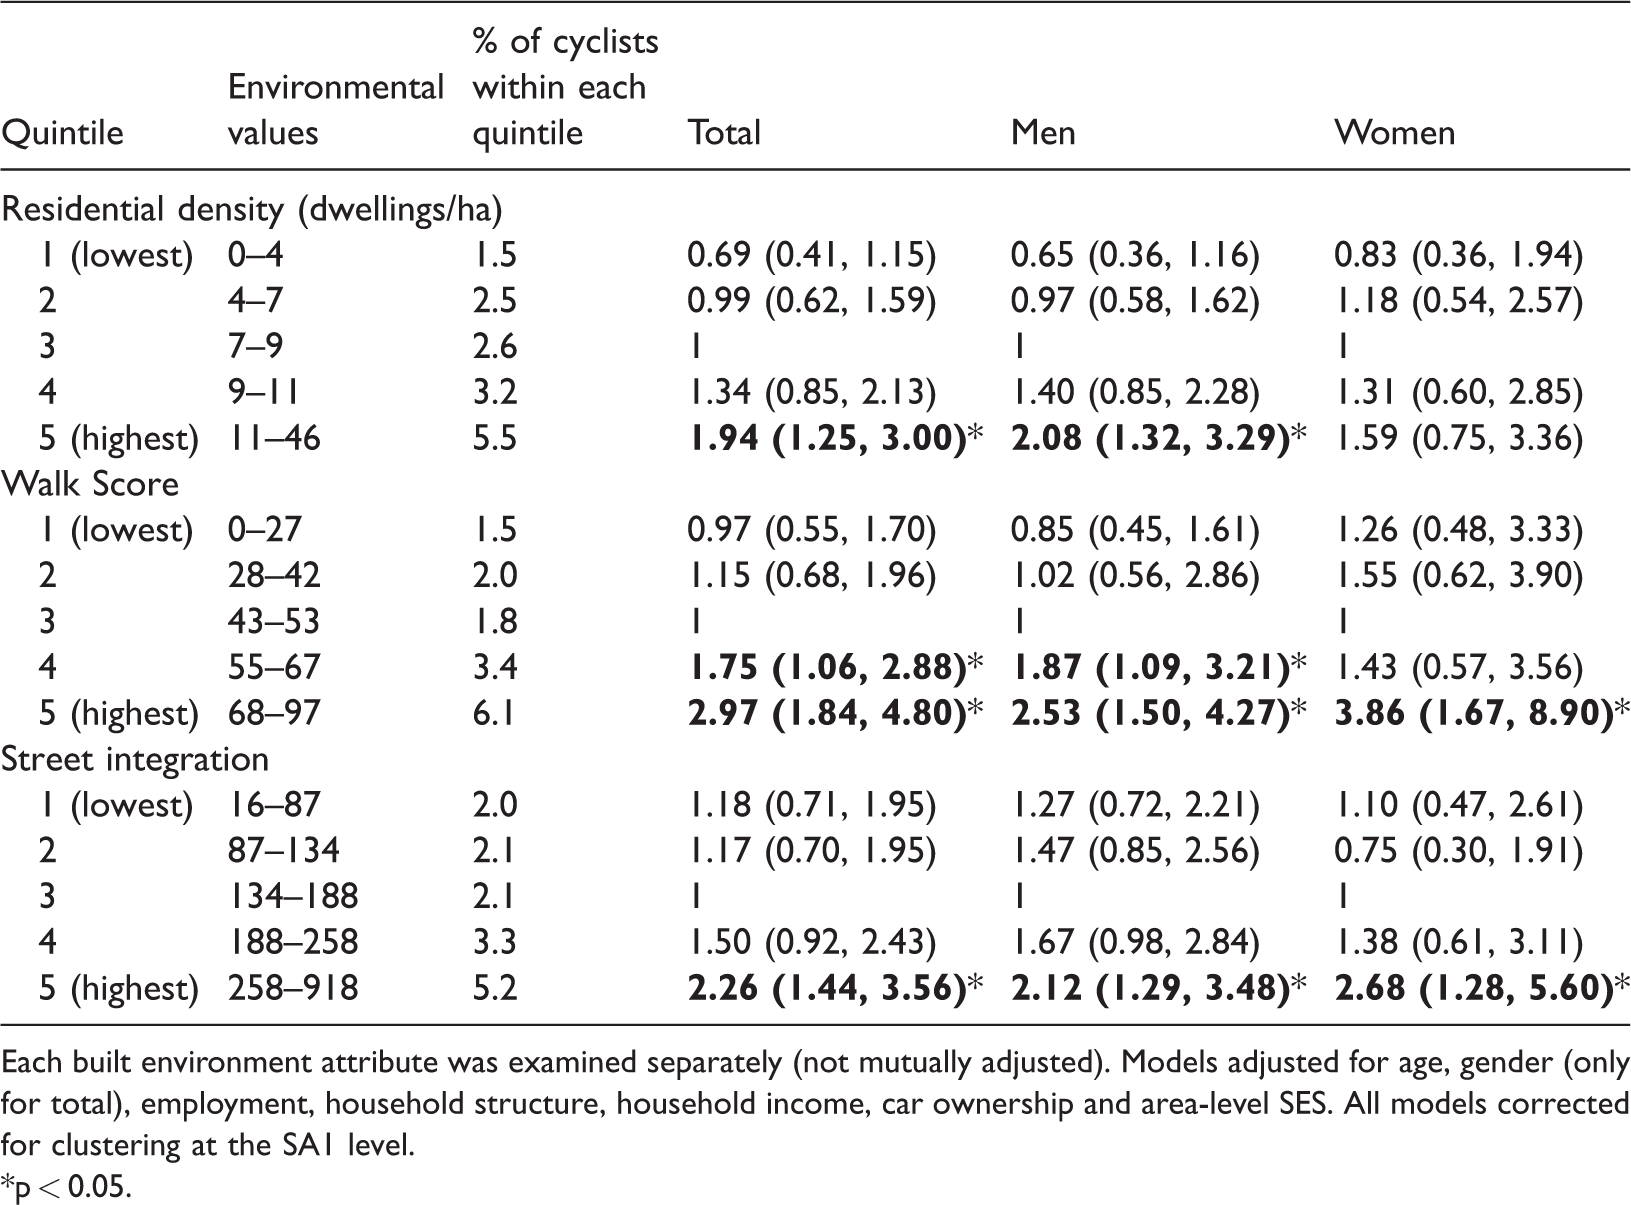
Each built environment attribute was examined separately (not mutually adjusted). Models adjusted for age, gender (only for total), employment, household structure, household income, car ownership and area-level SES. All models corrected for clustering at the SA1 level.
*p < 0.05.
Discussion
Using data from a large-scale travel survey, this study examined the strength and shape of the associations of neighbourhood built environment attributes with bicycle use by Australian adults. Only 3% of participants reported any cycling on the survey day. This is similar with the findings of another Australian travel survey conducted in Melbourne, where 3% of participants reported any cycling in their neighbourhoods (Boulange et al., 2017). Another travel survey conducted in California also found less than 3% of participants reported any cycling on the survey day (Salon, 2016). Our findings confirm the low prevalence of cycling for transport in the Australian context.
Regression analyses using the continuous measures found the three built environment attributes examined (residential density, availability of destinations, and street connectivity) to be linearly associated with cycling. This is consistent with some previous studies that showed positive linear associations between these three attributes with cycling for transport (Christiansen et al., 2016; Nielsen et al., 2013). For example, a study conducted in Denmark found street connectivity to be positively associated with cycling (Nielsen et al., 2013). Another study using pooled data from 10 countries found positive associations between residential density, land use mix, and intersection density with transportation-related cycling (Christiansen et al., 2016). However, a recent study conducted in Australia did not find street connectivity to be associated with any cycling (Boulange et al., 2017). Since the Australian study examined only linear associations, it is unknown whether a non-linear relationship may exist between street connectivity and cycling.
Our study suggests that the associations between built environment attributes and cycling may not be linear: relative to the middle quintile, significant odds ratios of any cycling were found only for the higher quintiles but not for the lower quintiles in residential density, access to local destinations, and street connectivity. This suggests that low to medium levels of these built environment attributes may be equally unsupportive of bicycle use. Our results regarding the shape of associations are in contrast with a previous study, which did not find evidence of curvilinear associations between objectively measured environmental attributes and cycling for transport (Christiansen et al., 2016). This contrast may be due to the difference in the range of environmental measures between the studies. In the study by Christiansen et al. (2016), where data were collected from 10 diverse countries, the highest residential density was 350 dwellings/ha, while it was 46 dwellings/ha in our study. It is possible that this study identified non-linear relationships because it examined the lower end of spectrum in built environment attributes.
Our findings suggest that there may be a threshold in built environment attributes above which cycling can be facilitated. In the case of residential density, areas with 11 dwellings/ha or higher may facilitate cycling. This figure is higher than the average residential density within the Queensland state capital city of Brisbane (6 dwellings/ha), which is within South-East Queensland geographical area. But, this is equivalent to the current recommendation for suburban development to promote active living (15 dwellings/ha in net density) (Arundel et al., 2017). For Walk Score, residents living in areas with the scores above 55 (equivalent to the lower end of ‘somewhat walkable’) were more likely to use a bicycle. Further research from different locations (preferably areas with higher density) is necessary to test the applicability of these urban design threshold values in different settings. It can be argued from these findings that improvements in residential density and the number of local destinations in South-East Queensland may encourage residents to cycle for transport. Such improvements may be achieved through converting ‘grey’ or ‘brown’ fields into medium-density mixed-use developments. Improving street connectivity may not be easy, as this means adding roads in existing neighbourhoods. However, it has been shown that perceived connectivity of bike paths is associated with cycling (Titze et al., 2008). It is possible that providing and connecting designated bike lanes may help residents to use bicycle for transport.
Our findings also suggest that the effects of neighbourhood attributes on cycling for transport may be slightly different between women and men. Residential density was associated with cycling only among men. In men, cycling was associated with the top two quintiles of Walk Score, while it was only for the top quintile in women. It is possible that more supportive built environments (e.g., higher residential density, more destinations) may be needed to encourage women to engage in cycling. A previous study examining gender differences in environmental factors related to cycling, which shows that women prefer off-road cycle paths and using them more often than men (Heesch et al., 2012), appears to support this argument. It can be argued that built environments supporting women’s bicycle use can also facilitate cycling by other subgroups such as older adults. Considering the low proportion of women who cycle (less than 2% in comparison to 4% among men), further research is needed to better understand multi-level factors that encourage women to take up cycling.
The strengths of our study include a large sample size and the use of a detailed travel behaviour data. This study also included a diversity of settings from rural to urban areas. We also had some limitations. We used SA1s to calculate the built environment attributes. Similar to previous studies, our study is subject to the modifiable areal unit problem (MAUP), where the definition of a unit area, in which data were aggregated, may impact observed associations (Openshaw, 1984). Research using buffer areas around individual residential address in calculating built environment attributes is needed to support the findings of this study, and to partially address the MAUP. Bicycle use was measured using a 24-hour travel diary, which may have missed those who used bicycle occasionally. The study may have underestimated bicycle users due to this short time frame. Our results may be subject to misclassification bias, as we used the quintile of built environment attributes to examine the shape of associations. This study did not consider other possibly relevant neighbourhood built environment attributes such as cycling infrastructure, traffic, the presence of slope, and safety from crime, which may influence cycling behaviour. In particular, traffic can be a confounder in the relationships examined. For instance, areas with more retail destinations may have heavier traffic, which could discourage cycling. Future studies can examine how traffic volume and speed are related to bicycle use.
Conclusions
This study examined the strength and shape of associations of multiple built environment attributes with cycling for transport in Australian urban areas. With regard to the strength of associations, we found that the odds of cycling for transport was 10–15% higher for each additional decile increment in residential density, Walk Score, and street integration, suggesting potentially large differences in bicycle use between the least and most bicycle friendly neighbourhoods. However, in terms of the shape of associations our results suggest that the relationships between environmental measures and cycling may not be linear. In the context of South-East Queensland, medium-level density, access to destinations, and street connectivity may not be high enough to facilitate bicycle use, particularly for women. In other words, increasing these built environment attributes from low to medium levels may not contribute to enhancing cycling. Further studies are needed to investigate urban design threshold values above which cycling can be promoted. Identifying such urban design thresholds values will help locate neighbourhoods where environmental initiatives may promote residents’ cycling. Research is also needed to investigate the effectiveness of building cycling infrastructure in neighbourhoods that differ in residential density, access to destinations, and street connectivity.
Footnotes
Declaration of conflicting interests
The author(s) declared no potential conflicts of interest with respect to the research, authorship, and/or publication of this article.
Funding
The author(s) disclosed receipt of the following financial support for the research, authorship, and/or publication of this article: MJK was supported by a JSPS Postdoctoral Fellowship for Research in Japan (#17716) from the Japan Society for the Promotion of Science. KO is supported by the MEXT-Supported Program for the Strategic Research Foundation at Private Universities, 2015–2019 the Japan Ministry of Education, Culture, Sports, Science and Technology (S1511017). AS was supported by Grant-in-Aid for Scientific Research (C:No. 15K01647) from Japan Society for the Promotion of Science. TH was supported by the JSPS KAKENHI (#JP17H00947). NO was supported by a National Health and Medical Research Council of Australia (NHMRC) Centre of Research Excellence grant (#1057608) and a Senior Principal Research Fellowship (#1118225) and the Victorian government's operational infrastructure fund.