
Abstract
This study aims to clarify the impact mechanisms of urban polycentric spatial structures on carbon emissions within micro-planning frameworks. This paper presents new insights into the implementation of carbon-neutrality strategies from two perspectives of urban structure spatial within micro-granular urban subdistricts: “central nodes” and “polycentricity.” Utilizing spatial data from night-time lights, Open-source Data Inventory for Anthropogenic CO2 (ODIAC), and China Land Cover Dataset (CLCD), this study adopts a dual perspective of a “dispersed structure layout—concentrated development” model. Initially, it employs a spatial autocorrelation model to depict the urban internal spatial structure and variations in spatial carbon emissions from the perspective of spatial heterogeneity. Subsequently, the spatial Durbin model is used to empirically examine the effects of the evolution of urban spatial multicentric structures on carbon emissions. The findings indicate that from the perspective of polycentricity, both functional polycentricity with multiple high-economic impact centers and the dispersion of urban construction land under morphological polycentricity lead to increased carbon emissions. From the perspective of central nodes, the polycentric development model, characterized by low centralization and high concentration, is more conducive to carbon neutrality. Last, compared to the monocentric model of low centralization and high concentration in urban areas, the “lightweight” dispersed polycentric model in ecological regions helps to minimize urban expansion, thereby mitigating the impact on carbon emissions.
Keywords
Introduction
The need to curb global carbon emissions is the foundation of international environmental policy, the Paris Agreement framework aimed at achieving a sustainable and low-carbon future (Bhowmik et al., 2020; Kona et al., 2021). This global context recognizes that cities serve as pivotal sources of energy consumption and carbon emissions. Consequently, the strategic planning of urban spatial structure assumes a crucial role in comprehending the patterns and shifts in carbon emissions (Jung et al., 2022; Lee and Lee, 2014; Zhu et al., 2022). An increasing number of countries are incorporating polycentric development patterns into their sustainable urban-planning frameworks to achieve emission-reduction targets (Halbert, 2006; Halbert et al., 2006; Vasanen, 2013). China has pledged to achieve carbon neutrality by 2060, prioritizing low-carbon urban planning in its climate-action strategy (Li et al., 2018). The development of polycentric models is also integrated into China’s urban planning to promote the decentralization of economic activities in megacities and rationalization of transportation, with the objective of achieving lower carbon neutrality in cities (Chen et al., 2021; Wang, 2021).
Polycentric urban development theory, which aims to optimize spatial structures and achieve balanced regional development, operates across various spatial scales. Conceptually, the polycentric framework originates from Central Place Theory (Preston, 1971), which emphasizes the hierarchical structure and interactions between central locations. Building on this, research has evolved into two primary dimensions of polycentricity: morphological polycentricity (MP) and functional polycentricity (FP). For example, Qiang et al. (2024) found a positive correlation between the compactness of urban centers and carbon emissions. Additionally, Wu et al. (2023) directly compared the impacts of MP and FP on carbon emissions across cities, revealing significant differences in their effects on carbon emissions. However, the interaction between central nodes and polycentric structures, and how this interaction affects carbon emissions, remains insufficiently understood. Polycentric planning strategies focus on the spatial organization within metropolitan areas, characterized by one or more overlapping labor market areas. This involves optimizing the local urban structure around central nodes to enhance compactness, and vertical transportation efficiency, ultimately aiming to reduce carbon emissions. For instance, Zhu et al. (2022) pointed out that the more dispersed the population within a city and the higher the degree of polycentricity, the lower the carbon-emission levels—an effect that is moderated by the level of economic development. However, most current research emphasizes the morphological aspects of population and land-use distribution, with limited focus on FP, especially the role of network connectivity and economic interactions between urban centers.
To understand how polycentric structures contribute to carbon reduction, it is essential to consider the effects at different spatial scales. Drawing from the ESPON3.1 (2003) classification, spatial scales can be categorized into three levels: micro, meso, and macro. While significant progress has been made at the macro and meso scales, demonstrating that polycentric development strategies can effectively reduce carbon emissions (Jung et al., 2022; Zhu et al., 2022), their applicability at the micro-scale remains underexplored due to data limitations. In recent years, a growing body of literature has focused on the relationship between urban spatial morphology and carbon emissions at the micro-scale, such as the built environment (Wang et al., 2024), land use types (Zheng et al., 2022), and population (Mohajeri et al., 2015). These studies provide the technical and methodological foundations needed to examine the effects of polycentricity on carbon emissions at this level. For example, while Lian et al. (2023) employed Rhino and Grasshopper to assess the carbon emission intensity levels of residential blocks and to quantify the relationship between block morphology parameters and building carbon emissions. Dong et al. (2023) measured urban form indicators such as building and street extension, shape complexity, spatial compactness, and irregularity, and found that adjacency ratio, meshedness, and width significantly influence carbon emissions.
Previous studies have made considerable advancements in estimating carbon emissions in urban microstructures. However, several unresolved issues remain: (1) it is still unclear whether strategies promoting emission reduction through polycentric structures are effective at the micro-scale; (2) there is a need to incorporate discussions on the characteristics of central nodes within the relationship between polycentric structures and carbon emissions in spatial structures; and (3) in the measurement of polycentric spatial structures, beyond the quantification of morphological parameters, the impact of functional network connections must also be considered. Addressing the limitations of existing research, this study integrates the dual dimensions, focusing on central nodes and polycentric network structures, to explore how polycentric urban structures at the micro-scale influence carbon emissions. Through empirical analysis, the study will verify the applicability of polycentric strategies at the macro and meso scales to the micro-scale, particularly how the optimization of central nodes and network structures can achieve carbon reduction within cities. The network connectivity of polycentric structures encompasses not only static spatial layouts (MP) but also dynamic economic forces (FP).
Compared to traditional carbon-emission data-collection methods, this study utilizes satellite-observation technologies to validate and supplement bottom-up data-collection methods. This approach not only enhances the accuracy and objectivity of data collection but also provides more granular observational data (Pan et al., 2021). Therefore, this study uses Open-source Data Inventory for Anthropogenic CO2 (ODIAC) for carbon output and combines night-time light (NTL) data and China Land Cover Dataset (CLCD) to construct multicentricity indicators. Specifically, this study aims to explore public policies that reduce carbon emissions by assessing the agglomeration economy and compactness of land use within the region. This study not only emphasizes the significance of fine-grained urban planning in the context of carbon neutrality, but it also provides empirical support for spatial structure planning at the meso-level.
Literature review
Urban spatial structure and carbon emissions
Research on urban spatial structure and its evolution, particularly in terms of carbon emissions, remains a central topic in contemporary urban-planning and sustainable development studies. From the mid-19th century, when Von Thünen introduced the agricultural land-use model, marking the theoretical inception (Sinclair, 1967), to Alonso’s monocentric model of urban land use in the 1960s (Alonso, 1964) and the rise of polycentric urban theories in the early 21st century, academic exploration into the environmental impacts of urban structures has continually deepened. Brezzi and Veneri (2015) pointed out the borrowed size effect of polycentric urban structures, where small and medium-sized cities within a polycentric urban network can share the agglomeration economies of nearby large cities while avoiding the congestion costs associated with over-concentration. However, Gaigné et al. (2012) pointed out that improving the economic efficiency of central cities and better integrating smaller cities can help reduce unregulated urban sprawl, thereby promoting environmental protection and reducing carbon emissions. Therefore, adjustments to urban spatial structures influence carbon emissions not only by enhancing economic efficiency but also by facilitating changes in energy consumption (Glaeser and Kahn, 2010; Parshall et al., 2010) and transportation patterns (Wang et al., 2017).
A key turning point has been the growing focus on polycentricity. While many studies have not directly established a correlation between polycentric spatial structure and carbon emissions, they have elucidated that polycentric structures can affect carbon emissions through environmentally related factors such as building-energy efficiency (Diener and Ryan, 2009), urban heat island effects (Han et al., 2022), and transportation factors (Luo et al., 2011). One of the primary objectives of polycentric urban structures is to maximize energy efficiency by promoting market integration. Market integration can significantly enhance energy efficiency, thereby reducing carbon dioxide emissions (Qin et al., 2023). More recently, Shi et al. (2023) directly explained the emissions-reduction effects of polycentricity structures through urban spatial models. The discussion surrounding MP and FP has been steadily increasing. MP mitigates carbon emissions by decentralizing economic activities and reducing urban congestion (Chen et al., 2021). However, the effectiveness of MP in reducing carbon emissions largely depends on the connectivity between central nodes. If the integration of function between cities is insufficient, it may lead to an increase in intercity travel demand, which in turn increases carbon emissions (Dong et al., 2019; Jung et al., 2022). In contrast, FP plays a more significant role in reducing carbon emissions by enhancing the economic, social, and infrastructural linkages between urban centers, thereby improving transportation efficiency and resource utilization (Wu et al., 2023; Zheng et al., 2022).
Polycentric development, with its significant spatial implications, embodies complexity due to the contradictory outcomes of implementing polycentric strategies across various scales. Geographically, polycentric strategies can be planned in combinations of the macro-, meso-, and micro-scales. At the macro-scale, the goal is to strengthen the coherence of large transnational regions; at the meso-scale, polycentric strategies focus on achieving integrated spatial regions, primarily centered on major cities or “gateway” hubs. Here, the improvement of transportation infrastructure plays a crucial role in meso-level planning. Current research mostly focuses on the relationship between meso-scale urban-center characteristics and carbon emissions. Ou et al. (2013), based on an analysis of four megacities in China, found that urban area was positively correlated with overall carbon-emission levels, suggesting that China’s urban development pattern should transition from a dispersed, monocentric, giant model to a relatively compact, polycentric model; however, Chen et al. (2011) found that in cities where it was overly compact, city size was positively correlated with energy consumption.
Recently, with advances in remote sensing technology, the use of NTL imagery for estimating carbon emissions offers advantages in objectivity and stability, somewhat compensating for the difficulties in obtaining energy-consumption statistics (Wang et al., 2024). Consequently, researchers have focused on more refined carbon-neutrality solutions in areas such as industrial (Fang et al., 2022), transportation (Jung et al., 2022), and building (Wang et al., 2023) carbon emissions. Analyzing the spatial effects of carbon emissions at varying scales helps to reveal regional heterogeneities in carbon emissions. Existing research on carbon-emission estimations, which is typically conducted at the macro- or the meso-scale such as urban agglomerations, provinces, and cities, consistently concludes that polycentricity facilitates the dispersion of economic activities, production, and residential areas, thereby mitigating the concentration of carbon emissions (Chen et al., 2021; Wu et al., 2023). However, at micro-levels such as counties or blocks, increased compactness and population density often yield positive externalities by promoting functional agglomeration, reducing commuting distances, and enhancing the density of residential and economic activities, thereby improving energy efficiency and reducing average carbon-emission levels (Li et al., 2019a; Zhang et al., 2017).
Urban spatial structure
Central node: centralization and concentration
As population and economic activities concentrate, urban density typically shifts from low to high. However, decentralization occurs when the disadvantages of agglomeration (diseconomies) begin to outweigh its advantages (economies) (Richardson, 1995). As this decentralization process unfolds, population and industrial activities tend to re-concentrate in subcenters, resulting in a polycentric spatial structure. Anas et al. (1998) describe how economic activity can be either concentrated or decentralized at both the metropolitan and local levels. Building on this framework, Lee (2007) discusses two critical dimensions of urban spatial structure: centralization and concentration. Centralization refers to the extent to which employment is concentrated in a central business district (CBD), while concentration measures the degree to which employment activity is proportionately concentrated or dispersed across a limited number of locations. Meijers and Burger (2010) further refine this concept by distinguishing between the concentration-dispersion and polycentric-monocentric dimensions of urban spatial structure. The concentration-dispersion dimension refers to the degree of population and employment dispersion in non-central areas, whereas the polycentric-monocentric dimension reflects the uniformity of population and employment distribution between the main center and subcenters (Li et al., 2019b). Lee and Lee’s (2014) emphasis on the polycentric highlights the extent to which the economic, commercial, and recreational functions of a city center are shared between traditional CBD and subcenters.
In contrast to studies that focus on the concentration-dispersion dimension of population distribution, this study conceptualizes urban spatial centrality in terms of two key dimensions: centralization, which reflects economic activities as a function of their proximity to the main center, and concentration, which reflects the uneven aggregation of economic activities across the main center. Drawing from the work of Han et al. (2020) and Han et al. (2022), we categorize four patterns of urban spatial structure (see Figure 1): (1) high centralization and high concentration, where the economic activities are highly concentrated in the main center; (2) high centralization and low concentration, where economic activities are dispersed, but the economic activities strong concentrated in the main center; (3) low centralization and low concentration, where economic activities are distributed diffusely, with economic activities in the main center also dispersed; and (4) low centralization and high concentration, where economic activities are concentrated in multiple subcenters, with the main center’s economic activities being decentralized.. The spatial pattern of low centralization and high concentration tends to represent ideal polycentricity, where the centralization of activities in the CBD is diminished, and several subcenters emerge to distribute economic and residential activities more evenly, resulting in high concentration within each center.
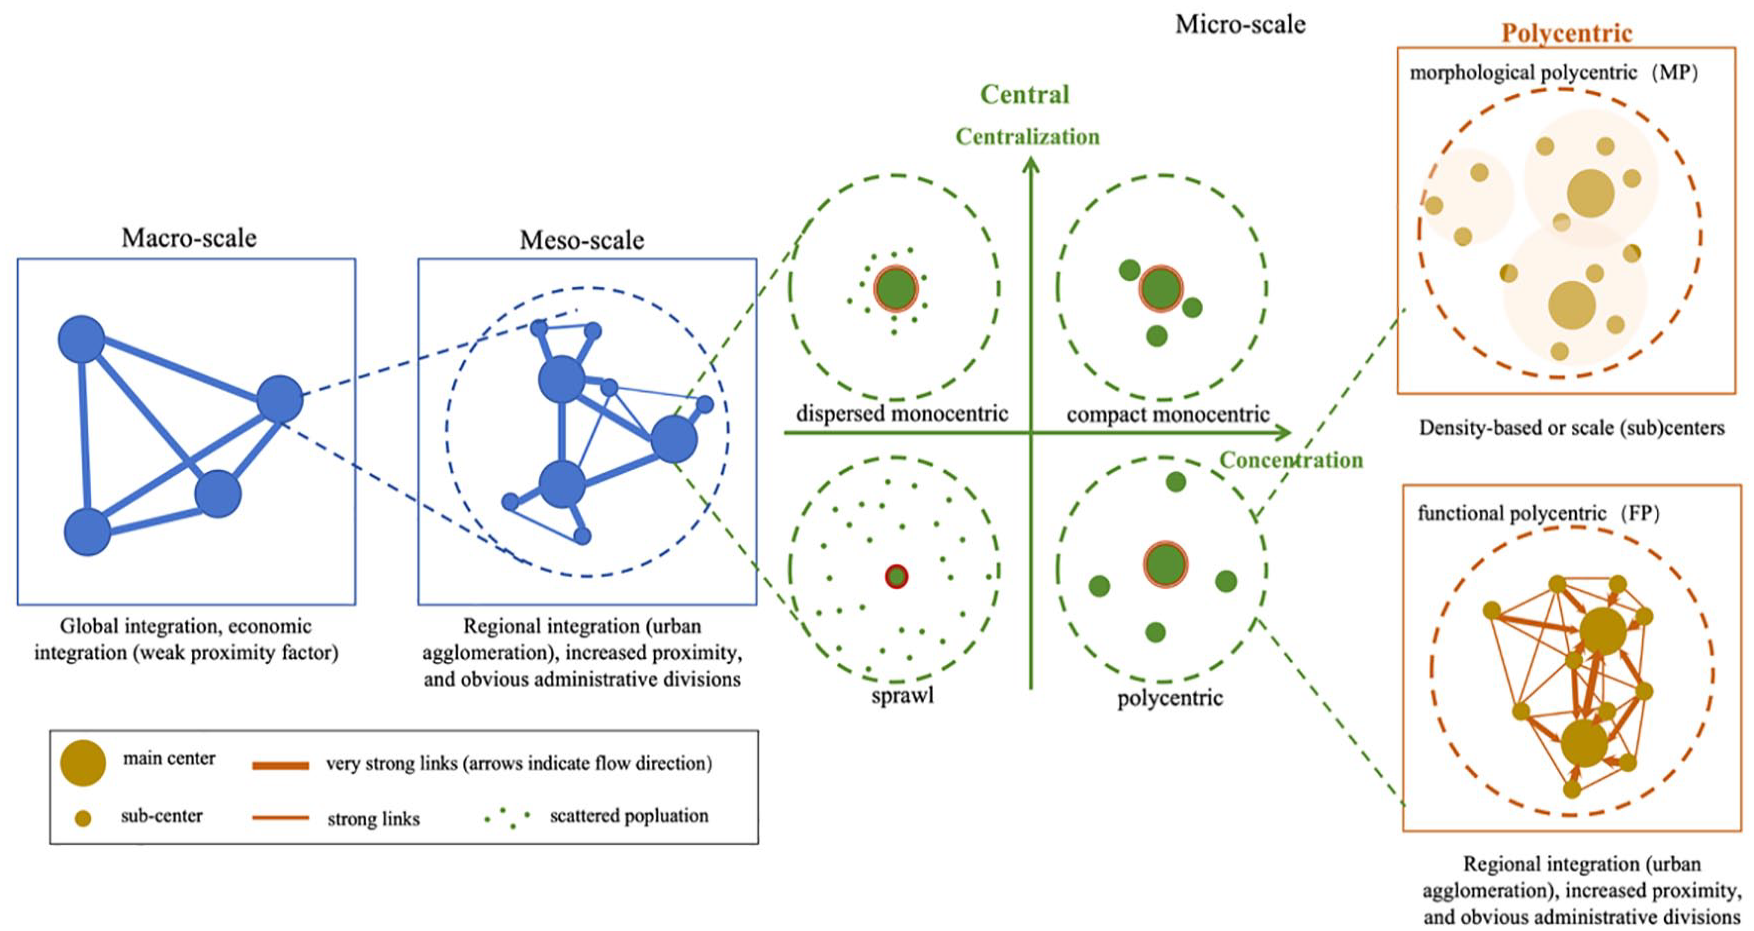
Patterns of polycentric structure at different scales; figure redrawn from Li et al. (2022) and Zonneveld et al. (2006).
The polycentric-monocentric dimension, as previously mentioned, focuses on the structural measurement of employment and population within spatial morphological (Meijers and Burger, 2010). As the theory of polycentricity continues to evolve, the concept has taken on different meanings from different analytical perspectives. Recent debates have centered on MP and FP. Therefore, the subsequent discussion in this study will compare MP and FP to advance the understanding of spatial structure.
Polycentric: MP and FP
Infrastructure exhibits a certain degree of long-term stability and inertia. These morphological patterns evolve over time, influenced by the complex interplay between location choices and migration dynamics. The economic vitality and attractiveness of urban areas largely depend on their degree of specialization, economic potential, and the development of clusters. The enhancement of functionality not only benefits cities’ competitive advantage and economic impact but also facilitates the creation of diverse and resilient urban networks (Burger and Meijers, 2012). These developmental modes are often referred to as MP (Yu et al., 2022) and FP (Vasanen, 2012). MP examines various urban attributes, including employment size, land development, and population, and emphasizes the balance of physical elements across different geographic spaces within a region (Li and Derudder, 2022). This approach is primarily concerned with spatial distribution patterns. However, recent shifts in spatial network theory (Barthélemy, 2011) have highlighted the significance of positionality in the movement of people, information, and economic activities across different spaces. Consequently, FP, also referred to as relational polycentricity, now encompasses the degree of functional linkages or flow relationships between units within an organization (Bartosiewicz and Marcińczak, 2020). Unlike MP, which focuses primarily on the relative coherence of physical characteristics, FP underscores the functional connectivity that links cities through socioeconomic ties (Wu et al., 2023).
Centrality is traditionally determined based on the surplus of importance within an urban system, often overlooking the influence generated by connections to external centers (Burger and Meijers, 2012). However, contemporary urban systems do not function in isolation; in today’s interconnected economy, systems inevitably interact to some degree. While centrality reflects the absolute and relative importance of centers and subcenters within a city, both MP and FP aim to balance this importance (Burger and Meijers, 2012). At the MP level, there is a relative equilibrium in absolute importance between centers and subcenters. At the FP level, there is no significant bias in the relationships between the main center and other subcenters; instead, there is a relative balance in terms of their relative importance (see Figure 1). Consequently, this study examines the impact on carbon emissions by analyzing the dimensions of urban centers and polycentricity within the spatial structure.
Methodology
Figure 2 illustrates this study’s research framework. Initially, we measure indicators influencing carbon emissions based on two aspects of urban polycentric structures: dispersion and centrality. Subsequently, spatial autocorrelation models are utilized to determine the spatial dependencies of urban carbon emissions. Models such as ordinary least squares (OLS), spatial lag model (SLM), spatial error model (SEM), and spatial Durbin model (SDM) are established, and their performance is compared through Lagrange-multiplier (LM) and likelihood-ratio (LR) tests to select the optimal model for identifying the mechanisms of influence and spatial-distribution characteristics. Finally, heterogeneity analysis is conducted to ascertain the various impact factors between ecological conservation areas and urban living areas, leading to the proposal of differentiated optimization strategies.
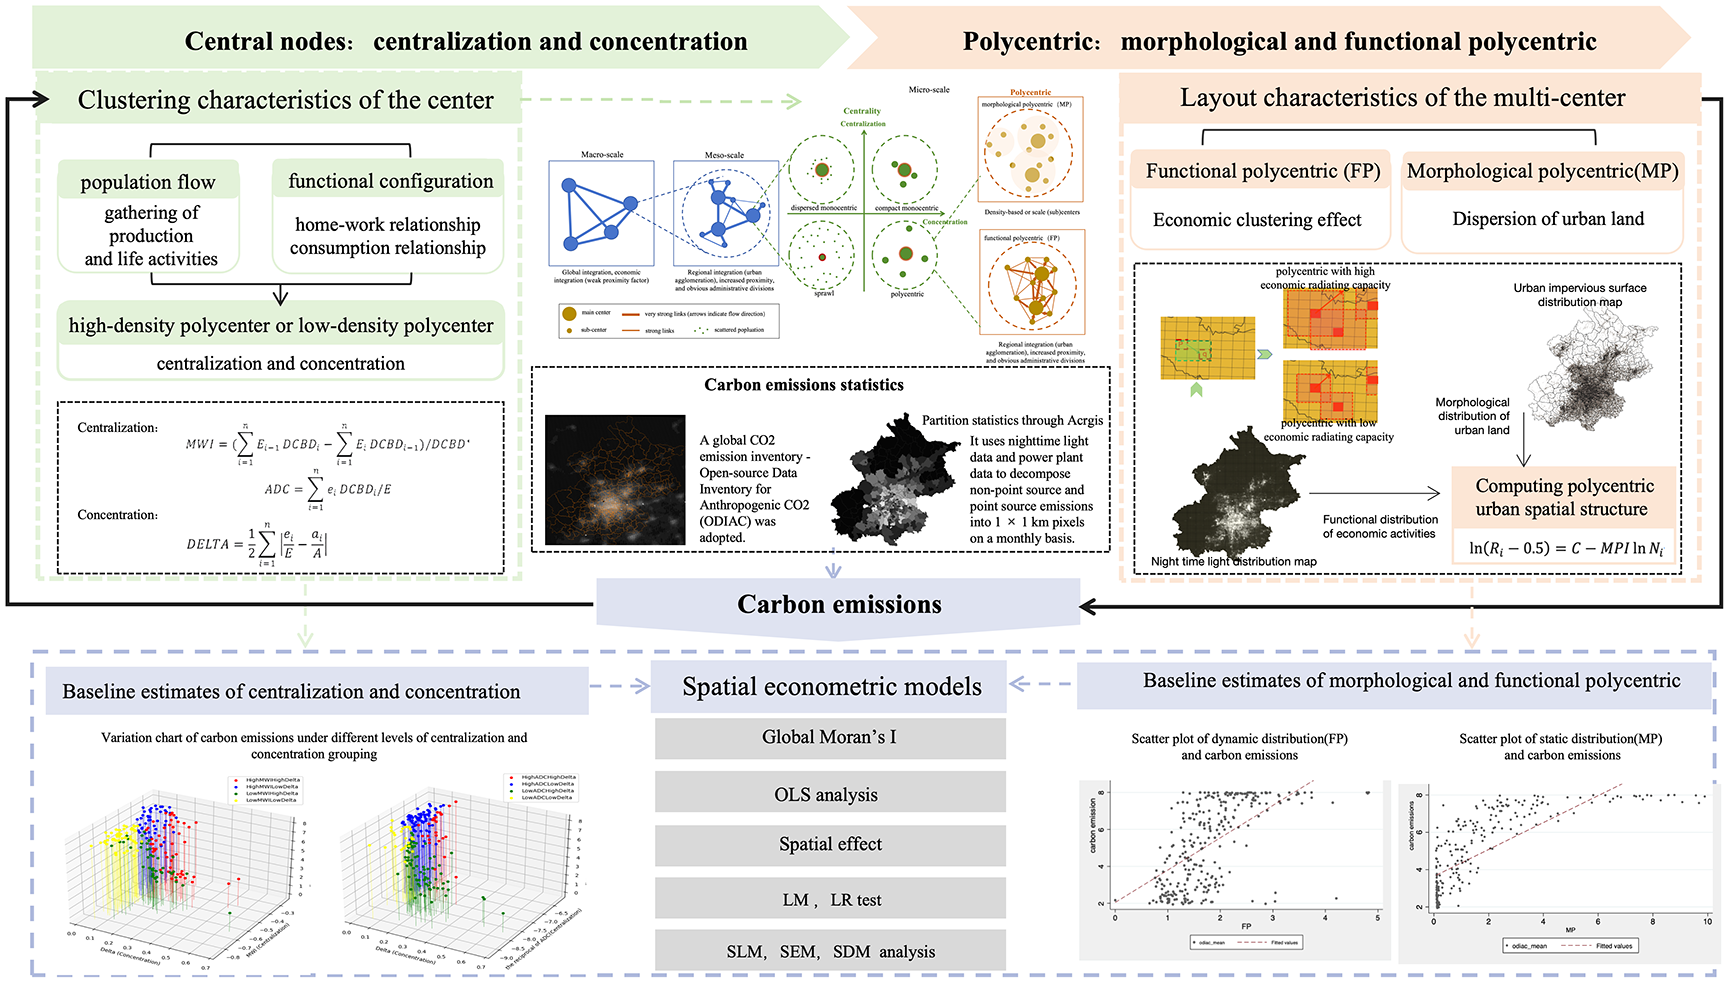
Research framework.
Study areas and data source
The rapid expansion of megacities in China has led to severe “urban diseases” such as air pollution and traffic congestion. Beijing, as a representative of these megacities, faces environmental issues that significantly impact its sustainable development. The research region is the Beijing metropolitan area, which includes various districts and subdistricts. In Chinese cities, the “jiedao” serves as the fundamental administrative division and is the most detailed geographical unit available in public government-data reports (Hu et al., 2018). Therefore, this study utilizes the subdistrict (jiedao) level as the fundamental geographical unit in Beijing, providing a more granular scale of analysis. Based on the 2017 Chinese administrative division statistics available 1 , a total of 331 areas were identified within the region, which include 150 jiedao, 143 towns, 33 villages, and 5 ethnic villages (Figure 3).
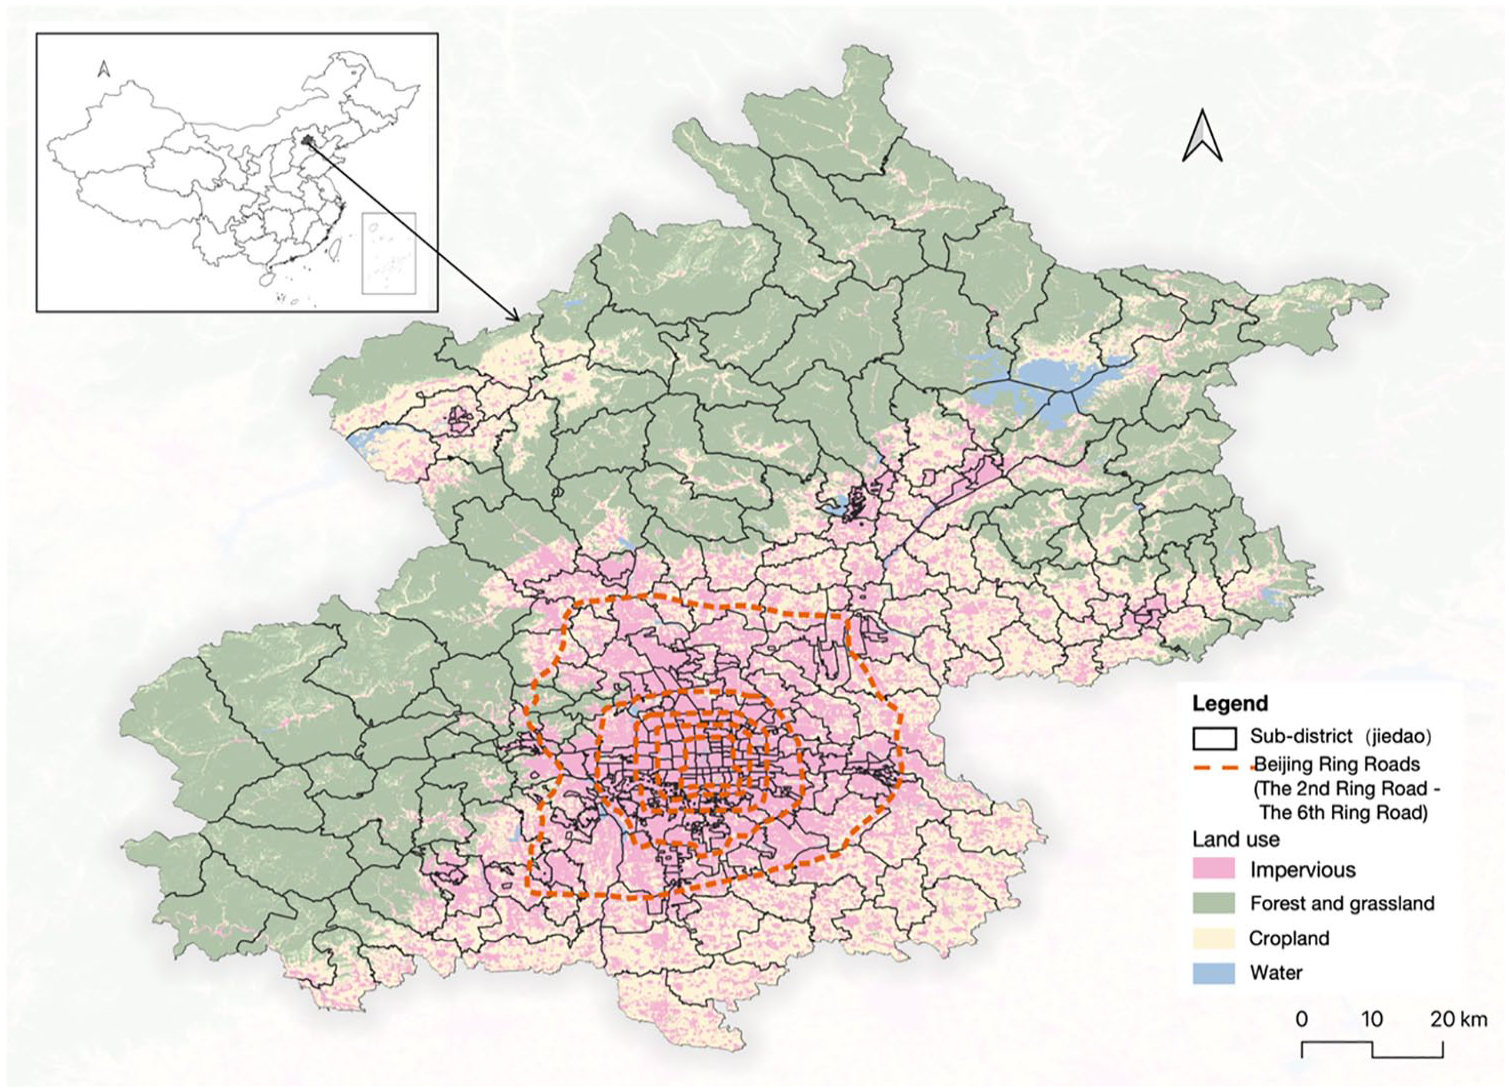
Study area.
Emissions data
To explore the optimal relationship and existing interactions between spatial dispersion and concentration in multicentric structures at a micro-granular level, as well as their impact on CO2 emissions, it is necessary to use reliable CO2-emission data at a regional scale with high spatial resolution using standardized tools and methods. For this purpose, ODIAC 2 was selected. Developed from national-level CO2 emissions provided by the Carbon Dioxide Information Analysis Center, ODIAC utilizes NTL data and data from power plants (including fossil fuels, nuclear, hydroelectric, and other renewable-energy sources) to disaggregate point and non-point emissions into 1 km × 1 km monthly pixels (Oda et al., 2018; Pan et al., 2021).
Polycentric urban spatial data
Spatializing carbon emissions is crucial for energy conservation, emission reduction, and urban planning at the micro-scale. The top-down approach in this study utilizes easily accessible open data, such as NTL remote sensing data and land cover remote sensing data, to transform carbon-emission measurements from administrative boundaries to more refined scales. This method allows for a clear and objective analysis of how spatial changes influence carbon emissions at the micro-scale. To ensure consistency in the research time frame and area, this study utilizes data from the relatively uniform period of 2017 to 2021.
NTL satellite imagery, as a long-term, global remote sensing dataset, has proven reliable in reflecting the intensity of human activity in specific areas. The NTL imagery primarily comes from the Defense Meteorological Satellite Program’s Operational Linescan System (DMSP-OLS). Compared to the spatial resolution of DMSP-OLS NTL data (1000 m), the NPP/VIIRS satellite imagery, with a spatial resolution of 500 m, performs better in quantifying socioeconomic factors at spatial levels. Numerous studies have demonstrated the effectiveness of NPP-VIIRS data in evaluating GDP (Sun et al., 2020), energy usage (Shi et al., 2020), and population distribution (Lu et al., 2021). The data undergoes radiometric correction, conversion to radiance, and multi-period averaging to obtain preprocessed NTL data. Consequently, to quantify the developmental changes in local areas of polycentric, we analyze the aggregation of NTL pixel values, where higher pixel values indicate a higher level of development (Yang et al., 2021).
For urban construction areas, we use the annual China Land Cover Dataset (CLCD), which is one of the few openly accessible datasets offering 30m-resolution, long-term, annual land cover data. The CLCD is an annual, long-term Landsat land cover dataset built using visual interpretation samples and a random forest classifier on satellite time series data. It includes nine categories: cropland, forest, shrubland, grassland, water, ice and snow, barren land, impervious surfaces, and wetlands. For the purposes of this study, we primarily used the impervious surface data to calculate the degree of urban land aggregation.
Computing polycentric structure
The polycentric structure is measured through multidimensional indicators, among which the Pareto index based on rank-size is primarily used to assess whether cities exhibit polycentric characteristics (Burger and Meijers, 2012). Compared to methods such as the ratio of subcenters to central areas (Vasanen, 2012) and primacy, the Pareto index is not only widely used but also aligns more closely with the main objective of this study to explore the dispersion of polycentricity. Using the annual China Land Cover Dataset (CLCD) urban impervious surface and NTL data, this study analyzes cities’ MP and FP based on the dispersion of urban land use and economic centers’ radiative force (see Figure 2).
As cities develop from low to high density, economic and population activities increasingly concentrate. However, when the cost of agglomeration exceeds its economic benefits, decentralization occurs, leading to a re-concentration of both people and industrial activities in secondary centers, ultimately establishing a polycentric structure. In line with this dynamic, we define urban spatial organization in terms of two key aspects: concentration and centralization. Centralization refers to the process of gathering numerous jobs in close proximity to the central business district (CBD), which we identify using NTL data. This metric captures the extent to which employment is concentrated near the city’s core, reflecting the degree of economic activity centralized around the CBD. On the other hand, concentration measures whether employment is disproportionately clustered in a few locations or more evenly dispersed across the urban landscape. This approach aligns with established frameworks (Anas et al., 1998; Han et al., 2020, 2022), and using jobs and employment as metrics is essential because they are direct indicators of economic activity and urban development. The distribution of jobs not only shapes the urban form but also serves as a critical factor in determining the vitality and functionality of urban spaces.
Dispersion of polycentricity: MP and FP
Quantifying MP:

where
Quantifying FP:
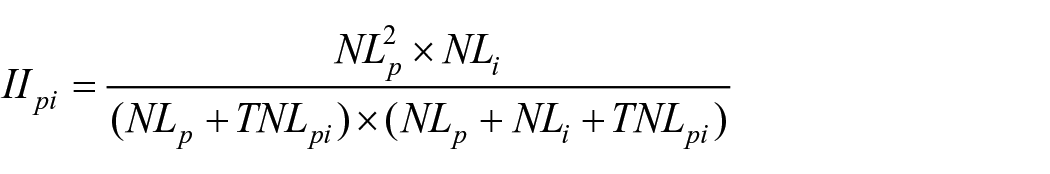
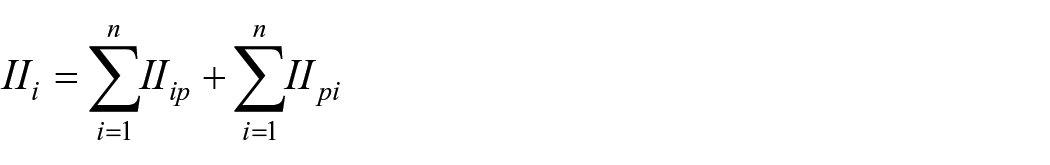

The Pareto exponent is one of the most commonly used indicators in studies of polycentric urban spatial structures. To correct for small-sample bias, the parameter values are estimated by subtracting 0.5 from the rank (Gabaix and Ibragimov, 2011). In this context, the rank refers to the ranking of urban development indices (regional NTL intensity). By subtracting 0.5 from the rank, we aim to reduce potential sample size bias in the calculation of the Pareto exponent. This approach has been widely employed in studies measuring polycentric urban structures (Han et al., 2022; Sun et al., 2019; Wang et al., 2022). Here,
Centrality of polycentricity: centralization and concentration
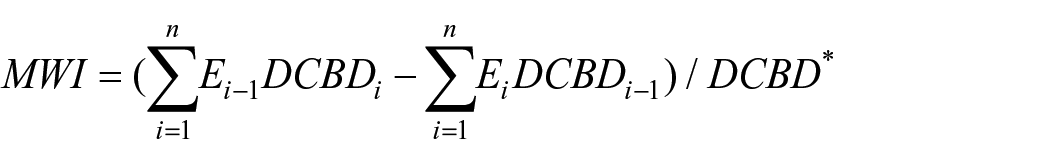
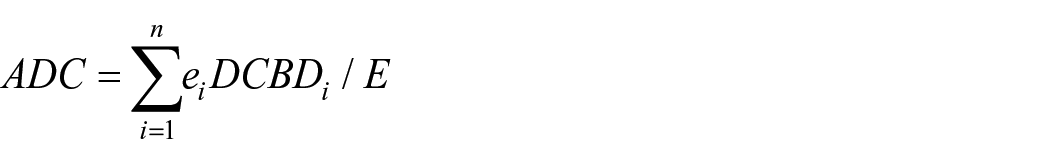
Urban spatial centrality is conceptualized through two spatial dimensions: centralization and concentration. Following Lee (2007) and Han et al. (2022), centralization is measured using the modified Wheaton index (MWI) and average distance to CBD (ADC). The MWI is commonly used in urban economics and regional science to gauge the degree of decentralization in employment distribution within a metropolitan area, specifically the rate of cumulative employment-proportion growth from the CBD to the city’s edge. A higher MWI indicates a greater degree of employment dispersion, suggesting more centralized control. The ADC measures the average distance to the CBD, providing an indication of whether residential and employment patterns are centralized or decentralized. Lower ADC values indicate a more concentrated distribution, whereas higher values suggest more decentralization. Concentration is measured using the Delta coefficient, which assesses the uneven distribution of population land use or employment in a city. An increase in the Delta coefficient indicates a stronger degree of agglomeration in urban land use or employment distribution.
Centralization:
Concentration:
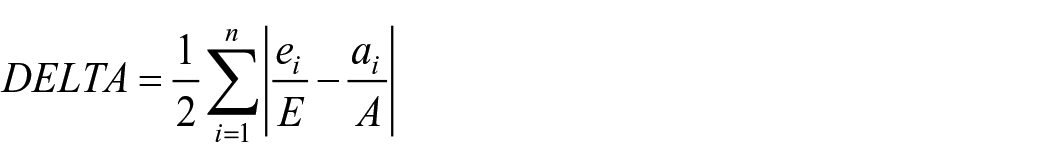
E is the total NTL intensity in the block; A is the total block land area;
Estimation of spatial metrics
Spatial weight matrix
In the formulation of spatial econometric models, the spatial weight matrix, denoted W, plays a critical role in quantifying the spatial relationships among regions. The elements of this matrix,

Spatial autocorrelation—global and local
This study employed the Moran index and Local Indicators of Spatial Association (LISA) to analyze the spatial agglomeration characteristics of carbon emissions. The Moran index, a global spatial-autocorrelation measure, can reveal the correlation between regions and neighboring regions, as well as the existence of spatial agglomeration. The LISA, a local spatial-autocorrelation measure, describes spatial outliers in carbon-emission levels between counties. The Getis–Ord Gi* hotspot index is used to identify local spatial outliers. This local measure allows for the identification of specific areas where carbon emissions deviate significantly from the overall spatial pattern.
Moran’s I index:
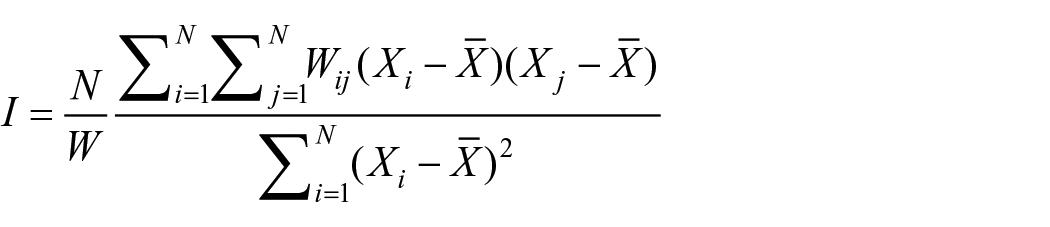
I is Moran’s I index. A positive value of I indicates positive spatial autocorrelation, suggesting clustering of similar values. A negative value indicates negative spatial autocorrelation, implying dispersion. N is the total number of regions.
Local Moran’s I index:
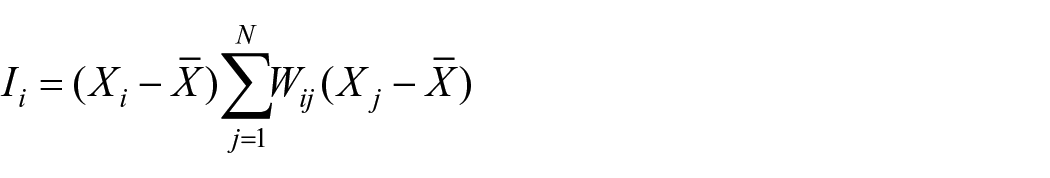
Getis–Ord Gi* Hotspot: Furthermore, the Getis-Ord Gi* index identifies spatial hotspots and coldspots, i.e., areas with statistically significant high or low value clusters. A high Gi* index indicates a hotspot of high value concentration, while a low Gi* index indicates a coldspot of low value concentration.
Spatial econometric models
The spatial lag model is defined by the following equation:

The spatial error model is defined by the following equation:

To select the most appropriate econometric model for estimating the impact of urban polycentric structures on carbon emissions, based on the test results indicating spatial correlation, the SDM is employed to capture the direct spatial dependencies among neighborhoods. This model accounts for the spatial dependence of the disturbance terms and the local spatial-spillover effects. The SDM is represented by the following equation:

In this formula,
Selection of control variables
In addition to spatial structure indices, this study incorporates control variables such as population density, green space ratio, urban land-use density across various functional types, and road-network density. Population density is a critical variable as it directly impacts energy consumption and transportation needs, which are key drivers of urban carbon emissions (Ribeiro et al., 2019). The inclusion of the green space ratio is justified by the role of urban green spaces as carbon sinks, which can mitigate the effects of carbon emissions (Strohbach et al., 2012). Moreover, green spaces significantly influence the microclimate and the urban heat island effect, both of which are relevant to carbon emissions (Park et al., 2017). The density of the road network is also considered a control variable due to the substantial contribution of transportation to urban carbon emissions. High road-network density is generally associated with increased traffic volumes, leading to elevated emissions (Lei et al., 2023). Various land-use types, such as residential, commercial, and leisure, exert differing impacts on carbon emissions; for instance, commercial areas typically exhibit higher emissions compared to residential areas (Zhang et al., 2018).
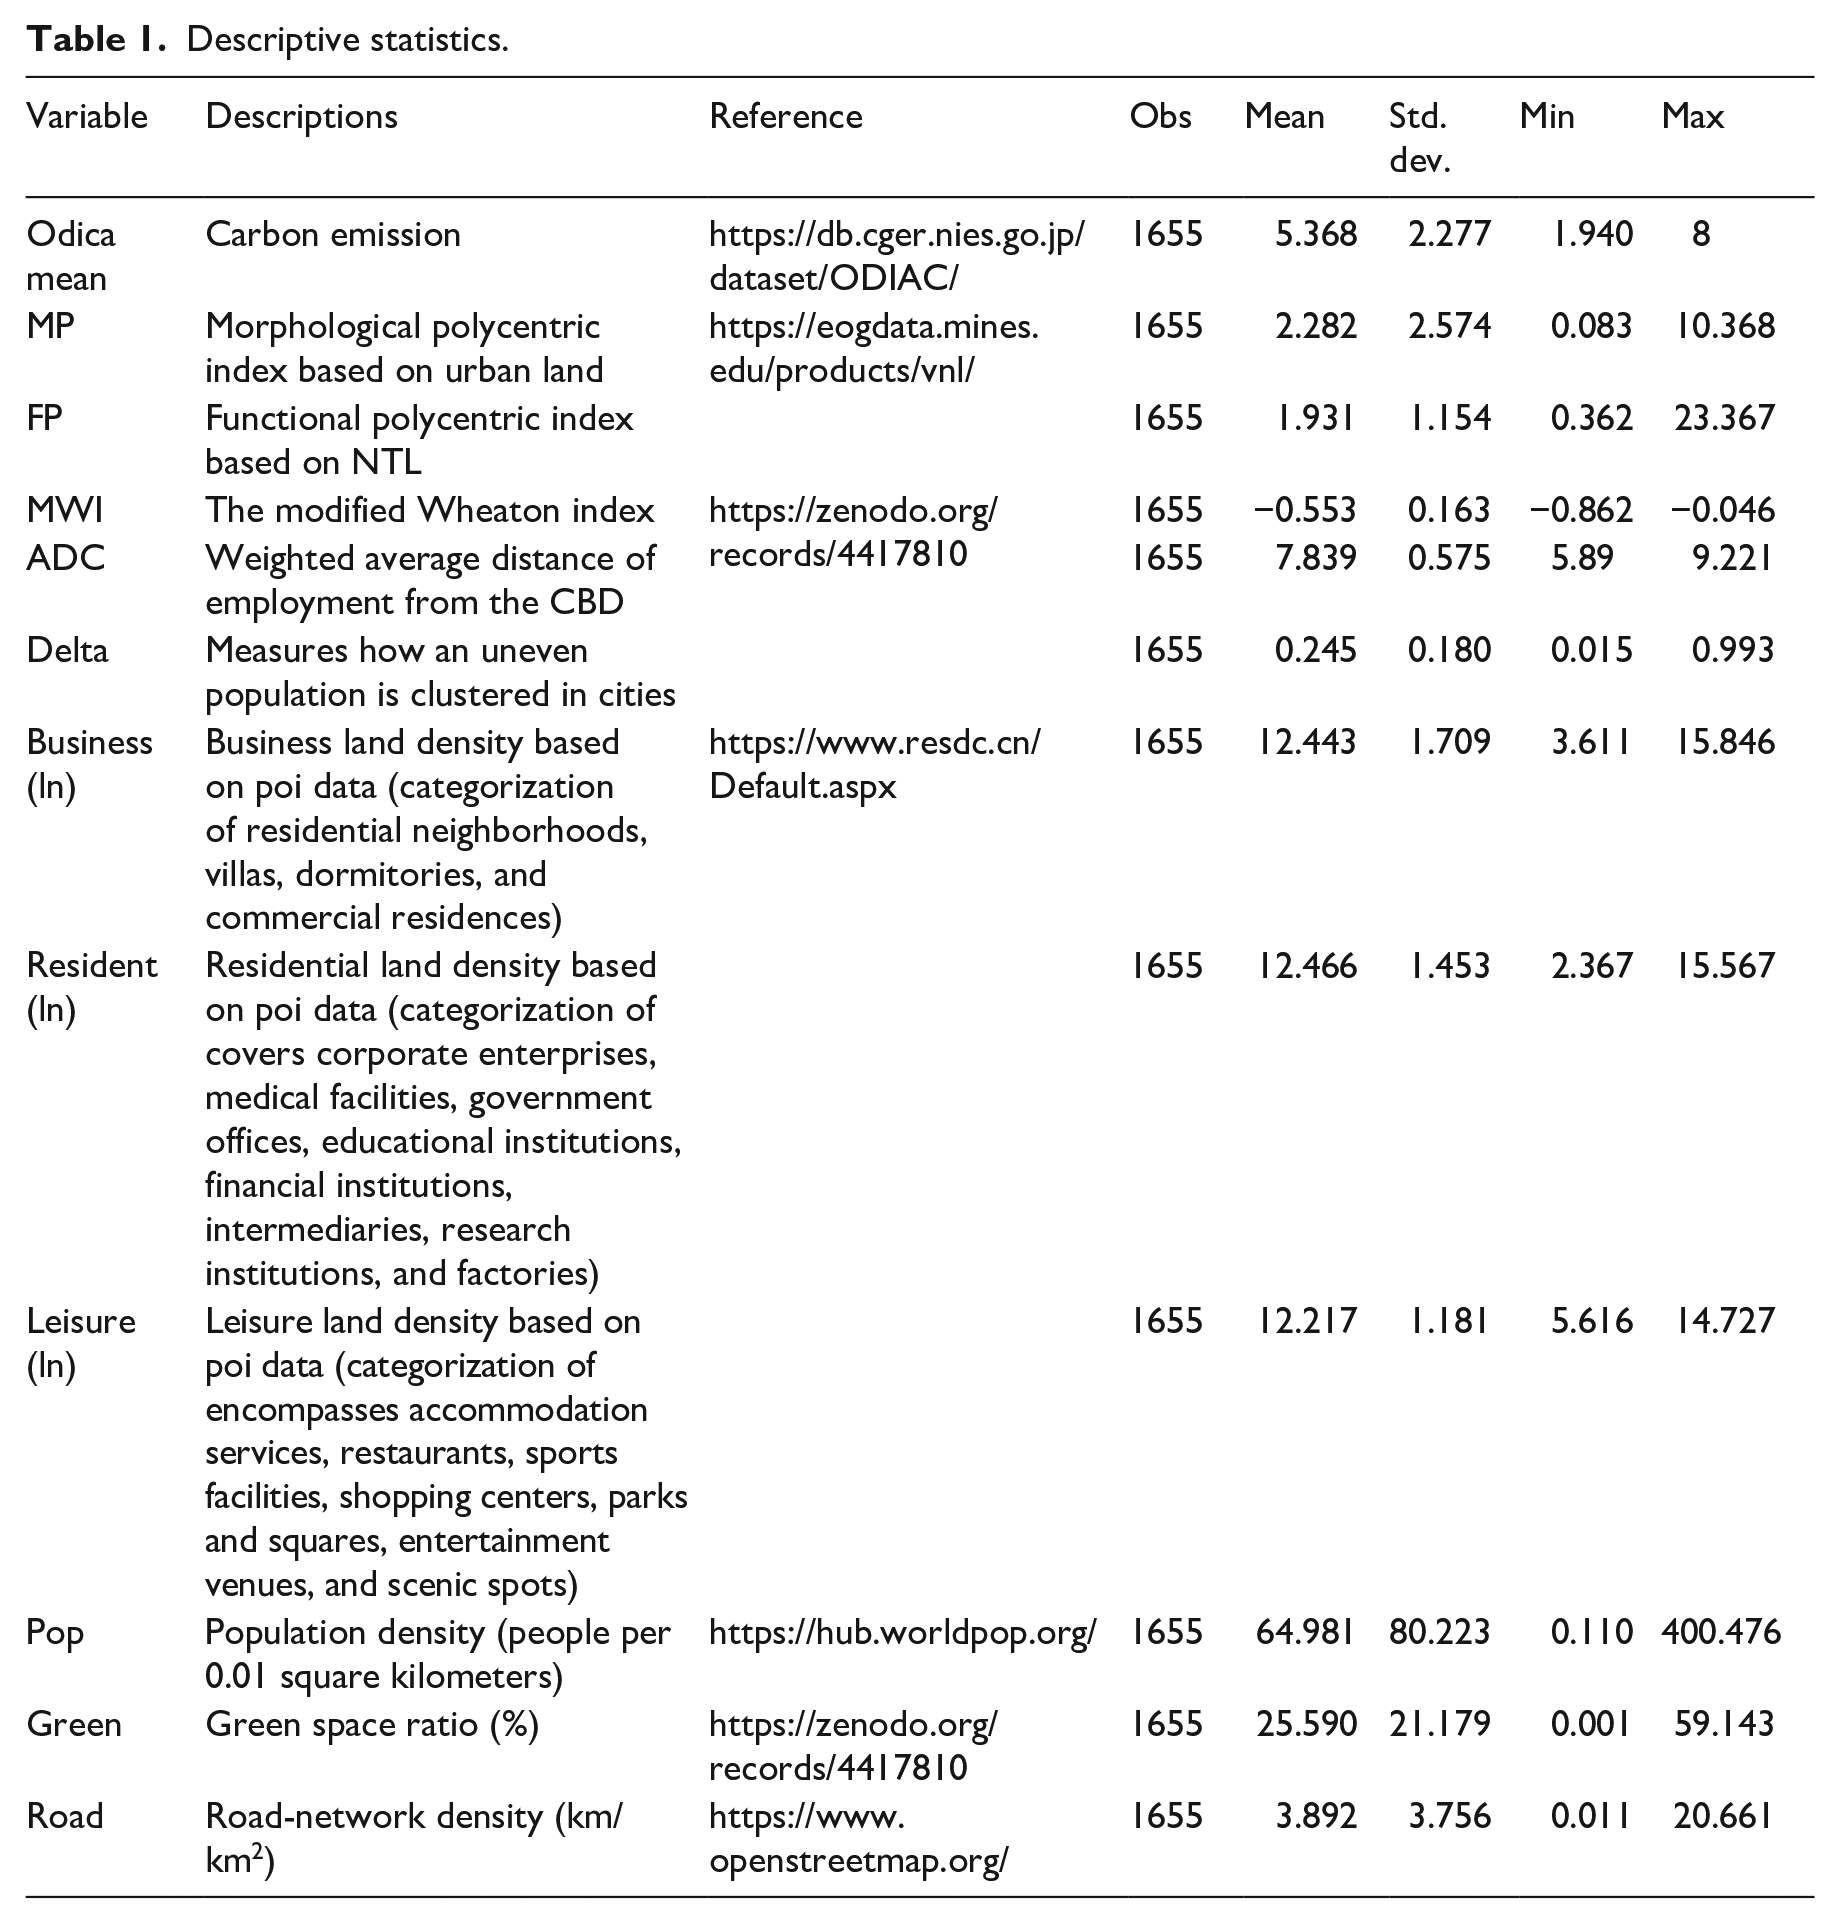
In this study, land-use types were classified using Points of Interest (POI). POI data represents geographic entities in the form of point data, characterized by high precision, extensive coverage, rapid updates, and large data volumes. Due to these attributes, POI data has been widely utilized in urban studies (Cai et al., 2017; Deng et al., 2019; Hao et al., 2024). The three primary patterns of urban residents’ daily lives include employment, residence, and leisure activities (see Table 1). The initially acquired POI data included 13 types, representing various functions that a city offers. After deduplication and correction of the data, we categorized the POIs into three main functional types based on their primary function and relevant literature (Zhou, 2022). The POI data was analyzed through kernel density estimation using ArcGIS. This allowed us to generate raster data that reflects the relative concentration of spatial elements, providing a detailed visualization of the spatial distribution of these land-use types. By calculating the kernel density of business, residential, and leisure land types, we were able to perform comprehensive statistical analyses.
Descriptive statistics.
The selection of these control variables is grounded in prior studies that have examined the impact of urban microspatial factors on carbon emissions (Yao et al., 2023). However, due to the scale limitations of this study, we have focused on high-resolution spatial data to ensure consistency in data analysis. Although urban carbon emissions are also influenced by economic, industrial, and social policies, the constraints in data availability preclude the inclusion of all potential influencing factors at this time. Furthermore, we excluded extreme values from the explanatory variables and used linear interpolation to fill in some missing data. These data-processing steps ensure the scientific validity and effectiveness of our research findings.
Empirical analysis
Evaluating spatiotemporal changes in carbon emissions
According to the data published by the China City Greenhouse Gas Working Group (Figure 4), the total carbon emissions in Beijing from 2017 to 2021 exhibited a trend of slow and fluctuating growth. The data also highlight the impact of external factors, such as the COVID-19 pandemic in 2020, which led to a temporary reduction in emissions. However, at the end of 2020, as activities resumed, emissions began to rise again, indicating that the impact of the pandemic was temporary. ODIAC provides global high-resolution monthly emission data, and for this study, we compiled data for all twelve months and constructed an annual carbon-emission trend curve. The results in Figure 5 show a clear seasonal pattern in Beijing’s carbon emissions, albeit with an increase in the baseline level of emissions. In winter, emissions are always high due to heating demand. The magnitude of carbon-emissions change in February is the closest to the official trend. Consequently, this study used the carbon emissions in December during the five-year period from 2017 to 2021 as the study data and analyzed the spatial distribution of average carbon emissions in Beijing for February (see Figure 6). Although the average carbon emissions in central areas displayed a rising trend, the temporal variability did not show significant differences when compared spatially across the region.
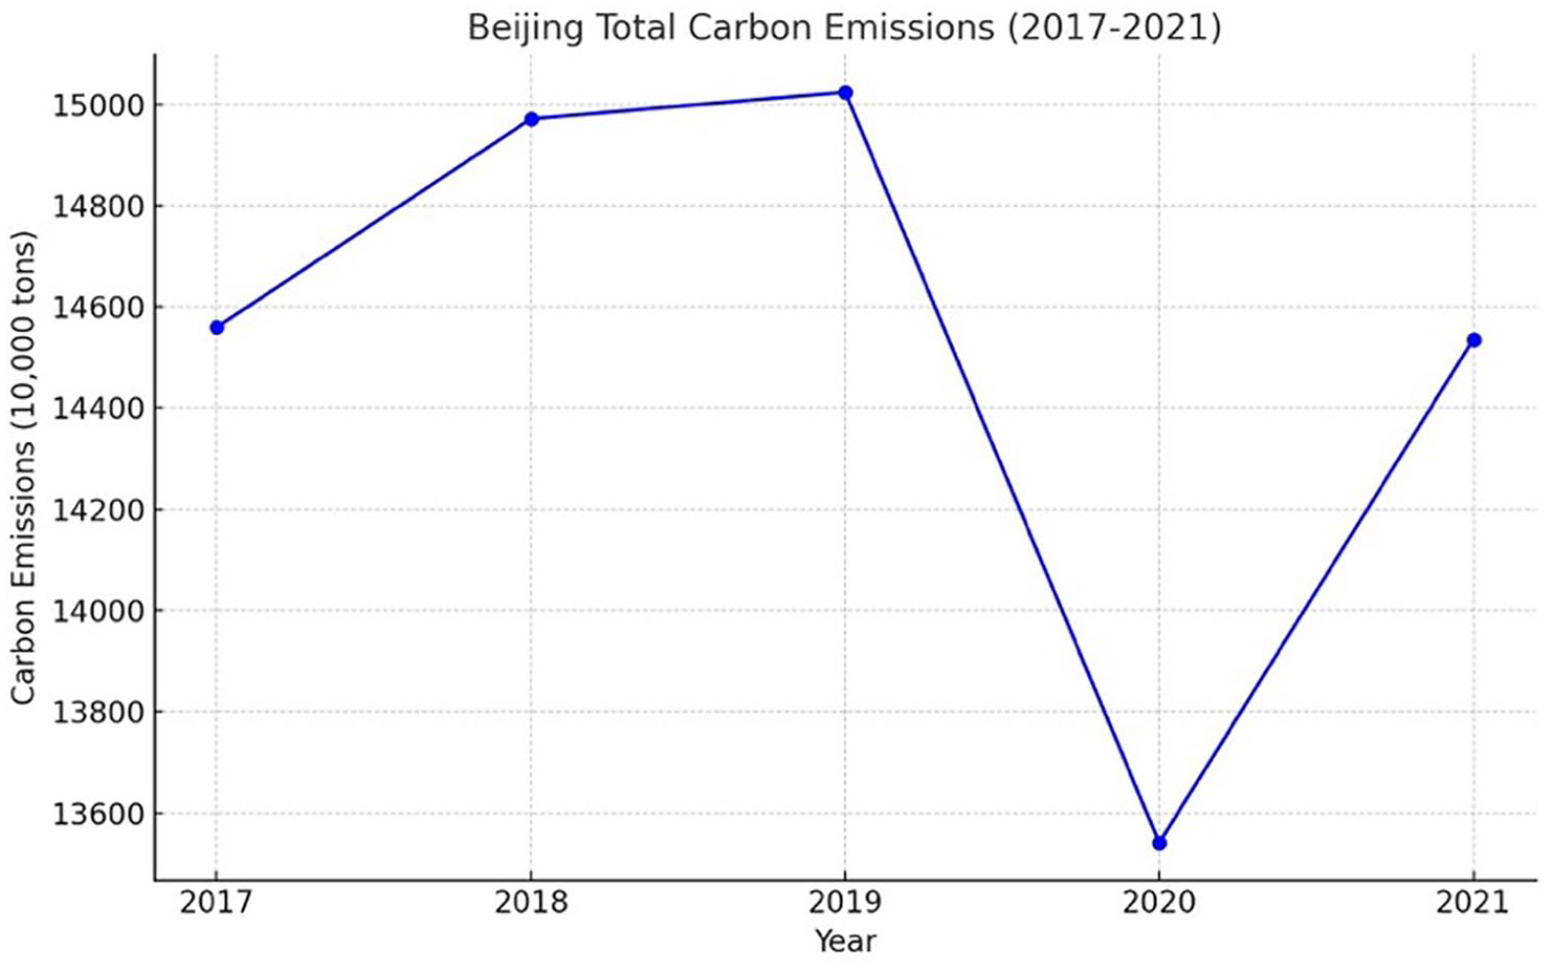
Evolution of total carbon emissions in Beijing, 2017–2021.
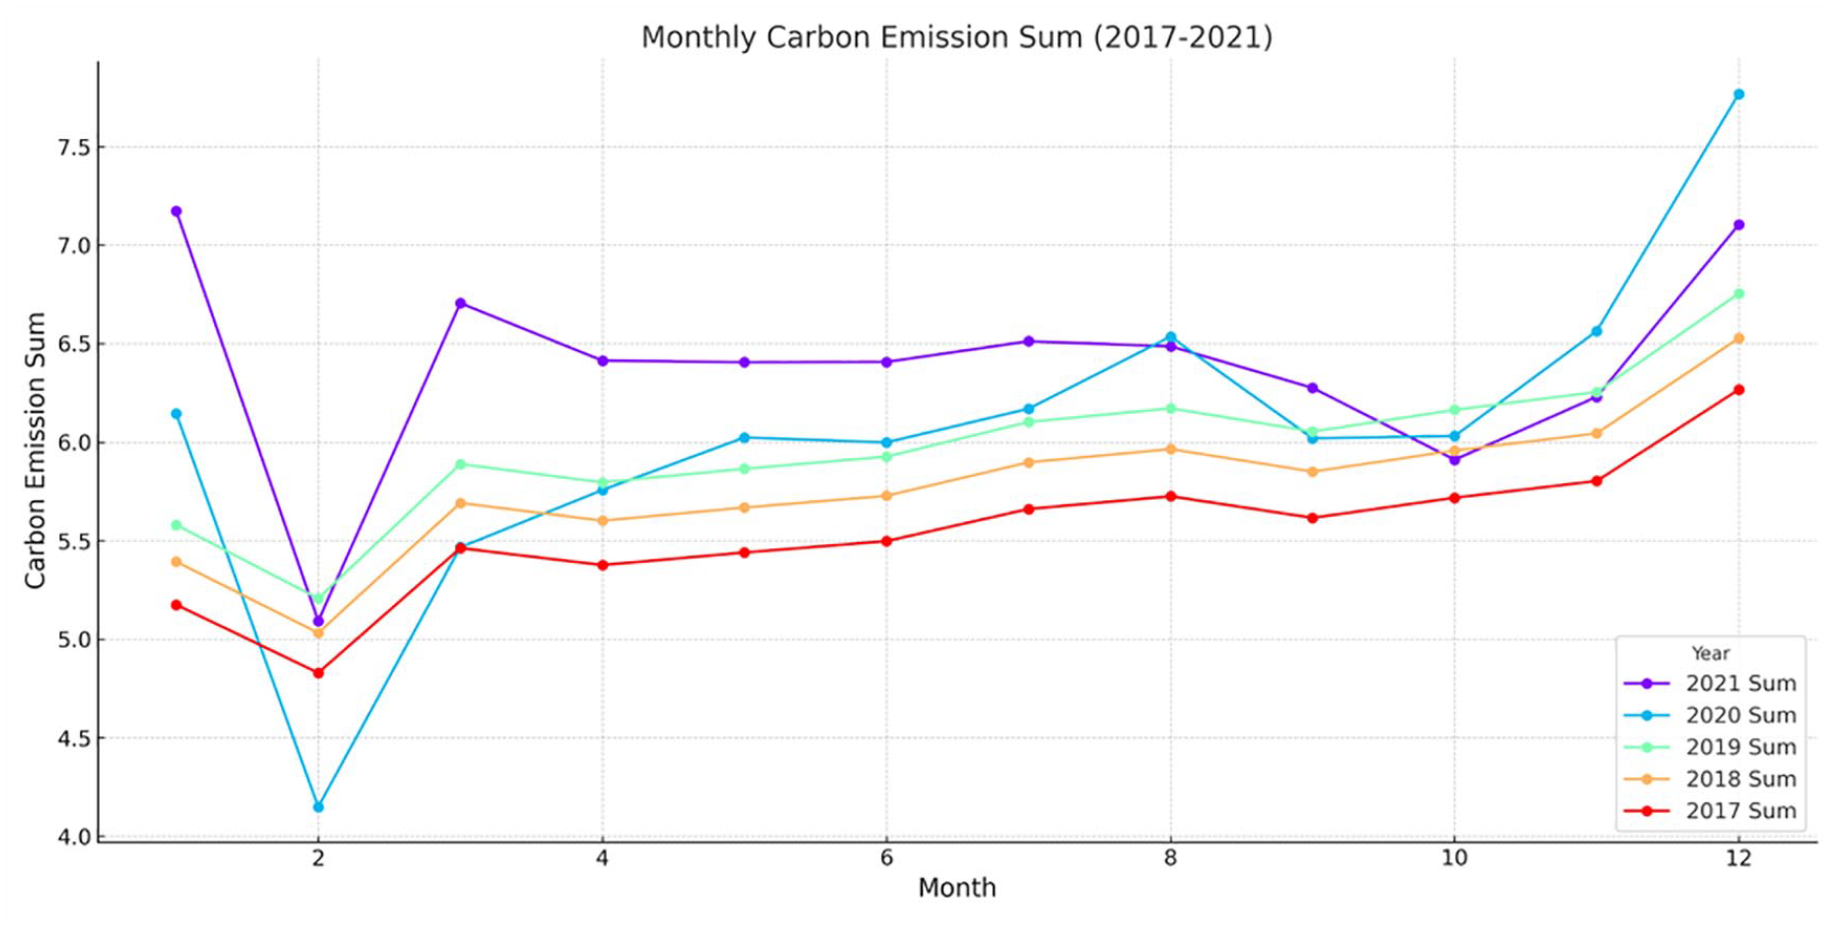
Evolution of monthly carbon emissions in Beijing, 2017–2021.
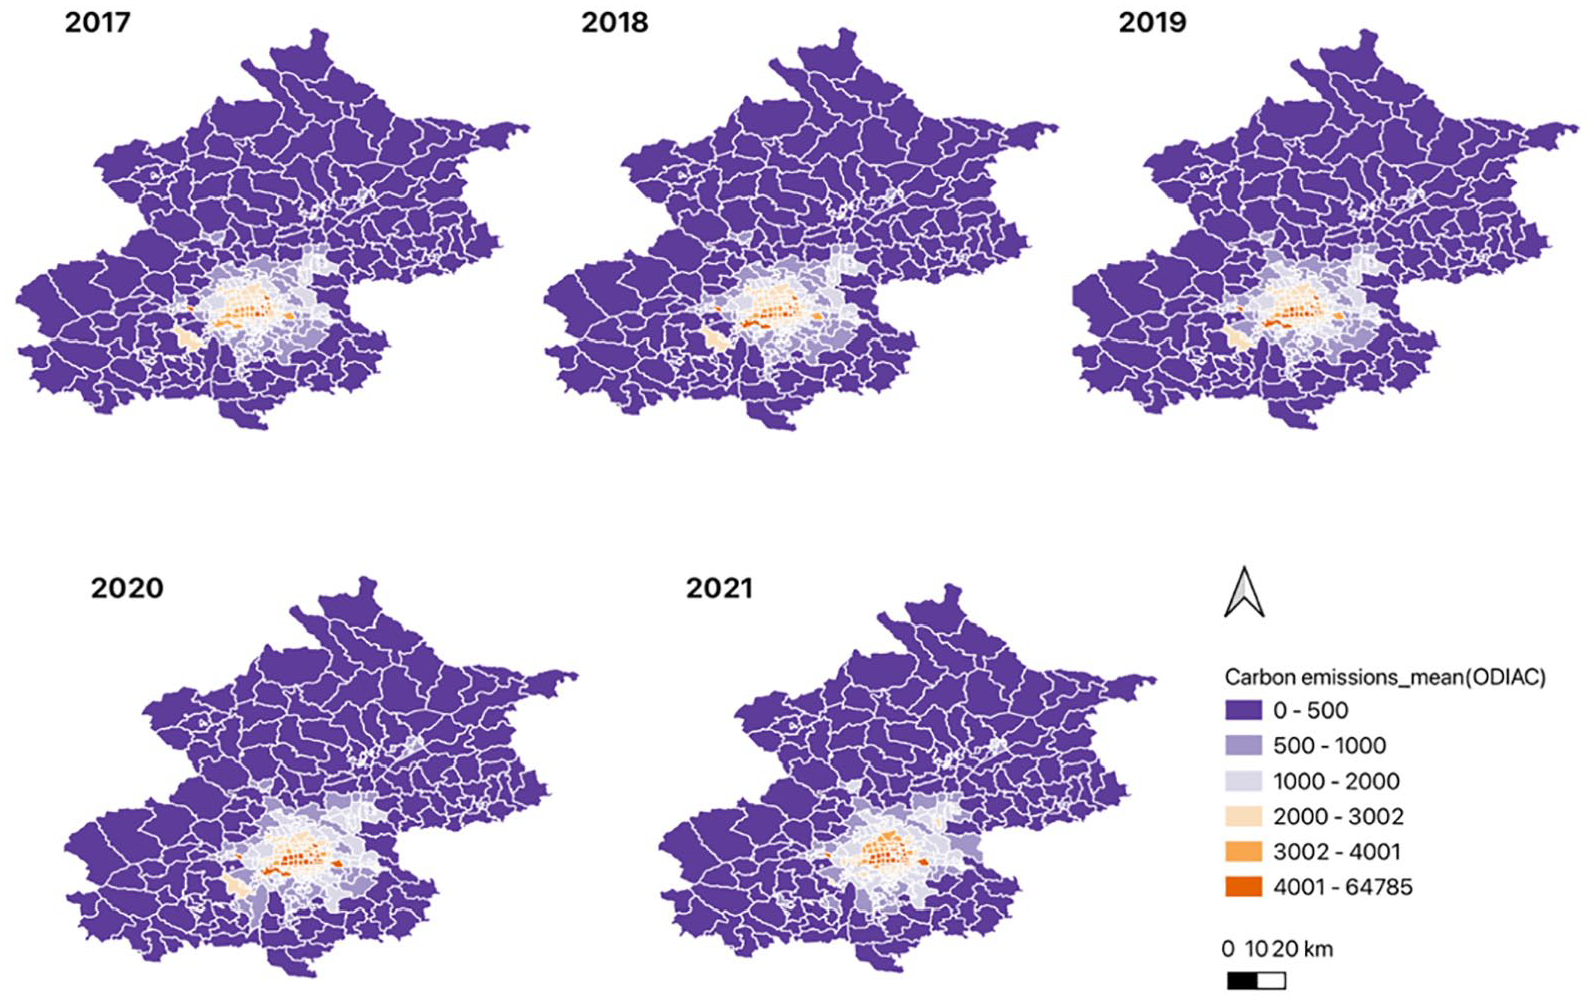
Spatiotemporal distribution of average total carbon emissions in February.
Spatial–temporal characteristics of carbon emissions (global and local)
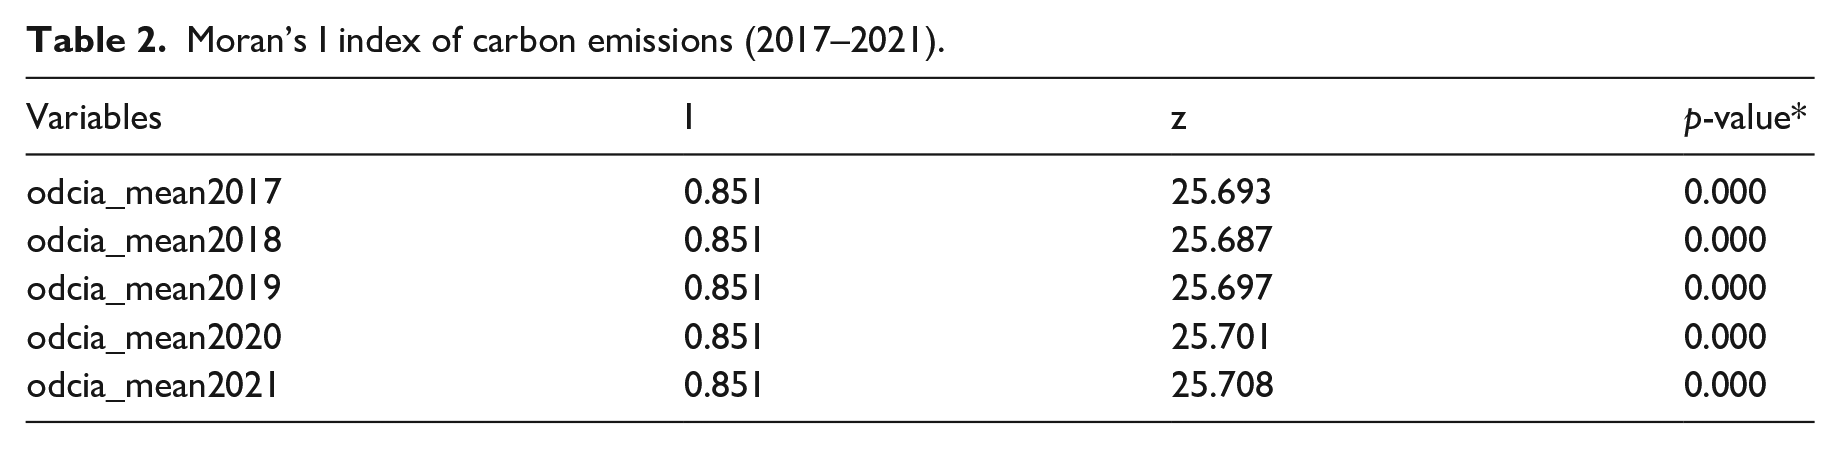
The global Moran’s I statistical results for carbon emissions in Beijing are significant, far exceeding the expected values under the assumption of spatial randomness (see Table 2). As shown in Figure 4, the significant and positive correlation revealed by Moran’s I analysis suggests that carbon emissions in Beijing are not randomly distributed but exhibit spatial clustering. This pattern indicates that areas with high emissions are often surrounded by regions with similarly high emissions. Such clustering is consistent with the realistic factors of Beijing’s urban development model, which expands outward from the center, as well as its economic activities and geographical characteristics (Figure 7).
Moran’s I index of carbon emissions (2017–2021).
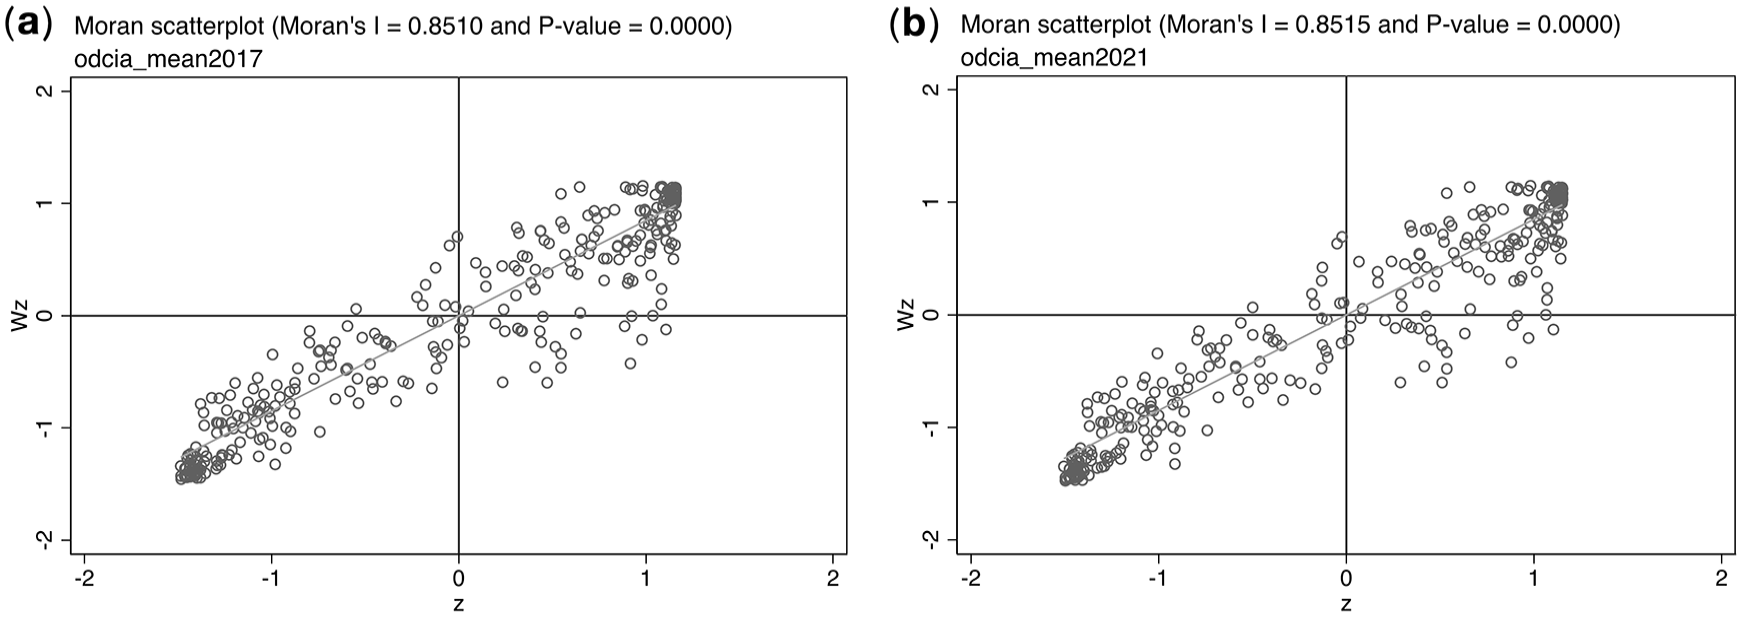
Moran scatter plot: (a) 2017 and (b) 2021.
Local spatial-autocorrelation analysis (LISA) was conducted to statistically analyze carbon emissions at both the 1 km grid and the subdistrict scales in Beijing. The results shown in Figure 8 indicate a strong “high-high” clustering pattern of carbon emissions in the urban center, suggesting that these areas have higher-than-average carbon emissions and form high-emission hotspots with neighboring regions. Compared to the subdistrict scale, the range of carbon-emission clustering at the 1 km grid scale extends from the aggregation within the 5th Ring Road outward to the boundary of the 6th Ring Road. Additionally, at the subdistrict scale, the carbon-emission clustering effect is prominently monocentric, and “low-low” clustering areas are more widespread in the periphery. In contrast, at the grid scale, the clustering pattern of carbon emissions gradually shows multiple clusters and an outward diffusion trend. This reflects the spatial differentiation of carbon-emission levels within Beijing at different spatial scales. Additionally, the positive impact of forest stock and ecological carbon-sequestration capacity extending from the southwest to the north of Beijing is more pronounced in the spatial pattern.
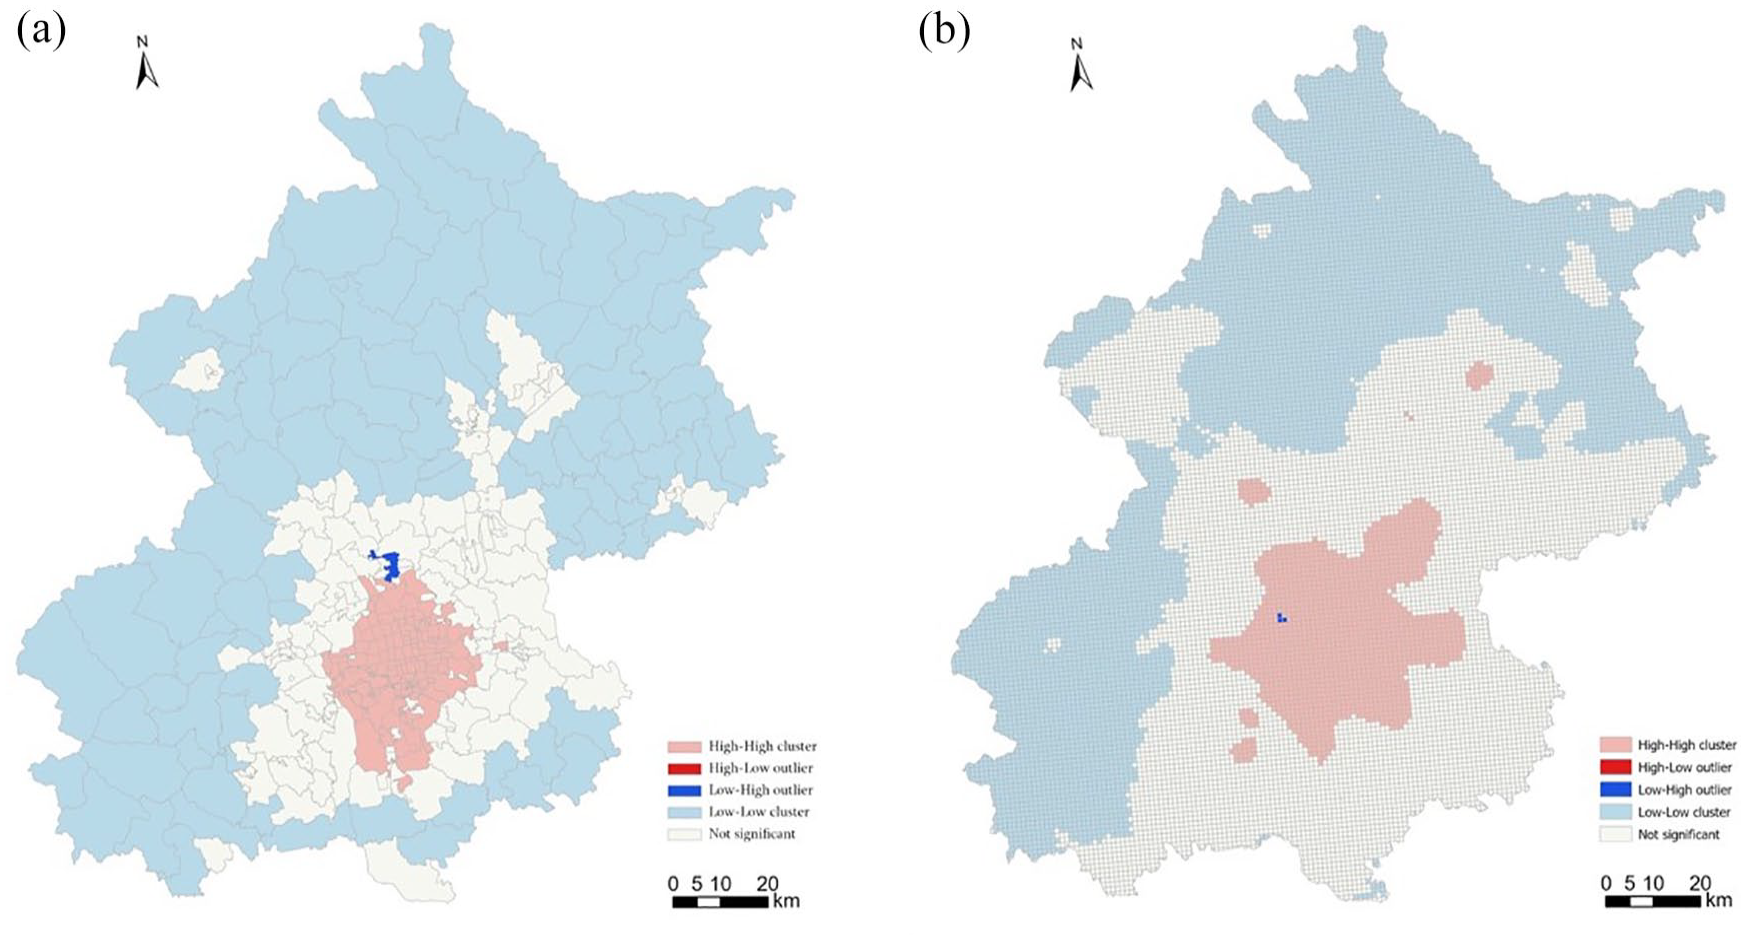
Carbon-emission classifications in Beijing (2021): (a) subdistrict level and (b) grid-level (1 km).
Spatial-model-related tests
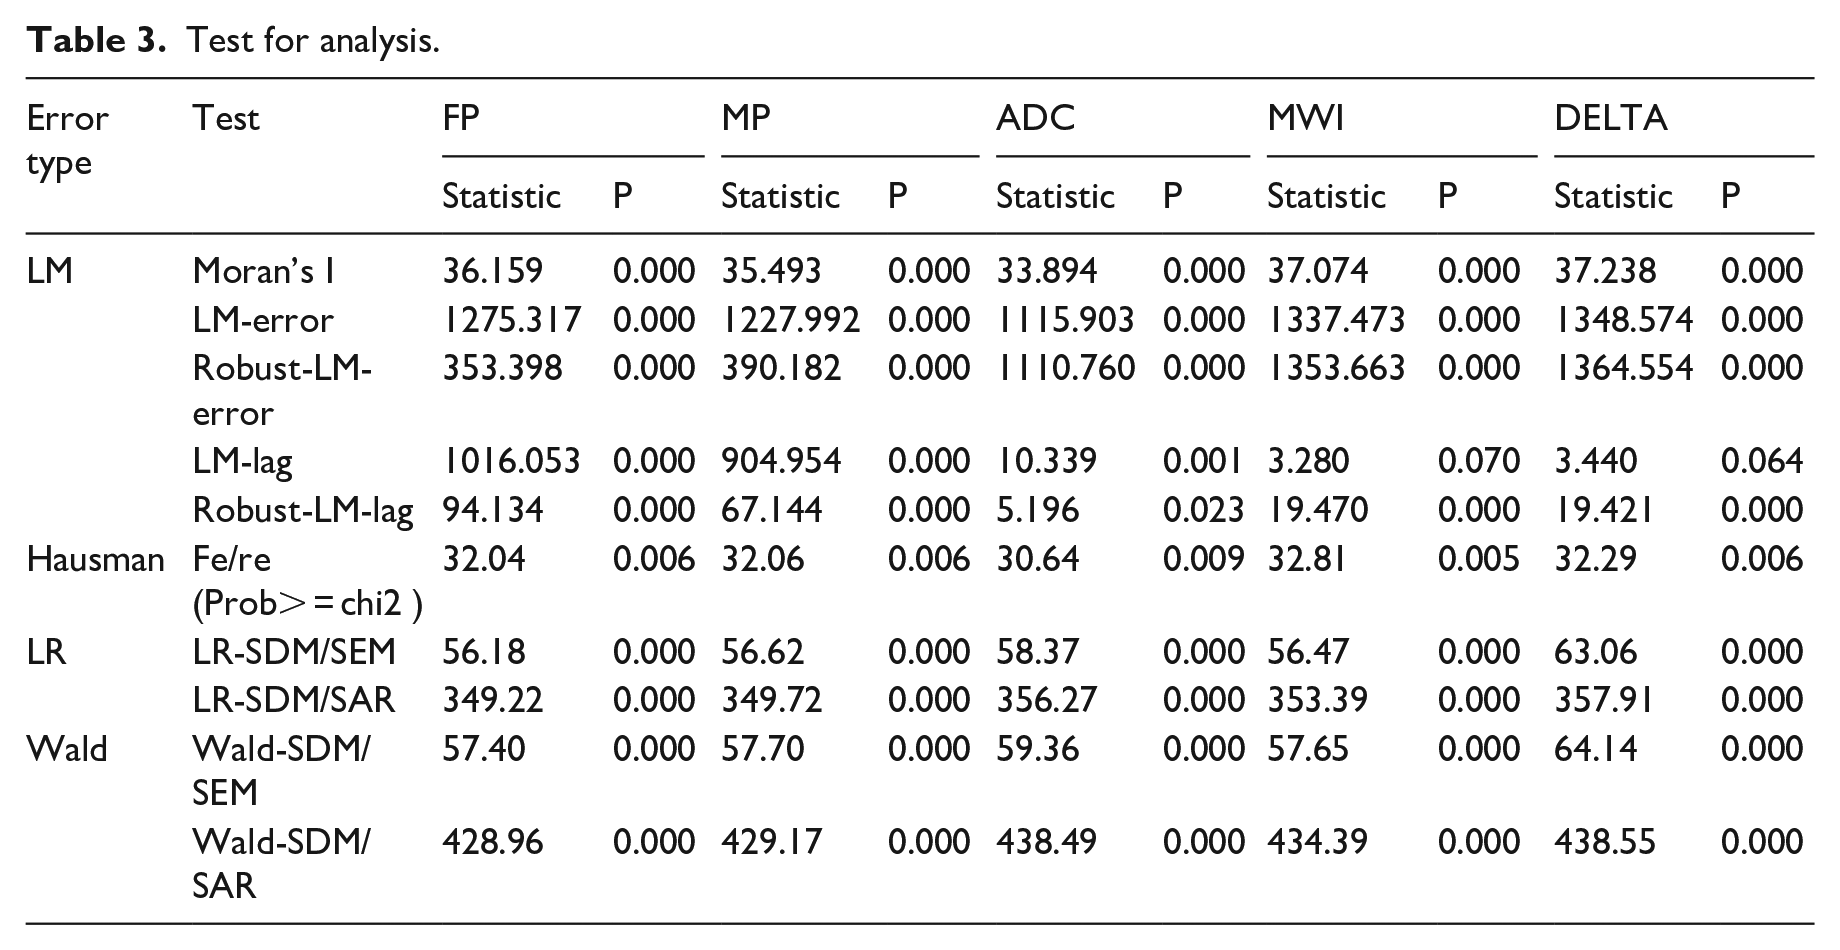
The Moran’s I result indicate the presence of spatial autocorrelation among carbon emissions across neighboring regions in Beijing, suggesting that standard ordinary least squares (OLS) regression may not be suitable for spatial panel data models, potentially leading to biased estimation results. First, we conducted a general OLS regression and used the Lagrange Multiplier (LM) test for preliminary examination. As shown in Table 3, Moran’s I is significant at the 1% level, and both the LM-error and Robust LM-error statistics are significant at the 1% level. Similarly, the LM-lag and Robust LM-lag results are also significant, indicating that carbon emissions are influenced by both the spatial lag of the dependent variable and the spatial lag of the independent variables. This finding leads us to reject the use of a mixed panel regression model and preliminarily select the SDM. Next, the Hausman test results are significant at the 1% level, indicating that the fixed effects model is preferable to the random effects model in this study. Following this, we conducted robust tests, including the Wald and Likelihood Ratio (LR) tests. Both tests are significant at the 1% level, allowing us to reject the null hypothesis that the SDM model can be simplified to the SLM or SEM. Furthermore, when endogenous interaction effects and the interaction between error terms are incorporated into the model, the log-likelihood function increases, and the SDM model shows the highest values for both log-likelihood and R2. These results suggest that the SDM model is statistically and substantively superior to the other two models.
Test for analysis.
Baseline estimates of polycentric
The increase in FP is significantly correlated with the direct increase in carbon emissions (coefficient 0.131, p < 0.01), suggesting that FP with high radiative forcing and more extensive economic activities contributes to elevated carbon emissions from production and living. This finding is at variance with the results of previous studies on the impact of macro-scale polycentricity on carbon emissions (Chen et al., 2021; Wu et al., 2023). In contrast, the coefficient for MP is 0.056, with a p-value of less than 0.01. This suggests that the monocentric concentration of the city’s construction contributes to reducing carbon emissions. The results of the spatial analysis indicate the presence of significant spatial autocorrelation (rho > 0.8), suggesting that neighboring regions’ carbon emissions exert a spatial propagation effect. However, due to the presence of spatial autocorrelation, the coefficients of explanatory variables in the SDM do not fully capture the influence of the independent variables on the dependent variable. Instead, the spatial spillover effects can be interpreted through direct, indirect, and total effects. According to the decomposition results, the direct effect of FP on carbon emissions is significantly positive at the 1% level, indicating that the enhancement of local FP directly contributes to the increase in local carbon emissions. In contrast, FP in neighboring regions does not have a significant indirect effect on local carbon emissions, suggesting that the increase in carbon emissions due to higher FP levels is primarily localized. In other words, this impact underscores the direct environmental costs associated with the expansion of functional networks dispersed across multiple centers. On the other hand, MP also shows a significantly positive direct effect and an insignificant indirect effect, yet it still contributes to a significantly positive total effect. This implies that an increase in MP in one area enhances the overall regional carbon emissions, suggesting that the physical dispersion of economic spaces at the local level leads to broader regional carbon emission patterns. While MP at a larger city or regional scale can promote more balanced urban development by reducing density and alleviating local congestion (Derudder et al., 2021), at the scale of urban subdistrict, dispersing activity centers tends to lead to a cumulative increase in carbon emissions.
The analysis of control variables indicates that residential density and population size are positively correlated with carbon emissions, while a negative correlation is shown between the greening ratio and leisure-space density and carbon emissions. This highlights the pivotal role of green space in enhancing cities’ carbon-absorption capacity and improving the microclimate. Furthermore, the expansion of road networks has been found to significantly contribute to carbon emissions, reflecting the direct impact of transportation activities on the city’s carbon footprint. It can be observed that micro-scale planning within cities is more conducive to long-term carbon-neutral development when considering the control and decentralization of the economic radius of the center, as opposed to the polycentric dispersion of building sites (Table 4).
The SDM results of ‘dispersion’.
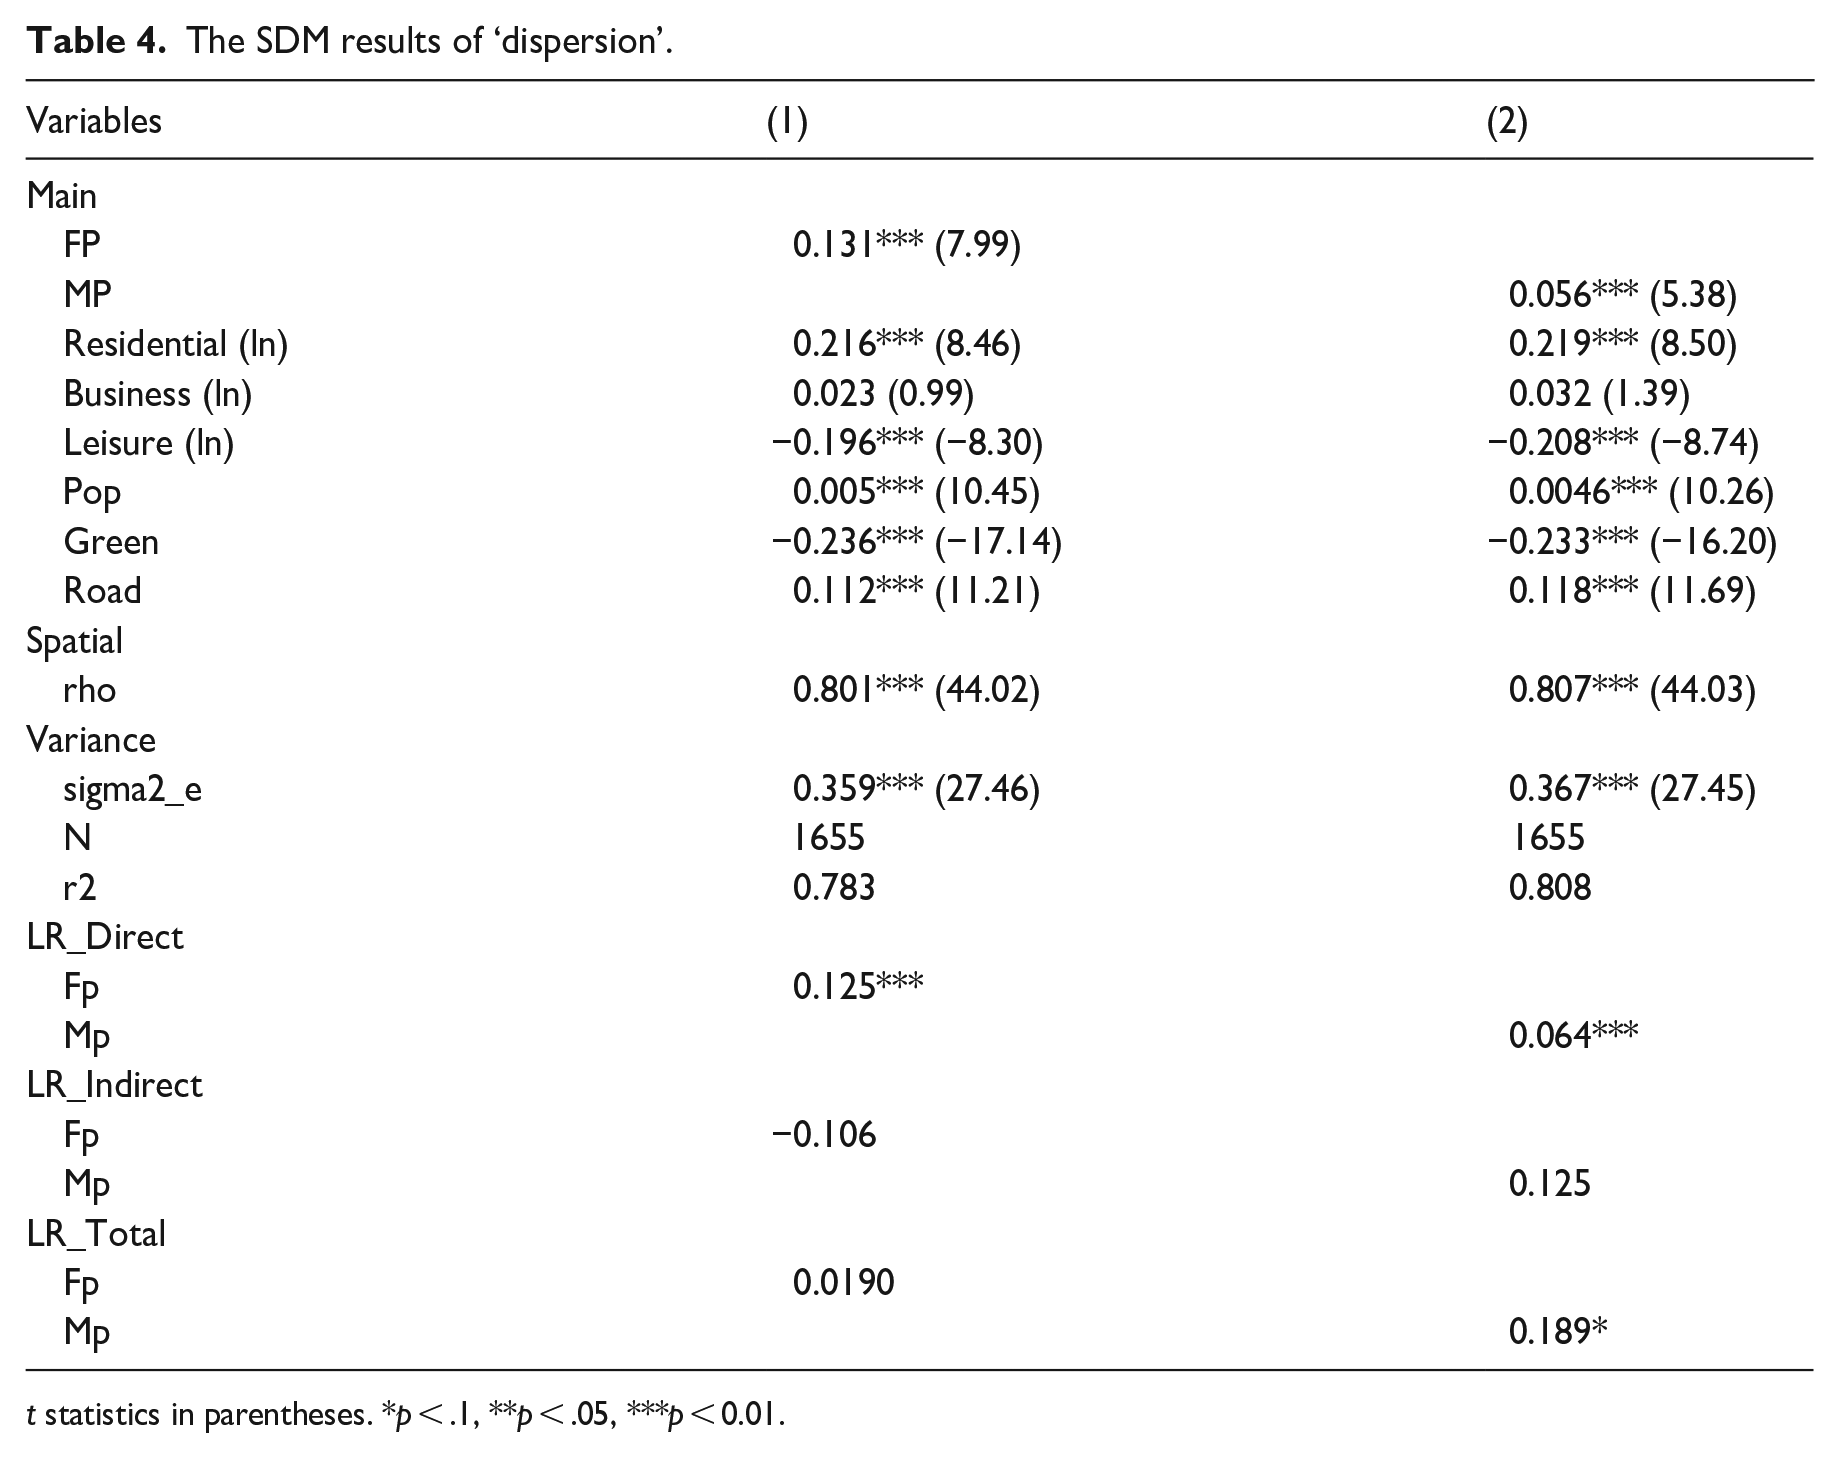
t statistics in parentheses. *p < .1, **p < .05, ***p < 0.01.
Baseline estimates of centralization and concentration
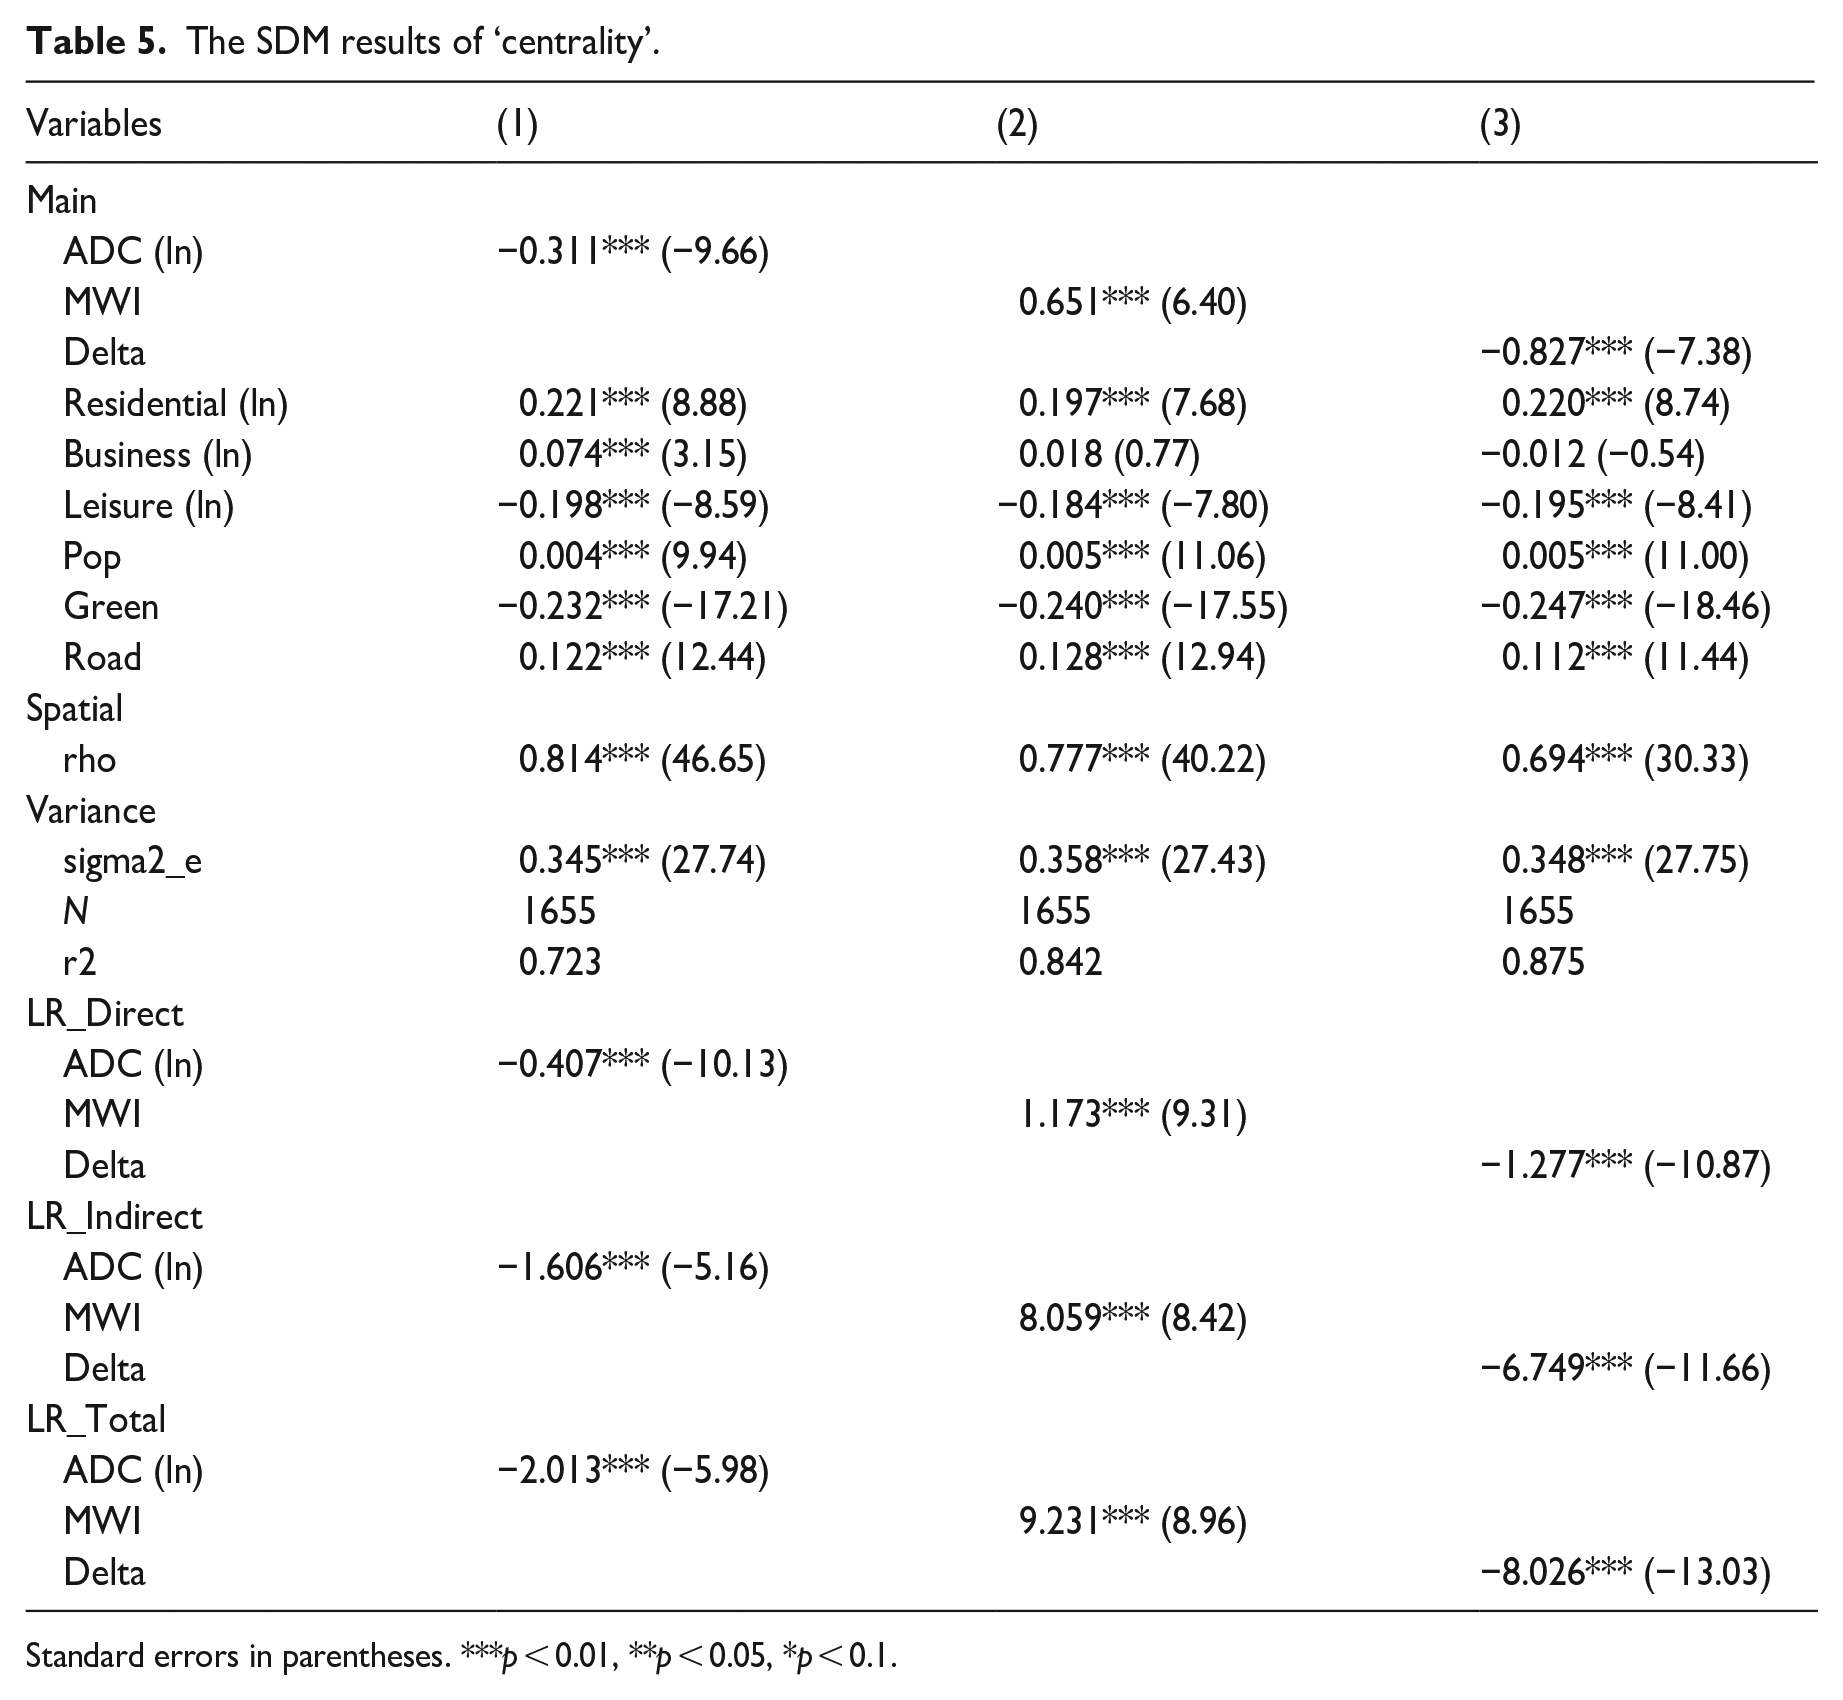
To investigate the relationship between centrality indicators and carbon emissions, we employ the SDM to analyze the specific impacts of the degree of centralization (represented by ADC and the MWI index) and concentration (represented by the Delta coefficient) on carbon emissions. The following key findings were observed: First, the coefficient of ADC in model (1) is significantly negative (−0.311, p < 0.01), and lower values of ADC represent a greater concentration of employment activities near the CBD, i.e., a high degree of centralization of economic activities by the CBD leads to more average carbon emissions. Second, the MWI demonstrates a significant positive correlation (0.651, p < 0.01) in model (2), which also indicates that a high concentration of economic activities in the CBD increases carbon emissions. Both models demonstrate that a high degree of centralization in the central region is accompanied by elevated emissions. This finding reinforces the existing literature that highly concentrated agglomeration economies are associated with increased traffic congestion and energy consumption, which in turn contribute to elevated carbon emissions (Lei et al., 2023). Furthermore, the Delta concentration index is significantly negative in model (3) (−0.827, p < 0.01), indicating that population agglomeration at the microspatial scale mitigates the overall average carbon emissions. The advantages of a polycentric structure with high agglomeration are demonstrated in terms of urban-activity density, highlighting the positive effect of efficient land use on carbon neutrality. Furthermore, the control variables (Residential, Green, and Road) continue to demonstrate a significant effect on carbon emissions.
The indicators for centralization and concentration exhibit consistent directional effects across the decomposed direct, indirect, and total effects, all of which are significant at the 1% level. From the perspective of the centralization indicators, the direct effects of ADC(ln) and MWI are significant, indicating that the strong economic influence of local centers directly leads to an increase in carbon emissions in these areas. Additionally, the rising influence of neighboring centers also indirectly exacerbates local carbon emissions. This finding underscores the impact of higher traffic demand and greater energy consumption in economically dense urban core areas. Whether at the macro-regional level (or the micro-neighborhood level), core cities (or subdistrict centers) with strong economic influence not only increase local carbon emissions but also amplify the overall impact on carbon emissions across the entire province (or city). In terms of the concentration indicator, the Delta coefficient has a significant negative direct and indirect effect on carbon emissions. This suggests that the reduction in carbon emissions is influenced not only by the concentration of local activities but also by the highly concentrated spatial layout of surrounding areas. The more concentrated the distribution of local activities, the lower the carbon emissions, indicating that curbing unplanned urban sprawl can enhance the vertical efficiency of urban space utilization, reduce overall carbon emissions, and provide greater feasibility for increasing urban green spaces. In summary, spatial structures characterized by high concentration and low centralization also contribute to the external benefits of emission reduction in neighboring areas. As illustrated in Figure 9, the three-dimensional scatter plot more effectively depicts the varying centrality of the carbon-emission distribution. The average carbon-emission level of the green category (low centralization and high concentration centers) is generally low. In contrast, the average carbon-emission level of the blue category (high centralization and low concentration centers) is the most prominent (Table 5).
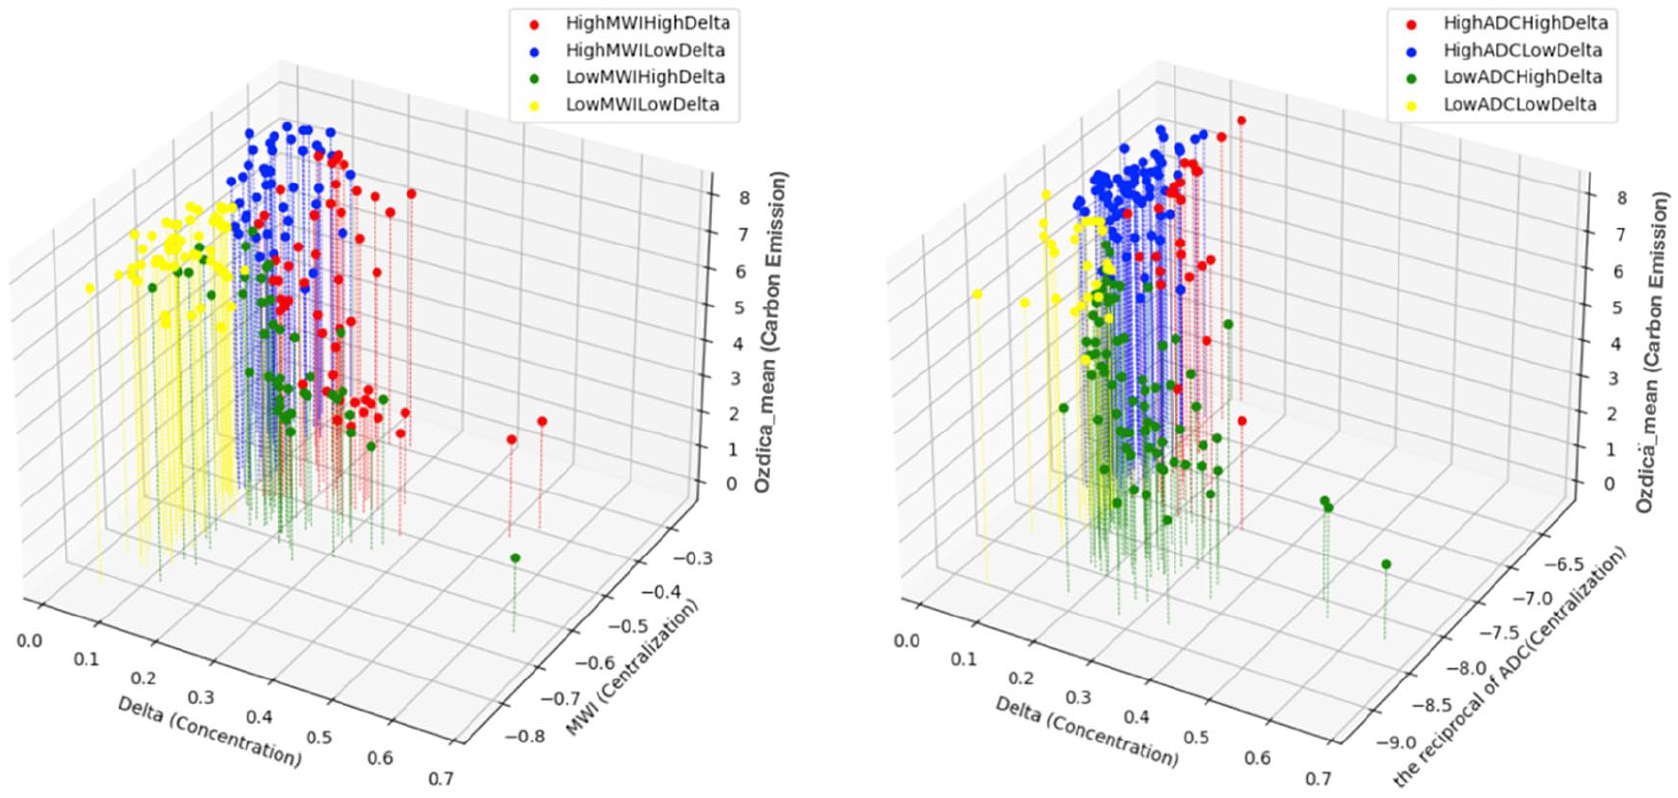
Distributions between carbon emissions, concentration (Delta), and centralization (MWI and ADC).
The SDM results of ‘centrality’.
Standard errors in parentheses. ***p < 0.01, **p < 0.05, *p < 0.1.
Heterogeneity tests (urban and ecological areas)
According to Beijing’s 3 functional-area distribution standards, the districts are categorized into urban functional areas (which include the “Capital Core Functional Area,” “Urban Functional Expansion Area,” and “Urban Development New Area”) and ecological areas (termed “Ecological Conservation Development Area”). The ecological subdistricts, maintaining a forest cover rate of over 66% and covering a total area of approximately 11,259 square kilometers, are classified as the ecological group. The remaining areas are categorized as the urban group for further heterogeneity analysis.
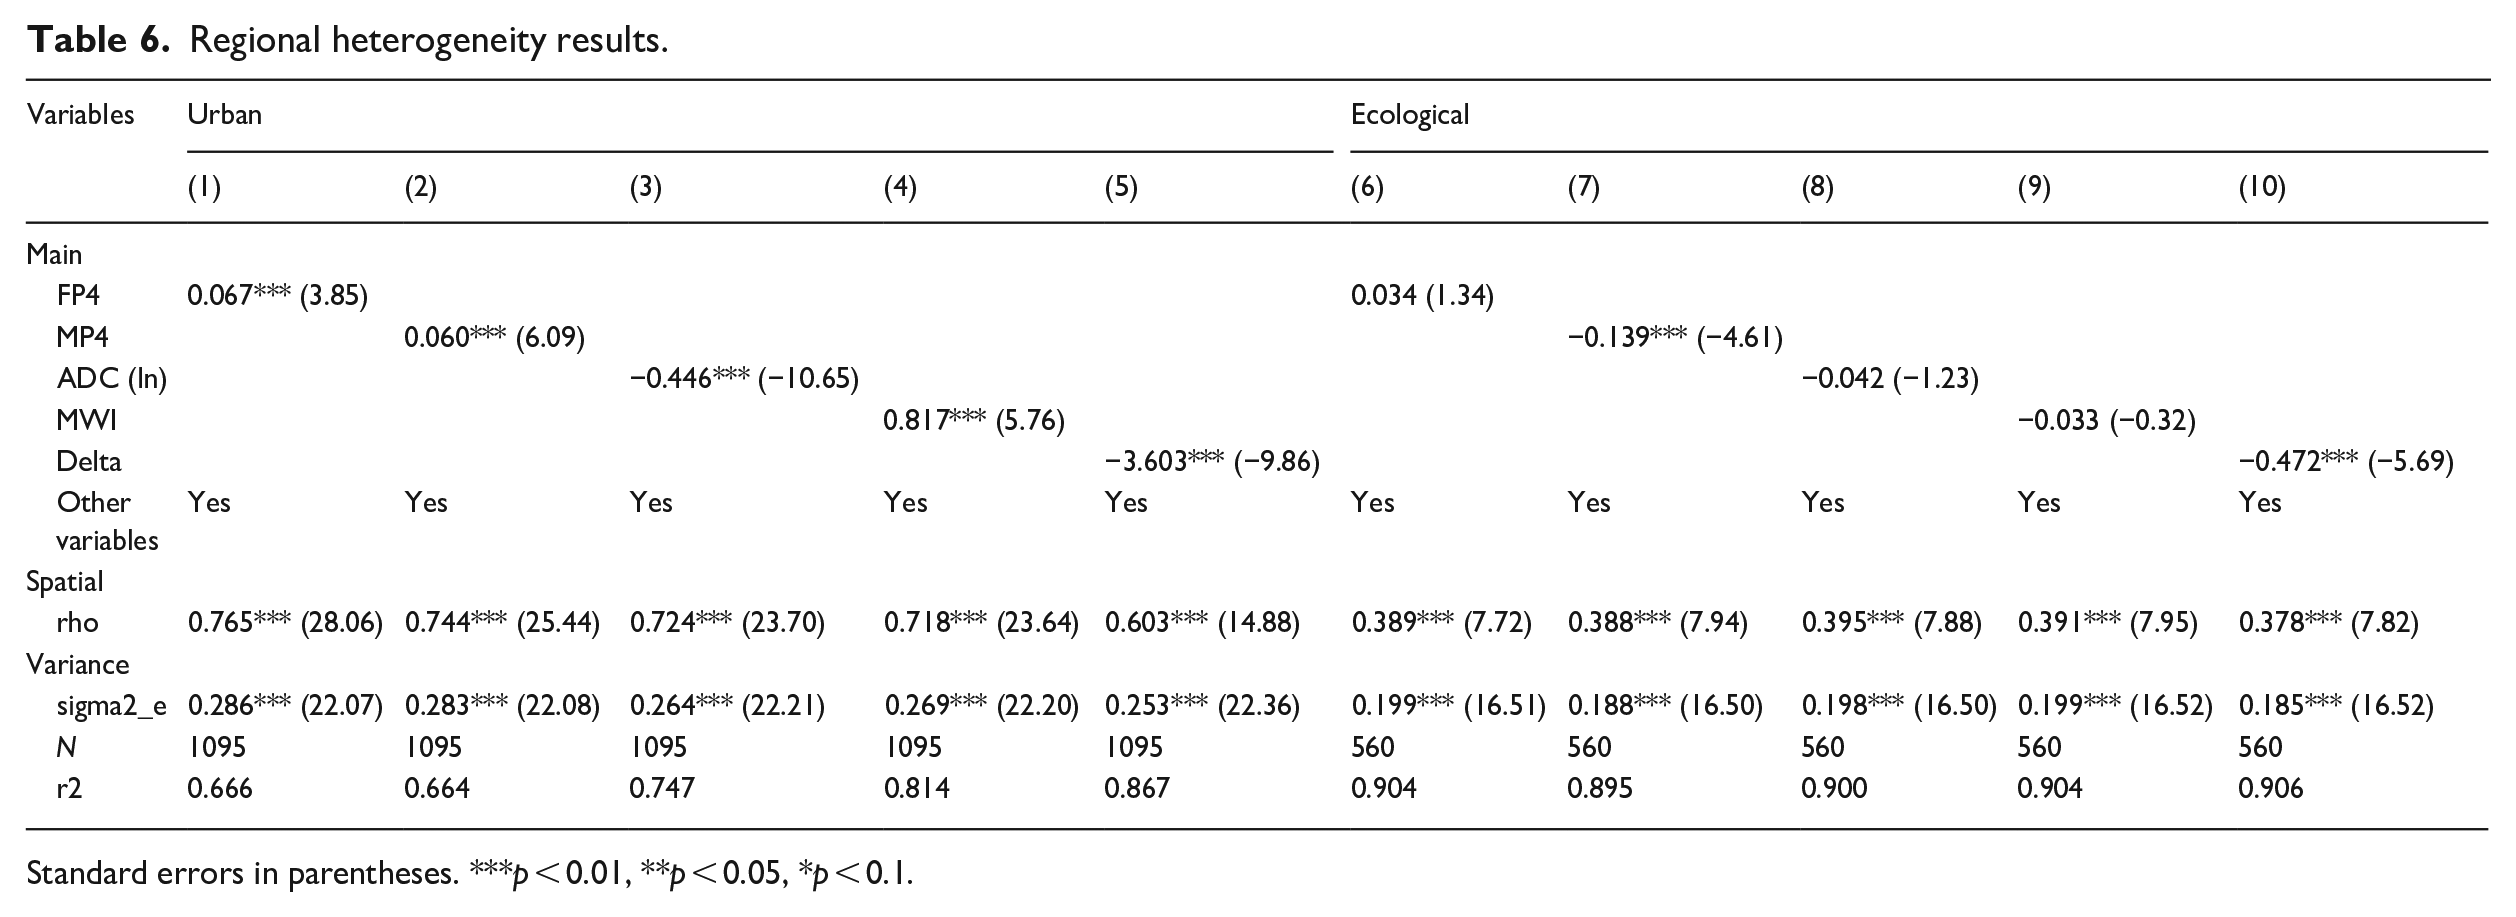
The analysis indicates that the regression results for the urban group closely match the overall regression outcomes (Table 6). However, MP demonstrates a distinctive positive effect. Specifically, within urban subdistricts, a monocentric pattern characterized by high concentration and low centralization appears to be more effective in reducing carbon emissions. In contrast, the regression results for the ecological areas show significant differences, with MP exhibiting a negative effect. This suggests that dispersed development of building land in ecological areas is more conducive to mitigating carbon emissions. Importantly, the multicentric structures in the ecological areas do not imply large-scale urban expansion or high-density development. The multicentric configuration observed in Beijing’s ecological zones can be described as a “lightweight” polycentric model. These centers serve scattered villages and towns, reducing the need for long-distance commuting by residents. Additionally, a high degree of concentration positively influences the reduction of carbon emissions. Thus, it is recommended that subdistricts within city areas focus on managing patterns of low centralization and high concentration, whereas ecological areas should consider a layout of “lightweight” concentration polycentric subdistricts. The robustness of these findings is underlined by consistently high values of the spatial-autocorrelation coefficient (rho) across all models, highlighting the significant role of spatial interdependencies in shaping the dynamics of carbon emissions.
Regional heterogeneity results.
Standard errors in parentheses. ***p < 0.01, **p < 0.05, *p < 0.1.
Discussion
This study explores the relationship between polycentricity and carbon emissions at the micro-scale. By utilizing micro-scale spatial data, we assessed the spatial structure of central nodes and polycentricity across subdistricts in Beijing, China. A spatial econometric model was employed to ascertain the impact of polycentricity on carbon emissions. The main conclusions of this study are as follows:
(1) The results indicate that a weakening of MP (or a trend towards monocentricity) is positively associated with an increase in average carbon emissions. Similarly, the expansion of FP with strong economic radiance is also correlated with an increase in carbon emissions. This finding contrasts with previous studies at the meso-scale, where strengthening polycentricity was found to reduce carbon emissions (Wu et al., 2023).
(2) In the relationship between centralization and concentration within spatial structures, it was found that lower centralization of local centers helps suppress the increase in carbon emissions, whereas higher concentration of activities within these centers is more conducive to emission reductions.
(3) The study identified significant positive spatial autocorrelation in carbon emissions. Moreover, the SDM model revealed that spatial effects are significant, indicating that the structure of central nodes have a notable spatial spillover effect on emission reduction.
(4) Regional heterogeneity tests showed that, unlike urban areas, lightweight high-concentration MP structures in ecological zones are more effective in reducing emissions.
This study highlights the critical role of finer spatial structures within cities in shaping emission reduction outcomes. Our research indicates that higher levels of centralization are significantly associated with increased carbon emissions. This relationship is primarily driven by the heavy reliance on transportation demand and energy consumption concentrated in dense urban cores. Mohajeri et al. (2015) supports this by demonstrating a superlinear relationship between carbon emissions and street networks, where the rate of carbon emissions growth in large cities surpasses the development of transportation infrastructure, yet remains less efficient than in smaller cities. This impact is not only evident within the centralized urban areas but also extends to surrounding regions through spillover effects. Conversely, compact and high-density central forms are more effective in reducing overall emissions. Specifically, urban areas with low centralization but high concentration of activities—where economic and social functions are distributed across multiple well-connected central nodes—are more effective at reducing carbon emissions (Li et al., 2019b). This configuration not only minimizes local carbon emissions but also generates positive spillover effects, leveraging the benefits of dispersed power and compact urban layouts to mitigate associated environmental drawbacks, benefiting surrounding regions. In summary, the findings advocate for controlling the morphological and functional dispersion of polycentric structures at the subdistricts while balancing activity distribution and optimizing functionality by adjusting the low centralization and high concentration of central nodes to reduce urban carbon emissions. Additionally, enhancing functional connectivity between central nodes across subdistricts can help diffuse the centralization of power in monocentric structures while maintaining the compactness of these central nodes.
Policy recommendations
Firstly, within the context of China’s rapid urbanization, at the micro-scale, a monocentric structure characterized by low centralization and high concentration proves more effective in reducing carbon emissions. The ultimate goal of such a spatial configuration is to achieve a more balanced polycentric structure at the meso-scale. In Beijing, this would involve creating low-centralization, high-concentration central nodes within each district while promoting a more equitable distribution of functions and decentralization of authority between districts. This approach not only aids in the effective control of carbon emissions but also enhances the city’s overall resilience and sustainability.
Secondly, as China enters a phase of high-quality development, there is an increasing demand for local governments to improve environmental governance. Green and low-carbon economic development is a crucial component of this high-quality growth. The literature demonstrates that the prevailing urban form in China is primarily geometric in nature, exhibiting a lack of sufficient clustering in terms of functional density related to production and living (He et al., 2019; Wei et al., 2023). This includes imbalances in the layout of activity spaces for “work, residence, business, and leisure,” as well as losses in other areas of social efficiency, which increase carbon emissions in sectors such as transportation. Therefore, future efforts should focus on restructuring the internal composition of urban construction land, reconfiguring existing land use to reduce inefficient and high-pollution areas. Concurrently, the intensification of land use should be aligned with the need to better serve the aggregation and balance of urban functions.
Thirdly, a systematic ecological network design is necessary to enhance the city’s overall ecosystem services. At the Beijing subdistricts level, increasing the continuity and coverage of green spaces can significantly boost the city’s carbon-sequestration capacity and provide residents with a higher quality of life. There is a need to further enhance the aggregation of urban functions and the balance in the spatial distribution of various production and living facilities. This will help mitigate the impact of urban spatial fragmentation on residents’ adoption of low-carbon transportation methods, thereby reducing the negative effects on carbon emission performance in surrounding areas (Zhang et al., 2018). The layout of urban green spaces and ecological zones should not be limited to isolated patches or point distributions.
Finally, the “lightweight” dispersed polycentric model exhibited in ecological areas helps reduce the need for long-distance travel and minimizes urban expansion to support local ecological-resource conservation, thereby mitigating the impact on carbon emissions. This “lightweight” polycentric approach, which integrates and addresses the direct needs of dispersed villages and towns, can also help maintain ecological integrity. However, significant spatial interdependence necessitates that the planning of urban and ecological areas should not be considered in isolation but should rather be viewed from the perspective of their cumulative impact on the environment.
Conclusion
In summary, the effectiveness of polycentric development strategies is highly dependent on the geographic scale at which they are applied. While these strategies can promote carbon neutrality at macro and meso scales, their effects at the micro-scale cannot be directly and simply replicated. It is necessary to reconsider the specific spatial dynamics and environmental trade-offs involved at this level. Urban planners and policymakers must take into account the unique characteristics of each spatial scale when designing polycentric development strategies, in order to balance the dual objectives of economic growth and environmental sustainability, particularly in the pursuit of long-term carbon neutrality. This study attempts to quantify the impact of a polycentric development model on carbon emissions at the micro-scale, thereby supplementing and expanding existing research on polycentric development strategies. However, the choice of Beijing as a case study subject, while representative of one of China’s major cities, limits the applicability of the findings to all cities, especially those with different economic structures, geographical features, and urban sizes. Furthermore, although this study employs high spatial-resolution carbon-emission data, such data are reliant on specific sources and calculation methods, which may introduce errors and biases. Moreover, the carbon-emission data cover only January, which may not fully capture long-term trends and cyclical changes. Therefore, to enhance the generalizability and depth of the research findings, future studies could extend to cities of different sizes and types to compare the impacts of polycentric development models on carbon emissions. This could assist in the identification of the most critical factors in different urban contexts.
Footnotes
Declaration of conflicting interests
The author(s) declared no potential conflicts of interest with respect to the research, authorship, and/or publication of this article.
Funding
The author(s) disclosed receipt of the following financial support for the research, authorship, and/or publication of this article: This research was funded by BK21 FOUR (Fostering Outstanding Universities for Research) [grant number 5199990314527].