
Abstract
Master plans are pivotal in strategising urban development, dictating land use, building height, and development intensity. These plans influence the spatial arrangement of urban infrastructure and activities, shaping the morphological and dynamic urban spatial structure. This study evaluates Singapore’s master plan’s effect on urban spatial structure, utilising data extracted from the master plan to project future land use and spatial interaction scenarios. By simulating the changing commercial floor space in different urban centres and its impact on commuting patterns, we evaluate the master plan’s impact on urban spatial structure and promoting polycentric urban development. Singapore’s master plan, with a clear vision towards polycentricity through the ‘Local hubs and global gateways’ strategy, is examined for its impact on urban spatial structure. The study uses urban mobility data and spatial network analysis to reveal how the master plan aims to decentralise development from the Central Business District (CBD) and distribute economic activities across various regions. Our findings indicate that regional centres and local hubs are becoming more autonomous while the CBD remains dominant. The results also highlight the importance of integrating morphological and functional polycentricity measurements and socioeconomic indicators to comprehensively evaluate urban development strategies. This study contributes to understanding urban spatial structure and offers practical insights for future urban planning.
Introduction
Master plans, while pivotal in strategising urban development, primarily dictate aspects such as land use, building height, and development intensity (Frey, 2003). Updated regularly to accommodate evolving urban development needs, the master plan is an idealised projection of a city’s future layout. On the other hand, urban spatial structure relates to the spatial arrangement of urban infrastructure and activities (Anas et al., 1998). The master plan, therefore, is instrumental in influencing this structure, guiding urban activities and their spatial distribution. Thus, the impact of a master plan on collective urban activities and the resulting dynamic urban spatial structure is essential for its evaluation (Chen et al., 2019; Clarke et al., 1998; Zhong et al., 2014). Among which, an ex-ante evaluation of potential development impacts is the premise of this study, where we utilise data reflecting the status quo and ‘data of future’ extracted from the master plan to project possible future land use and spatial interaction scenarios, revealing the dynamics of urban spatial structure through simulations of the changing commercial floor space in different urban centres and its impact on commuting patterns. Ultimately, this is followed by an ex-post manner assessment of the master plan, where changes in the benchmark of urban spatial structure in current and predicted situations will be tested against the claims or targets set in the master plan. By doing so, the study is able to assess the master plan’s effectiveness pre-implementation rather than post-implementation. In short, this study aims to simulate urban spatial structures, especially in the context of polycentric cities characterised by multiple urban centres enshrined in many master plans (Adolphson, 2009; Han, 2005; Masip-Tresserra, 2017), as part of a planning support systems to assess the master plan’s effectiveness.
Singapore’s master plans, initiated in 1955, have evolved. From enhancing urban living conditions to addressing overcrowding with satellite towns, the focus has shifted towards inclusiveness, liveability, sustainability, and economic vibrancy (Wu et al., 2024). Central to these objectives is adopting a polycentric urban model (Han, 2005; Hou, 2019; Yuen, 2009). Given the master plan’s reliance on land use planning and development density control, it should inherently address how the proposed measures will alter the morphological urban spatial structure and the criteria for evaluating these changes. Between the deliberate morphological emphasis of Singapore’s master plans and the burgeoning realm of quantitative urban planning, there lies an intersection of theory and application. As Singapore’s urban planning strategy has pivoted over the years, so have the tools available to assess and forecast its impacts. The growing usability and applicability of quantitative methods in planning support systems are aided by the advent of various urban simulation techniques, such as network analysis and spatial interaction models, and the increasing availability of diverse urban data types (Harris et al., 1993; Mueller et al., 2018; Wu et al., 2021).
Harnessing these advancements, this study seeks to leverage current data and geospatial modelling technologies to simulate the master plan’s impact on the dynamics of urban spatial structure and assess the master plan’s effectiveness in promoting polycentric urban development. Furthermore, the evaluation of the master plan is grounded in a polycentric structure derived for both current and anticipated future scenarios. It unveils how the master plan can transform the urban spatial structure regarding commercial distribution and human activities, with Singapore serving as a case study. The overall assessment relies on quantifying polycentricity, which involves assessing the balance and distribution of urban masses and activities across these centres. It reveals that Singapore has employed a distinctive strategy for polycentric urban development with a dominant central business district and burgeoning regional centres.
Background
Urban spatial structure for planning evaluation
Urban spatial structure describes the spatial distribution of morphological urban elements and their underlying interaction (Anas et al., 1998; Krehl, 2015; Sohn, 2005; Wu et al., 2021). It is often regarded as part of urban morphological studies, which study urban form (Chen et al., 2015). Urban spatial structure is an essential description of the urban built environment. It combines the static urban form with dynamic urban activities to allow a more comprehensive understanding and analysis of the city (Chen et al., 2019; Zhong et al., 2014). Depending on the different data types, the morphological aspect of urban spatial structure could be presented and described using density attributes. Examples include the spatial distribution of population, building, and employment density to reveal the spatial pattern (Arribas-Bel and Sanz-Gracia, 2014; Liu et al., 2016; Taubenböck et al., 2017), whether it is compact or dispersed; polycentric or monocentric. In contrast, the dynamics of the urban spatial structure are often described using spatial interactions like the commuting network flow (Gao et al., 2013; Liu et al., 2016; Sarkar et al., 2020) and are often considered a reciprocal result of the physical built environment. With the city going through a rapid transformation and becoming ever more complex, the two aspects of urban spatial structure, the physical form and its dynamics, could provide a more holistic view of the built environment.
There are two essential steps to show the urban spatial structure: the urban centres need to be identified, and the balance between these centres is measured using polycentricity. Zhong (2014, p. 2183) developed a spatial network approach with traffic movement data ‘for detecting urban hubs, centres, and borders as well as changes in the overall spatial structure’. The transport data is constructed into a traffic network and undergoes network community detection. The traffic flow is the edge, and the volume is the weight forming a weighted and directed network. Thus, the Infomap approach developed by Rosvall and Bergstrom (2008) for community detection is adopted in her approach due to its capability of handling directed and weighed networks and good performance (Lancichinetti et al., 2009). This process divided Singapore into different urban clusters based on their interaction and identified their boundary. Data from different periods were used to show the changes in urban clusters and their borders. They claimed Singapore’s polycentricity has increased; the urban spatial structure aligns with the concept plan. However, her study does not explicitly introduce and measure polycentricity as a critical way to show the urban spatial structure.
A similar spatial network approach has been adopted in other studies. Liu (2015) explored the taxi travel data in Shanghai and showed how travel distance variation could result in different urban structures. Their research exemplified the possibility of the spatial network approach to reveal the dynamics of urban spatial structure for urban analytics. The urban centres identified and the urban spatial structure generated from the urban mobility data could be used for further studies, such as measuring polycentricity and evaluating the urban transformation process. However, existing studies primarily focused on the status quo with limited attempts to apply this technology to predict future scenarios, especially considering the urban master plan, which is set to alter the urban spatial structure. Hence, this study identified the opportunity to use the network-based community as the unit of analysis to evaluate the master plan’s impact on the urban spatial structure.
Measuring urban polycentricity
Existing literature suggests that Singapore has been actively moving towards a polycentric urban structure with polycentric urban development as a long-standing and vital planning strategy. Urban polycentricity, a crucial facet of urban spatial structure, refers to the plurality of centres (Meijers, 2005). Polycentricity entails pinpointing urban centres and analysing the balance between them (Derudder et al., 2021). Despite its frequent use, the concept of polycentricity presents significant challenges in terms of its definition and measurement, which various studies have exemplified varying approaches. For example, Meijers (2008) discussed the lack of ‘conceptual clearness’ in polycentricity. Cabrera-Arnau (2023) echoed such a claim with fuzziness in defining a polycentricity and sought to address this with human mobility patterns. For simplicity, we stick to Green’s (2007) and Burger’s (2012) summary of two types of polycentricity. Morphological polycentricity deals with the sheer size balance of the centres, while functional polycentricity deals with the interaction balance between these centres. Different forms of urban mobility data often represent the interaction. Among these, morphological polycentricity is more commonly observed in urban studies.
Scholars have proposed various ways to measure polycentricity. The primacy measure, which reveals the relative importance of the top urban centre in a system, is one straightforward measurement particularly relevant for researchers interested in a single large centre within a monocentric urban spatial structure (Derudder et al., 2021). The concept of primacy can be linked to the ‘Primate city’ literature, which explores the dominant role of a single leading city in a country or region. A rank-size distribution is commonly employed for more complex measurements of the overall urban structure, with urban centres plotted by their ranking and size (Meijers, 2008; Wang et al., 2019). This study also acknowledges other means of measuring morphological polycentricity, such as calculating the standard deviation of urban centre sizes (Green, 2007; Liu and Wang, 2016). Although these various types of measurement may yield different numerical results, they consistently show similar trends of polycentricity in a city (Derudder et al., 2021). While the measurement of polycentricity has been explored on paper, it is also becoming more frequently used in practice to describe and monitor the degree of polycentric development (Liu et al., 2016; Wang, 2021). Continuing the trend of monitoring polycentric development using polycentricity, this study combines network community detection with polycentricity measurements to comprehensively evaluate Singapore’s master plan. The proposed approach aims to identify urban clusters and quantify their functional and morphological polycentricity, contributing to urban spatial structure and polycentricity literature by providing a methodological framework for future urban planning evaluations.
The Singapore master plan and polycentric urban development
Singapore is famous for its systematic and effective urban planning and development as a city-state. Urban Development Authority (URA) is the government agency responsible for the planning process. The concept plan sets the broader strategy for Singapore’s long-term urban land use and transportation development (Yuen, 2009). As an island state with limited land supply, it secures the land needed for the next 50 years. Meanwhile, guided by the principle of the concept plan, the master plan is a land-use plan with detailed development intensity that guides Singapore’s development in the medium term over the next 10 to 15 years. The master plan is reviewed and released every 5 years to reflect the latest needs for developing Singapore and the ambitions of the concept plan. The planning also focussed on long-term sustainable urban growth, with polycentrism being one of the main themes to address the new urban demand by creating regional commercial and business centres to generate job opportunities. Please see the Singapore Master Plan 2019 section of the Supplemental Materials for detailed information about the details of the most recent master plan of Singapore.
Despite Singapore’s comprehensive planning efforts, there is a lack of in-depth analysis combining the morphological and dynamic aspects of urban spatial structure within the context of polycentric development. This gap makes Singapore a compelling case study for examining urban simulations within planning support systems and their capability to monitor shifts in both physical form and spatial interactions. This research investigates Singapore’s urban planning strategy by focussing on its well-established approach to polycentrism integrated into the master plan. Specifically, we use quantitative methods to simulate and analyse the impact of the master plan on urban spatial structure. Our approach involves leveraging current data and geospatial modelling technologies to predict future land use and commuting patterns scenarios. By employing network community detection and spatial interaction models, we identify urban centres and their boundaries and measure the polycentricity of current and projected urban structures. This study aims to provide a detailed evaluation of how the master plan influences commercial distribution, human activities, and overall urban dynamics, ultimately enriching the urban planning process with empirical insights and methodological advancements.
Data & methods
A current and future scenario of the urban spatial structure needs to be produced for comparison to evaluate the impact of a master plan. As illustrated in Figure 1, This study first consolidates data from various sources for the current scenario, which is regarded as the ground truth when all the data are collected. These data include census data like commercial floor space, population, and commuting trips to reveal the dynamic aspect of the urban spatial structure. All the census data are publicly available on the Singapore open data platform. We also derive the future commercial floor space from the master plan and simulate future commuting trips, as shown in Figure 1(a). This part is the ex-ante simulation. In the second step, we introduce the primary method of detecting the urban spatial structure by measuring polycentricity. A network community detection method is adopted to detect the different urban centres in Singapore, illustrated in Figure 1(b). The urban centres are dynamic with changing membership and boundaries. Next, morphological commercial floor space and the dynamic commuting flow are aggregated to the urban centres to measure polycentricity, which eventually reveals the morphologic and dynamic of the urban spatial structure. A total of five different measurements of polycentricity were adopted to assess the execution of the policy in an ex-post manner. Please see the Data Processing section of the Supplemental Materials for detailed information how we preprocessed the census and commuting data. Framework.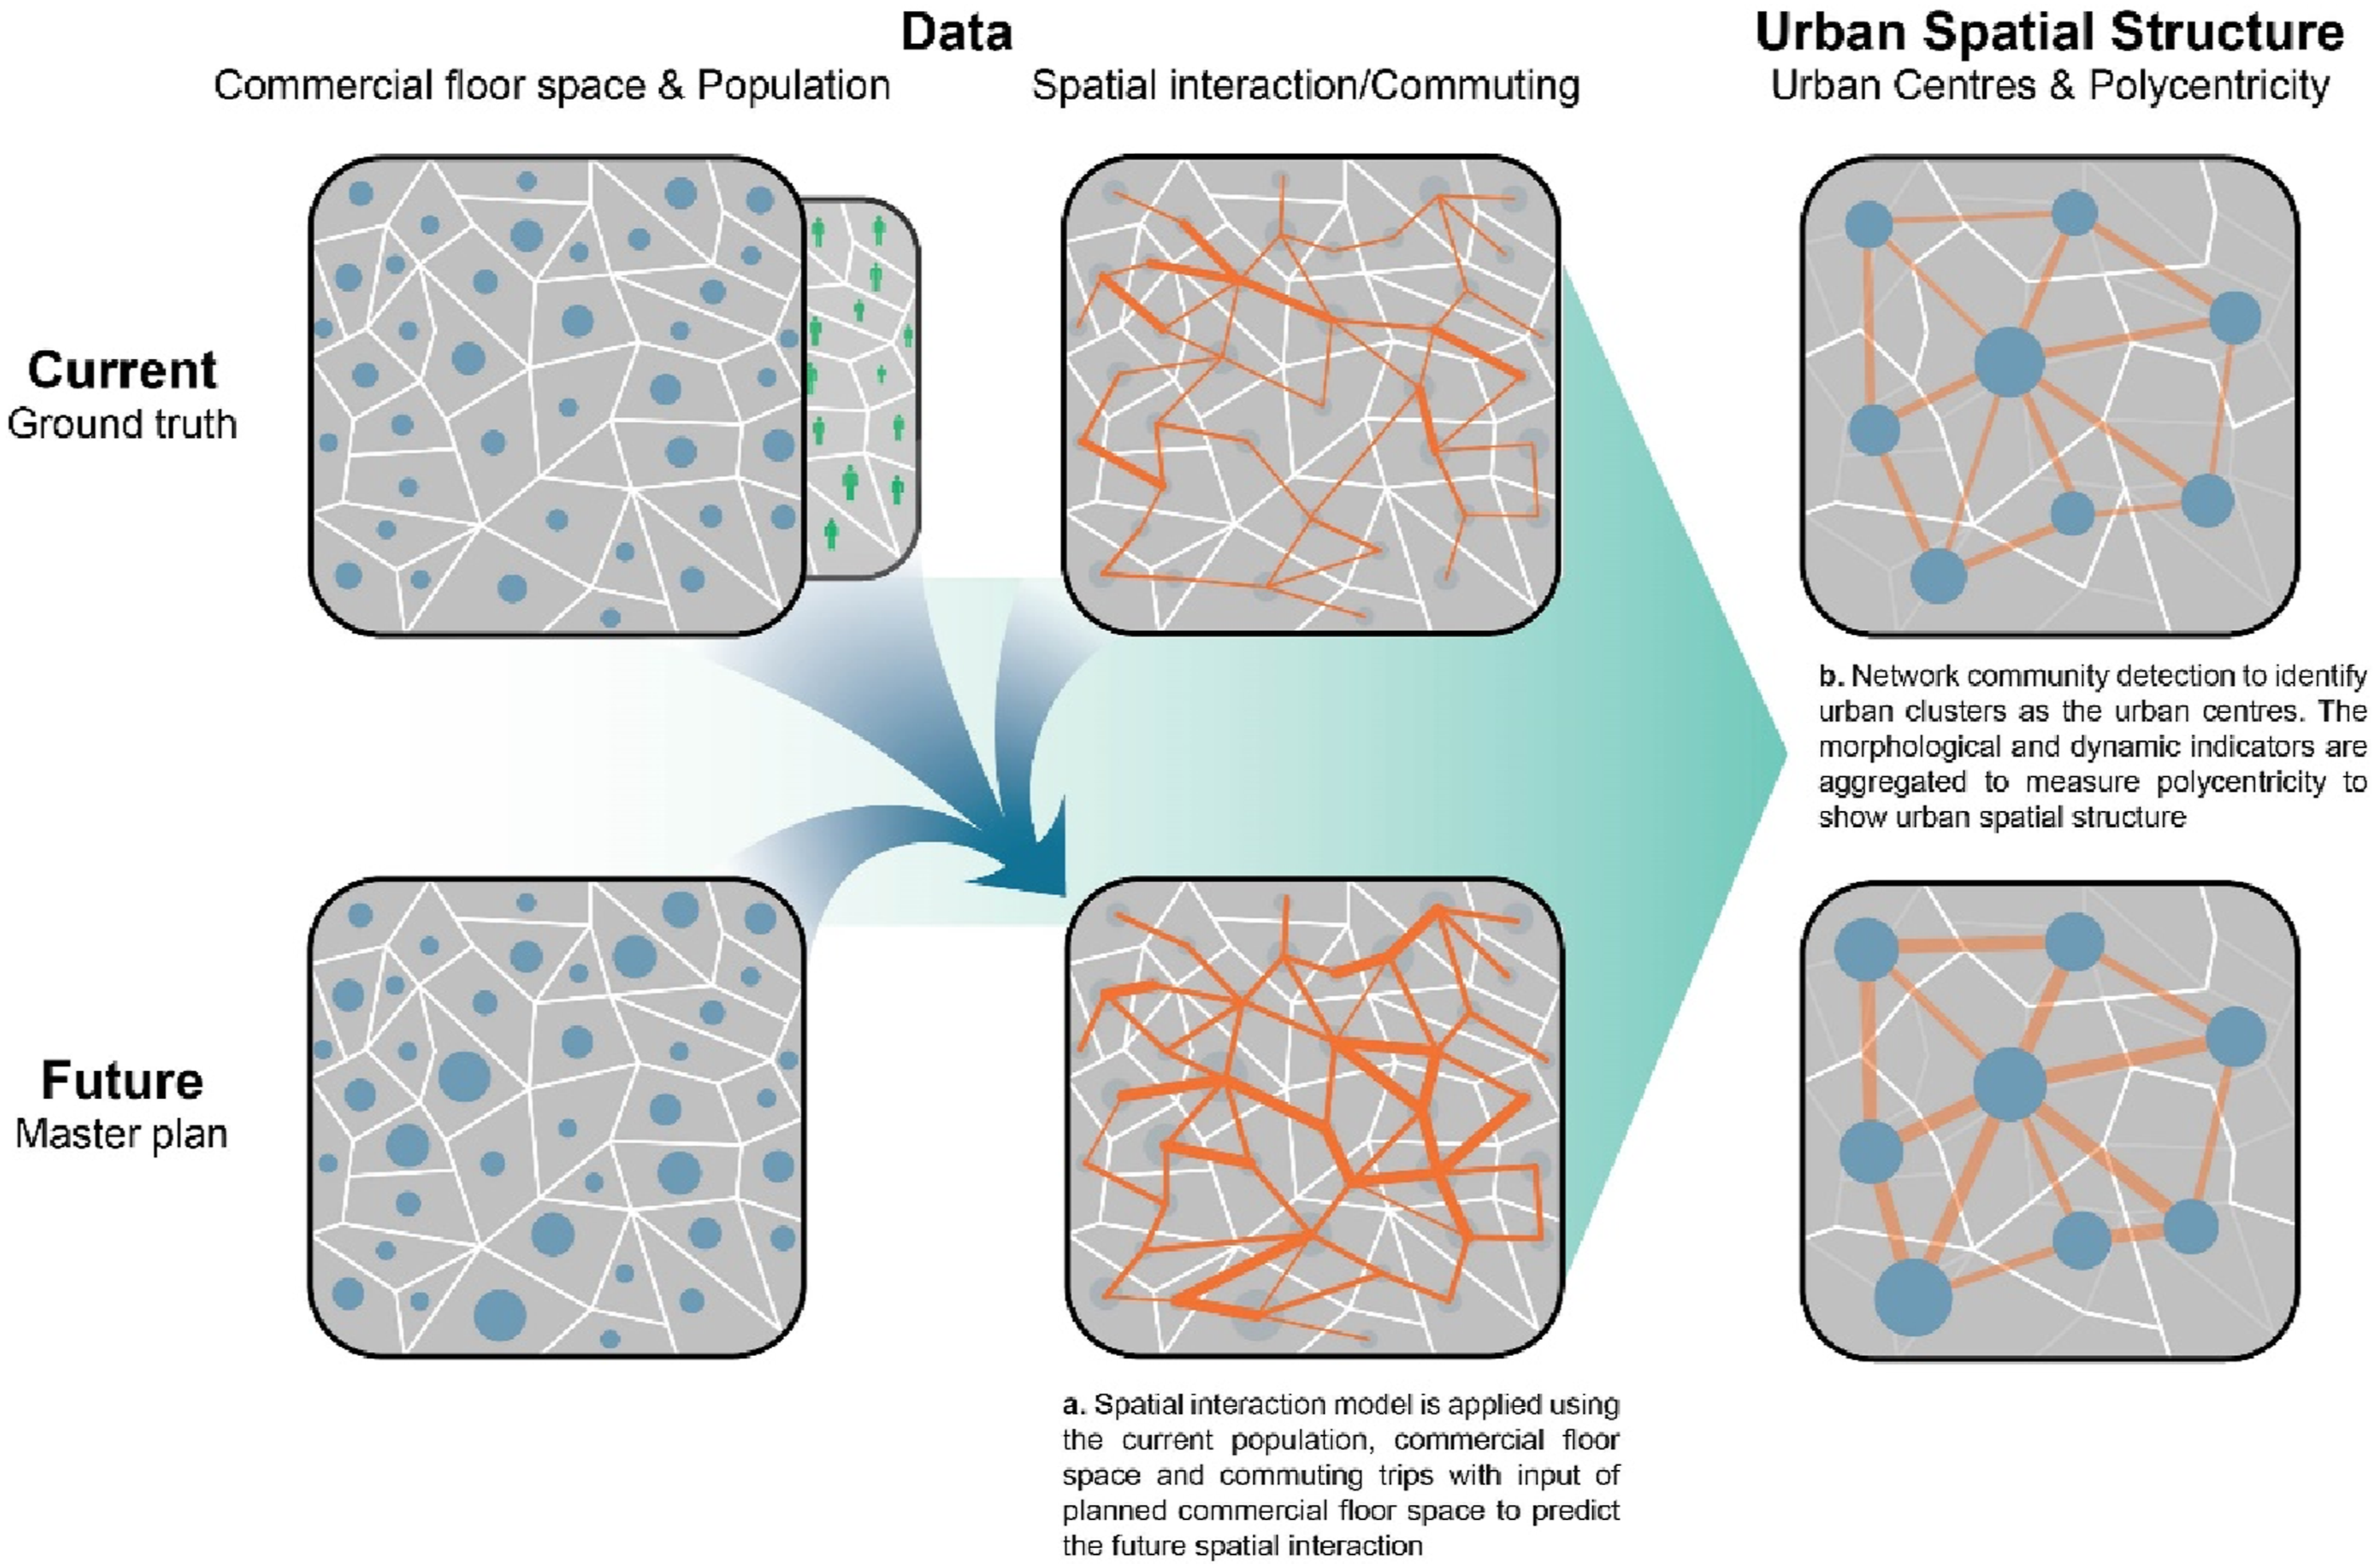
After preparing the necessary data, we introduce our proposed method to analyse the master plan by measuring its resulting urban spatial structure. The urban spatial structure referred to in our study is more than just the distribution of morphological elements, like commercial floor space in this study, but also its dynamics represented by the spatial interaction network. Simply put, the urban spatial structure is first represented by identifying urban clusters with their boundary determined by the spatial interactions. We assess the urban spatial structure by indicators relevant to the master plan intention: density, job-housing balance and mixed-use. Second, both the morphological and functional polycentricity of the urban spatial structure measure the balance of distribution of urban mass and interactions between the urban centres.
Determine the urban centres and their boundary
First, the fundamental unit of urban spatial structure is represented by urban clusters constituted by the subzones based on their spatial interaction. Using a network community detection algorithm introduced in detail in the next paragraph, the spatial interaction network between the subzones is simplified and grouped into clusters. The resulting clusters indicate the solid relationships and interactions between the subzones in the cluster. Thus, the resulting urban clusters and the spatial interaction provide a dynamic perspective of the urban spatial structure. Among the many network community detection methods, the infomap methodology is selected for this study for two primary reasons. First, the spatial interaction network in this paper is a directed and weighted network that many other network detection methods do not support. Second, existing literature has shown that the map equation applied in the infomap community detection method provides good results in our case as it focuses on the flows of the network for determining the urban clusters (Zhong et al., 2013). Rosvall, Axelsson, and Bergstrom’s paper (2009) provide a more detailed description of the map equation and algorithm.
This study regards the urban clusters detected as the urban centres that recognise the global gateways and the local hubs. These urban clusters are the unit of analysis, and data are processed at the cluster level for further research on the impact of the master plan on urban spatial structure. More specifically, this study looks into six indicators: commercial floor space, residential floor space, Nodality, development density, mixed use index and employment housing ratio. Commercial and residential floor spaces are aggregated floor spaces that indicate the cluster’s employment and population. Nodality (Burger, 2012) is the aggregated flow of people from outside and within the cluster. Development density measures the ratio of commercial floor space to the building footprint, reflecting the changes in the concentration of buildings. Mixed use index is given by the entropy of the different land use (commercial, industrial, and residential) in the cluster,
Urban spatial structure by polycentricity
The higher level urban spatial structure is measured using polycentricity. We have proposed several different measurements of polycentricity using two indicators. The two indicators are the amount of commercial floor space and nodality. Commercial floor space provides the space’s capacity to handle urban activities and indicates how the physical infrastructure is distributed around Singapore. Nodality is the number of commuting trips directed to the specific urban cluster (Burger et al., 2012), including internal commuting trips and trips from other urban clusters. They are a good proxy for urban activities and can measure the distribution of urban activities in the city.
Five measurements of polycentricity are selected. They can be categorised into two kinds of measurement: the rank-size method and the standard deviation method. The rank-size method, P1, P2, and P3, sometimes known as Zipf’s law (Zipf, 2016), is a way to understand the distribution and hierarchy of urban centres within a metropolitan area or urban region (Batty, 2006; Burger et al., 2014). Meanwhile, the standard deviation method, P4 and P5, uses the standard deviation of the size of urban centres to indicate polycentricity (Derudder et al., 2021; Green, 2007). The different measurements capture various aspects of Singapore’s urban spatial structure. For example, preliminary research shows Singapore has a very prominent CBD. Hence, the primacy, P1, under the rank-size method is an excellent option to show the spatial structural relationship between the CBD and the rest of Singapore. The overall polycentricity of Singapore’s urban spatial structure is measured using the other rank-size methods and standard deviation methods. The greater the value, the more polycentric the urban spatial structure. The details of these measurements are provided in Table S1 of the Supplemental Materials.
Results & discussion
The results are shown in two perspectives. First, the subzone clusters identified as the urban centres and their changing membership are mapped. Second, this study further reveals the urban spatial structure by measuring polycentricity using two indicators: commercial floor space and nodality. Both the current and future scenarios are shown in parallel to analyse the impact of the polycentric master plan.
Identifying urban centres of Singapore
Using a spatial interaction network constructed from the commuting data, this study has detected the urban clusters and their boundaries for current and future Singapore envisioned in the master plan. These serve as the urban centres to reveal the urban spatial structure, grouping 303 out of 323 subzones into different groups. Twenty subzones, mostly nature reserve sand offshore industrial parks, are neglected because they are not included in the spatial network, with no commuting flow in or out. A name is assigned to respective urban centres for easy illustration and comparison. The results are illustrated in Figure S3 and Figure 2. Although the urban clusters in the present and future scenarios are very similar in composition, our simulation still predicted several changes. Details of Current and future urban clusters.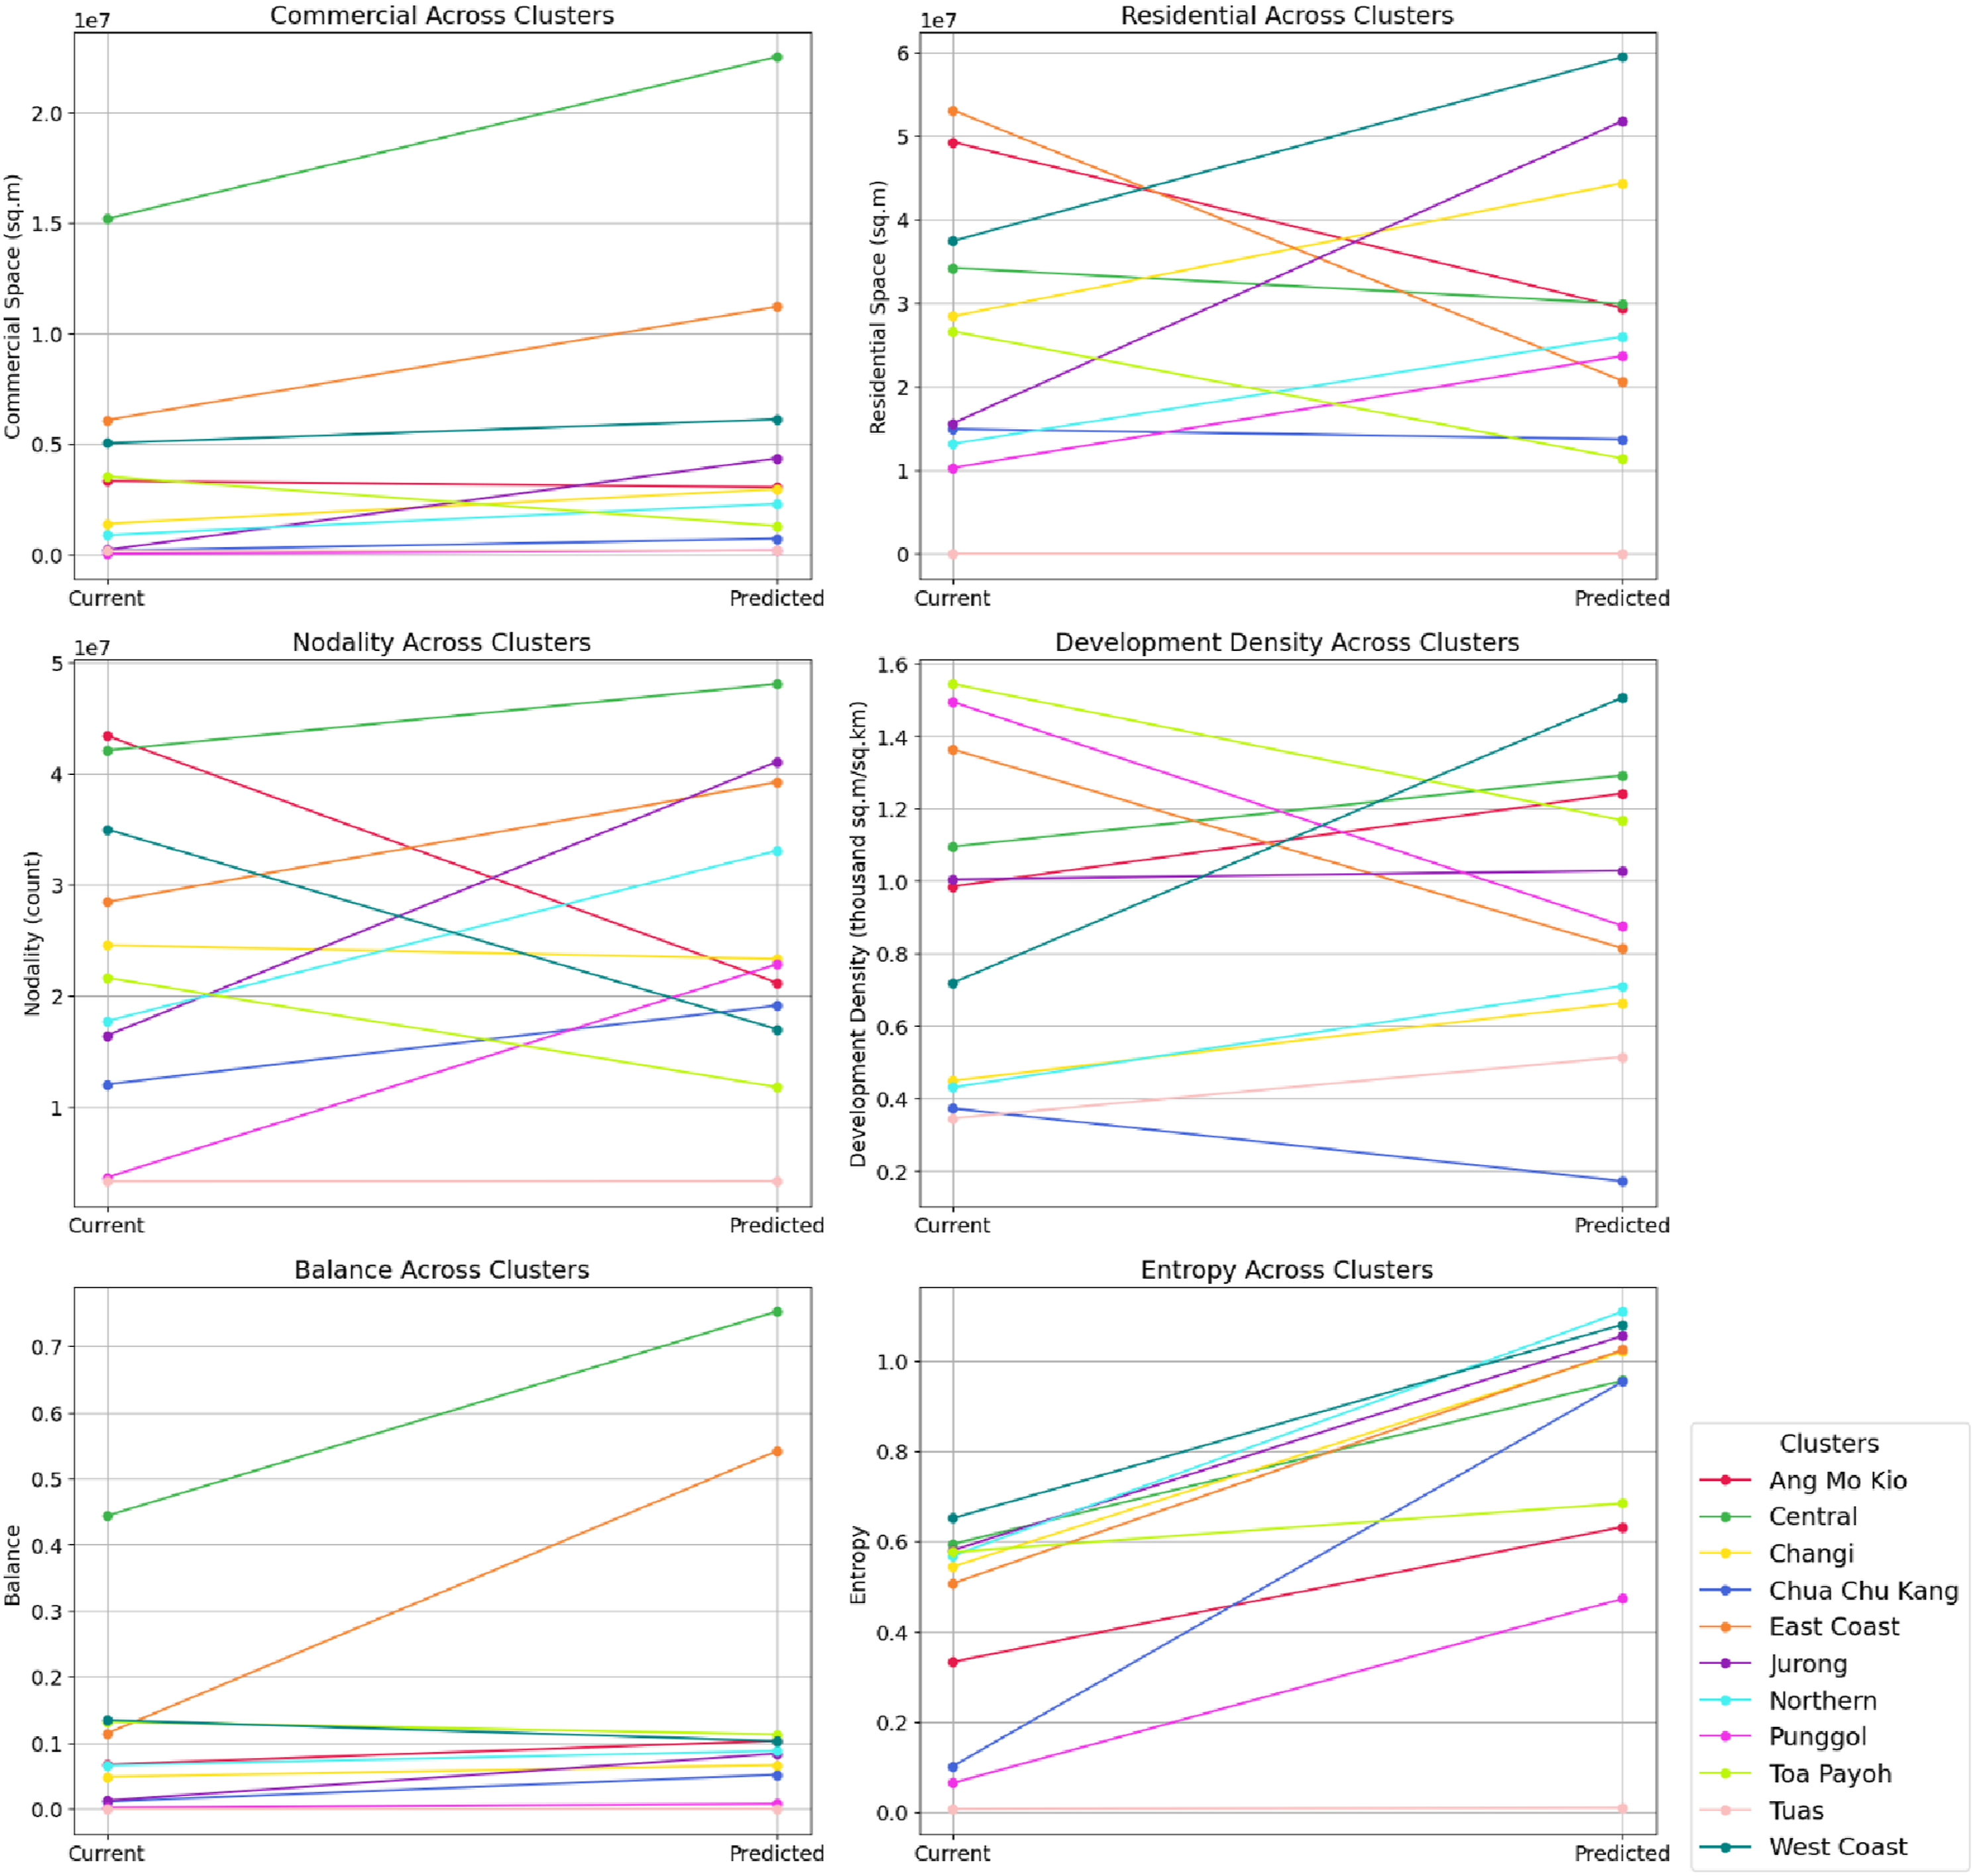
In Figure S3, the first change is the absorption or merging between urban clusters. The northern and woodlands clusters have been merged. This indicates that the connection between the Woodlands regional centre and the rest of the northern gateway has grown stronger. The second change is the increasing prominence of the regional centre; the urban cluster where Jurong and Tampines regional centres are located expanded significantly. The regional centres have attracted several neighbouring subzones, indicating a stronger socioeconomic relationship could have been forged. Their urban cluster territory is more clearly defined in the future prediction, serving their intended function in place as planned. Finally, the local business and commercial hubs have also grown more self-contained: the Punggol digital district, as one of the highlights in the master plan, has absorbed its neighbouring subzones, serving its intended function as the regional hub. Similar trends can be observed for the West Coast and East Coast clusters; the neighbouring subzones, which contain several business centres and industrial parks, have been absorbed.
Figure 2 offers a detailed look into Singapore’s urban clusters regarding selected metrics. The commercial floor space across various clusters highlights the impact of the master plan. Meanwhile, the CBD at the Central and the neighbouring East and West Coast urban clusters continue to grow in commercial importance. Substantial commercial development is also evident in the global gateways such as Jurong in the west, Changi in the east, and the Northern clusters near Malaysia. These areas all saw an increment in commercial floor spaces, aligning with the strategy to decentralise economic activities from the CBD and promote regional development. Residential space trends further illustrate this balancing act, with the Central and East Coast clusters showing a decrease in residential capacity as more people are drawn to emerging hubs, except for the West Coast, where more residential area is observed.
In contrast, clusters like Jurong and Changi are increasing their residential capacity, aiming to balance work and living spaces, which is crucial for the success of the local hub strategy. Nodality, representing the flow of people, experienced the growing significance of the Northern Central, Jurong, East Coast and Punggol clusters and Jurong. Most global gateways are among the clusters attracting more flows, except for Changi, which experienced a minor decline. However, this result may not account for the well-established international travel network, particularly from Changi Airport. Development density-wise, it is more difficult to draw clear trends from the pattern because the change in the boundaries of the urban clusters may significantly affect the overall density. For example, Chua Cho Kang, Toa Payoh, and Punggol saw a decreasing density with a significant change in boundary and sizes.
Nevertheless, patterns reveal increased concentration in commercial spaces across clusters, especially in more established commercial hubs like the Central cluster. The employment-housing ratio has increased from an average of 0.091 to 0.174; however, this increase is largely due to the predominance of employment opportunities in the Central and East Coast region, underscoring their roles as major economic centres. Meanwhile, other clusters maintain a constant job-housing balance with a slight increase. The mixed-use index, or entropy, has increased from 0.425 to 0.818 on average across the urban clusters, indicating a more balanced mix of commercial, industrial, and residential uses, aligning with the master plan’s goal of creating vibrant, self-sustaining local hubs. With the exception of Tuas, which focuses on ports and industries.
In conclusion, the master plan’s outlined global gateways, their affiliated regional centres, and several major local business hubs are distinguishable within these urban clusters. Local hubs like East Coast, West Coast, Ang Mo Kio, and Toa Payoh have clarified their roles in commercial and employment centres. This suggests the master plan’s potential efficacy in directing Singapore’s urban development. Regarding the urban morphological hierarchy of current and projected structures, while the dense CBD remains paramount, regional centres and other local business hubs are growing more autonomous. However, it is still tough to evaluate the overall changes in urban spatial structure solely based on the current metrics, which show diverse and complicated trends. Thus, an in-depth assessment of the urban spatial structure’s evolution by the polycentricity is crucial for a holistic understanding of the master plan’s impact.
Urban spatial structure by polycentricity
Polycentricity results.
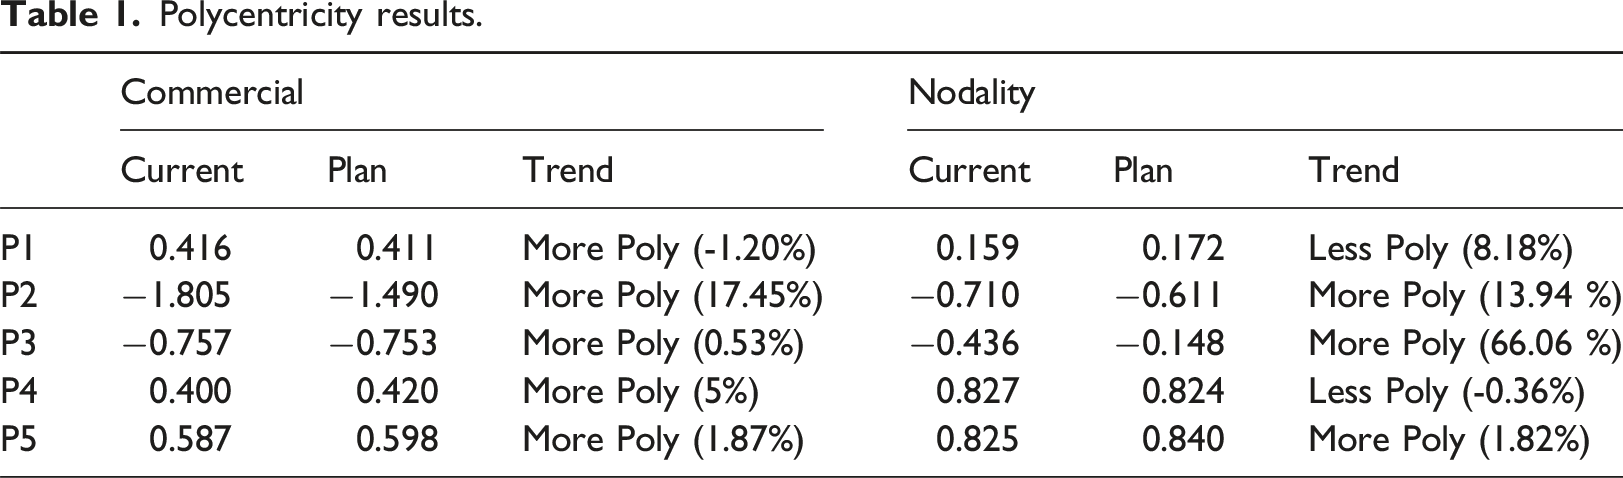
This study first tested the primacy of the CBD in Singapore. Our results show that although the central cluster has a reduced area and population, its primacy (P1) in commercial floor space largely remains unchanged, with a slight decrease from 0.416 to 0.411. This means the traditional CBD will be more densely built in the future and continue to be the most prominent centre for Singapore, with more than 40% of the commercial floor space concentrated here. Contrarily, the primacy of nodality for the central cluster has increased, signifying that the traditional CBD is projected to attract more people and encourage urban activities. Specifically, the primacy rose from 0.159 to 0.172. The differing trends between these two indicators can be attributed to the CBD’s historical momentum and agglomeration effect. Retaining its role as the financial and business hub for Singapore and the larger Asian region, the CBD, while accounting for over 40% of the commercial floor space, only represents less than 20% of the commuting flow. This discrepancy might suggest that the high concentration of infrastructure and urban development in the CBD attracts urban activities that are not solely represented by commuting trips. Additionally, the availability of alternative transportation methods for short internal trips in the CBD reduces the reliance on public transport. Regardless, morphologically and dynamically, the CBD remains the dominant centre of Singapore in both current and projected scenarios.
Examining Singapore’s polycentricity, our findings present varied observations based on different measurements and indicators. The degree of polycentricity for the commercial floor space has seen an uptick across all metrics, indicating a more even distribution of physical urban infrastructure. In particular, 4 out of 5 polycentricity measurements for commercial space change by less than 5%, P3 and P5, which only considered the top four urban clusters, have lower increments than P2 and P4, which considered the entire urban system. This disparity means the increase in polycentricity by commercial space is likely to be brought by the additional mass in non-primary clusters. This suggests that the master plan’s emphasis on polycentric development is taking shape, with a diminishing disparity between the central cluster and other urban clusters. This could reflect the master plan’s strategy to bolster regional centres and local business hubs, making them more self-sufficient. Additionally, three out of five measurements showed increased polycentricity for nodality. This suggests that the master plan’s commercial floor space distribution regulation might influence urban spatial patterns effectively.
A careful evaluation of the significance of the observed changes in polycentricity, especially for nodality, suggests nuanced insights. While the overall trend points towards increased polycentricity, nodality is contracting, with P2 and P4 showing significantly lower increments than P3 and P5. This means the rebalancing of interactions is mainly between the top urban clusters, with P3 with a substantial nodality change rate of 66.06%, while P2 only recorded a change rate of 13.94. A similar trend can be observed for P4 (−0.36%) and P5 (1.82%). However, caution is advised when interpreting these results, primarily the P4 result, which hints at a more monocentric trend for Singapore. These disparities suggest that while the master plan aims to foster a more polycentric urban structure, the actual influence on human dynamics might be more modest and varied than anticipated. Moreover, this observation is based solely on the master plan’s rationale, without making assumptions about economic or other social activities. The gravity model’s redistribution of commuting trips to planned centres does not infer potential travel modes or behaviours. Hence, our focus remains on assessing the master plan’s effectiveness in consolidating a polycentric structure.
Lastly, as illustrated through different measures, the evolution of Singapore’s overall polycentricity yielded varied outcomes. The rank-size (P2 and P3) and standard deviation techniques (P4 and P5) depict Singapore transitioning towards stronger polycentricity. However, the rank-size method foresees a more pronounced increment, indicating its heightened sensitivity to distributional changes. This draws attention to potential variances arising from different methodologies. As with differing urban centre definitions used in diverse studies (Burger et al., 2014; Derudder et al., 2021; Wu et al., 2021), multiple measuring techniques offer urban researchers avenues to narrate distinct research narratives according to their research objectives.
Discussion and conclusion
Our case study’s primary objective is to discern how polycentrism, especially as enshrined in the ‘Local hubs and global gateways’ policy, is mirrored in Singapore’s master plan. This policy, deeply embedded in polycentric urban development, aims to foster regional hubs for business and commercial activities. Our findings show that the current commercial floor space predominantly aligns with urban centres and business hubs delineated in the master plan. The master plan also envisages substantial commercial floor space around the CBD and other regional centres. This adherence to physical infrastructure planning aligns with the master plan’s intent, reinforcing its potential effectiveness in manifesting the ‘Local hubs and global gateways’ policy.
Analogous master plan strategies have been observed in other rapidly urbanising regions, notably China (Cheng et al., 2018; Schneider et al., 2015). However, some of these strategies have faced critique for overextension, leading to underutilised ‘ghost towns’ that might stymie economic progress (Shi et al., 2020; Su et al., 2020). The political and speculative dynamics underlying urban development underscore the importance of a scientifically grounded planning methodology. Singapore’s decentralised approach has proven efficacious (Yuen, 2009; Zhong et al., 2013). Our analysis corroborates the viability of the master plan’s reflection on polycentric development.
An intriguing observation is that, despite the emphasis on polycentric development in planning theory and practices, the dominance of Singapore’s CBD remains largely unshaken. As Bertaud (2001) posits, various polycentric urban configurations present distinct morphological and trip patterns. Singapore’s master plan seems to strengthen the CBD’s pre-eminence while promoting polycentric evolution. This suggests a nuanced strategy where polycentric urban development can coexist with a dominant city centre. The motivations and socioeconomic implications of such a strategy warrant deeper exploration. It also suggests that taking an integrated approach to urban development is crucial, more than mere polycentricity measurements. Aligning morphological measures with other data sources, like functional polycentricity (Burger et al., 2012) and socioeconomic indicators (Wang et al., 2017), can provide a more holistic understanding.
Methodology-wise, the proposed method involves multiple quantitative techniques from different fields. From using the spatial interaction model to simulate the commuting pattern to using network community detection to define urban centres and their boundaries, ultimately, computation of polycentricity. Despite our efforts to keep the simulation and calculation as realistic as possible, several limitations in each step may affect the final outcome. For example, the commuting patterns we obtained from the open data source only account for public transport, while other means of transport are neglected. Hence, the change in travel costs is impossible to estimate. Moreover, the spatial interaction model in this study is relatively primitive and calibrating the model usually requires more dedicated data that considers the more specific land use, demography, travel intention and travel mode (Zhang et al., 2022; Zhong et al., 2013). Nevertheless, these limitations do not hinder the validity of the proposed framework in evaluating the master plan’s impact on urban spatial structure and highlight areas for future research to refine and enhance the robustness of the methodology.
Lastly, emphasising our quantitative approach to urban planning, we leverage urban mobility data and adopt a spatial network lens to evaluate the master plan’s impact. Urban mobility data’s rising prominence is evident (Sun et al., 2019; Zhao et al., 2016). Concurrently, the spatial network methodology exhibits promise in comprehending the urban built environment (Maeda et al., 2019). Though gaining traction, integrating comprehensive urban data into planning remains sporadic, a challenge that Engin et al. (2020) pinpointed. This paper exemplifies how urban mobility data and spatial network analysis can critically evaluate urban development trajectories, possibly enriching the broader planning paradigm.
Supplemental Material
Supplemental Material - ‘Local hubs and global gateways’: Understanding the impact of Singapore’s master plan on urban polycentricity
Supplemental Material for ‘Local hubs and global gateways’: Understanding the impact of Singapore’s master plan on urban polycentricity by Cai Wu, Mingshu Wang, Jiong Wang, Duncan Smith, Menno-Jan Kraak in Environment and Planning B: Urban Analytics and City Science
Footnotes
Declaration of conflicting interests
The author(s) declared no potential conflicts of interest with respect to the research, authorship, and/or publication of this article.
Funding
The author(s) received no financial support for the research, authorship, and/or publication of this article.
Data Availability Statement
All data that support the findings of this study are already available in the public domain.
Supplemental Material
Supplemental material for this article is available online.
References
Supplementary Material
Please find the following supplemental material available below.
For Open Access articles published under a Creative Commons License, all supplemental material carries the same license as the article it is associated with.
For non-Open Access articles published, all supplemental material carries a non-exclusive license, and permission requests for re-use of supplemental material or any part of supplemental material shall be sent directly to the copyright owner as specified in the copyright notice associated with the article.