
Abstract
Since the 1970s, remote sensing has been used to monitor the environment, address national security concerns, and manage Earth resources within a market framework. However, environmental organizations can also utilize remote sensing data infrastructure to support oppositional narratives, legal processes, and direct action. We present a framework for the socio-technical practice of remote sensing in alliance with those communities and organizations that are struggling for environmental justice on the global commodity frontiers. Positioned at the intersection of critical geography and political ecology, we examine the ways that critical remote sensing has been adopted in five major types of environmental conflict: struggles opposing fossil fuel exploitation, timber extraction, intensive food production, water management practices, and the effects of mining. We present a baseline inventory of remote sensing resources that are useful to the five conflict types and are freely accessible online. A global perspective on the planetary environmental crisis is essential, and we suggest that remote sensing practitioners can, through workshops or online tutorials, help environmental justice organizations towards independent use of remote sensing data. The local communities should then determine whether remote sensing products can contribute to their struggles.
Keywords
Introduction
Earth observation technologies collect massive amounts of data (Lang et al. 2019; Sudmanns et al. 2020) to monitor Earth systems and to streamline the use of natural resources (Lechner, Foody, and Boyd 2020; Segarra et al. 2020; Weiss, Jacob, and Duveiller 2020) that have been linked to a range of economic uses (Donaldson and Storeygard 2016). This includes using satellite data infrastructure to set up profit-oriented sensing activities with the goal of commodifying Earth's resources (Alvarez Leon 2022). For example, extractive actors can use remote sensing data to monitor potential sites for petroleum (Asadzadeh, Oliveira, and Souza Filho 2022; Scafutto, de Souza Filho, and de Oliveira 2017) and mineral (Shirmard et al. 2022; van der Meer et al. 2012) extraction. The techno-political use of remote sensing is a response to the increasing requirement for energy and materials to satisfy the ever-expanding global socioeconomic metabolism (Haberl 2006).
The inexorable process of resource extraction, commodity transformation, and capital accumulation, accelerated by the increased integration of technology into the global capitalist infrastructure (Castells 1997), clearly parallels the global environmental crisis (Moore 2017). Intensively exploited resource-rich sites cannot be renewed at the rate of extraction, so the demand for goods is satisfied by continuously expanding extractive frontiers (Moore 2000). Many of these extractive frontiers are areas of environmental devastation (Marín, Valencia, and Hernández 2019); global sustainability, in terms of planetary boundaries, is greatly threatened (Rockström et al. 2009) due to the excessive global consumption of materials and energy (Richardson et al. 2023). Some extractive actors, such as corporations and states, can reap the benefits of extractive activities while shifting environmental burdens to marginalized or poorer communities, thereby triggering environmental conflicts worldwide (Demaria and D’Alisa 2013; Muradian, Walter, and Martinez-Alier 2012). Although science is urgently reporting the intensification of the global environmental crisis (Osorno-Covarrubias, Couturier, and Ricárdez 2015; Paes and Levy 2017; Santos 2000), this is consigned to a role that is subordinate to global market dynamics.
The environmental degradation caused by extractive activities is met with opposition from environmental justice organizations and local people who face the challenge of preserving the ecological integrity of their environment, a crucial resource for both their sustenance and environmental sustainability. Their concerted action frequently brings together local communities with regional organizations, forming diverse environmental justice movements (Martinez-Alier 2014) that oppose environmental degradation and challenge extractive production of their territories (Porto-Gonçalves 2009). Environmental justice movements also create new frameworks centered on resistance against oppression, and rooted in conviviality, solidarity, and life itself against environmental devastation; they use the bedrock of diverse knowledges to emancipate the dialogue from dominant narratives (Santos 2015). Moreover, many environmental struggles contribute to a just environmental sustainability. This critical approach confronts the destruction of the social fabric, specifically the loss of community ties and the use of technology in social control (Subirats 2011), and it also reinforces alternative territorial productions (Carbone and Couturier 2021); this challenges those put forward by the power structures that are increasingly using data, such as remotely sensed data, to shape extractive territories.
Critical scientists are increasingly embracing co-production of knowledge, such as research-action projects within political ecology, based on community-initiated requests and critical remote sensing practices (Bennett and Faxon 2021; McGurk and Caquard 2020; Paneque-Gálvez et al. 2017). Moreover, significant alliances with local communities in environmental justice struggles have emerged from non-governmental organizations such as Global Witness (globalwitness.org) and scientific collectives such as the cartographical service GeoComunes (geocomunes.org). If a critical adoption of remote sensing technology can be achieved, we might see an increase in this pool of initiatives in the coming years. As an alternative to the extractive use of satellite data infrastructure, critical remote sensing, as described by Bennett et al. (2022), involves the application of remotely sensed data to expose injustices, reflexively engage with focused knowledge, and empower local actors by expanding their access to geospatial technologies. Hence, free and open data approaches to increase the decentralization of information are key to the use of remote sensing data in struggles for environmental justice.
The critical use of new technologies for the benefit of oppositional social groups and movements through localized approaches has been long discussed (Kellner 1999; Nightingale 2003). Meanwhile, in the scientific literature regarding remote sensing, one area of study has been to measure the damage to the environment produced by extractive activities such as mining sites in the Congo basin (Luethje, Kranz, and Schoepfer 2014), India (Joshi et al. 2006; Ranjan and Gorai 2022), or the Amazon (Rudke et al. 2020). Although such data can be relevant for environmental justice movements, remotely sensed data often disregard the local knowledge and do not recognize social movements as co-producers of knowledge and territories in their own right. The knowledge of a territory, which is often disputed by extractive interests (Oliveira and Siqueira 2022), is central to defining the use, and the truth, of remotely sensed data. The co-production of knowledge on environmental issues involves the contribution of diverse actors to collectively reach informed decisions for environmental protection (Djenontin and Meadow 2018; Norström et al. 2020). The actions of environmental justice movements in opposing extractive activities may ultimately result in abandonment of those projects and hence in environmental protection (Martin et al. 2020), either through direct action or the implementation of regulatory laws. These struggles for environmental justice can benefit from the use of remote sensing data, but the fight is complex and uneven.
Marginalized or poorer sectors, such as indigenous people, the working class, women, the youth, and smallholder farmers, participate in these struggles and suffer the subalternization by which corporate or state powers mute their voices (Spivak 2003). The extractive side commonly employs violent means and gains disproportionate access to political influence, capital resources, and information. Moreover, certain sectors within the impacted community either endorse the extractive activity or reap benefits from it, such as employment with the extractive actor. Environmental justice movements confronted with corporations, states, and multiple extractive actors are in a highly vulnerable position and face limitations to their means and tools for struggle, as well as criminalization of protest and activism (Navas, Mingorria, and Aguilar-González 2018; Tran et al. 2020). Although people struggling for environmental justice often suffer extreme inequality and the effects of environmental destruction on their bodies and lands (Escobar 1996; Morton 2007), their actions have significantly contributed to the halting of environmentally destructive and socially conflictive projects in numerous cases worldwide (Scheidel et al. 2020).
Within the critical remote sensing concept outlined by Bennett et al. (2022), we propose a framework for practicing critical remote sensing in struggles for environmental justice. Our endeavor is to link specific struggles with available remotely sensed data, keeping a global perspective on the planetary environmental crisis. We also contemplate the co-creation of knowledge and adoption of remotely sensed data in those struggles by critically applying the current technology. We have structured the article around four objectives:
Understand the technical nature of remote sensing data and its role within an environmentally damaged territory (Remote sensing of environmentally damaged territories section). Present those major remote sensing resources that are publicly available as an initial inventory of data resources that are potentially useful in struggles for environmental justice (Access to remote sensing data and publicly available resources for environmental justice movements section). Describe examples of environmental conflicts registered in the Environmental Justice Atlas (EJAtlas) (Temper, del Bene, and Martinez-Alier 2015), and consider how remotely sensed data have been used or could be used to strengthen environmental justice movements (Matching environmental conflicts with actionable remotely sensed data section). Develop a guideline for the alliance between environmental justice movements and remote sensing practitioners, focusing on the adoption of this technology and the co-production of knowledge (Towards an alliance between local communities and the remote sensing practitioners? section).
Remote sensing of environmentally damaged territories
Remote sensing captures light from the Earth's surface through instruments mounted on satellites orbiting the Earth or on aerial vehicles such as drones. Since the 1990s, the amount of high-resolution satellite imagery available to the public has increased exponentially (Union of Concerned Scientists 2023). Consequently, today, the record of environmental impacts on the Earth surface can distinguish smaller objects (improved spatial resolution) with more successive dates (improved temporal resolution), with sensors designed to detect light in narrow domains of the electromagnetic spectrum. The most commonly available satellite data are from sensors in the visible spectral range (reflected light visible to the human eye), the visible and near infrared (VisNIR) range, the visible and infrared (VisInfrared) range, which include short-wave infrared and thermal infrared, and the microwave range.
Imagery in the visible range may be acquired with high resolution and is useful to identify and precisely delineate objects on the ground (land cover categories, extent of water bodies) and also for delineating industrial facilities in extraction sites for fossil fuels and minerals (Tang and Werner 2023). Imagery in the infrared range usually has lower spatial resolution but it allows, in combination with the data acquired in the visible range, the computation of vegetation indices, useful for the detection of land cover changes and deforestation over time (Adams and Gillespie 2018). Additionally, the reflected signal in the red and near-infrared spectra over water surfaces is increased with suspended particulate matter (Doxaran et al. 2002), with the great potential of allowing the estimation of pollutant concentration. Unlike the VisInfrared sensors, Synthetic Aperture Radar (SAR) in the microwave spectral range operates in nearly all atmospheric conditions because microwave radiation is virtually unaffected by clouds and smoke.
Radar sensors, as active sensors, also operate at night because the received signals derive from pulses of self-emitted microwave energy. Two characteristics of light are measured by radar sensors, each one of which leads to potentially useful environmental information: the amplitude signal and the phase signal. The amplitude signal reports characteristics of the observed objects related to their geometry (surface roughness) and to their water content. For example, radar sensors can detect the smooth surface of oil spills against the choppier water surface in the surroundings and are able to monitor drought stress in vegetation and forests related to extreme meteorological events (Couturier et al. 2001). Meanwhile, the phase signal, related to the transformation of light along its path, is very sensitive to the variations in position of the observed objects on the surface of the Earth. Interferometric SAR (InSAR) processing of images acquired over the same scene on two or more dates can detect subsidence, and this is potentially useful in the context of groundwater overexploitation.
Data have become central to environmental politics (Nost and Goldstein 2022), and the tremendous capacity of Earth observation systems to acquire data with high resolution calls for an assessment of their potential use by environmental justice organizations. By tracing the flow of data and examining its material relationships, a political ecological approach can be applied to digitally mediated environmental change. For instance, remote sensing data have been and are increasingly used in extractive activities and the commodification of Earth resources but could also be adopted by environmental justice organizations for the protection of territories. The environmental data infrastructure comprises software platforms, sensors, satellite-based monitoring, mobile phone apps, and digitally generated visual representations such as geographic information systems (GIS); through its interlinks with political ecology, this infrastructure is nowadays inseparable from environmental governance (Bakker and Ritts 2018).
GIS overlay analysis has been widely effective in confronting extractive permit maps with land use planning permits, or with land uses and land tenure allowed at the local or community level. In the present study, we argue that, beyond the sole use of GIS spatial analysis, the innovation of satellite data infrastructure is emerging in the struggle for environmental justice, in part owing to the increase in sensors and availability of environmental data (Haklay and Francis 2017; Pedregal, Laconi, and del Moral 2020). Remote sensing data infrastructure could support environmental justice organizations at the three technological levels of satellite data infrastructure (Figure 1): (1) to choose sensors or promote new sensors (acquisition systems); (2) to use or build new platforms (storage and processing systems); and (3) to directly assist environmental justice organizations in the selection, processing, and GIS handling of the data accessible from the cloud network (Figure 1). In this article, we present the critical use of remote sensing by environmental justice organizations to bolster their opposition to extractive activities.
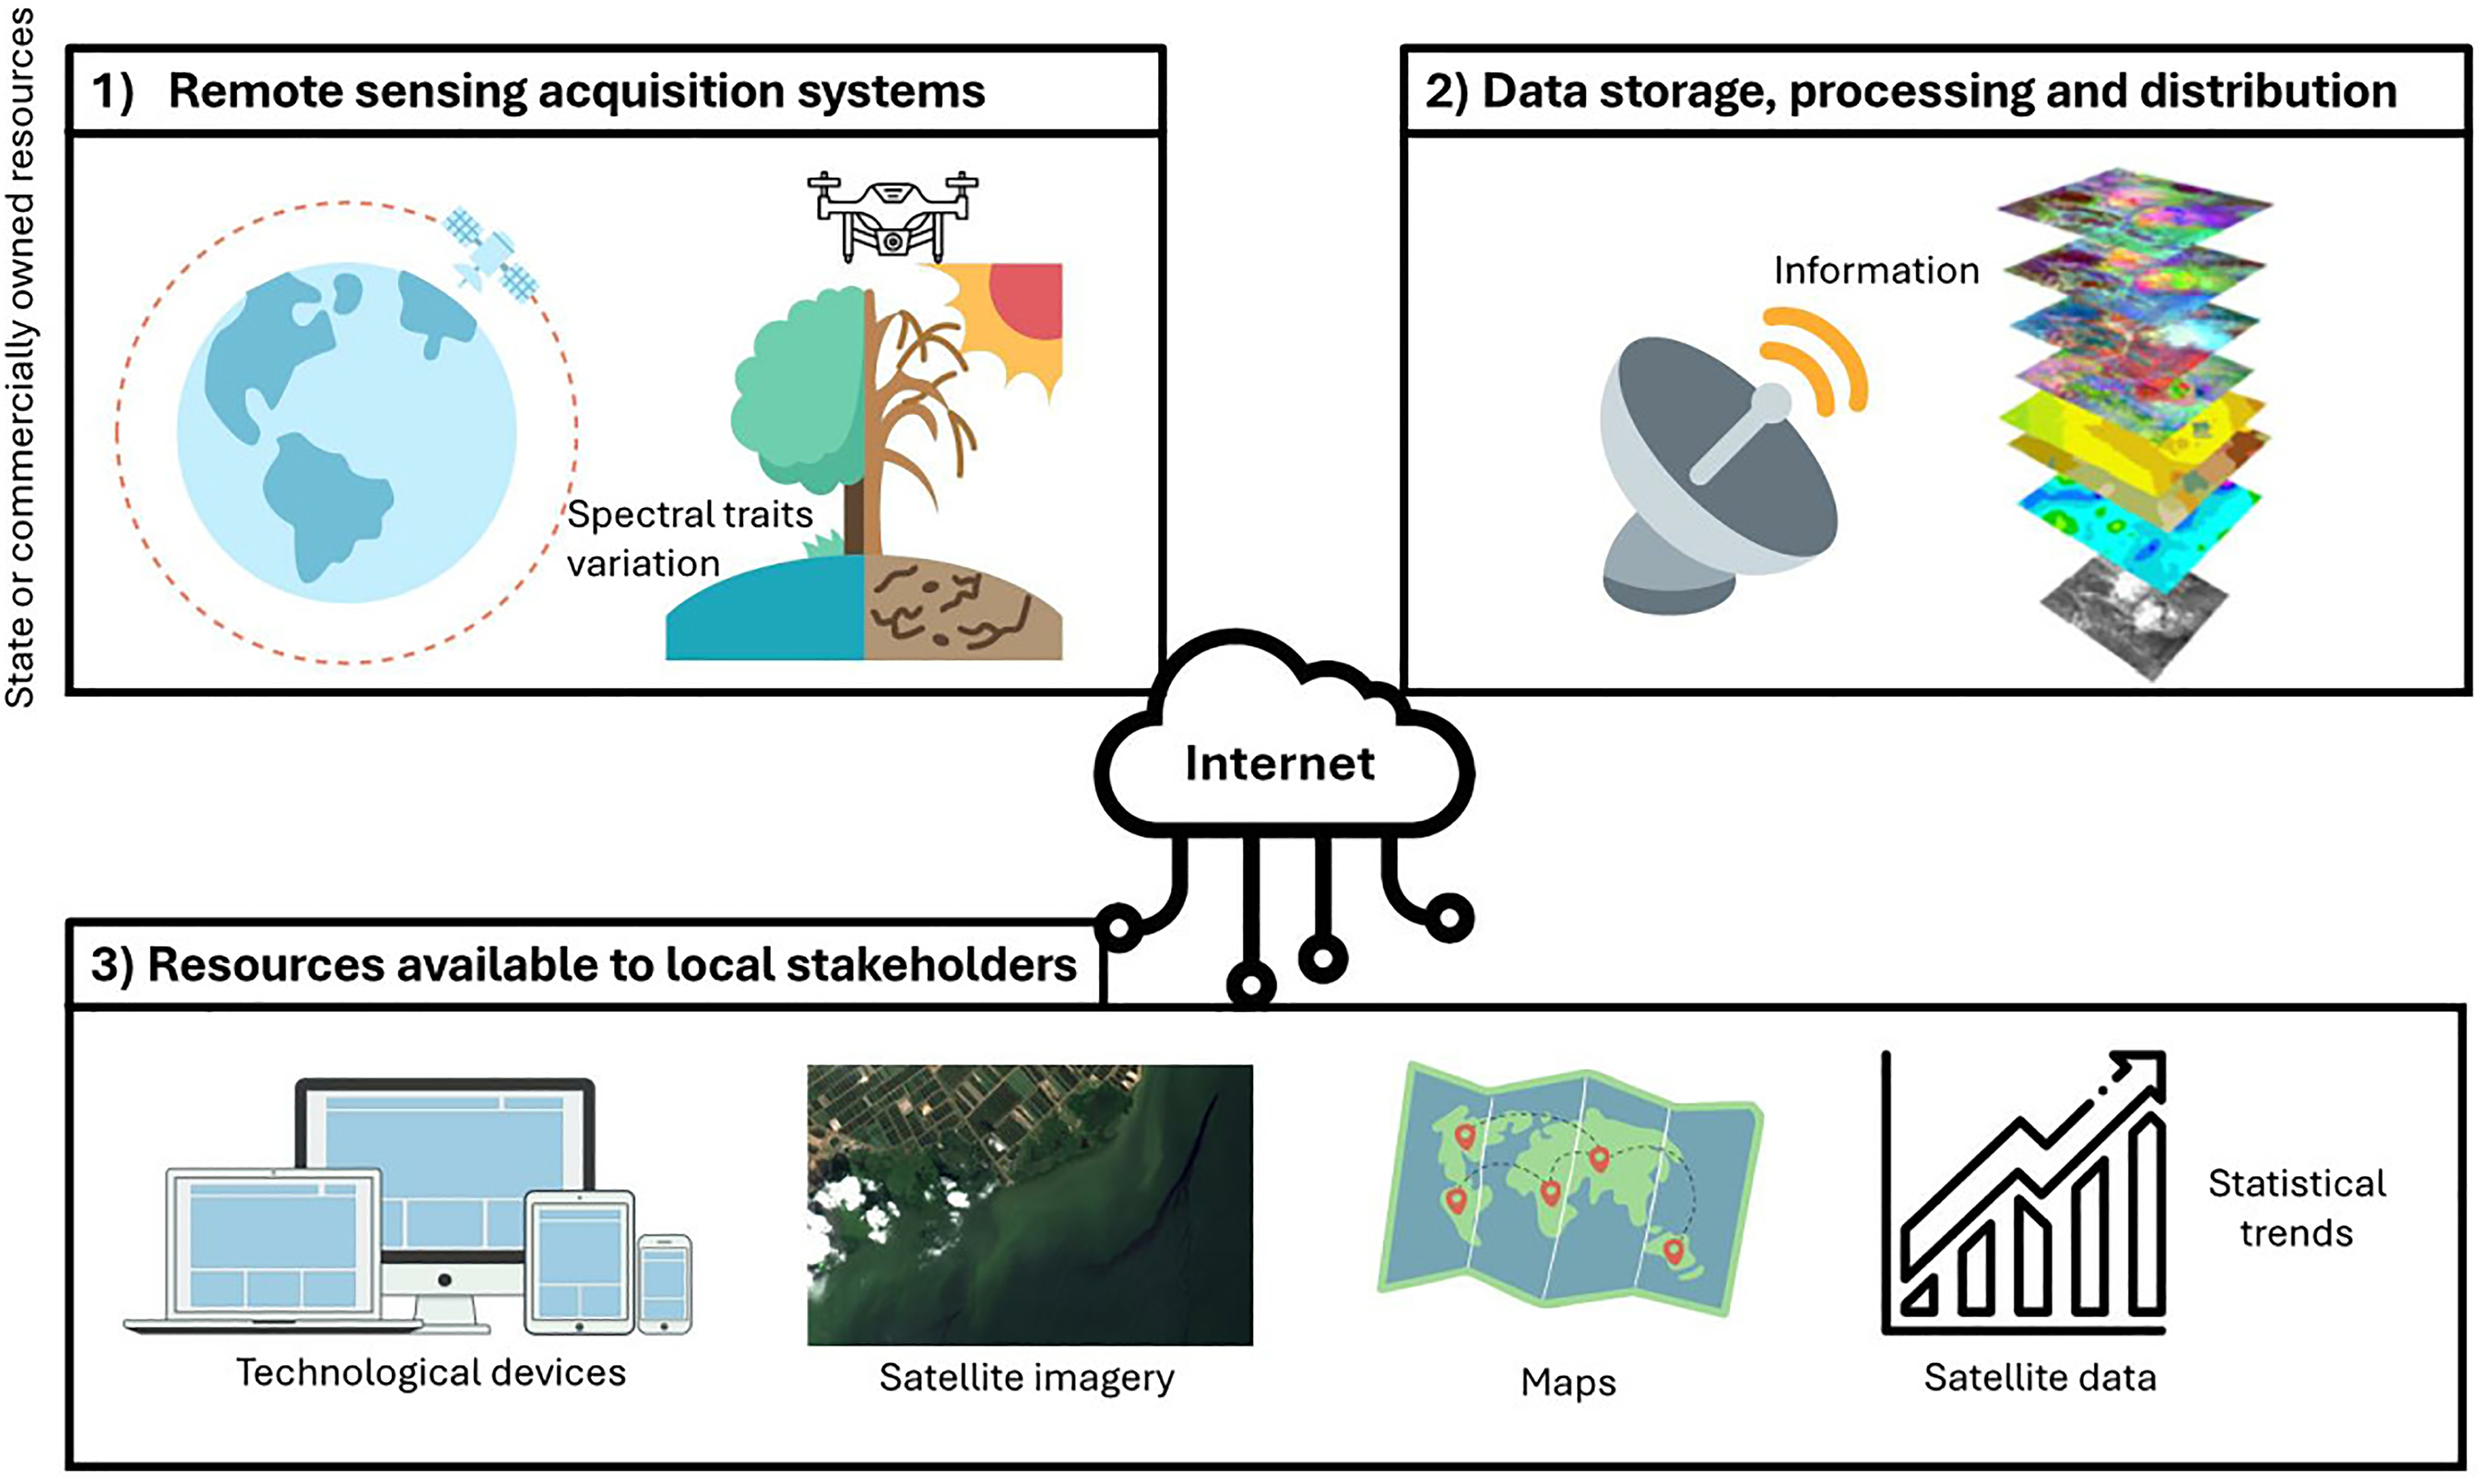
The satellite data infrastructure and publicly available resources enable critical remote sensing to be practiced in collaboration with local organizations and communities. (1) Remote sensing evidence of environmental impacts after the commencement of extractive activities; (2) spatial data infrastructure managed by states, corporations, and academic institutions; (3) access by local organizations to satellite data infrastructure and the production of materials potentially useful in the environmental justice struggle.
As shown at the beginning of this section, remotely sensed data can provide quantitative evidence of environmental perturbations. An environmental justice struggle can potentially use satellite data to monitor the environmental disturbance, its expansion, and when it is produced (Figure 1). The demands and strategy of the environmental justice movement, specifically the use of data infrastructure to address the environmental conflict, should serve as the benchmark for assessing the relevance of satellite data in a given case. Ideally, remotely sensed data can be adopted by environmental justice movements independently to guide their actions and demands. Otherwise, their struggle must involve a complex process of dialog with remote sensing practitioners prior to matching remotely sensed data with the struggle; what exact evidence is required to support the planned or existing opposition tactics?
Since extractive actors frequently use remote sensing and map-making, a common tactic in opposition is to produce maps that aim to contrast with the extractive actors’ maps, i.e., counter-mapping (Dalton and Mason-Deese 2012). In general, the co-production of knowledge should express the viewpoint and opinion of the local community on a final map, thereby ensuring that products derived from remotely sensed data do not deviate from the wisdom (moral, ethical, and cultural values) underlying the struggle (Rambaldi et al. 2007). Furthermore, counter-mapping can foster cooperation among researchers and participants so that they can intervene in real problems without the need to invoke higher power systems (Dalton and Mason-Deese 2012).
Access to remote sensing data and publicly available resources for environmental justice movements
The use of satellite data infrastructure in struggles for environmental justice is especially relevant when data are selectively reported or falsified by the institutions in control, or when environmental degradation is denied. For instance, under the Bolsonaro administration, the Brazilian government barred the publication of data on tropical deforestation in Brazil by censoring the publication of data processed by the Brazilian National Institute for Space Research (Souza et al. 2022). Extractive actors exploited this disinformation and the lax enforcement of environmental law, and this led to devastating fires and deforestation in the Amazon (Ferrante and Fearnside 2019). The Bolsonaro administration did not merely intend to dismantle the public satellite deforestation monitoring infrastructure; it pro-actively obfuscated the truth by a blanket of alternative data and aimed to substitute the public satellite deforestation monitoring infrastructure by for-profit private satellite services, Planet Labs, and by a satellite subsequently acquired by the Ministry of Defense (Oliveira and Siqueira 2022).
Advanced remote sensing technology is predominantly state owned. Indeed, the highest spatial resolution is afforded by the Keyhole series (resolution at least 10 cm) belonging to the US government. These images are, however, not publicly available and are used mainly for military reconnaissance. Nevertheless, a share of the remote sensing data produced by state agencies is publicly available on stable online platforms and offers coverage dating back to the 1970s. The Landsat mission, launched by the National Aeronautics and Space Administration (NASA) of the United States and co-distributed by NASA and the US Geological Survey (USGS), has offered satellite images since 1972. Moreover, declassified imagery from CORONA (United States spy satellite) is now available for the 1960s. The Copernicus mission (including the Sentinel-1 and Sentinel-2 constellation), launched by the European Union and the European Space Agency (ESA), offers satellite images from the 2010s onwards. All these images are freely available online (Table 1). More recently, similar medium-to-high spatial resolution imagery has been available from the Brazilian and Indian space agencies (Table 1). These data can potentially be used to monitor environmental impacts, and the open accessibility of the datasets makes the information available for environmental justice movements. Nonetheless, extractive stakeholders also take advantage of this accessibility; in gold mining, discoveries of extractive sites and the numbers of extractive stakeholders both increased after the launch of the Landsat mission (Nagaraj 2022). Publicly accessible satellite data increased revenue prospects by lowering the investment risk in exploration.
Freely available remote sensing data; means of access.
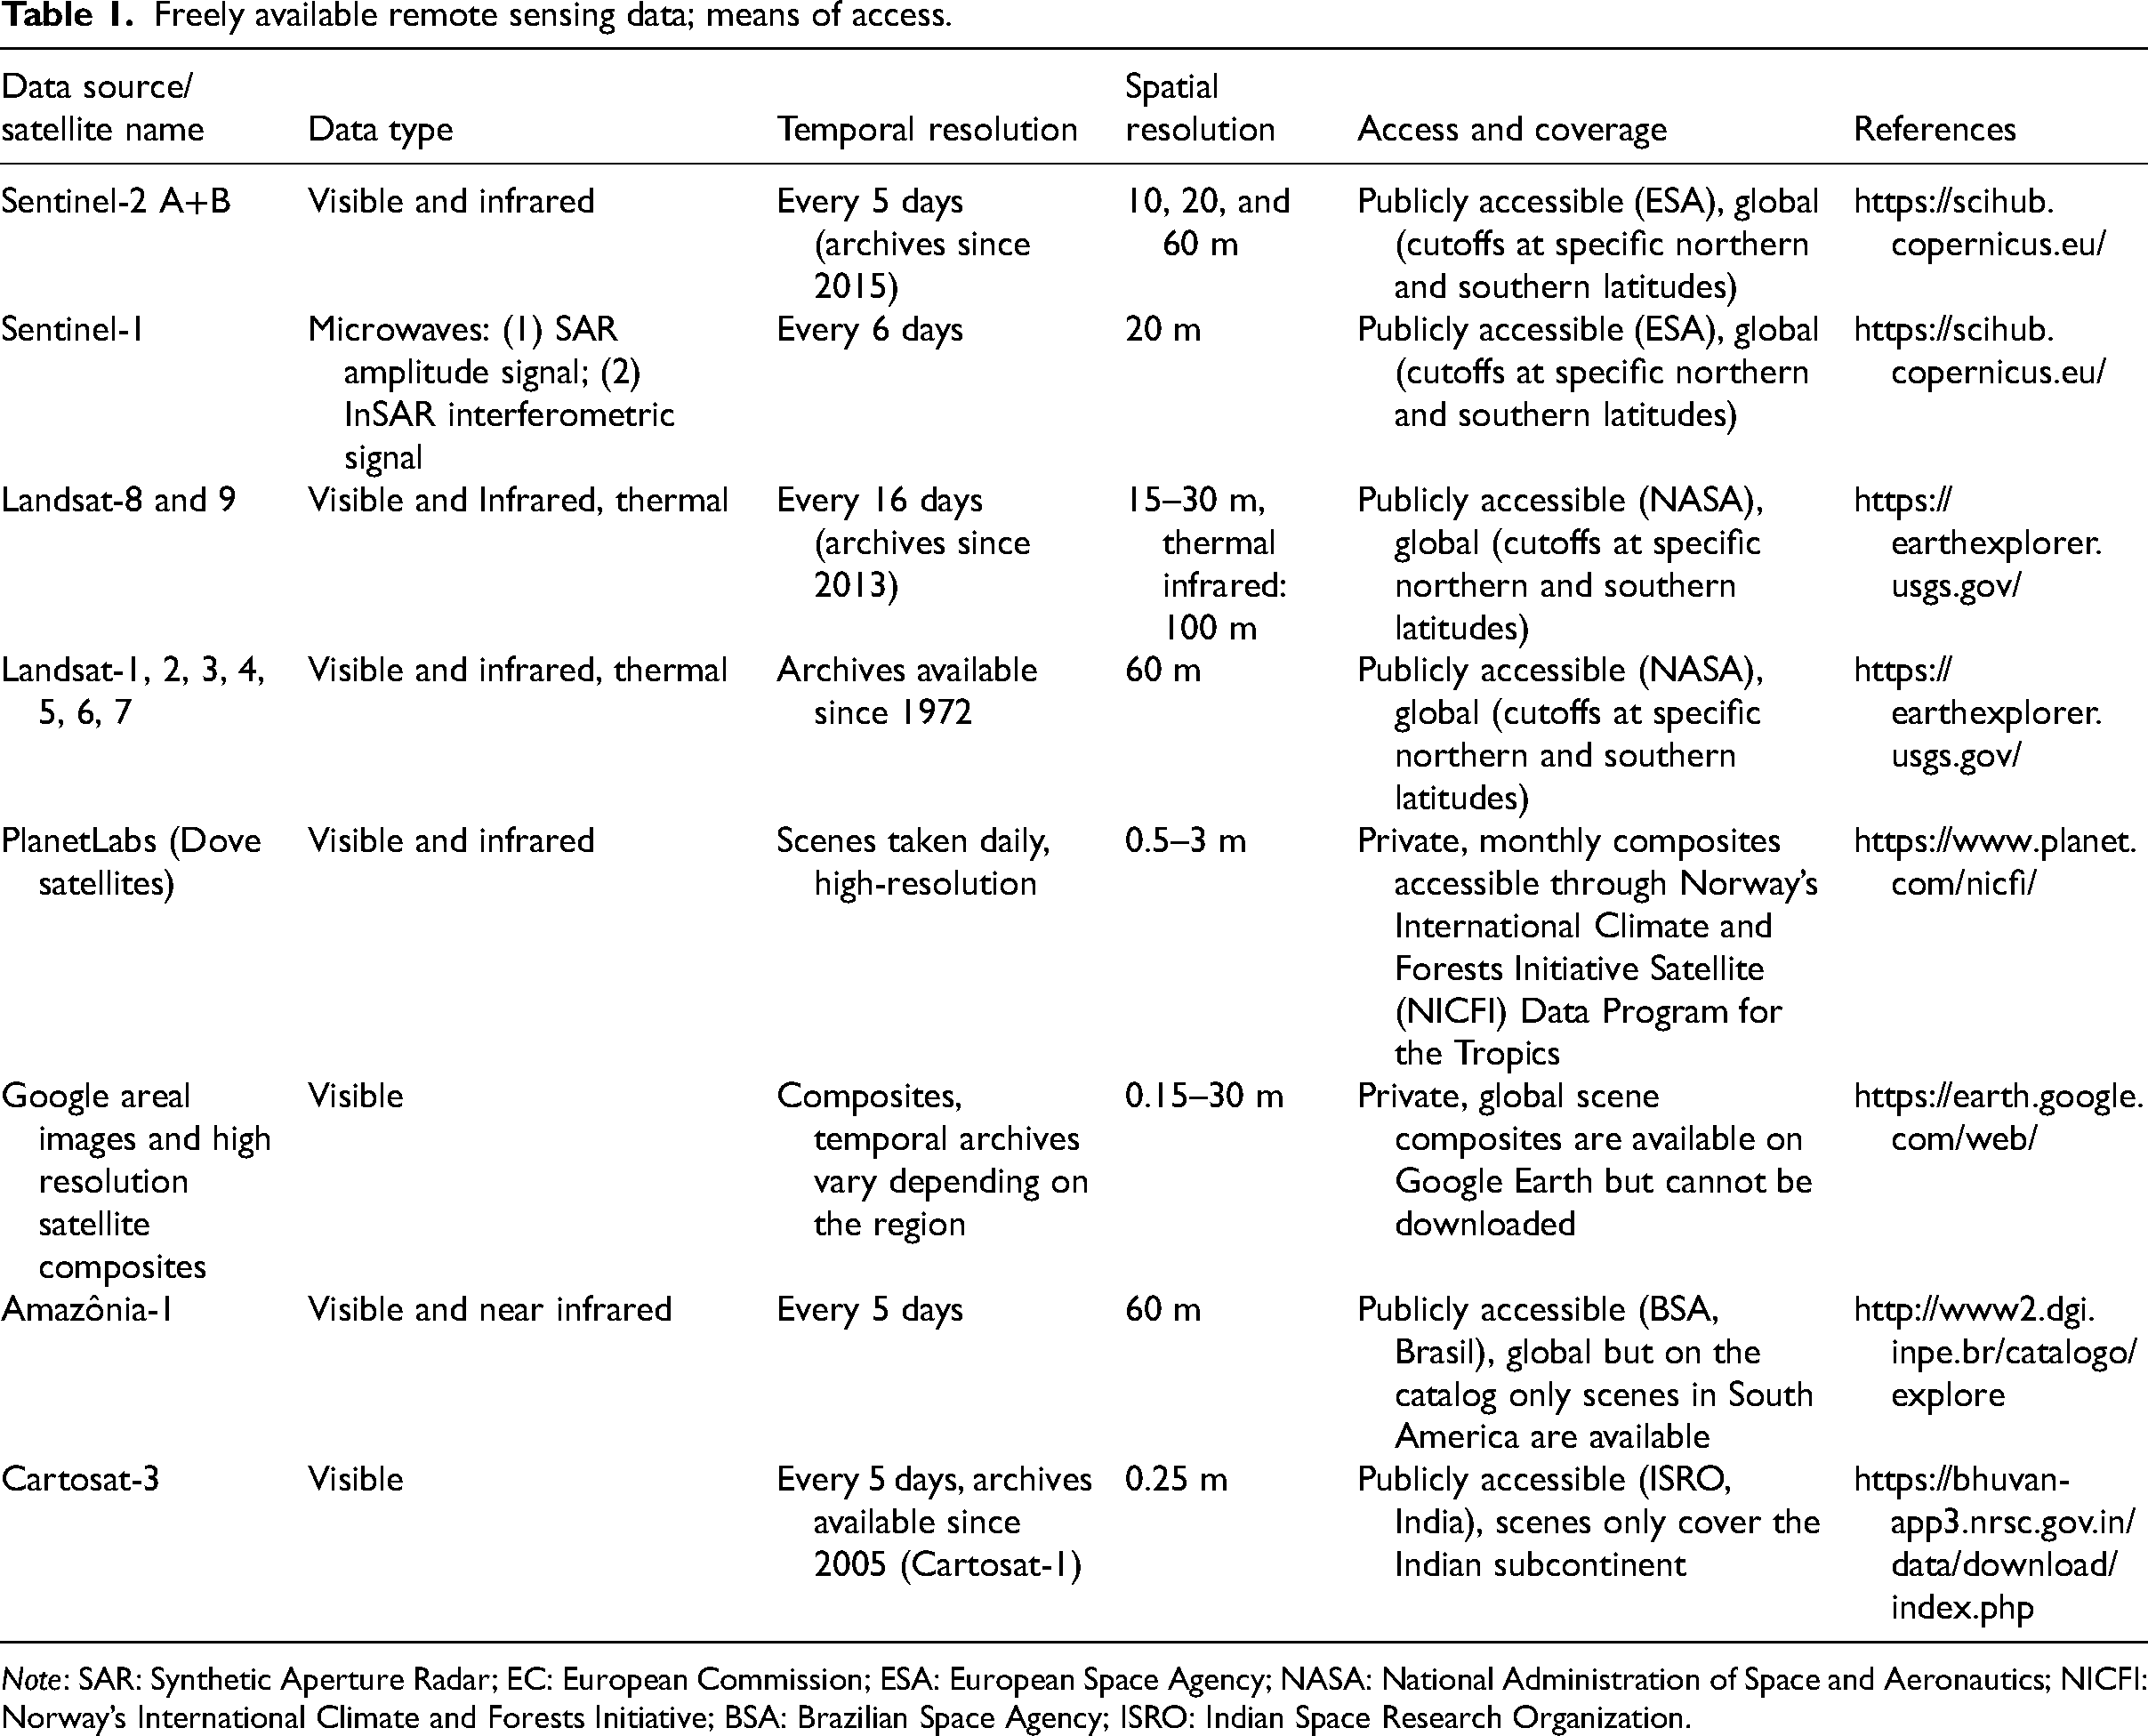
Note: SAR: Synthetic Aperture Radar; EC: European Commission; ESA: European Space Agency; NASA: National Administration of Space and Aeronautics; NICFI: Norway’s International Climate and Forests Initiative; BSA: Brazilian Space Agency; ISRO: Indian Space Research Organization.
Apart from publicly accessible satellite data, some companies own Earth observation systems, such as Dove satellites (Planet Labs PBC), which provide high-resolution (0.5 to 3 m) multispectral scenes daily. Private companies often offer daily and highly detailed images of the Earth for purchase at relatively high rates, ranging from $200 to $3,000 US dollars for scenes covering 10,000 hectares (Sozzi et al. 2018). Moreover, companies such as Orbital Insight Analytics use high-resolution scenes from Planet Labs and Maxar Technologies to offer advantageous information to businesses. Mukherjee, Panayotov, and Shon (2021) observed that remotely sensed data analyzed by Orbital Insight potentially offered improved estimates of market prospects in the oil industry before data had become available from other sources. These remote sensing initiatives help to generate profit-oriented sensing activities and expand the commodification of Earth resources (Alvarez Leon 2022). Some of these high-resolution private images are purchased by Google and used in Google Earth composites based on satellite and aerial images, although there may be years between consecutive images from these sources. Moreover, the resolution differs significantly (0.15–30 m) depending on the region and the period of time. Although access to commercial satellite data is subject to paywalls, such high-resolution images offer improved features for monitoring environmental impacts. Torres-Cruz and O’Donovan (2023) observed that the high temporal and spatial resolution achieved by Planet Labs satellites could precisely identify the collapse of a tailing dam that could not be detected in Sentinel-2 images, with these having a longer revisit time. Monthly composites of Planet Labs imagery retrieved for tropical forest locations can be freely accessed through Norway's International Climate & Forests Initiative for non-commercial use. Although satellite data infrastructure, both publicly available and private, can monitor environmental conflict, its adoption for this is scarce in comparison with its use by state agencies and extractive actors. Resources that could potentially be adopted by environmental justice movements are listed in Table 1.
The potential utility of remote sensing could be extended to the vast array of conflict types that involve built infrastructure and industrial facilities. Built features can be detected and monitored even by non-specialist local actors through visual appraisal of high-resolution aerial and satellite imagery, for example, through the GoogleEarth platform. For the built infrastructure of mining sites, a thorough inventory has been derived visually from GoogleEarth (Tang and Werner 2023). Struggles involving built infrastructure and industrial facilities are often related to the impact of severe air pollution on the local population. Remotely sensed data is still of limited use for detection and monitoring of air pollution, particularly because of insufficient spatial resolution. Finally, in addition to the raw data, products derived from processed satellite imagery, freely available on online platforms such as Global Forest Watch, Global Fishing Watch, and Global Water Surface Explorer, are potentially useful and they overcome some of the limitations regarding the complex processing of remotely sensed data.
Matching environmental conflicts with actionable remotely sensed data
The Environmental Justice Atlas (EJAtlas, www.ejatlas.org) registers conflicts worldwide in a systematic manner based on civil society reports, formal complaints, news articles, academic articles, and cross-checking of secondary sources (Temper, del Bene, and Martinez-Alier 2015). A conflict is assigned to a category according to the activity sector of the extractive project, including biomass and land, mineral ores extraction, and water management. Note that a protest about severe health hazards from drinking water in a polluted watershed would belong to the ‘mineral ores extraction’ category (and not ‘water management’) if the cause is leakage of chemicals from mining upriver. The EJAtlas also classifies the intensity of conflict, which relates to levels of direct and physical violence within the conflict and to the scale of mobilization (number of people affected and reacting) (Dell’Angelo et al. 2021): high-intensity conflicts involve widespread mobilization, arrests, and violence from extractive actors and state institutions; medium-intensity conflicts refer to some street mobilizations and protests, and some level of visibility; and low or latent conflicts involve low or non-detectable local organization, respectively.
In this section, we examine how remotely sensed data can be used in a struggle for environmental justice by investigating whether the technology has supported, or could support, local communities and organizations. For this, we selected conflict cases from an extensive search in the EJAtlas database. Two major criteria for our selection were the usefulness and usability of the remotely sensed data: usefulness refers to the likelihood that remotely sensed data would bring valuable information to the environmental justice organization in comparison with the other types of information commonly used; and usability refers to the actual use or the likelihood that satellite data infrastructure could be adopted by people engaged in a struggle.
In line with the usefulness criterion, some categories, such as ‘Nuclear’ and ‘Biodiversity conservation’, were ruled out because of the presumably difficult detection of the corresponding environmental effects from publicly available remote sensors. Also, some categories were more likely to fit the criteria than others. Because of the extended and multi-dimensional nature of the potential hazards caused by open-pit mining facilities, it is more likely for remote sensing data to provide quantitative, added value information for mineral ores extraction than for other, more confined industrial facilities and for urban infrastructures. Moreover, local claims against conflictive infrastructure and recreation facilities for tourism may often, although not always, rely more on information gleaned from GIS regarding land tenure and land use planning than on the information potentially extracted from satellite data. In line with the usability criterion, high- and medium-intensity conflicts were selected for this study because of the higher likelihood that stronger organizations (including a more diverse range of actors) might engage efforts to acquire more information in the struggle by filling gaps in the technological support.
The search through the EJAtlas database suggested five emblematic cases (Figure 2) that may give insight into the role of critical remote sensing in environmental justice struggles. They represented five categories of extractive activity: fossil fuel extraction, timber extraction, intensive food production, water dispossession, and mineral ores extraction. The following items were examined in each case:
The type of struggle (middle or high-intensity conflicts). The type of remote sensing data available and the potential relevance of remote sensing for environmental monitoring (usefulness). The adoption of the remotely sensed data by the organization in the struggle (usability).
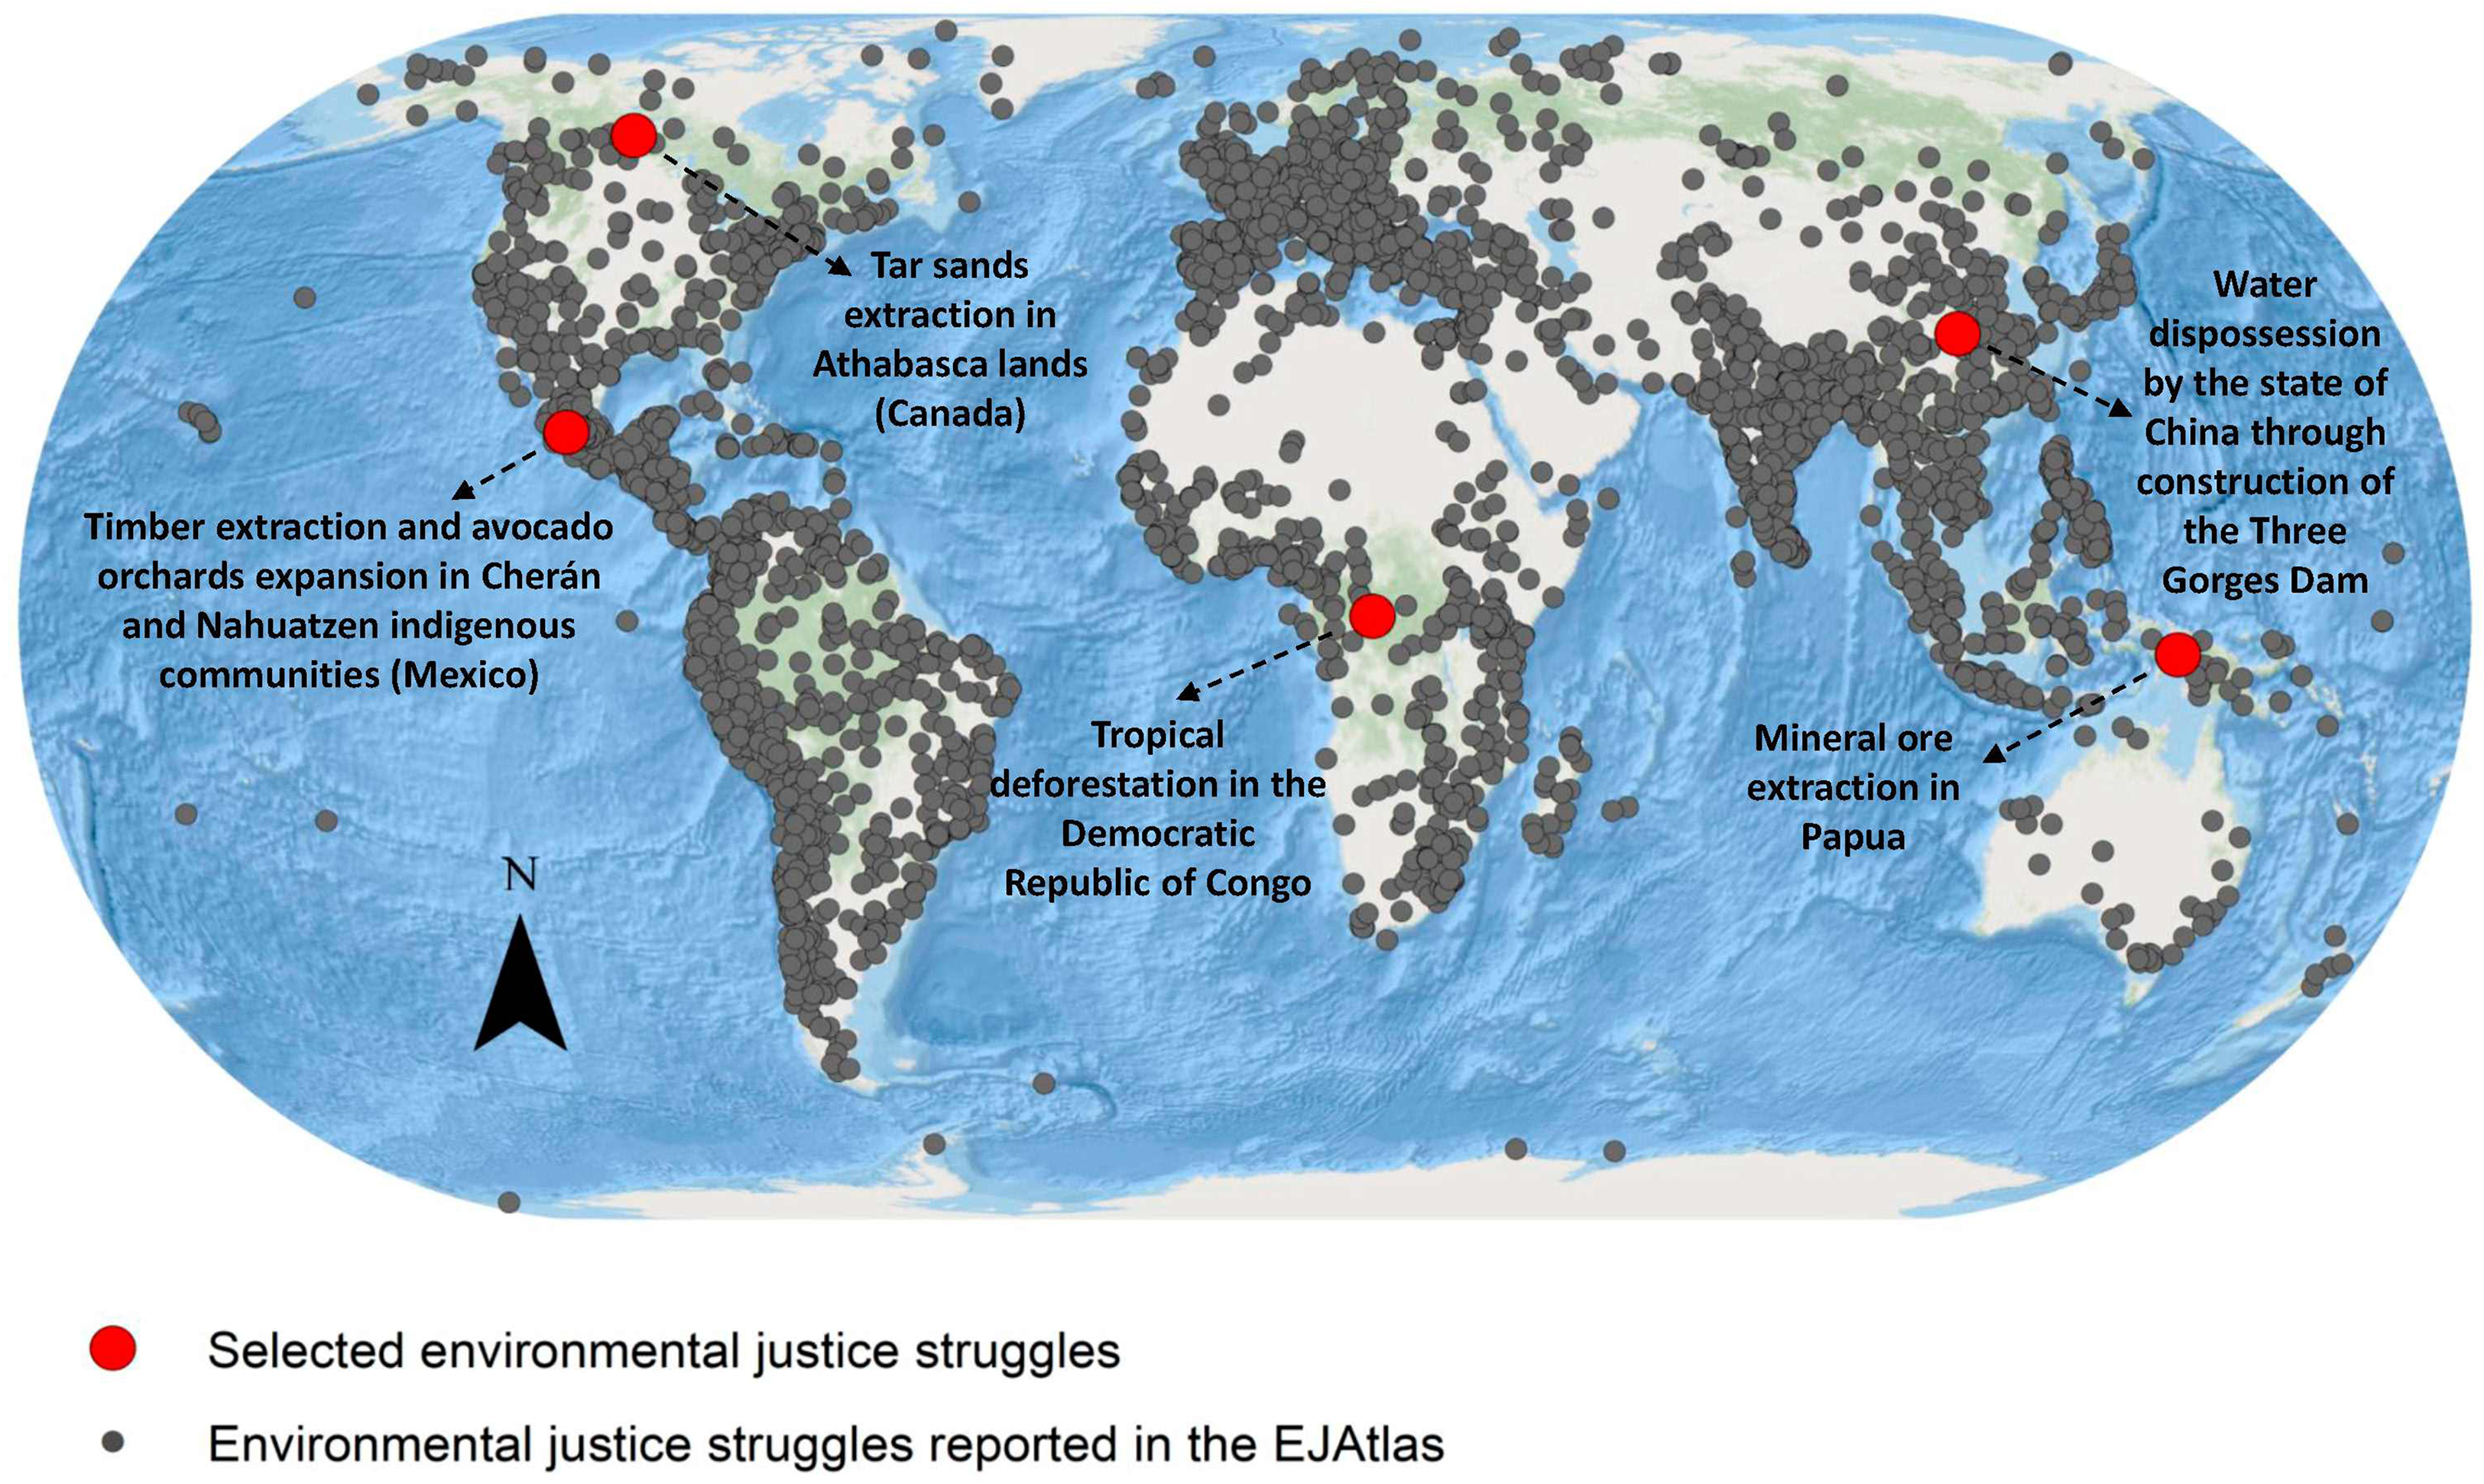
Location of five case studies illustrating environmental justice struggles. All the environmental justice cases described in the EJAtlas are also indicated in the map. The base layer is the World Ocean Basemap.
Fossil fuel extraction
The Beaver Lake Cree Nation vs the Canadian state: Athabasca tar sands extraction
Tar sands extraction has significant economic and energetic importance for Canada. Nevertheless, for several decades, the Beaver Lake Cree Nation has been confronted with the massive depletion of forests and expansion of industrial activities into their lands. The Canadian government and associated companies in Alberta have planned and implemented these extractive activities, considered as highly strategic for the state, to meet the increasing global demand for fossil fuels (Harfoot et al. 2018). The Beaver Lake Cree Nation has been opposing the environmental devastation of their territory for decades (EJAtlas 2023a), trying to resist the impact of forest depletion on their livelihood (Figure 3). A lawsuit was filed in 2008 against the national and state governments in relation to the cumulative impacts of tar sand extraction on their rights to hunt, fish, trap, and gather plants.
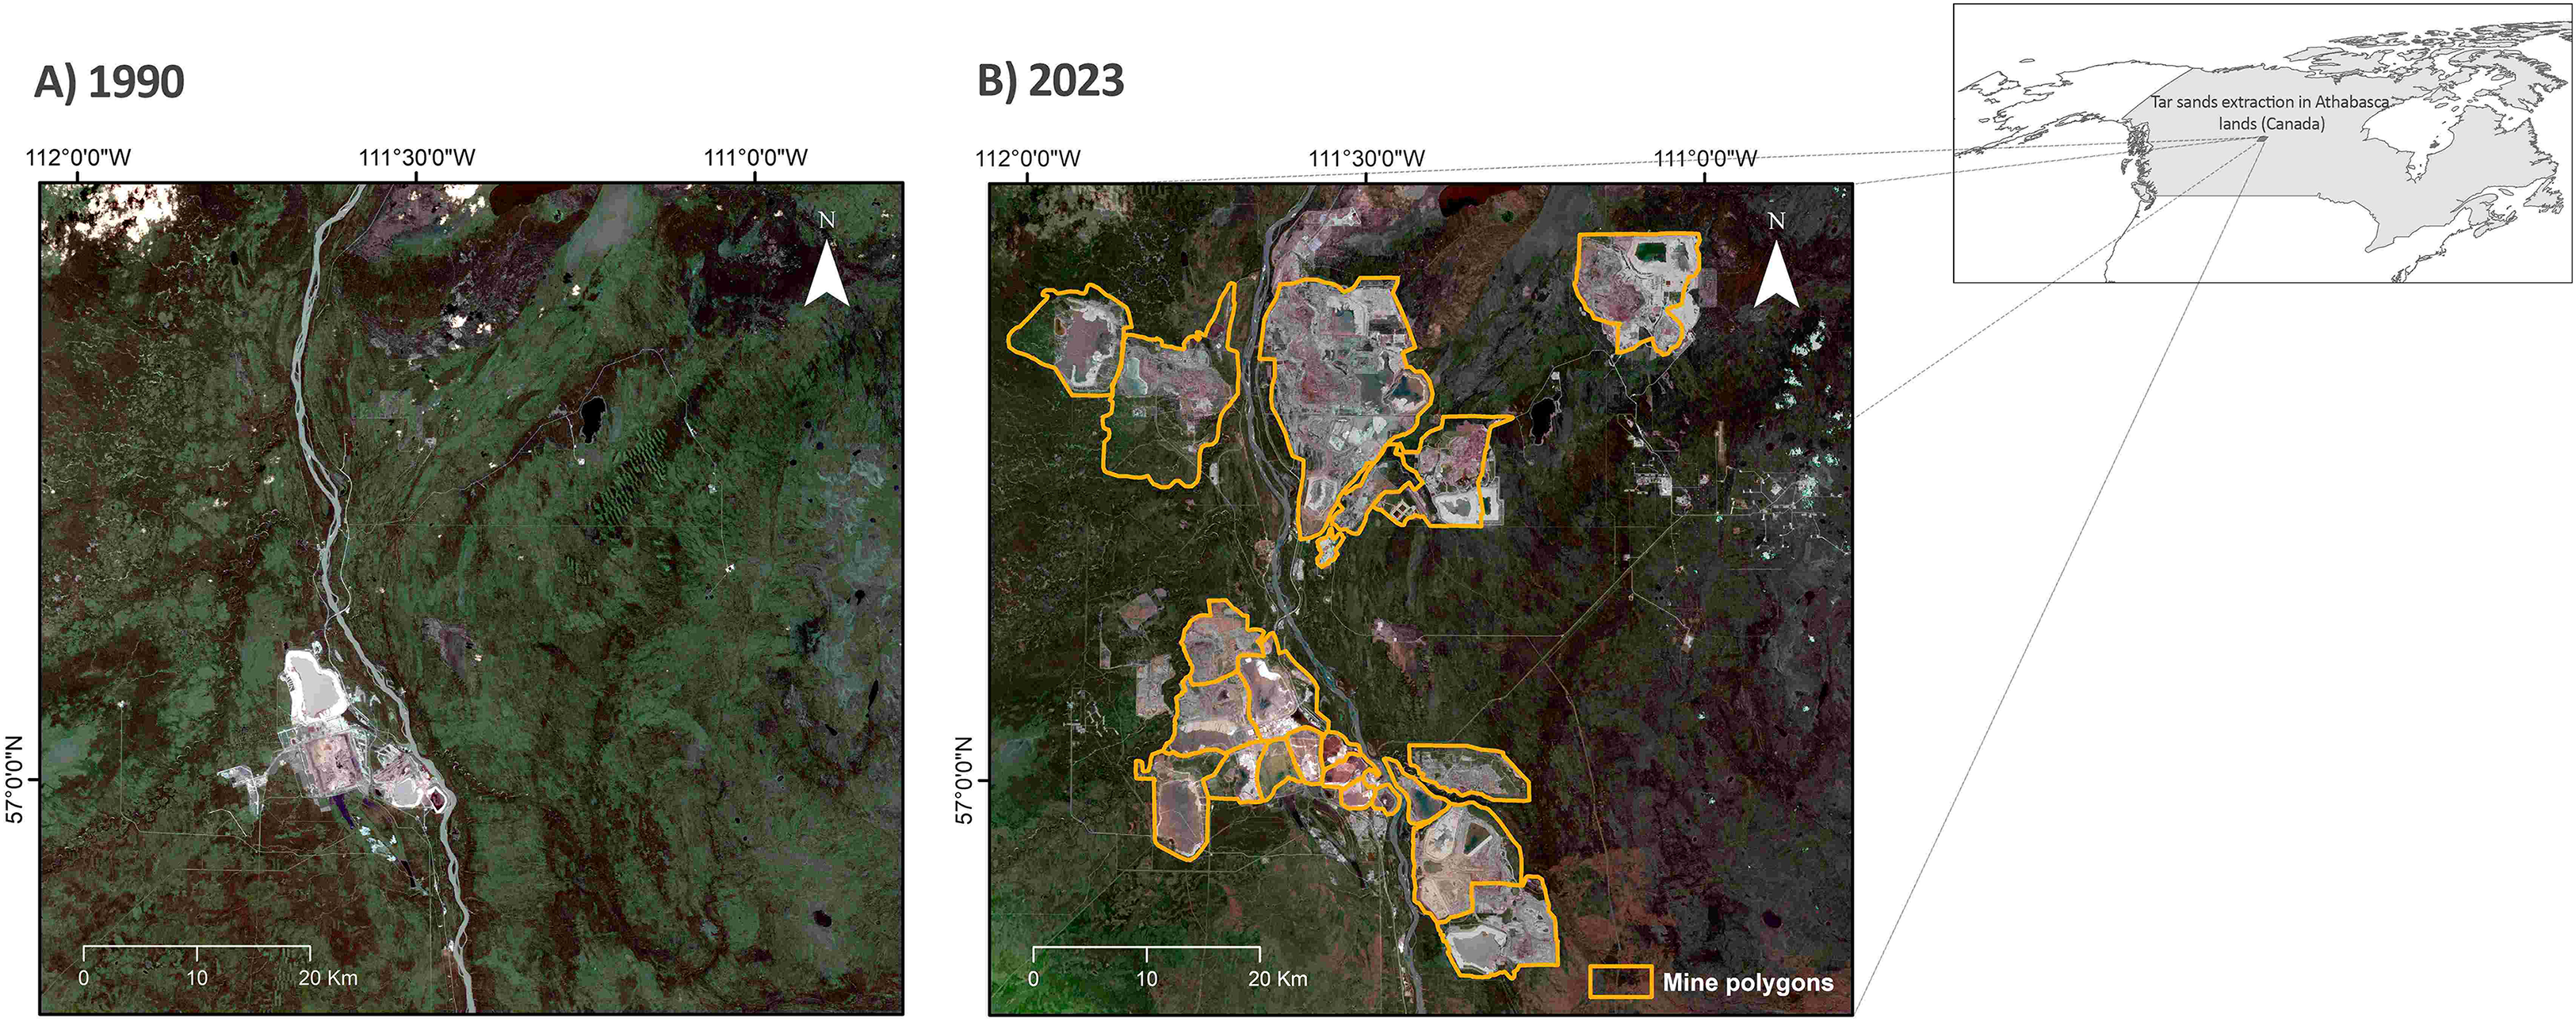
Extent of tar sands industrial sites deduced from visible color composites from Landsat imagery: (A) in 1990 (Landsat-5) and (B) in 2023 (Landsat-9). Toxic sludge sedimentation pools can appear as uniform gray surfaces surrounded by a light-colored ring, while surface mining shows a heterogenous gray pattern. The orange polygons were extracted from the dataset produced by Tang and Werner (2023) on the basis of visual delineation on Sentinel-2 imagery and high-resolution imagery on the Google Earth platform, and on previous global mining studies; that is probably the largest global map of mining sites to date. The complete polygon dataset is available for download at https://doi.org/10.5281/zenodo.6806817.
Through use of Landsat satellite imagery, Gillanders et al. (2008) monitored spatial and temporal changes in land cover at tar sands extraction sites in the period 1984–2005, and their effects on the surrounding environment. Therefore, remote sensing data has aided the determination of the cumulative effects of tar sands extraction. According to the global mining sites map (Tang and Werner 2023), the area that had been converted to tar sands activity in the Athabasca region of Alberta by 2023 was 1014 km2. For the present study, we compared composites (visible spectrum) for year 1990 (Landsat-5) and year 2023 (Landsat-9) for a specific tar sands extraction area and found a 10-fold expansion of the activity over that period (Figure 3).
The legal team defending the Beaver Lake Cree Nation did extensive documentation and used a collection of satellite images and old aerial photographs to prepare the cumulative impacts report (Toledano 2014). Therefore, in this case, remotely sensed data were used by the local organization to support their legal defense. The spectral domain of the remote sensing data used, whether visible or infrared, was not specified. The legal process is still ongoing.
Timber extraction
Baka forest communities in the Democratic Republic of the Congo vs Europe-based Norsudtimber: tropical deforestation
The logging activities carried out by forest management companies in the Democratic Republic of the Congo (DRC) have triggered conflicts in local communities. The set of concessions held by the Europe-based Norsudtimber corporation gathered about 60% of the timber trade in the DRC in 2017 (EJAtlas 2023b). Local communities opposing timber extraction, together with Global Witness (non-governmental organization, NGO), recorded in 2018 that 18 of the 20 Norsudtimber concessions did not comply with the DRC environmental policies for forest exploitation, and that the infringements included felling endangered tree species and felling trees outside the concessions (GlobalWitness 2018). According to the Forest Peoples Programme (a human rights NGO based in Europe), local communities had previously opposed deforestation and had been confronted with repression (Litvinoff and Griffiths 2014).
Global Witness made use of the Landsat-derived Global Forest Cover Change (GFCC) map, a product generated by the remote sensing team at the University of Maryland (Hansen et al. 2013), available on the Global Forest Watch (GFW) website, and widely used for the assessment of logging roads in the Congo basin (Couturier 2019). According to the GFCC data and a visual appraisal of the Landsat images, logging roads were detected outside the Norsudtimber concessions. The connection of these roads with the land under concessions provided evidence that Norsudtimber had illegal logging activities in 18 of 20 concessions (Global Witness 2018; Annex 2). The forest loss layer of GFCC and the limits of the concessioned lands are displayed over parts of the forested Congo basin in Figure 4.
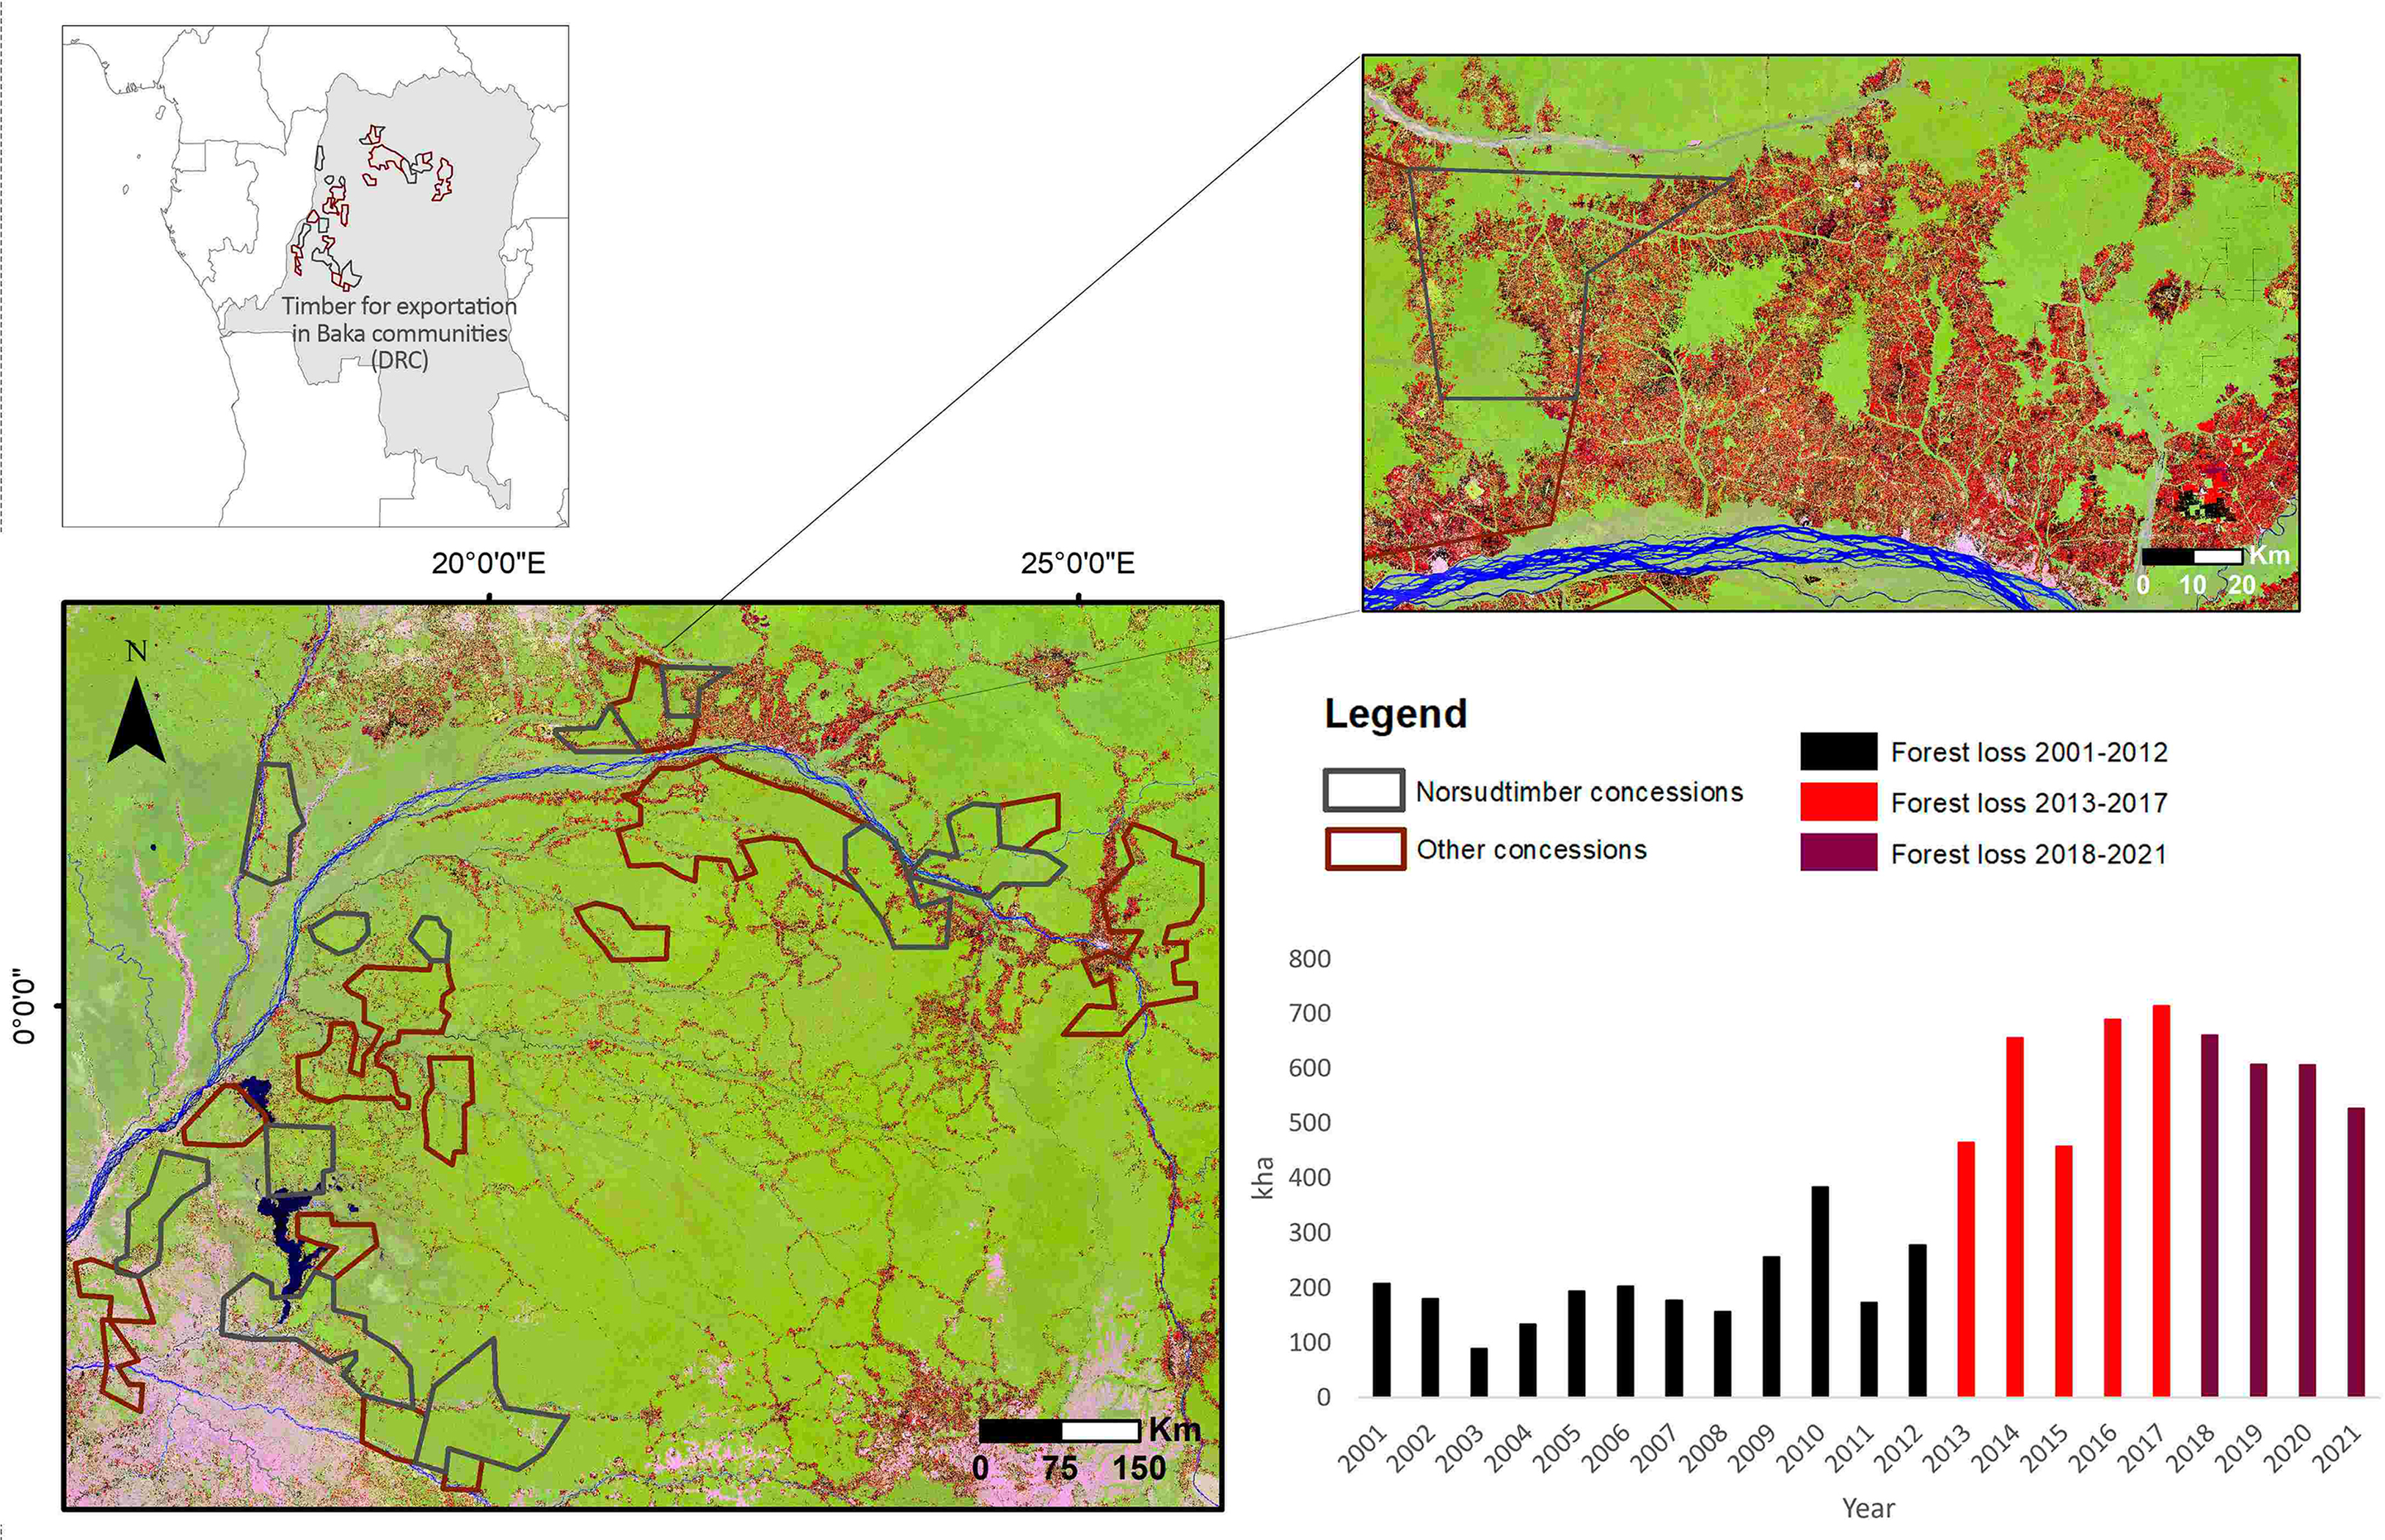
Deforestation patches and logging concessions in the democratic republic of the Congo (DRC), northern region. Forest loss maps and graphics, extracted from the Landsat-derived Global Forest Cover Change product (Hansen et al. 2013; www.globalforestwatch.org), were contrasted with the overlaid concessions of the forest management companies. The smaller map, enlarging a section, is to demonstrate the logging roads mentioned in the text.
The “Forest loss” raster layer of GFCC records the year of forest loss from 2001 up to the present. A forest loss pixel corresponds to an abrupt change in vegetation indices over time, identified by a decision tree algorithm applied to the complete multitemporal set of Landsat imagery in the visible and infrared parts of the spectrum. In this case, the satellite data were used by an environmental justice organization to monitor the illegal timber extraction that affected the community. The harmful illegal practices could be reported with the aid of remote sensing. The enforcement of environmental law in such cases is complex and usually rests on the side of the powerful actors; however, the evidence led to national and international pressure on the institutions and countries involved in the timber trade and it prompted actions against unauthorized logging.
Intensive food production
Cherán and Nahuatzen indigenous communities vs regional entrepreneurs: expansion of timber extraction and avocado orchards
Land use conversion after overlogging by local and regional entrepreneurs is currently the main driver of native forest removal in the Purépecha plateau region of Michoacán state, Mexico. In the 1990–2016 period, the area devoted to avocado cultivation in Michoacán nearly tripled (De la Vega-Rivera and Merino-Pérez 2021), in line with the expected growth in export of avocados to the United States*** and Canada following the 1994 North American Free Trade Agreement (NAFTA). However, smallholder farmers, agricultural workers, and local communities have received a minimal proportion of the high profits of this agribusiness while being subject to land dispossession, forest fires, increases in violence related to criminal groups, and soil and water pollution (EJAtlas 2022a). Additionally, in the context of permeable rock formations on the Purépecha plateau, the large-scale cultivation of avocado is depleting the water resources (Arima et al. 2022).
Substantial representations of two neighboring indigenous communities on the Purépecha plateau have confronted the extractive loggers and the colluding public institutions in, respectively, 2011 and 2017. In Cherán, a civil uprising in 2011 against corruption and crime sought to prohibit timber extraction and avocado cultivation in the municipality; an autonomous indigenous government was established, which expelled from the municipality agents of the official system of political parties in Mexico (EJAtlas 2022b). Since then, deforestation has consistently been very low, as assessed via the GFCC product (Figure 6A; Osorno-Covarrubias, Couturier, and Piceno Hernández 2018). A forest restoration program implemented by the local Cherán indigenous authorities contrasts with high rates of deforestation in the surrounding region, as assessed via the GFCC product. The indigenous autonomous organization in Cherán organized a workshop in 2014, involving the local community and remote sensing practitioners. One of the results of this workshop was the co-design of a poster containing georeferenced degraded forest areas and color composites of Landsat satellite data to show the forest devastation between 2001 and 2011. They also disseminated this information through the local radio station (Piceno Hernandez 2017).
Following Cherán’s lead, the neighboring indigenous community in Nahuatzen sought support from remote sensing practitioners to evaluate the deforestation resulting from expansion of avocado orchards in the municipality. Additionally, they used maps to identify legal and direct-action strategies aimed at reversing the trend. Following the co-production of a knowledge framework, three workshops were held with remote sensing practitioners on the local perceptions of landscape changes due to illicit activities (agribusiness and logging), on the use of satellite images to monitor them, and on the use of Global Forest Watch datasets. An autonomous Nahuatzen government attempted in 2017 could not be consolidated and was overthrown by official political parties and economic interests. Since then, deforestation rates have remained high, as assessed via the GFCC product (Figure 5); in the community, 31.2 hectares at a rate of 2.6 ha/year were deforested between 2001 and 2012. Following the rush to expand avocado orchards from 2013 to 2021, deforestation increased to 228.7 hectares at a rate of 25.4 ha/year, in violation of the official ecological planning maps in the municipality. This suggests that the political party in charge may have remained under the influence of the regional entrepreneurs of avocado plantations and loggers. In 2023, the local organization placed a poster over a governmental program announcement to raise awareness (as part of its political strategy) about the ongoing devastation (Figure 6). Additionally, the local organization in Nahuatzen independently used the Global Forest Watch product as a tool to implement a reforestation program, disregarding official policies. In this case, after holding workshops to disseminate the use of satellite data infrastructure, local organizations learnt how to use remote sensing tools independently. Additionally, the authors of the present article are currently developing online tutorials to enhance the usability of publicly available satellite data (Landsat and Copernicus missions) and satellite data derived products (Global Forest Watch), in response to the growing demand from communities for forest cover monitoring in various parts of Mexico.
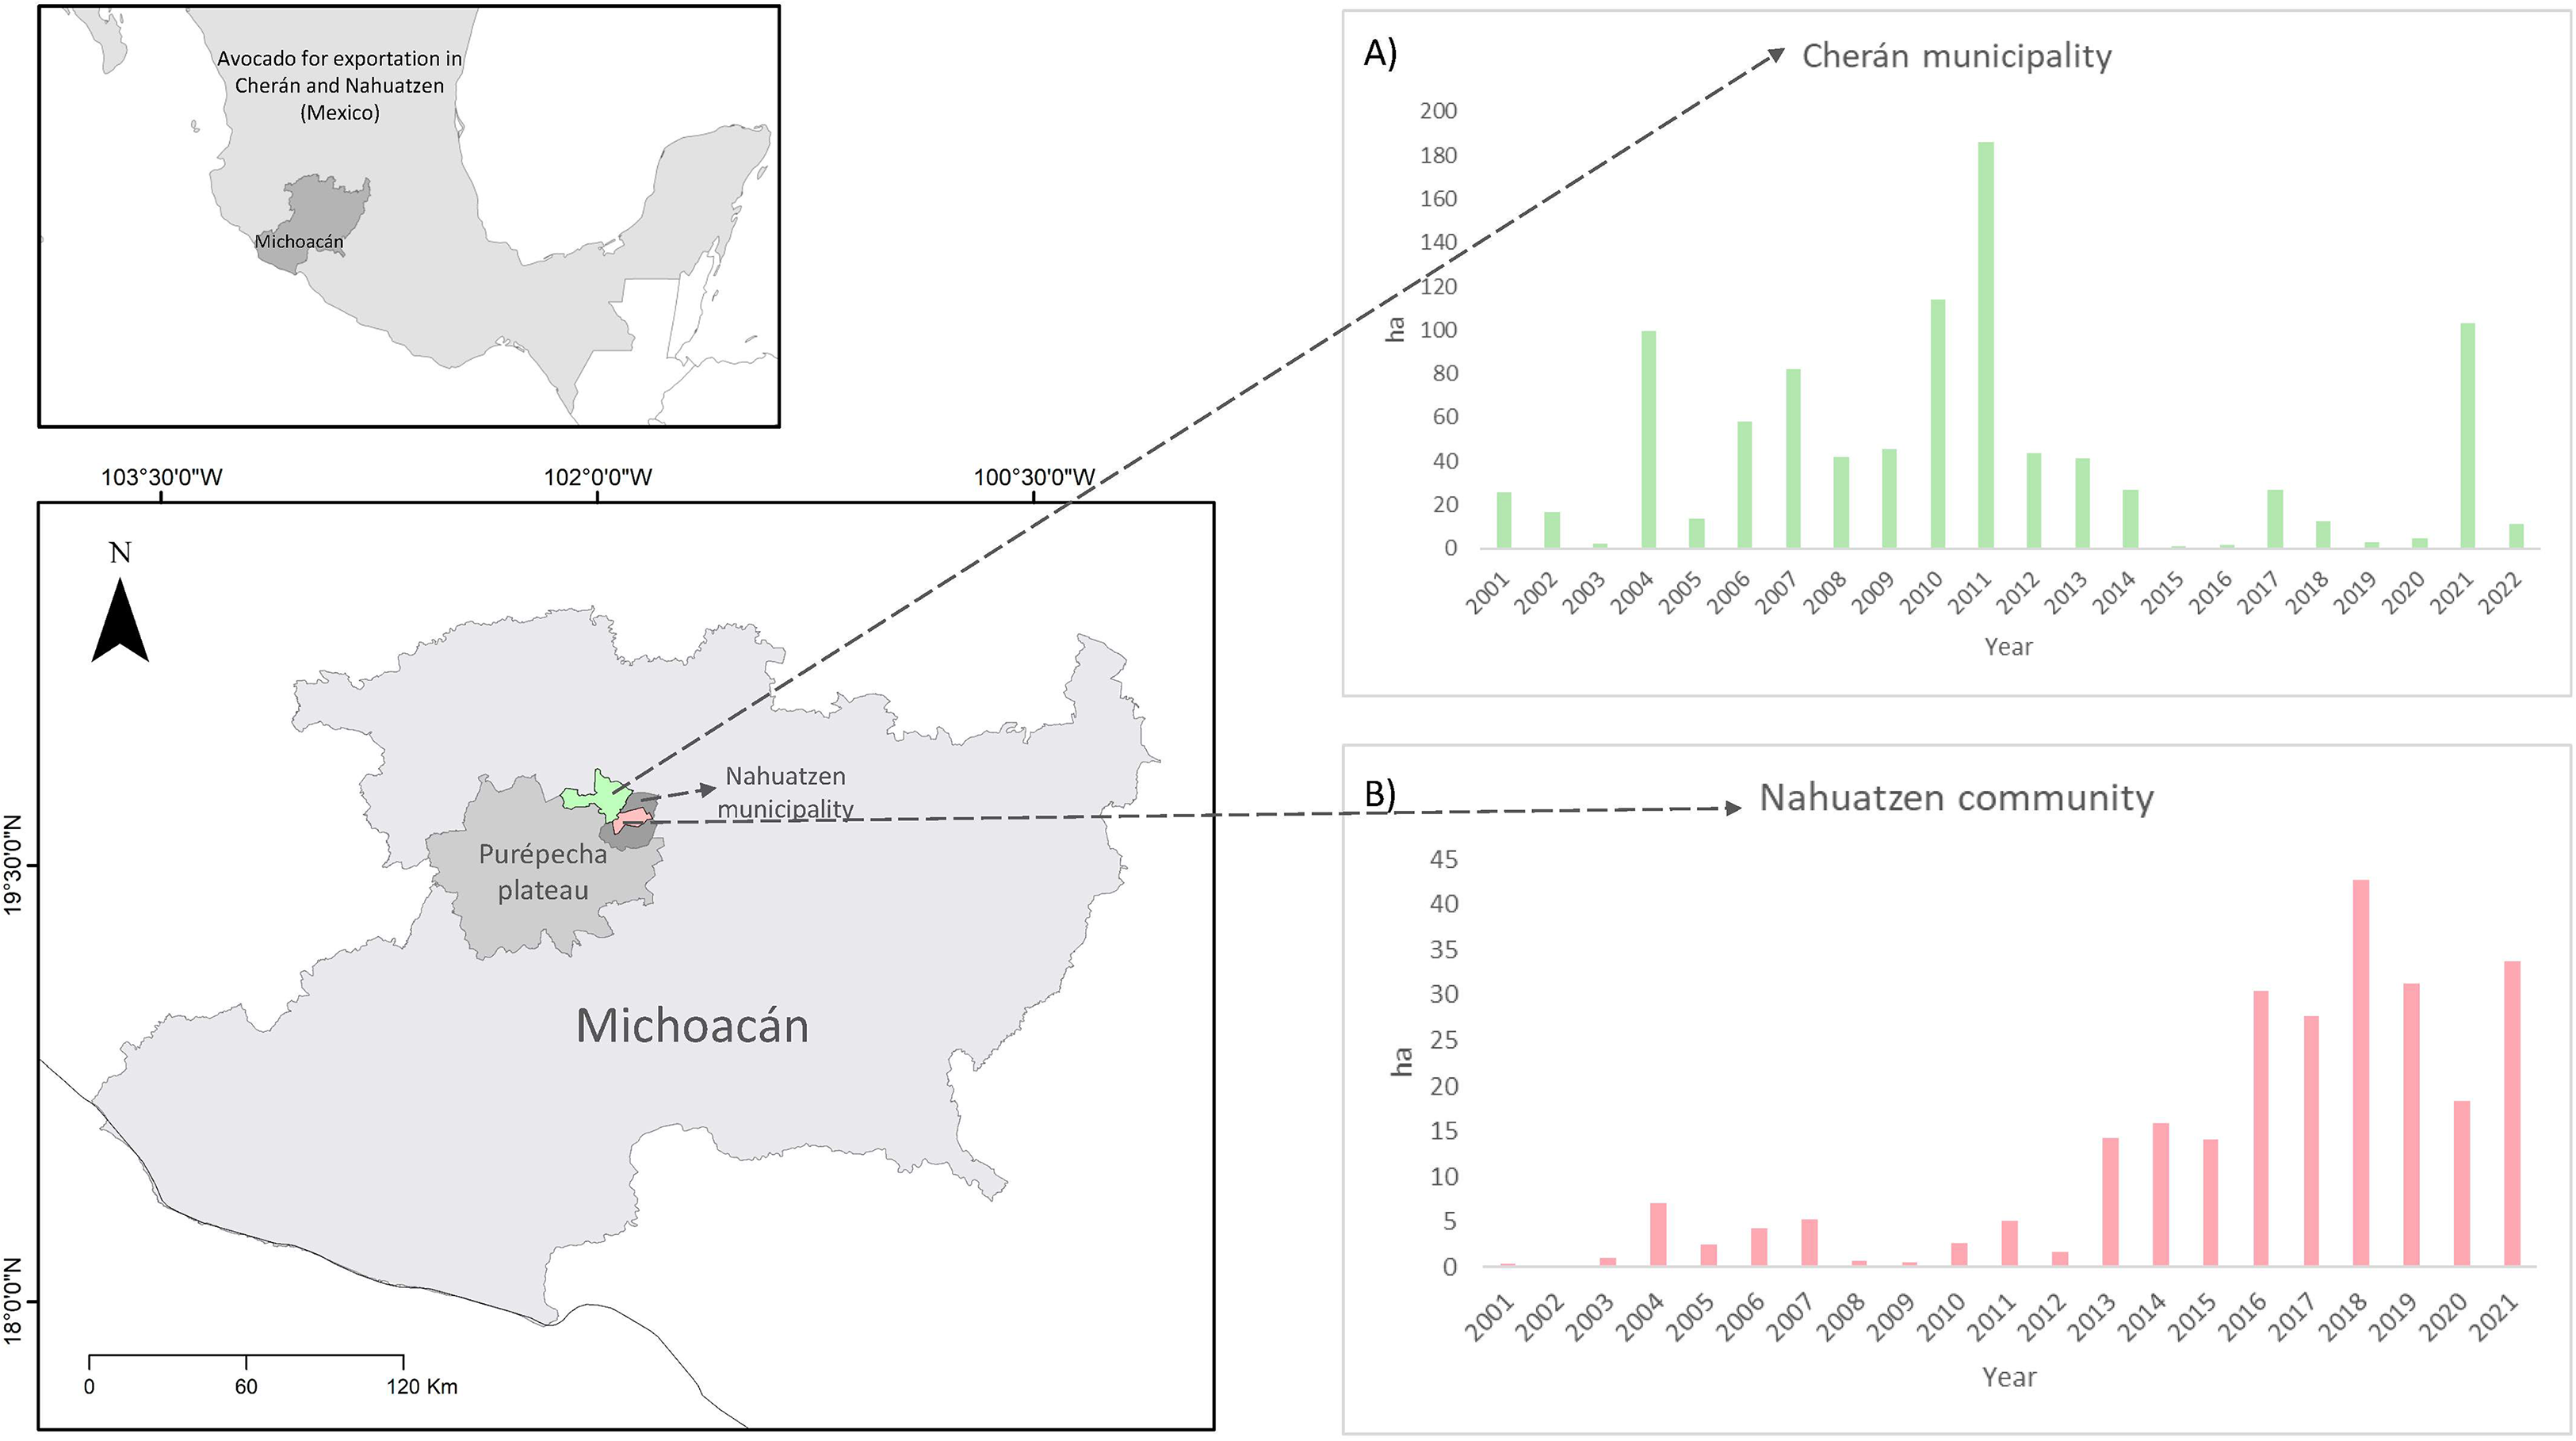
Deforestation trends (A) Cherán municipality and (B) Nahuatzen community, according to the global forest cover change product (Hansen et al. 2013; www.globalforestwatch.org).
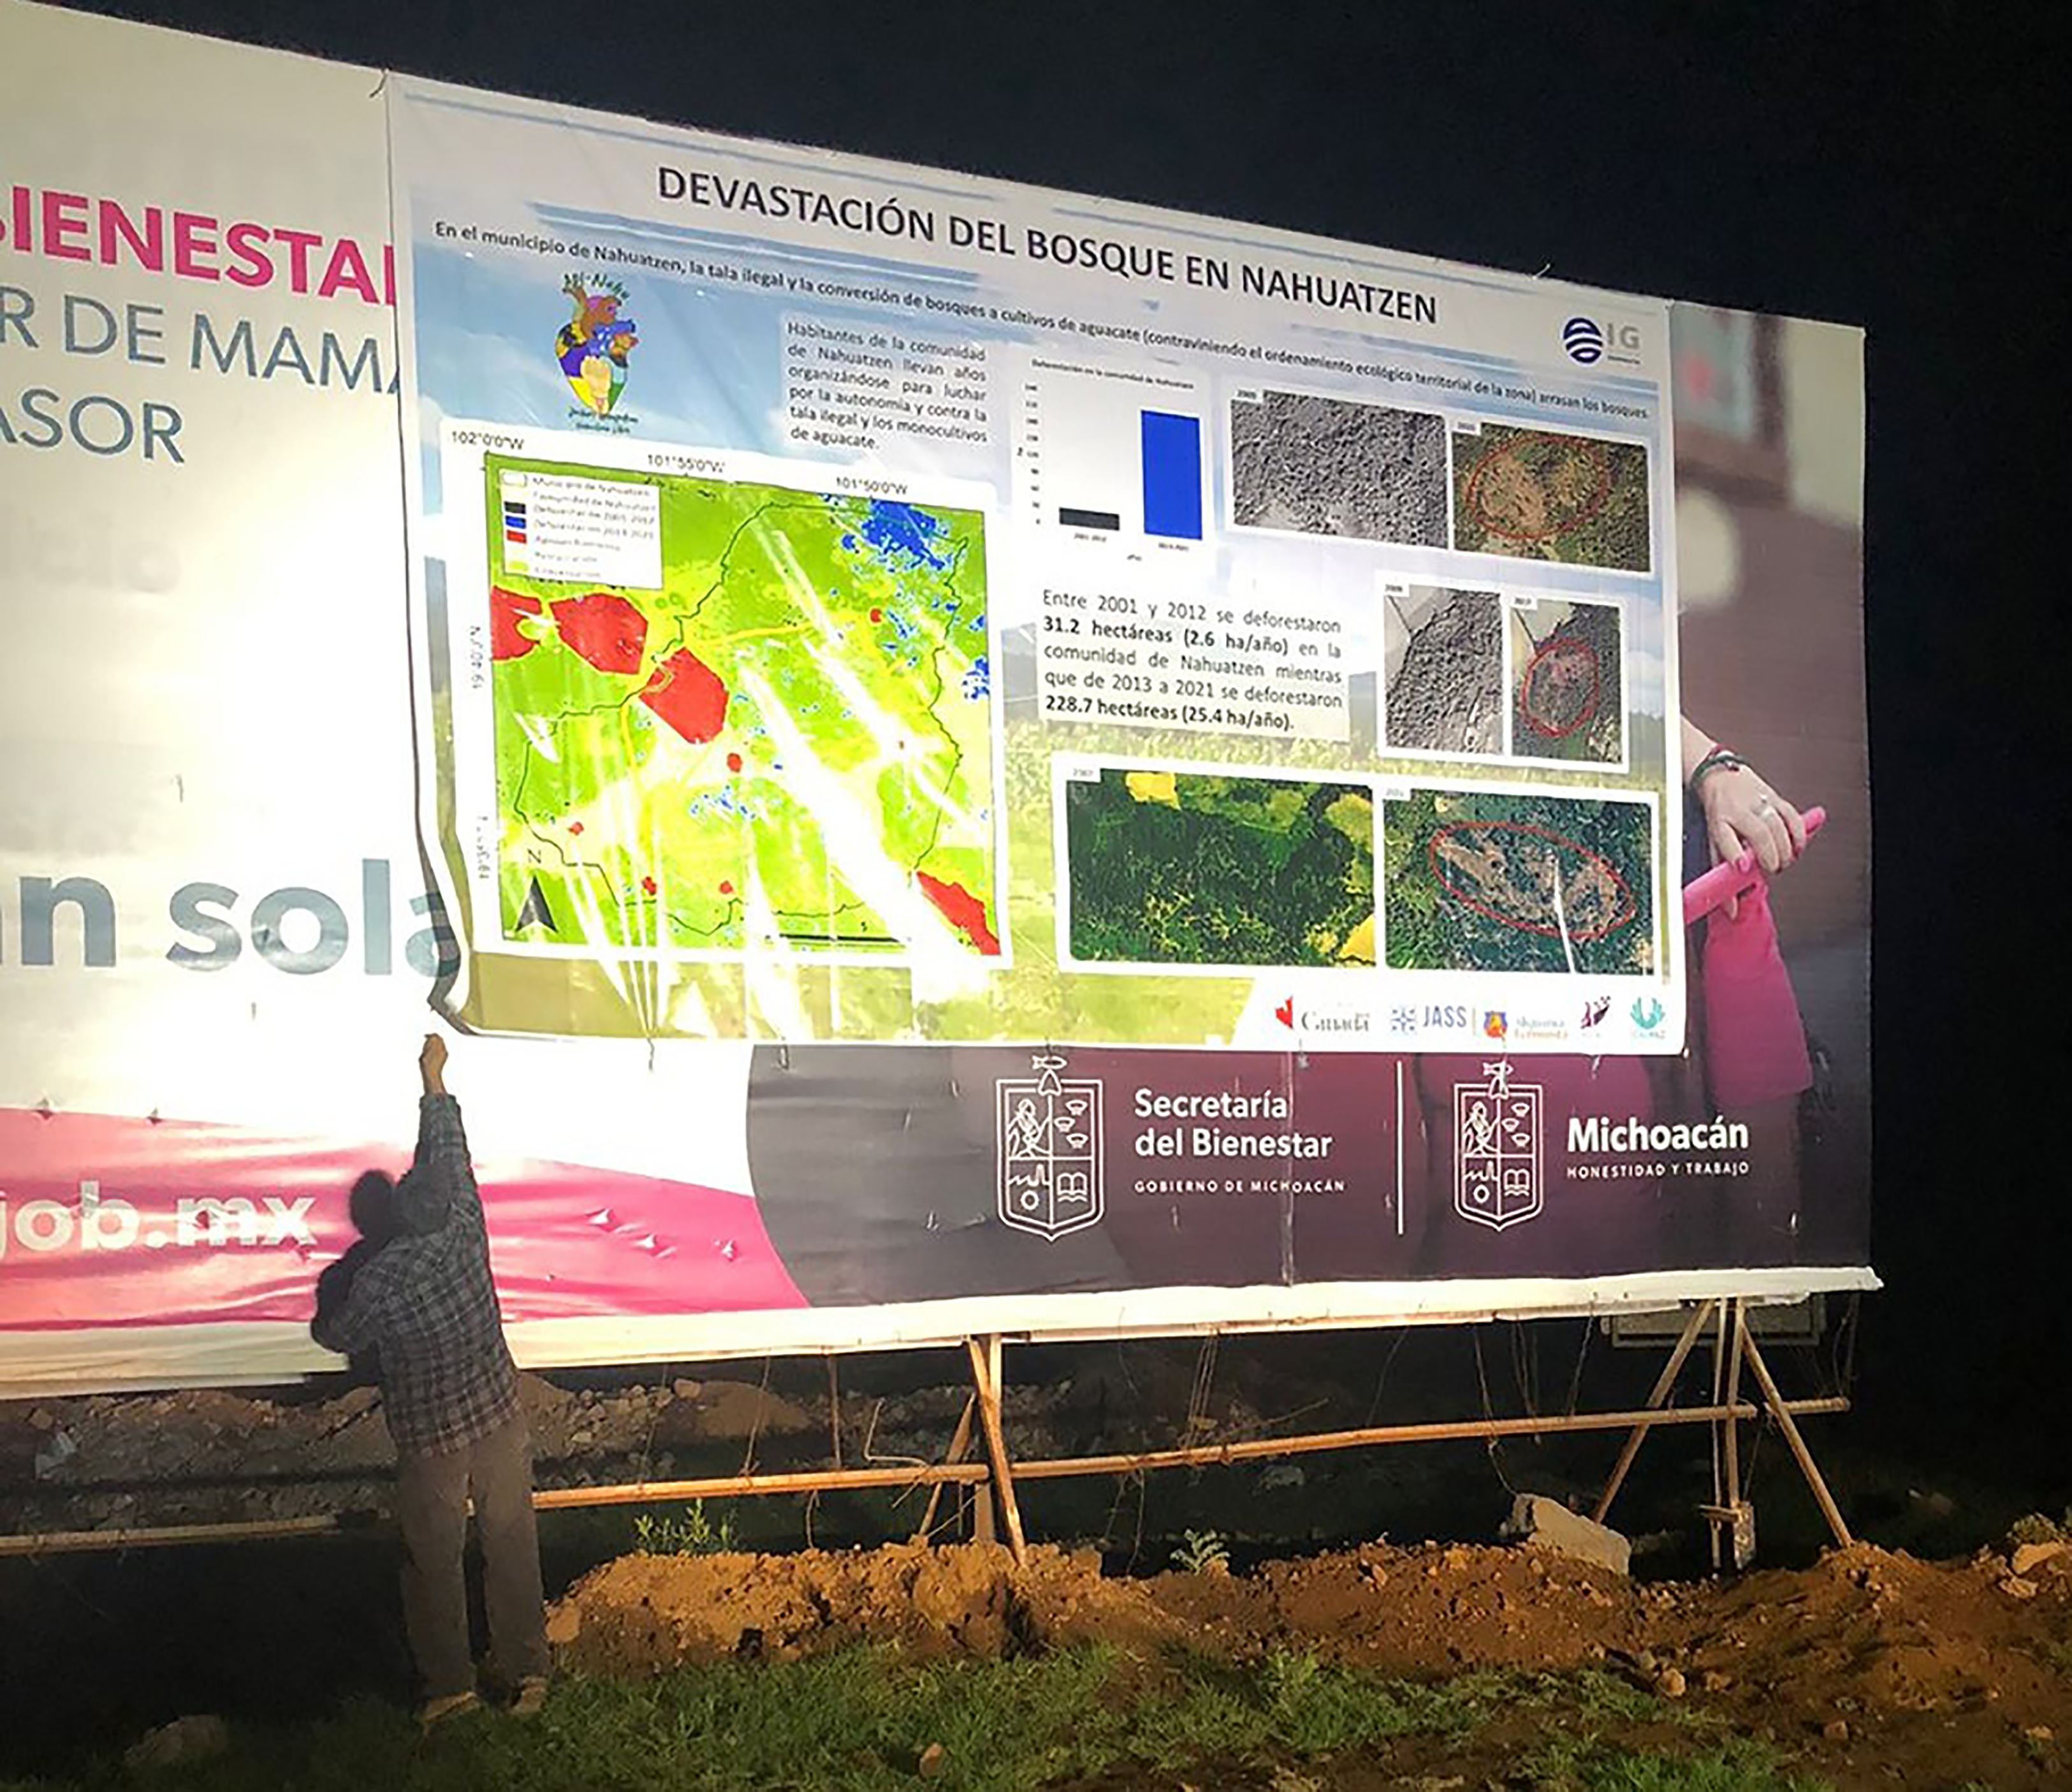
Poster protesting against the devastation of forests in contravention of the official ecological land planning in Nahuatzen. To emphasize the protest, the poster was hung, 2023, over a governmental program announcement.
Water dispossession
Inhabitants of the region of Dongting Lake vs the state of China: water dispossession by the state of China through construction of the Three Gorges Dam
The Three Gorges Dam in China is the world's largest hydroelectric dam. The construction of the dam has entailed disastrous ecological and social consequences. At the implementation stage of the project and since the impoundment of the water in 2003, the large-scale inundation of human settlements forced the resettlement of over one million people from allegedly 13 cities, 140 towns, and 1352 villages of the Yang Tze watershed, many of whom never received adequate compensation for their economic, social, and cultural losses. Additionally, the decreased river flow has caused the intrusion of sea water from the East China Sea, altering the coastal ecosystem and threatening one of the world's biggest fisheries (EJAtlas 2023c).
The extent of the water surface of the planet is documented (free download) from 1984 to date at 30 m resolution at Global Surface Water Explorer (GSWE: https://global-surface-water.appspot.com/). Big data exploration and information extraction techniques, such as non-parametric classifiers, visual analytics, and evidential reasoning, were applied to the entire multi-temporal orthorectified Landsat-5, 7, and 8 archive for water detection. The inference engine of the system was a procedural sequential decision tree, which used both the multispectral and multitemporal attributes of the Landsat archive as well as vegetation indices and color-space transformations for the following band combinations: shortwave infrared; near-infrared; red; and VisNIR using a standard transformation (Pekel et al. 2016). Figure 7 shows water occurrence change intensity in Dongting Lake between 1984 and 2021.
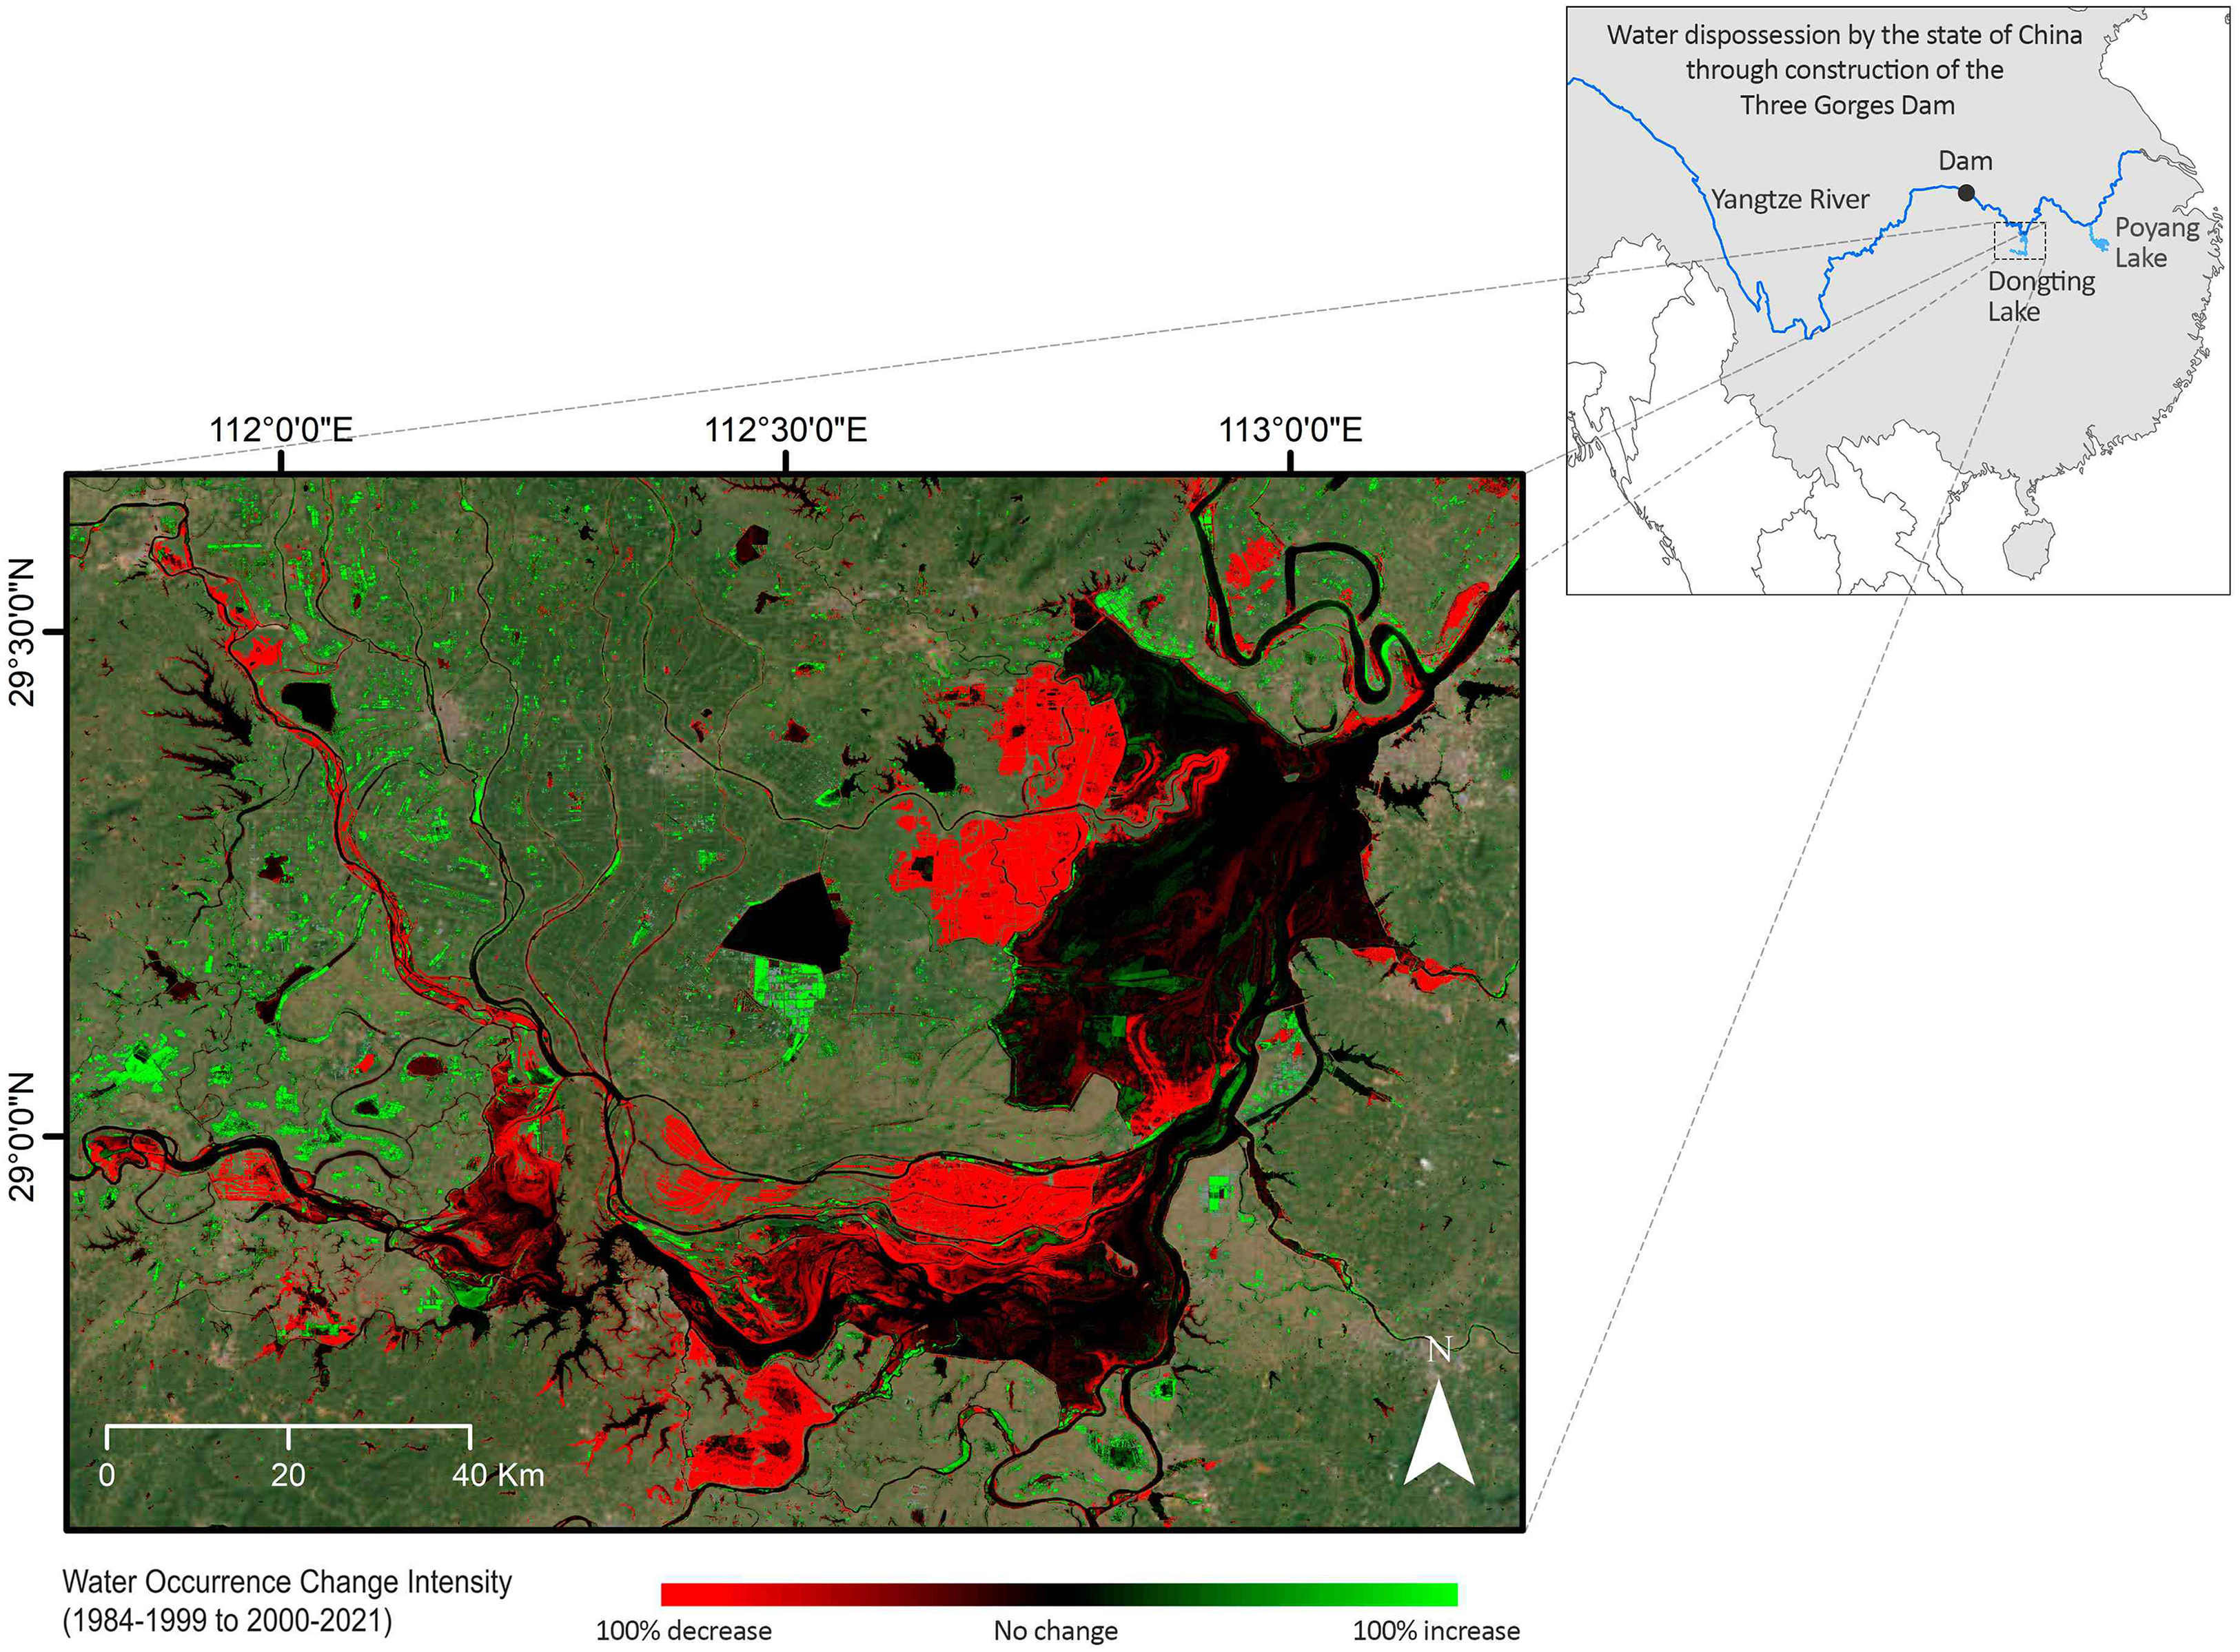
Water occurrence change intensity in Dongting lake between 1984 and 2021 (global surface water explorer, https://global-surface-water.appspot.com/map). Green, increases in water occurrence; red, decreases in water occurrence; black, no significant change in water occurrence during the 1984–2021 period. The intensity of the color represents the degree of change (%). Gray areas: insufficient data to compute meaningful change statistics.
Apart from the data available in the GSWE platform, the effect of the Three Gorges Dam on downstream freshwater lakes was assessed by Feng et al. (2013), on the basis of MODIS (Moderate Resolution Imaging Spectroradiometer) time series from 2000 to 2009. Statistically significant decreasing trends were found in the inundation areas of the two largest freshwater lakes in China (Poyang Lake and Dongting Lake), which are critical in providing local water supplies. Wu and Liu (2017) also found that the dam operation altered the seasonal inundation pattern of Poyang Lake and reduced the water area. To our knowledge, the evidence gathered in these academic studies has not formed part of feasible strategies in a struggle aiming at ending the operation of the Three Gorges Dam.
Back in the 1990s in its planning stage, the Three Gorges Dam project was presented as a strategic contribution to supply the growing energy demand of the Chinese population at the regional scale, but at that time it was also fully recognized (and it is still recognized by the Chinese administration today) that severe and extended social-environmental impacts would occur at the watershed and local scales (Feng et al. 2013). Whether a feasible alternative with a less damaging infrastructure would have met the needs of the targeted population is a complex but essential societal question. This merits debate from technical, geographical, and environmental justice perspectives. As in most conflicts addressed in this section, behind this debate lies the deep, geographically rooted, scale-related nature of the metabolism of densely populated societies. From the perspective of environmental justice, remote sensing evidence about environmental impacts could, with the help of the GSWE platform, support struggles against future proposals for large-scale infrastructure construction and extractive projects.
Mineral ore extraction
Amungme community, West Papua vs Freeport-McMoRan Inc.: the devastating open pit mining practice
The United States-based company Freeport-McMoRan owns the open-pit Grasberg mine (West Papua), which is considered to be the largest gold mine and the third largest copper mine in the world (EJAtlas 2022c). The mine is near the headwaters of the Aghawagon-Otomona-Ajkwa river system that flows into the Arafura Sea. Over the past 30 years, Grasberg tailings have been deposited directly into the river system, leading to the pollution of water with heavy metals (Alonzo, Van Den Hoek, and Ahmed 2016) and the conversion of lowland areas into dead landscapes, thereby destroying the local indigenous communities’ way of life based on sustainable agriculture and forest products, fishing, and hunting. Valleys were allegedly filled with mine waste that leaches copper, acids, and mercury into the ground, and the springheads that communities used for drinking water kilometers away were polluted (Olsson 2013). Deaths of local people were attributed to polluted water or were caused by landslides from piles of rock waste. The strong resistance movement against the mine has faced violent repression from the state of Indonesia as well as numerous human rights violations by the Indonesian military (Nakagawa 2008).
Multispectral and hyperspectral imagery in the visible and NIR spectral ranges is used to assess water quality (Doxaran et al. 2002), including suspended particulate matter (SPM) in Indonesia (Sanderson and Taylor 2003). A model developed by Alonzo, Van Den Hoek, and Ahmed (2016) and based on Landsat satellite images for 1987–2014 estimated increases in concentrations of polluting suspended particulate matter (SPM) through estuaries of rivers that flow near the mining site and down to the sea. Detection of SPM by red band reflectance was calibrated against SPM concentrations measured in situ along sampling transects. After the establishment of the mine, the closest estuary had SPM concentrations consistently above 40 g/m3 (a recognized threshold for severe hazards to biodiversity and health), these concentrations being significantly higher than in neighboring estuaries. That study showed that mine tailings reach the sea, increasing coastal concentrations of SPM and heavy metals. Although the Amungme communities have not used the results of this study, the evidence could become actionable if conveyed to a supporting Indonesian organization. This illustrates another field (water pollution), for which remote sensing may be used for environmental justice organizations, although it is often complex to monitor.
Towards an alliance between local communities and the remote sensing practitioners?
Knowledge co-production between remote sensing practitioners and activist groups, such as environmental justice organizations, could help to overcome the current unequal use of technology and eventually lead to an independent adoption of this data infrastructure in environmental justice struggles. The scientific community, in a variety of disciplines and research areas, has learned in the past to value the potential of geographic and remote sensing data in socio-environmental struggles. Along the trajectory of critical geography and GIS tools, alliances have been forged with local communities, some of them including satellite imagery. For example, an in-depth study of eighteen First Nations online mapping projects (McGurk and Caquard 2020), revealed empowerment possibilities but limitations in the collaboration with geographers for the representation of indigenous territories. With regard to a community forestry project in Nepal, Nightingale (2003) suggested that aerial imagery provides only a part of the picture and that this must be allied to the knowledge and subjective perceptions of the local community to enhance realistic assessment of positive achievements. A comparison of classification by remote sensing imagery with classification according to expert and local knowledge in India (Robbins and Maddock 2000) suggested that the recognition of land cover classes can reflect different perspectives and understandings of territories. Pilot projects around the use of drones by indigenous operators to map tropical forest settings in Central and South America have shown potential in monitoring illicit extractive activities (Paneque-Gálvez et al. 2017). Other collaborative efforts have included the contribution of geographers to a digital atlas of culturally significant indigenous places following a community-initiated request in Kamchatka, Russia (Thom, Colombi, and Degai 2016).
Collaborations that depend on external technological expertise can sometimes lead to contradictions. Nonetheless, the social organization in many environmentally devastated territories, some of which are documented in this paper, could point to fertile pathways for the practice of critical remote sensing (Table 2). A crucial point is how these data can be adopted and how to overcome the dependency on expert knowledge for obtaining, processing, and analyzing remote sensing data. Three of the five environmental conflict cases presented in this study (Table 2) showed that environmental justice movements have adopted, to some extent, remote sensing data in diverse circumstances, including legal defense, raising awareness, direct action, or monitoring compliance with environmental law. Nonetheless, of the five cases, only that of the avocado orchards in Mexico hinted at the independent use / adoption of remote sensing data by the local organization; more generally, an environmental justice organization or the academic community has instead taken the role of the remote sensing practitioner, collaborating with the local organization in an alliance scheme. This lack of remote sensing adoption is in part explained by the multi-level technological literacy (Figure 1). At the third technological level, however, and in our experience, tutorials (didactical, online multi-media materials) that facilitate the use of existing online remote sensing products are yielding fruit and could be an important part of the practice of critical remote sensing.
Use of remote sensing (RS) resources in diverse types of struggle for environmental justice.
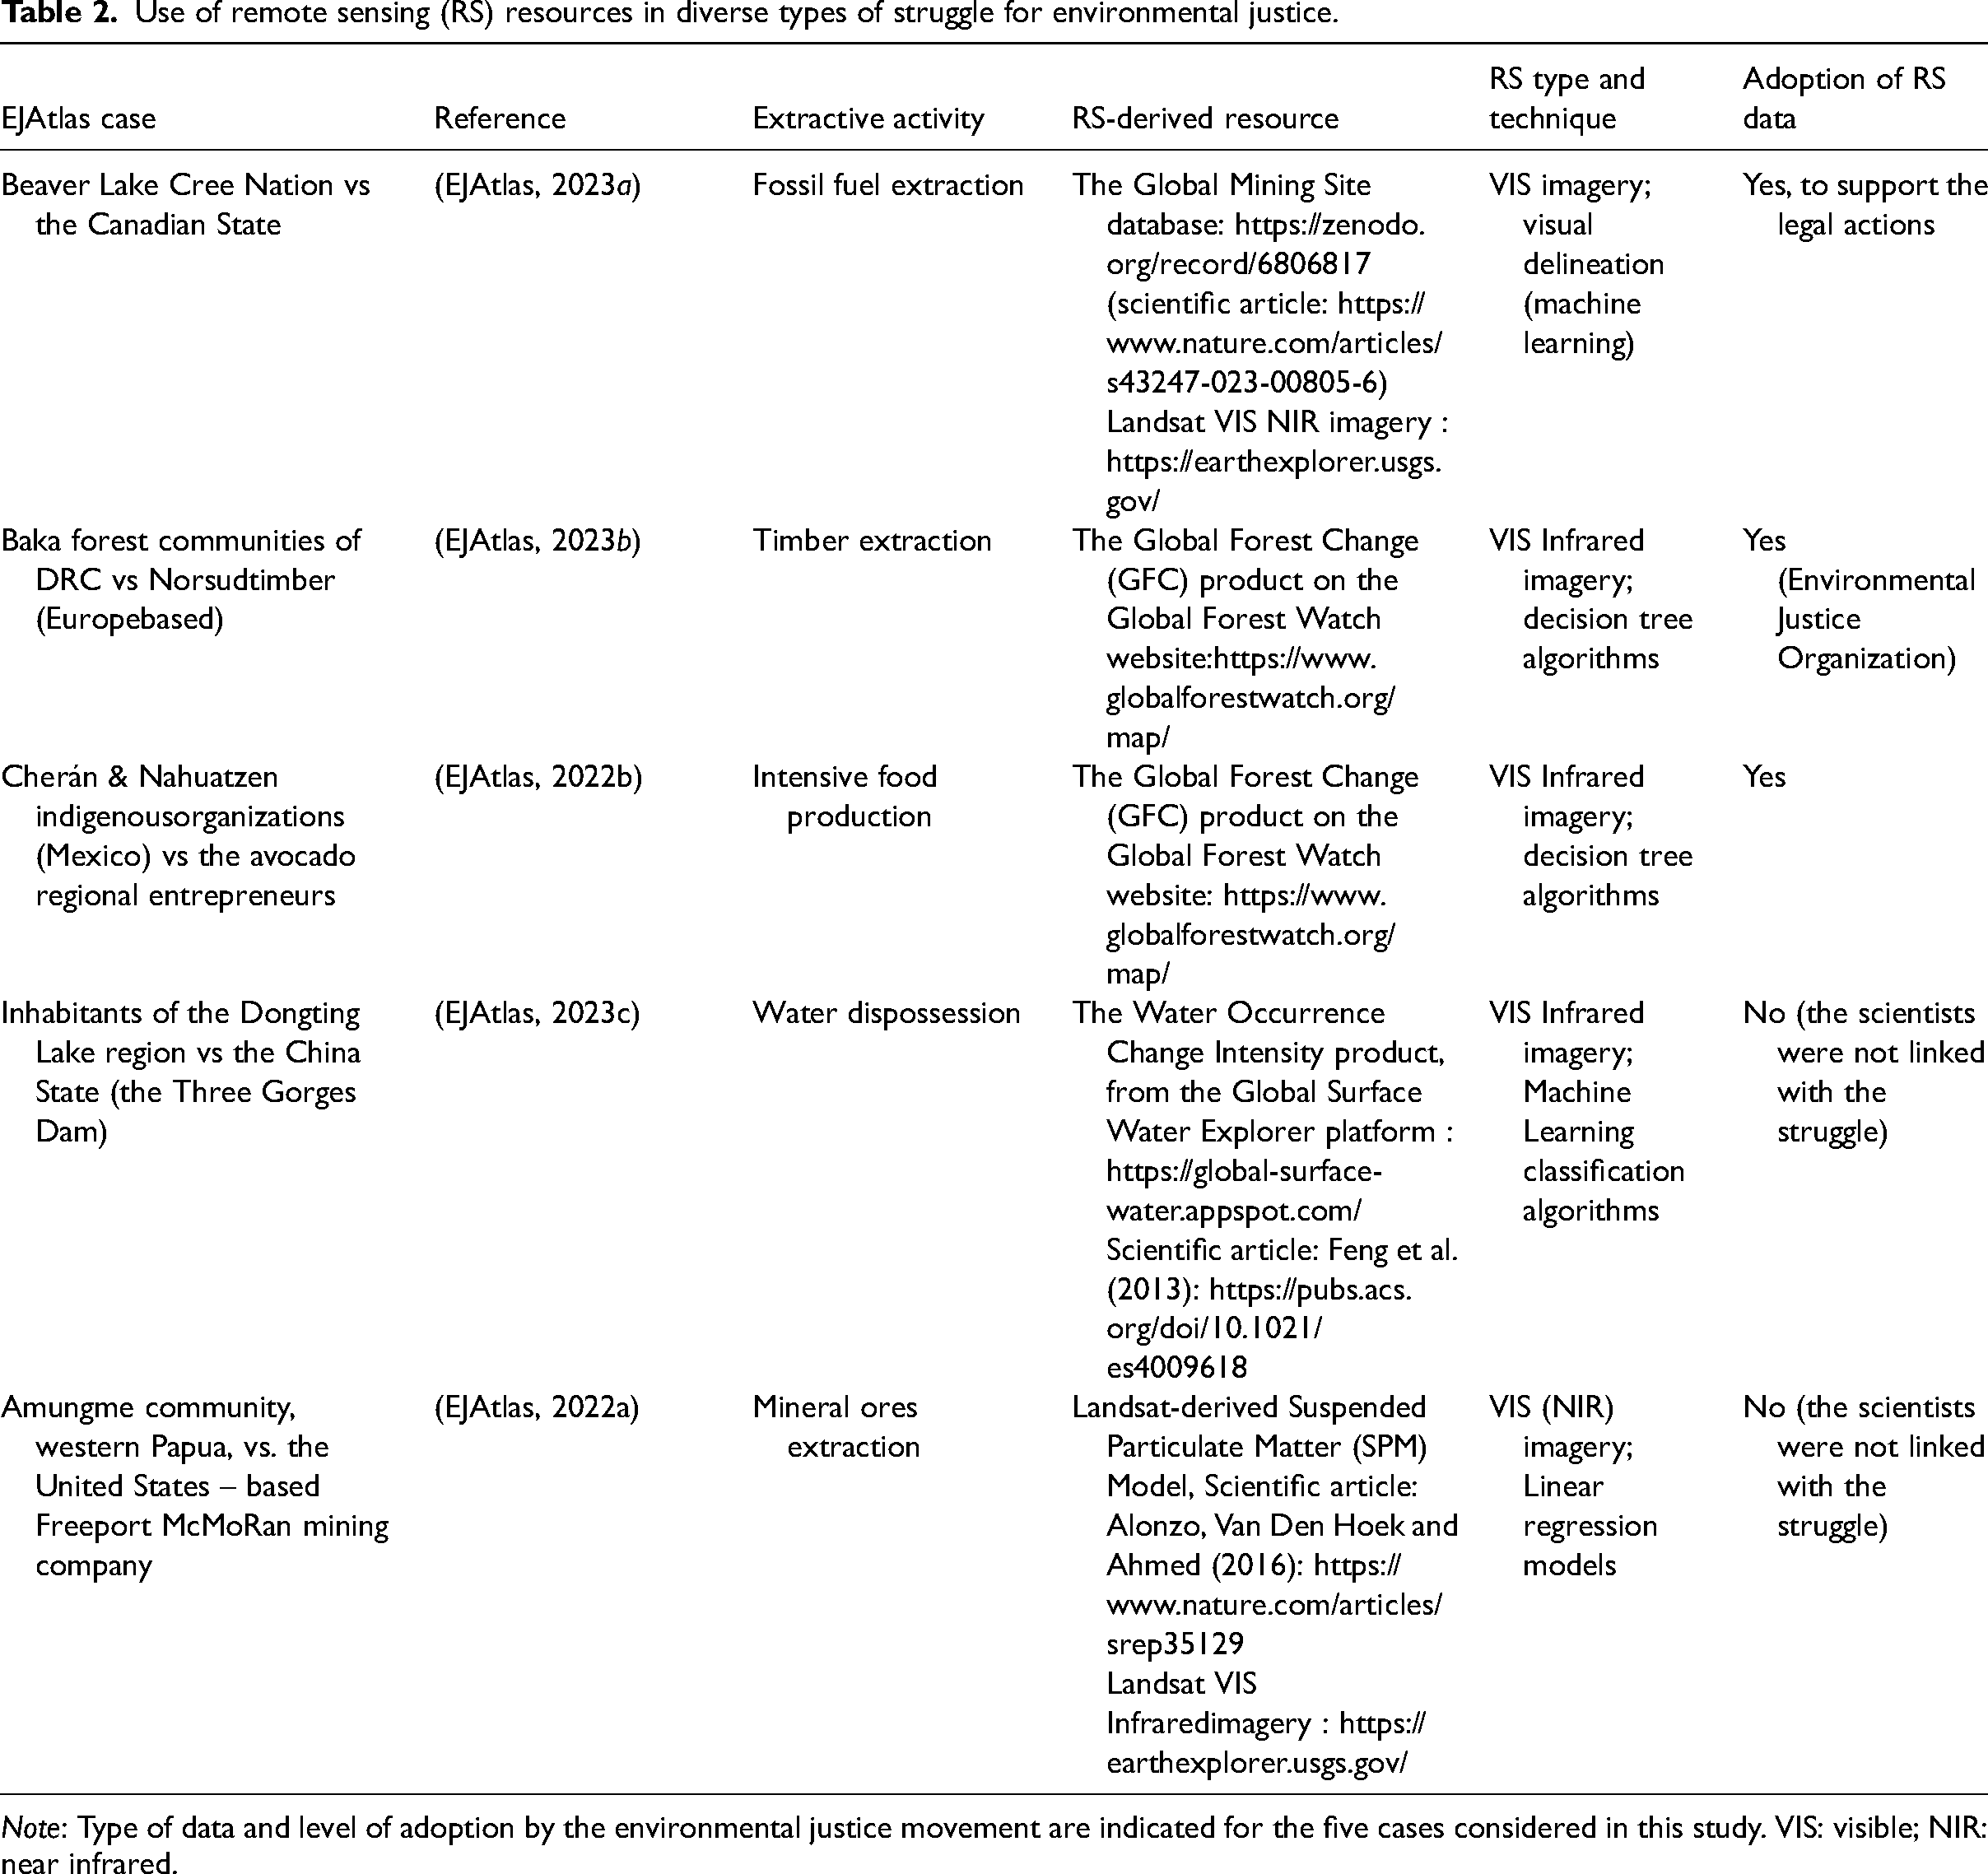
Note: Type of data and level of adoption by the environmental justice movement are indicated for the five cases considered in this study. VIS: visible; NIR: near infrared.
In environmental conflicts characterized by strong internal political organization, e.g., the Cherán community case (Osorno-Covarrubias, Couturier, and Piceno Hernández 2018), the local community in struggle might favor longer-term collaboration with remote sensing practitioners established in the same region and might eventually adopt the use of remote sensing data independently. In such collaboration, connections of young professionals from the local communities with academic and collective activist networks have favored the possibility of long-lasting dialogues and continuity in the use of the satellite data infrastructure. In this, the subordination and expert dependency effects discussed elsewhere (Paneque-Gálvez et al. 2017; McGurk and Caquard 2020) may be overcome to some extent when the remote sensing practitioners are geographically close to the conflict and engaged with the local political process. We hypothesize that the strength and level of political and economic autonomy attained by the local community is crucial for a long-lasting alliance. Further analyses of the experiences and processes cited here could enhance the likelihood that the satellite data infrastructure be adopted in environmental justice struggles.
In the remaining cases where remote sensing was not used or adopted by the environmental justice movement, the remote sensing-derived evidence reported in this study can potentially be used by environmental justice movements in similar struggles. The development of satellite data infrastructures over the past decade could indeed facilitate the adoption of remote sensing-derived products. Due to advances in spatial data infrastructures, cloud computing services, and open software visualization, there is a trend towards the creation of tools for online interactive mapping and analysis (some of them listed in Table 2) that allow easier access to information derived from remote sensing, in some cases without the need for skills in the use of GIS software. Beyond the tools discussed in this study, the interactive platform MapBiomas (https://brasil.mapbiomas.org/) developed in Brazil provides precise pixel-by-pixel evolution of land uses across an entire country. This platform, based on Google Earth Engine, has already been replicated and adapted to all Latin American countries, and is currently being adapted to Indonesia; the aim is to replicate it in all tropical countries by 2030.
In environmental justice struggles, critical remote sensing practices can only be achieved through knowledge co-production. An example of knowledge co-production for environmental and social justice is given by the “ConCiencias” conferences, held in the 2010s by the Zapatista support bases, which consisted of inviting scientists and the public in the autonomous territories of Chiapas, Mexico (Aguirre Rojas 2018). Their purposes were twofold: first, to gain insights from the teaching methods of autonomous indigenous communities; and second, to disseminate scientific research and its endeavors with regard to social and environmental struggles. In 2017, Subcomandante Insurgente Galeano, the voice of the Zapatista movement, called on the scientific community and the public to engage in a scientific and technological framework that could support “those at the bottom” (“los de abajo”) in their struggle against capitalism, which manifests through patriarchy, racism, and dispossession (Subcomandante Insurgente Galeano 2017). This type of initiative contributes to knowledge co-production in a way that can foster the practice of critical remote sensing in environmental justice struggles and, to some extent, sparked the idea for this article.
Conclusion
In this article, we demonstrate how environmental justice movements utilize, or could utilize, remote sensing data infrastructure to enhance their strategies and tactics, including oppositional narratives, legal processes, and direct action. Recent accounts of global environmental change have included the concept of injustice within the planetary boundary framework (Rockström et al. 2023). In line with this viewpoint from the environmental sciences and beyond, the study we present here helps to set innovative guidelines of action in the sense that critical remote sensing may strengthen environmental justice by defending safe and just planetary boundaries for the well-being of the communities.
The five cases presented here have demonstrated the relevance of remote sensing data in the struggle for environmental justice. In some cases, local non-experts have adopted remote sensing tools from online platforms; however, analysis of remote sensing data often relies on environmental justice organizations or remote sensing practitioners working in alliance with the local community. Faced with the burdens of environmental devastation, local organizations and communities are, in many ways, hindered from independently adopting remote sensing data. Practitioners of critical remote sensing can make technological concepts more accessible by providing online instructional multimedia materials on how to use products of remote sensing (Table 2 could serve as a starting point for resource compilation) and by themselves engaging in the environmental justice struggle.
Technological systems significantly shape societies. The critical remote sensing framework allows the use of non-commercial and commercial applications such as Google Maps and Google Earth in environmental justice conflicts. However, in practice it is too easy to gaze uncritically at smartphone applications and global maps, whose plethora of images divert attention to misleading information and priorities. Furthermore, in some environmental justice movements the technological literacy is limited, or access to the devices themselves may be restricted; a major goal must be to widen the adoption of publicly available remote sensing tools and to build data literacy. In the present context, the practice of critical remote sensing requires three key considerations:
First, remote sensing data are only a proxy of the actual processes occurring in a territory. For instance, the differentiation between a “deforested pixel” and a “forested pixel” extracted from satellite imagery depends on the quantitative parameters of the sensor and image processing. By contrast, the local community is the one that produces, perceives, and inhabits the territory on which forest degradation takes place. Remote sensing quantification of the environmental impact is subordinate to local perceptions of the degradation thresholds, and not the other way around.
Second, the information extracted from remote sensing data should be presented as part of a situated narrative in a global struggle for environmental justice. Far from a mere gazing at the environmental devastation, the information collected about an environmentally devastated territory should be viewed within the ongoing global expansion of commodity frontiers and global capitalism. The use of images in a critical application for environmental struggles should clarify how the extraction frontiers operate on a global scale and how remote sensing can help communities to resist dispossession and territorial degradation.
Third, it is crucial to disseminate the use of remote sensing data for the purpose of independent adoption by environmental justice movements. This can contribute to the autonomous efforts to resist extractive actors, who are already extensively utilizing remote sensing data infrastructure and other technological advancements.
Footnotes
Acknowledgments
J.S. is a recipient of a FPI doctoral fellowship from the Spanish Ministerio de Ciencia e Innovacion (grant: PRE2020-091907), which funded a research visit in the Laboratory for Geospatial Analysis (LAGE), Geography Institute, Universidad Nacional Autónoma de México (UNAM) in 2022. A.G.F is a recipient of a UNAM post-doctoral fellowship (CJIC/CTIC/5052/2021) in LAGE. The research underlying this work received funds through the Program for Support of Public Research and Technological Innovation Projects (PAPIIT) of UNAM under project number IN304722. We dedicate this work to all participants in environmental justice struggles throughout the world, with some of whom we are in close collaboration. In particular, our thoughts are with América, Lilia, Lulú, Paty, Efraín, Gloria, Ana, don Checo and don Gilberto from the Indigenous and Citizen Council of Nahuatzen; at this moment they are risking their lives in their fight against the depletion of pine forests and expansion of avocado orchards across their lands. We thank Dr. Ann Grant for her valuable help with the English language editing of this manuscript.
Declaration of conflicting interests
The authors declared no potential conflicts of interest with respect to the research, authorship, and/or publication of this article.
Funding
The authors disclosed receipt of the following financial support for the research, authorship, and/or publication of this article: This work was supported by the Ministerio de Ciencia e Innovación, Dirección General de Asuntos del Personal Académico, Universidad Nacional Autónoma de México (grant number PRE2020-091907, CJIC/CTIC/5052/2021, IN304722).