
Abstract
Energy access is pivotal in driving economic development and enhancing living standards. Burkina Faso is a developing country, with only 19% of the population having access to electricity in 2021. The study's main objective is to perform a comprehensive techno-economic analysis of a 100 MW centralised solar PV power plant in Burkina Faso. The study investigates three distinct scenarios: (1) electricity generation for grid supply, (2) hydrogen production through water electrolysis, and (3) ammonia synthesis from hydrogen and atmospheric nitrogen. RETScreen software was used to conduct the solar PV system's technical, economic, and emission analyses. In addition, mathematical modelling was adopted to compute hydrogen and ammonia production potential. The results indicate that LCOE, which varies from 0.089 USD/kWh in Djibo to 0.095 USD/kWh in Bonfora, is significantly lower than the residential and business electricity tariffs in Burkina Faso. Similarly, the LCOH ranges from 5.21 USD/kg to 5.52 USD/kg and is comparable to the regional studies. Theoretically, only 1% of the electricity produced from the PV system would be required to generate hydrogen to produce 72.6 kt of ammonia fertiliser for the 6.1 million hectares of arable land in Burkina Faso. Furthermore, Djibo had the highest carbon dioxide emissions potential savings, ranging from 24 ktCO2/GWh for 25% electricity generation to 95 ktCO2/GWh for 100% electricity generation. The findings of this study provide key insights into the feasibility and potential benefits of deploying centralised solar PV systems in Burkina Faso. The findings could be helpful to stakeholders in developing the Burkina Faso solar PV sector for sustainable development.
Introduction
Energy drives economic growth and enhances living standards (Afonaa-Mensah et al., 2024; Agyekum et al., 2024). Access to affordable and reliable electricity is essential for powering homes, schools, businesses, and industries (Agyekum et al., 2021; Sarkodie and Adams, 2020). Despite this imperative, about 760 million people globally, especially in Sub-Saharan Africa (SSA) and developing parts of Asia, lack access to electricity (Osei et al., 2025). The SSA region faces the world's lowest electricity access rates, with about 600 million people without access to electricity (Statista Research Department, 2023). The geographic distribution of this deficit is highly uneven, as rural areas are more energy-poor than urban populations. This inequality shows the enormous challenges of providing energy across remote regions with sparse populations and inadequate infrastructure. Thus, the choice of energy supply options to achieve universal electricity access is a critical global priority due to global warming and climate change.
Efficiently substituting fossil fuel sources, which contribute to global warming, with clean energy resources poses a considerable obstacle in achieving energy sustainability, ensuring a reliable power supply, and addressing pressing environmental concerns (Shboul et al., 2024). Currently, there is keen emphasis on transitioning towards clean and renewable energy sources to alleviate climate change impacts and decrease global greenhouse gas (GHG) emissions (Pimentel Pincelli et al., 2024; Sadiq et al., 2025; Virah-Sawmy and Sturmberg, 2025). For example, the Paris Agreement aims to limit global temperature increases to well below 2°C compared to pre-industrial levels, with efforts directed toward restricting the rise to 1.5°C (Niska et al., 2024; Redondo-Plaza et al., 2024). To reach this objective, nations have pledged to formulate and execute nationally determined contributions to lower emissions. However, progress toward global decarbonisation remains uneven, with countries like Burkina Faso still facing severe energy poverty and infrastructural challenges.
Burkina Faso, a landlocked nation in West Africa, exemplifies the energy poverty crisis, with nearly 81% of its population lacking electricity access (The World Bank, 2023a). The country's energy sector remains severely underdeveloped, relying heavily on traditional biomass such as wood and charcoal for heating and cooking among rural households (Koffi et al., 2018). Moreover, Burkina Faso depends on imported fossil fuels for electricity generation, with over 60% of its installed capacity fuelled by oil and diesel (Moner-Girona et al., 2016). Furthermore, Burkina Faso's electricity consumption per capita is only 79.18 kWh (Ember, 2023), far below the SSA average of 383 kWh (World Bank Group, 2025). This persistent energy deficit underlines the urgent need for sustainable and locally available energy solutions to reduce fossil fuel reliance and enhance energy access through harnessing the country's abundant solar potential.
Burkina Faso has an average annual solar irradiation of 5.5 kWh/m2/day and direct sunshine hours above 3000 annually, making it an ideal environment for leveraging cost-effective solar photovoltaic (PV) technology (Azoumah et al., 2010). Solar PV technology is a sustainable alternative to fossil fuel-based power sources for electricity generation (Gado et al., 2025). Solar PV systems generate electricity without producing GHG emissions, air pollution, or hazardous waste by harnessing abundant solar energy (Tawalbeh et al., 2021; Zayed et al., 2025). Solar PV technology is now economically feasible due to decreasing module costs and improved efficiency (Kavlak et al., 2018). Hence, coupling solar PV with hydrogen production is a pathway to sustainably harness Burkina Faso's vast solar potential.
Green hydrogen from water electrolysis powered by solar PV systems is a sustainable energy carrier for decarbonising the energy sector (Al-Ghussain et al., 2025c; Odoi-Yorke et al., 2025b). Hydrogen has an energy density of 141 MJ/kg, far exceeding fossil fuels, which average around 49 MJ/kg (Voulkopoulos et al., 2024). Hydrogen is being explored in areas where direct electrification is challenging, such as heavy industry and long-distance transportation (Al-Ghussain et al., 2025b). It serves multiple roles, such as powering transportation (Agyekum et al., 2024) and industrial processes (Tian, 2025), generating distributed energy (Shari et al., 2024), or combining with nitrogen to produce green ammonia (Agyekum et al., 2025). Green ammonia production could enhance agriculture and fertiliser production across the Sahel region. Burkina Faso has little to no domestic production capacity for ammonia-based fertilisers, leaving the nation dependent on expensive imports from other West African countries and international markets. Therefore, producing green ammonia locally for fertiliser could bolster food security.
Several researchers have globally assessed solar PV systems for electricity generation, hydrogen, and ammonia. Recent studies show significant developments, where microgrid-hydrogen refuelling integration achieved 15.8% cost reduction, 62.2% fossil fuel savings, and 65.3% emission cuts (Elkadeem et al., 2025). In addition, optimised onshore wind-hydrogen systems achieved hydrogen production at 5.26 USD/kg with significant carbon dioxide (CO2) reduction (Rehman et al., 2024). Other studies have explored solar PV-based hydrogen production in Ghana with a levelized cost of hydrogen (LCOH) of 9.49 USD/kg (Osei et al., 2024), Italy achieving 10.71 €/kg (Di Micco et al., 2022), and optimised PV-hydrogen hybrid systems in Spain at 0.28 €/kWh (Gutiérrez-Martín et al., 2020).
Similarly, other research has examined the technical feasibility of countries like Benin achieving 19% solar-to-hydrogen efficiency (Fopah-Lele et al., 2021), floating PV/hydrogen systems in Turkey with a levelized cost of energy (LCOE) of 0.6124 USD/kWh (Temiz and Javani, 2020), and concentrated solar power-based concepts with LCOE of 14–17 cents/kWh (Grube et al., 2020). Further investigations assessed PV cell technologies under arid conditions (Touili et al., 2022), hydrogen production feasibility in Iraq at 3.79 USD/kg (Abbas et al., 2023; Hassan et al., 2023), trigeneration systems on university campuses (Şevik, 2022), and hybrid systems in Brazil (Macedo and Peyerl, 2022). Studies in Morocco revealed hydrogen production costs ranging from 3.49–5.96 USD/kg (Berrada and Laasmi, 2021), while Niger's potential required only 5% of land area for PV-based hydrogen production (Bhandari, 2022).
More recent advances have optimised hydrogen production from olive cake achieving 1.23 USD/kg (Alrbai et al., 2025), green ammonia evaluation in Jordan showing costs of 900–2500 USD/kg USD/kg (Al-Ghussain et al., 2025a), green hydrogen assessment in the United States with costs ranging 1.5–15 USD/kg (Al-Ghussain et al., 2024), PV/wind integration with EV charging showing hydrogen costs of 6–13 USD/kg (Lee et al., 2024), and polygeneration in wastewater treatment plants maximising profitability at NPV of USD 87.48 million (Alrbai et al., 2024). Furthermore, ammonia synthesis studies have examined solar-based systems demonstrating feasibility (Siddiqui et al., 2020), integrated systems for ammonia synthesis and power generation (Ishaq and Dincer, 2021), green hydrogen and ammonia facilities in Iran with LCOH between 2.94–3.32 USD/kg (Kakavand et al., 2023), power-to-X plants showing 23% cost reductions (Campion et al., 2023), and comparative assessments revealing hydrogen-centric systems outperform ammonia-based ones in profitability (Wen et al., 2023).
The aforementioned studies highlight extensive work on producing electricity, hydrogen, and ammonia via solar PV technology across different countries and regions. Nevertheless, no specific research has focused on Burkina Faso. Burkina Faso's unique geographical, climatic, and socio-economic characteristics could impact the feasibility and economic aspects of solar PV-based systems for hydrogen and ammonia production. Various simulation and optimisation tools have been employed for solar PV systems assessment, including Hybrid Optimisation of Multiple Energy Resources software (Kavadias and Triantafyllou, 2021), MATLAB/Simulink (G. Mensah et al., 2024), System Advisor Model (SAM) (Agyekum et al., 2025), and optimisation algorithms such as genetic algorithms and particle swarm optimisation (Yahya et al., 2024). In this study, RETScreen was selected due to several context-specific advantages. For example, RETScreen integrates technical, financial, and environmental analysis within a standardised framework widely accepted by international development institutions and financial organisations. In addition, its climate database and simplified input requirements make it suitable for locations like Burkina Faso, where detailed meteorological and operational data may be limited. These characteristics make RETScreen an appropriate choice for conducting pre-feasibility assessments to inform policy decisions and attract investment in Burkina Faso's renewable energy sector.
To the authors’ best knowledge, this is the first study to explore the 3E (energy, economics, and environmental), hydrogen, and ammonia production potential from a centralised solar PV power plant in Burkina Faso. The contribution of this work is threefold: (1) It provides a detailed investigation of the 3E of a 100 MW centralised solar PV power plant in Burkina Faso; (2) It explores the potential for hydrogen production through water electrolysis using a fraction of electricity generated by the solar PV plant as a sustainable alternative to fossil fuel-based hydrogen production methods; and (3) It evaluates the feasibility of utilising the produced hydrogen for ammonia synthesis, a crucial feedstock for the fertiliser industry. The findings of this study provide key insights for key stakeholders involved in developing Burkina Faso's energy sector, supporting progress toward Sustainable Development Goals 7 and 13.
Materials and methods
Description of the study area and solar irradiation
The left side of Figure 1 displays Burkina Faso's location in Africa. Also, the right side of Figure 1 illustrates the study locations and their solar PV power potential. Burkina Faso is a landlocked country in West Africa, located between latitudes 9°N and 15°N and longitudes 6°W and 3°E (Nyamekye et al., 2018). Mali borders Burkina Faso to the north and west, Niger to the east, Benin to the southeast, Togo and Ghana to the south, and the Ivory Coast to the southwest. With an area of 274,200 km2, Burkina Faso has a flat terrain with some hills in the west and southeast (Worlddata, 2024). The country lies in the semi-arid Sahel region, with a hot tropical climate. It has three main rivers: the Black Volta, Red Volta, and Kou. Figure 1 shows a clear trend of higher solar PV power potential in the cities of northern Burkina Faso compared to the south.

Left: Burkina Faso location within Africa. Right: Study sites and their solar PV power potential in Burkina Faso. Adopted and modified from (Faso, 2024).
As seen in Figure 2, the average irradiation is about 5.8 kWh/m2/day across all locations and months. In most months, cities like Djibo and Kaya in the north consistently have higher irradiation levels, exceeding 6 kWh/m2/day. In contrast, southern locations like Banfora rarely reach that level. All locations show a decrease in solar irradiation from June to August. This could be due to increased cloud cover during the wet season in these regions. Across most locations, April appears to be the month with the highest average irradiation, sometimes exceeding 6 kWh/m2/day.

Solar irradiation across various cities in Burkina Faso.
Suggested system setup
This study proposes a 100 MW centralised solar PV power plant for electricity generation. The configuration of the integrated system is shown in Figure 3. The process begins with solar PV modules capturing sunlight and converting it into electrical energy, which is then fed into an inverter. The inverter directs power in two paths: one to the utility grid for distribution to residential, commercial, and industrial users, and the main flow to an electrolyser. The electrolyser uses the allocated electricity to split water into hydrogen and oxygen through electrolysis, storing the produced hydrogen in a tank. Hydrogen production potential is estimated for scenarios where 25%, 50%, 75%, and 100% of the generated electricity is used. A portion of the stored hydrogen is combined with nitrogen (obtained from an air separation unit or other sources) in an ammonia synthesis plant to produce ammonia (NH3). This synthesis occurs under controlled temperature and pressure with the aid of catalysts. The produced ammonia can be used for fertilisers, chemicals, or as a hydrogen carrier for energy storage and transportation.

Proposed system configuration for electricity, hydrogen, and ammonia production. Adapted and modified from (Odoi-Yorke et al., 2025a).
Description of RETScreen software
RETScreen software is employed to conduct the PV system's technical, economic, and emission analyses. RETScreen is a software developed and maintained by Natural Resources Canada (NRCan). The software is designed to assist in analysing and evaluating various types of renewable energy systems, such as solar PV and thermal systems, wind energy, biomass heating, and more (Magtibay and Wong, 2013; Owolabi et al., 2019; Pan et al., 2017; Sinha and Chandel, 2014). RETSCREEN Software is commonly used by professionals, researchers, and organisations developing and evaluating renewable energy projects. It provides a comprehensive tool for analysing various renewable energy technologies’ technical, financial, and environmental aspects, facilitating informed decision-making and project planning (Khan et al., 2023). Figure 4 displays the flowchart of the solar PV model adopted in RETScreen software. This study configured the RETScreen Expert model with input datasets including solar irradiation, ambient temperature, derating factor, and PV module efficiency. The model computes energy yield using NASA climate data and applies performance adjustment factors for system losses. Financial and emission analyses were carried out using RETScreen's integrated financial module, linking energy output with cost parameters to estimate net present value (NPV), LCOE and greenhouse gas emission reductions.

Flowchart of solar PV model adopted in RETScreen software. Adapted and modified from (Akpahou et al., 2023).
Solar PV system sizing
Eq. (1) is applied to compute electricity generation (Akpahou et al., 2023; Odoi-Yorke et al., 2024; Osei et al., 2024):

Where

The solar PV performance is determined by important technical parameters, including final energy output, performance ratio (PR), and capacity factor (CF). The PR measures efficiency, indicating how effectively energy is produced. The PR is determined as follows (Akpahou et al., 2023; Oloya et al., 2021):

The capacity factor measures its actual output as a percentage of its maximum potential output over a specific period, typically a year (Obeng et al., 2020). The capacity factor is given by (Akpahou et al., 2023; Oloya et al., 2021):

Hydrogen production
The solar PV system produces electrical energy that is subsequently used in the water electrolysis process for hydrogen production, as illustrated in Figure 3. The proton exchange membrane (PEM) technology is selected for the electrolysis process. PEM was chosen because of its longevity, high efficiency, and ability to work effectively with the fluctuating electricity supply from renewable energy sources such as solar power (Touili et al., 2022). It is estimated that the PEM electrolyser requires 54 kWh of electricity to generate 1 kg of hydrogen gas, which has a higher heating value of 39.4 kWh/kg, and it operates at an efficiency of approximately 75% (Asare-Addo, 2023; Touili et al., 2022). The average daily production capacity is estimated to be around 1 metric tonne of hydrogen (Asare-Addo, 2023; Touili et al., 2022). These figures are derived from widely recognised values for hydrogen production found in the literature (Ali et al., 2022; Asare-Addo, 2023; Rahmouni et al., 2017; Touili et al., 2022). Eq. (5) is used to determine the total hydrogen production in kg (Farhani et al., 2024; Nasser et al., 2022; Rahmouni et al., 2017; Touili et al., 2022):

Where
Ammonia production
Globally, hydrogen production utilised for ammonia fertilisers or petrochemicals primarily relies on steam methane reforming, which emits carbon dioxide. (Kamil et al., 2024). Conversely, producing green ammonia utilises a fully renewable and carbon-neutral process. The Haber-Bosch process is a commonly employed technique for synthesising ammonia from hydrogen (H2) and nitrogen (N2) (Aziz et al., 2020; Moghadam et al., 2024). In this process, N2 and H2 are reacted under high pressure and temperature to produce ammonia, as shown in Eq. (6) (Chai et al., 2021). The Haber-Bosch reaction requires a stoichiometric ratio of 3 moles of hydrogen for every 1 mole of nitrogen. Consequently, an adequate nitrogen supply is necessary to match the available hydrogen production. This study assumes that the required nitrogen supply is available to complement the hydrogen production capacity.

Economic indicators
The economic indicators utilised to evaluate the proposed system's economic viability are presented in this section. It highlights the governing equations for NPV, LCOE, simple payback time (SPT), and LCOH.
Net present value
The NPV assesses the profitability of an investment or project by determining the present value of future cash flows, which are discounted at an appropriate rate. The NPV is determined as follows (Agyekum et al., 2025):

Where,
Levelized cost of energy
The LCOE is a metric to compare the lifetime costs of energy generation from various sources. It represents the average revenue per unit of electricity that must be generated from a power plant to break even over its operational life. Eq. (8) is employed to estimate the LCOE (Abdelhady, 2021; Mostafa et al., 2020):

Simple payback time
The SPT is employed to assess the duration required to recoup the initial investment cost of a project or asset through the generated cash inflows. It is estimated by dividing the initial investment by the annual cash flow, as shown in Eq. (9). The outcome indicates the years required for the total cash inflows to match the initial investment expenditure.

Where SPT is the SPT,
Levelized cost of hydrogen production
The LCOH is utilised to assess the overall cost of producing hydrogen fuel throughout the lifespan of a production facility or method (Osei et al., 2024). It considers all the costs involved, including capital expenditures, operating expenses, financing costs, and feedstock costs. It spreads them out over the total hydrogen production to provide a single, comprehensive cost per unit. Calculating LCOH is vital for comparing the economic viability of different hydrogen production pathways, such as electrolysis, steam methane reforming of natural gas, gasification of coal or biomass, or other emerging technologies. It enables stakeholders, policymakers, and investors to evaluate the most cost-effective and sustainable options for scaling up hydrogen production and infrastructure. The LCOH is estimated as follows (Gouareh et al., 2015; Rahmouni et al., 2016; Sigurvinsson et al., 2007):


The size and, consequently, the capital cost of the electrolyser is contingent on hydrogen production. Hence, the electrolyser's capital cost


The study assumes a typical project lifespan of 25 years to evaluate the project's economic viability. The project economic indicators were assessed using a discount rate of 6.4% for Burkina Faso obtained from the World Bank (The World Bank, 2024). The PV capital cost (comprised of PV modules, inverter, and balance of plant) and operation and maintenance cost are taken to be 1500 USD/kW and 10 USD/kW/yr (Abid et al., 2021; IRENA, 2022), respectively.
Carbon dioxide emissions savings
This section highlights the potential carbon dioxide (CO2) savings from PV power plants. It is noteworthy to mention that estimating the CO2 emissions savings from a PV power plant relies on the total electricity produced by the plant and the emissions factor of the energy source the PV plant displaces. Eq. (14) is applied to compute the potential CO2 emissions savings:

Where
Model limitations
The study methodology has some limitations that should be acknowledged. First, RETScreen employs quasi-static annual or monthly average datasets, which may overlook short-term variability in solar irradiance, temperature fluctuations, and equipment performance degradation. As a result, transient effects, seasonal dynamics, and load profile mismatches are not fully captured, potentially affecting the precision of the calculated LCOE and LCOH values. Secondly, though RETScreen integrates financial and emission analyses, it lacks dynamic optimisation capabilities in tools such as HOMER Pro, TRNSYS, or MATLAB/Simulink. Therefore, the model does not account for hourly dispatch, energy storage sizing, or curtailment optimisation, which can influence hydrogen and ammonia yields under variable weather and grid conditions. Third, economic indicators such as capital and operation and maintenance costs were retrieved from similar studies in the literature rather than locally verified cost data, introducing uncertainty in economic outputs. In addition, the model assumed constant electrolyser and PV efficiencies throughout the project lifespan, neglecting degradation effects, replacement schedules, and system downtime. Finally, the cost of water for electrolysis is neglected. Despite these limitations, the modelling approach remains suitable for preliminary feasibility assessment in data-scarce contexts such as Burkina Faso, which provides a foundation for subsequent optimisation and lifecycle-based investigations.
Results and discussion
PV system electricity generation, performance ratio, and capacity factor
Figure 5 displays the daily solar irradiation and electricity generation for each month of the year across each installation site considered in Burkina Faso. It is worth mentioning that the cities considered for this study are located within the Northern, Eastern, Western, Southern, and Central Parts of Burkina Faso. It is seen that solar irradiation and electricity generation follow similar monthly trends. The results show a clear seasonal pattern in daily solar irradiation and electricity generation. The highest electricity generation is observed during March, April, and May, which correspond to the dry season in Burkina Faso. The lowest values are typically seen in July, August, and September, which coincide with the rainy season. Djibo, located in the Northern part of Burkina Faso, recorded the highest electricity generation, about 135.24 GWh per year. Banfora, on the other hand, which is located in the southern part of Burkina Faso, recorded the lowest electricity generation of 126.823 GWh per year. This implies that the highest and lowest annual generation electricity difference is about 6%.
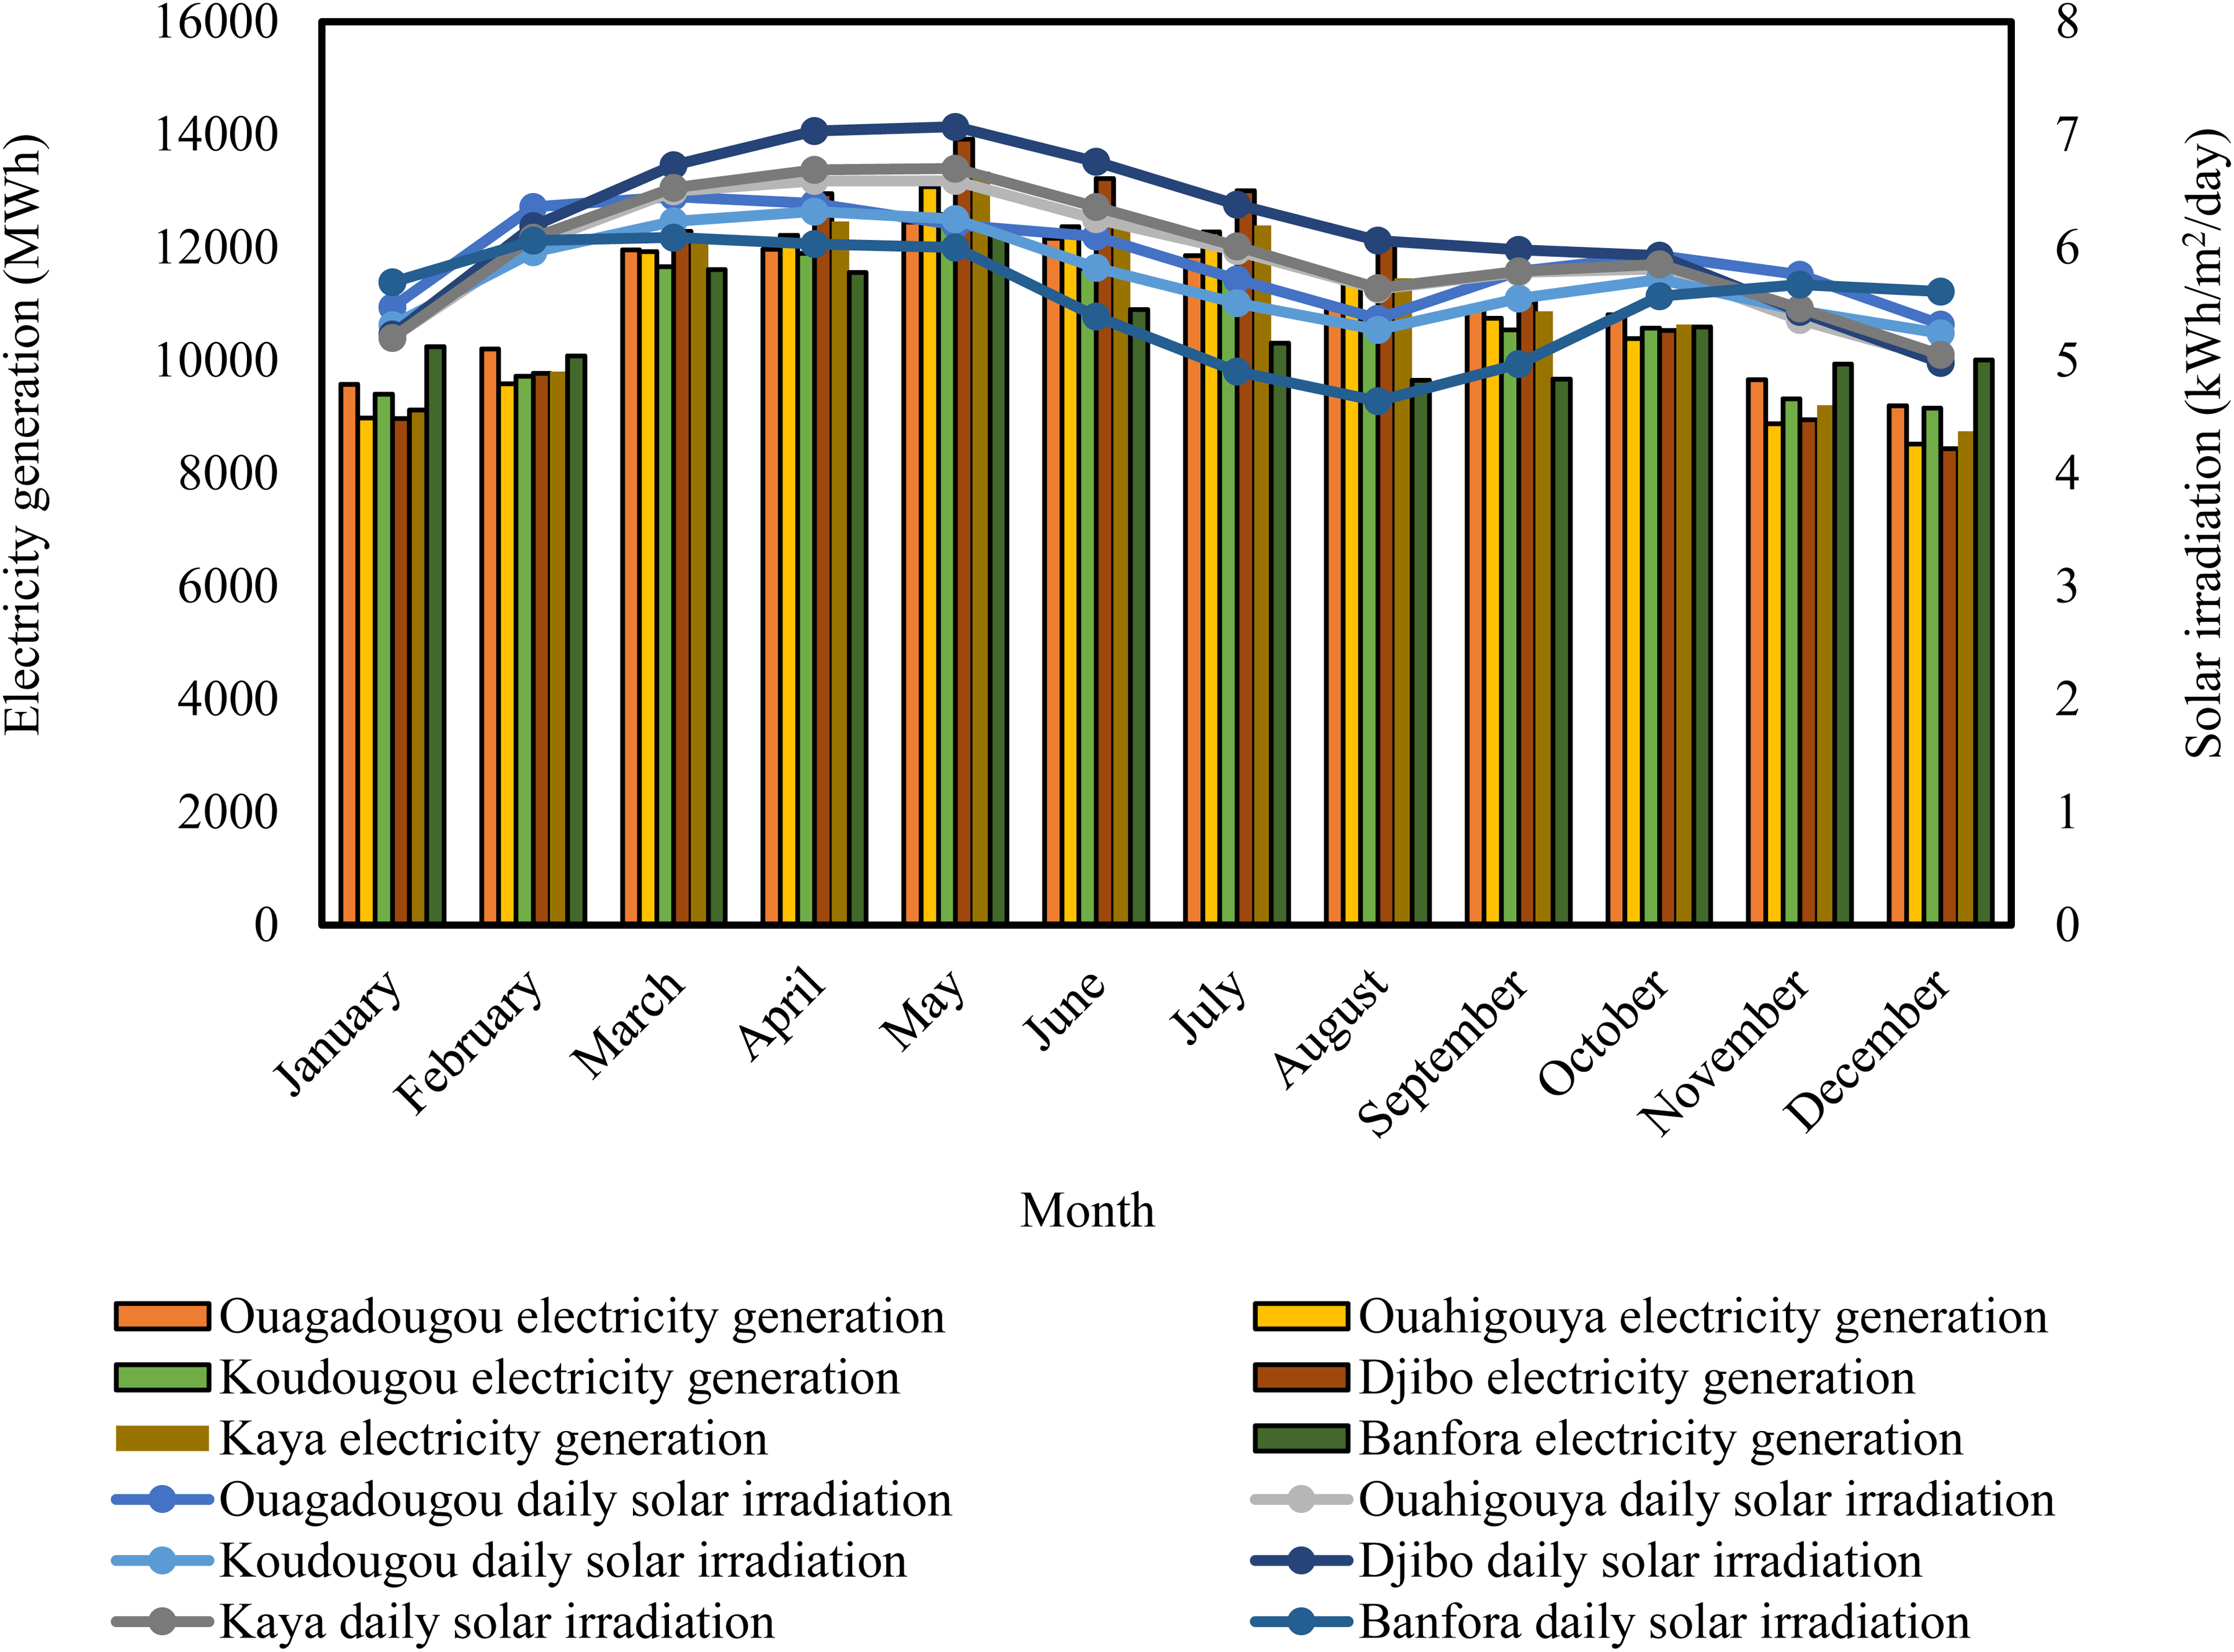
Monthly average electricity generation and solar irradiation for each location.
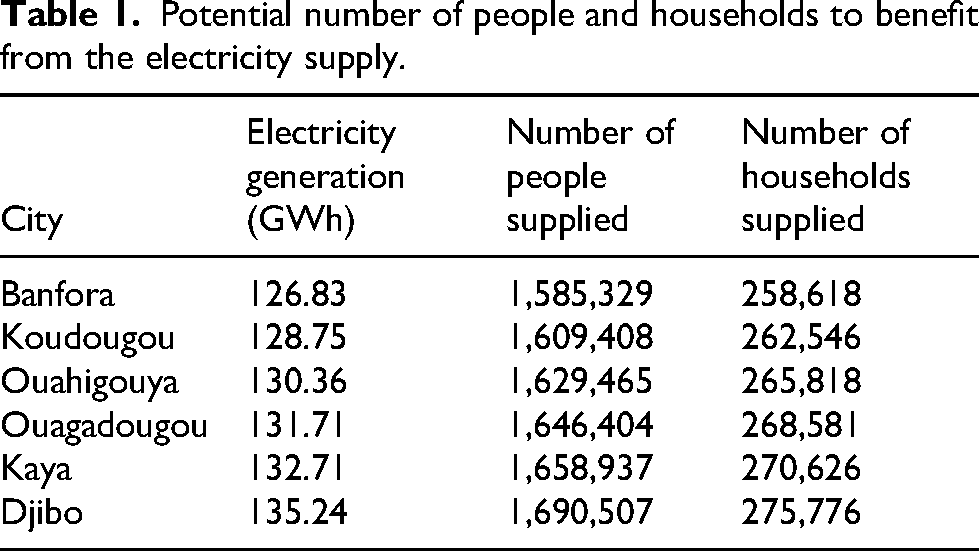
Figure 6 shows the trend in electricity consumption per capita in Burkina Faso from 2000 to 2021. It can be seen that there has been an overall increasing trend in electricity consumption per capita over the years, although there have been some fluctuations. The electricity consumption per capita has nearly tripled from 26.93 kWh in 2000 to 79.18 kWh in 2021 (Ember, 2023). Based on the current electricity consumption per capita of about 80 kWh, constructing a 100 MW solar power plant in Burkina Faso could generate electricity to serve approximately 1.6–1.7 million people annually across the various cities, as presented in Table 1. These figures are calculated based on electricity generation and per capita consumption. Obviously, cities with higher electricity generation can potentially supply more people. In addition, the number of households that can be supplied ranges from 258,618 to 275,776 (Table 1). These figures are derived from the number of people supplied divided by the average household size of 6.13 for Burkina Faso, obtained from (GlobalDataLab, 2024). In a nation where only around 19% of the population had access to electricity as of 2021 (The World Bank, 2023a), this substantial initiative could significantly enhance electrification rates and living standards. Providing power to about 258,618 to 275,776 households would enable more Burkinabés to access electricity for lighting, refrigeration, operating small businesses, and other activities that foster economic development. Moreover, women and children in rural areas without electricity could benefit in terms of health, education, and empowerment. Therefore, constructing this 100 MW solar facility could greatly aid Burkinabé's progress in enhancing energy access and reducing poverty.

Trend in electricity consumption per capita in Burkina Faso from 2000 to 2021 (Ember, 2023).
Potential number of people and households to benefit from the electricity supply.
The PR and CF for the proposed PV systems for the various cities are displayed in Figure 7. A higher PR indicates greater efficiency. Kaya had the highest PR, about 65.44%, while Djibo had the lowest, about 64.40%. It is worth mentioning that Djibo recorded the highest electricity generation, but with a lower PR. The lower PR might be due to high temperatures in the northern part, which is likely to affect PV cell performance. The high temperatures can decrease the efficiency of PV cells, leading to a decrease in the amount of electricity generated. This could result in lower energy production than expected, impacting the overall energy supply. However, the PR obtained is consistent with the PR obtained in similar studies by Quansah et al. (2017) in Ghana, Akpahou et al. (2023) in Benin, Palm et al. (2023) in Burkina Faso, Abdoulaye et al. (2023) in Niger and Abdoulaye et al. (2023) in Mali.

Solar PV systems capacity factor and performance ratio at various locations.
The CF measures the actual electrical energy output over time compared to the maximum possible output (Kaboré et al., 2024). A higher CF indicates that the solar PV systems operate closer to their full potential. Djibo had the highest capacity factor at 15.44%, while Koudougou had the lowest at 14.70%. The range of capacity factors across cities is fairly narrow, within 0.7%. The capacity factors were also comparable, though Djibo's higher value suggests its systems operate closer to optimal output. In view of this, the CF obtained in this study agrees with the CF obtained in similar studies by Kaboré et al. (2024) in Burkina Faso, Mensah et al. (2019) in Ghana, and Akpahou et al. (2023) in Benin.
Hydrogen and ammonia production potential
Figure 8 displays the estimated monthly hydrogen production from utilising different percentages (25%, 50%, 75%, and 100%) of the electricity generated from the PV power plant in various cities in Burkina Faso. It can be observed that hydrogen production increases linearly with the percentage of electricity utilised from the PV power plant. The highest hydrogen production occurs in March, April, and May for all cities and across all percentages of electricity utilisation. This is likely due to the increased availability of solar irradiation during these months, resulting in higher electricity generation from the PV power plant. The lowest hydrogen production occurs in November, December, and January, corresponding to the lower solar irradiation levels during these months. Among the cities, Djibo generally recorded the highest hydrogen production values, followed by Kaya, Ouagadougou, Koudougou, Ouahigouya, and Banfora.

Monthly hydrogen production corresponding to different shares of electricity generation.
The annual hydrogen production across the various cities is presented in Figure 9. The annual hydrogen production varies from 604 tonnes to 644 tonnes using 25% electricity generation. Using 50%, 75%, and 100% electricity generation, hydrogen production ranges from 1207 to 1287 tonnes, 1811 to 1931 tonnes and 2414 to 2575 tonnes, respectively. The potential for hydrogen production from solar PV is significant in Burkina Faso, given the country's favourable climatic conditions. The results demonstrate that hydrogen production can be scaled up or down by adjusting the percentage of electricity utilised from the PV power plant, allowing for flexibility in meeting the demand for hydrogen.

Annual hydrogen production across various cities.
The seasonal variation in hydrogen production highlights the importance of developing energy storage solutions or complementary energy sources to ensure a consistent hydrogen supply throughout the year. The higher hydrogen production potential in certain cities, such as Djibo and Kaya, could influence the strategic placement of hydrogen production facilities or the distribution infrastructure for optimal resource utilisation. The integration of hydrogen production from solar PV can contribute to the decarbonisation of various sectors, including transportation, industry, and energy storage, supporting the transition toward a more sustainable energy system.
Agriculture is vital to Burkina Faso's economy, employing around 80% of the labour force (IFAD, 2019). Agriculture, forestry, and fishing contributed about 18.5% of Burkina Faso's gross domestic product in 2021 (The World Bank, 2022). Most agricultural production comes from smallholder subsistence farmers using traditional low-input techniques on small family plots. Factors like drought, soil degradation, lack of access to inputs like fertilisers and improved seeds, pests, and lack of irrigated land could hinder agricultural productivity. The government has prioritised agriculture sector development through initiatives to boost productivity, irrigation, mechanisation, access to fertilisers and other inputs, and introduce drought-resistant crop varieties. In 2021, Burkina Faso's fertiliser consumption was 11.9 kg per hectare (The World Bank, 2023c), with an arable land area of 6.1 million hectares (The World Bank, 2023b). This indicates that approximately 72,590 tonnes of NH3 fertiliser would be required annually, assuming all the arable land is cultivated. To meet the annual demand of 72,590 tonnes of NH3 fertiliser, about 59,710 tonnes of nitrogen and 12,900 tonnes of hydrogen would be needed using Eq. (6). This finding suggests that only about 1% of the electricity produced from the PV system would be required to generate the necessary hydrogen for ammonia fertiliser production for the 6.1 million hectares of farmland in the enclave of the power system. Nitrogen is abundant in the air and can be used for ammonia production, making the process more sustainable and environmentally friendly. It is important to mention that the provided values are theoretical, and actual conditions may vary under real conditions.
Economic analysis
Figure 10 displays the LCOE obtained from the PV system at each location. It can be seen that LCOE ranges from 0.089 USD/kWh in Djibo to 0.095 USD/kWh in Bonfora. As seen, the LCOE is comparable to the current residential and business electricity tariffs in Burkina Faso. The current residential and business electricity tariffs in Burkina Faso are 0.205 USD/kWh and 0.198 USD/kWh, respectively (GlobalPetrolPrices, 2023). The results show that the LCOE obtained for all cities is lower than both the residential and business electricity tariffs in Burkina Faso. For instance, the average LCOE obtained for the cities is about 73% and 76% lower than the grid tariff for business and residential sectors. It is worth highlighting that Burkina Faso, at present, faces some of the highest electricity tariffs in the region (Kaboré et al., 2024). The lower LCOE values compared to the residential and business tariffs suggest that installing PV systems for electricity generation is cost-effective in all the cities assessed. This could lead to significant cost savings for households and businesses over the long run. Also, the cost-effectiveness of PV systems in these cities could encourage the adoption of solar energy and other renewable energy sources, contributing to a more sustainable and environmentally friendly energy mix in Burkina Faso. Furthermore, the lower LCOE values could make electricity more affordable for households and businesses, especially in areas with limited or unreliable grid connectivity. This could improve energy access and contribute to economic development.

Solar PV systems LCOE for different locations.
The LCOE determined in this study aligns with findings from similar studies conducted, as shown in Table 2. It can be seen that the LCOE obtained in this study for a 100 MW PV system in Burkina Faso is generally lower than the LCOE values reported in most of the previous studies listed. The LCOE obtained in this study is comparable to the lowest value reported by Palm et al. (2023) for a 33 MW PV system in Burkina Faso. The results indicate that utility-scale PV systems with larger capacities can potentially achieve lower LCOE, making them more economically competitive compared to smaller-scale PV installations. The lower LCOE values obtained in the present study and the study by Palm et al. (2023) suggest that Burkina Faso may have favourable conditions for deploying cost-effective, utility-scale PV systems. Compared with previous studies, the findings are vital for policymakers, energy planners, and investors in Burkina Faso and other African countries. The findings can inform decision-making processes regarding utility-scale PV projects’ feasibility and economic viability, potentially encouraging further investments in renewable energy sources. Furthermore, the lower LCOE values can also contribute to assessing the potential for PV systems to support energy access, sustainable development, and the transition towards a more diverse and clean energy mix in African countries.
Comparison of LCOE obtained with other studies.

Figure 11 shows the effect of feed-in tariff (FiT) on NPV and SPT for solar PV projects in the different cities in Burkina Faso. The NPV and SPT are calculated at four different FiT rates: 0.00 USD/kWh, 0.05 USD/kWh, 0.10 USD/kWh, and 0.15 USD/kWh. At a FiT of 0.00 USD/kWh, meaning no incentive for selling excess electricity back to the grid, all locations have a negative NPV of USD −170 million and an SPT of 0, indicating that the projects are not financially viable without any compensation for electricity generation. Introducing a FiT of 0.05 USD/kWh improves the NPV but remains negative for all locations, ranging from USD −80 million to USD −74 million. The SPT ranges from 26.0 to 28.5 years. Although the projects become more attractive with a FiT of 0.05, the long payback periods suggest they may still not be economically feasible for most investors.

Effect of FiT on NPV (a) and SPT (b) for PV systems across various locations.
Similarly, at a FiT of 0.10 USD/kWh, the NPV turns positive for all locations, ranging from USD 9 million to USD 21 million, and the SPT varies from 11.9 years to 12.8 years. With a FiT of 0.10 USD/kWh, the solar PV projects become financially viable, with positive NPVs and payback periods that may be acceptable for some investors. Furthermore, increasing the FiT to 0.15 USD/kWh further improved the NPV from 98 million to 116 million. On the other hand, the SPT decreases to a range of 7.8 years to 8.3 years. Solar PV projects at this FiT rate become highly attractive investments, with substantial positive NPVs and relatively short payback periods.
The results demonstrate the significant impact of FiT on the financial viability of solar PV projects. Therefore, the solar PV projects can be financially viable in Burkina Faso cities with FiT between 0.10–0.15 USD/kWh. This FiT range is competitive with the current tariff for residential and business sectors in the country, as observed in Figure 9. Without any FiT, the projects are not economically feasible. As the FiT increases, the NPV improves, and the payback period decreases, making the projects more attractive to investors. The implications are that FiT can be an effective policy tool to incentivise the adoption of solar PV and other renewable energy technologies by improving their financial returns and making them more competitive with conventional energy sources.
Figure 12 presents the LCOH obtained from the 100 MW PV system at different percentages of electricity supply for hydrogen production in various locations in Burkina Faso.

LCOH at different percentages of electricity supply for hydrogen production.
The results show that the LCOH decreases as the percentage of electricity supply for hydrogen production increases (Figure 12). This trend is observed across all locations. As seen, at 25% electricity supply, the LCOH values range from around 19.50 USD/kg to 20.76 USD/kg. These values are relatively high, indicating that producing hydrogen solely from a 25% electricity supply from the solar PV system would be economically less feasible. As the percentage of electricity supply increases to 50%, the LCOH values drop significantly, ranging from 9.97 USD/kg to 10.60 USD/kg. This reduction in LCOH suggests that increasing the utilisation of the solar PV system can improve the economic viability of hydrogen production. At 75% electricity supply, the LCOH values decrease from 6.76 USD/kg to 7.22 USD/kg. These values are relatively low, indicating that hydrogen production could become economically attractive at this level of solar PV utilisation. When the solar PV system operates at 100% electricity supply, the LCOH values reach their lowest point, ranging from 5.21 USD/kg to 5.52 USD/kg. These values suggest that maximising the use of the solar PV system for hydrogen production could make it a cost-effective and competitive option. This pattern highlights the economies of scale associated with hydrogen production. The fixed costs of the production system can be spread over a larger output, leading to a lower LCOH by utilising a larger portion of the available electricity for hydrogen production.
Table 3 compares the LCOH obtained using 100% electricity generation to similar studies in the literature. As seen in this study, LCOH values obtained are lower than the values reported by Ahshan (2021) for Oman and Garud et al. (2023) for Saudi Arabia, both of which considered smaller solar PV capacities. Likewise, the present study's LCOH range is slightly higher than the range (Berrada and Laasmi, 2021) reported for Morocco for a 50 MW capacity and (Tiar et al., 2024) for Algeria for a 100 MW capacity. Furthermore, the LCOH range obtained in the present study falls within the range reported by (Hosseini Dehshiri and Firoozabadi, 2024) for Iran for a 1 MW capacity. It is lower than the value reported by (Osei et al., 2024) for Ghana for a 5 MW capacity. It is crucial to highlight that variations in LCOH may stem from various factors, including solar resource availability, technological advancements, economies of scale, and local economic conditions.
Comparison of LCOH obtained using 100% electricity supply to similar studies in the literature.

Water scarcity could hinder the feasibility of large-scale electrolysis deployment in semi-arid regions such as Burkina Faso. Although the study assumes adequate water availability, each kilogram of hydrogen produced via PEM electrolysis requires about 9 litres of deionised water. Thus, at full utilisation (2.5 kt H2/year), the system would demand roughly 232,500 m3 of high-purity water annually, which could strain local resources during dry seasons. Accordingly, integrating wastewater recycling technologies could mitigate this constraint but would increase the total LCOH. Comparative analyses show that the LCOE of 0.089–0.095 USD/kWh (Table 2) and LCOH of 5.21–5.52 USD/kg are competitive with regional studies, such as Ghana, but remain higher than optimised systems in Algeria (1.96–4.85 USD/kg) as presented in Table 3. This variation highlights the sensitivity of hydrogen economics to scale, location, and water management costs. For engineering practice, this emphasises the importance of co-optimising PV plant sizing, electrolyser capacity, and water sourcing to achieve viable LCOH targets. From a user or customer perspective, cost reductions directly influence the affordability of downstream applications such as local ammonia fertiliser production and hydrogen refuelling, enhancing socio-economic benefits and strengthening energy independence. Future work should therefore perform sensitivity analyses on water treatment energy use and its impact on overall LCOH.
Emission analysis
Figure 13 presents the potential CO2 emissions savings from the percentage of electricity generation used for hydrogen production. It can be observed that CO2 emission savings increase linearly with the percentage of electricity generation dedicated to hydrogen production. For example, in Banfora, the emissions savings doubled from 22 ktCO2 for 25% of electricity generation to 44 ktCO2 for 50%. The emission savings vary slightly across different cities or locations. Djibo has the highest potential savings, ranging from 24 ktCO2 for 25% electricity generation to 95 ktCO2 for 100% electricity generation. This variation is due to higher electricity generation at the site. The potential consequences of allocating a larger share of electricity generation to hydrogen production should be carefully assessed. For instance, it may impact the availability and affordability of electricity for other sectors, such as residential, commercial, and industrial uses. Therefore, considering energy security, economic impacts, and alternative decarbonisation strategies, a balanced approach might be necessary.
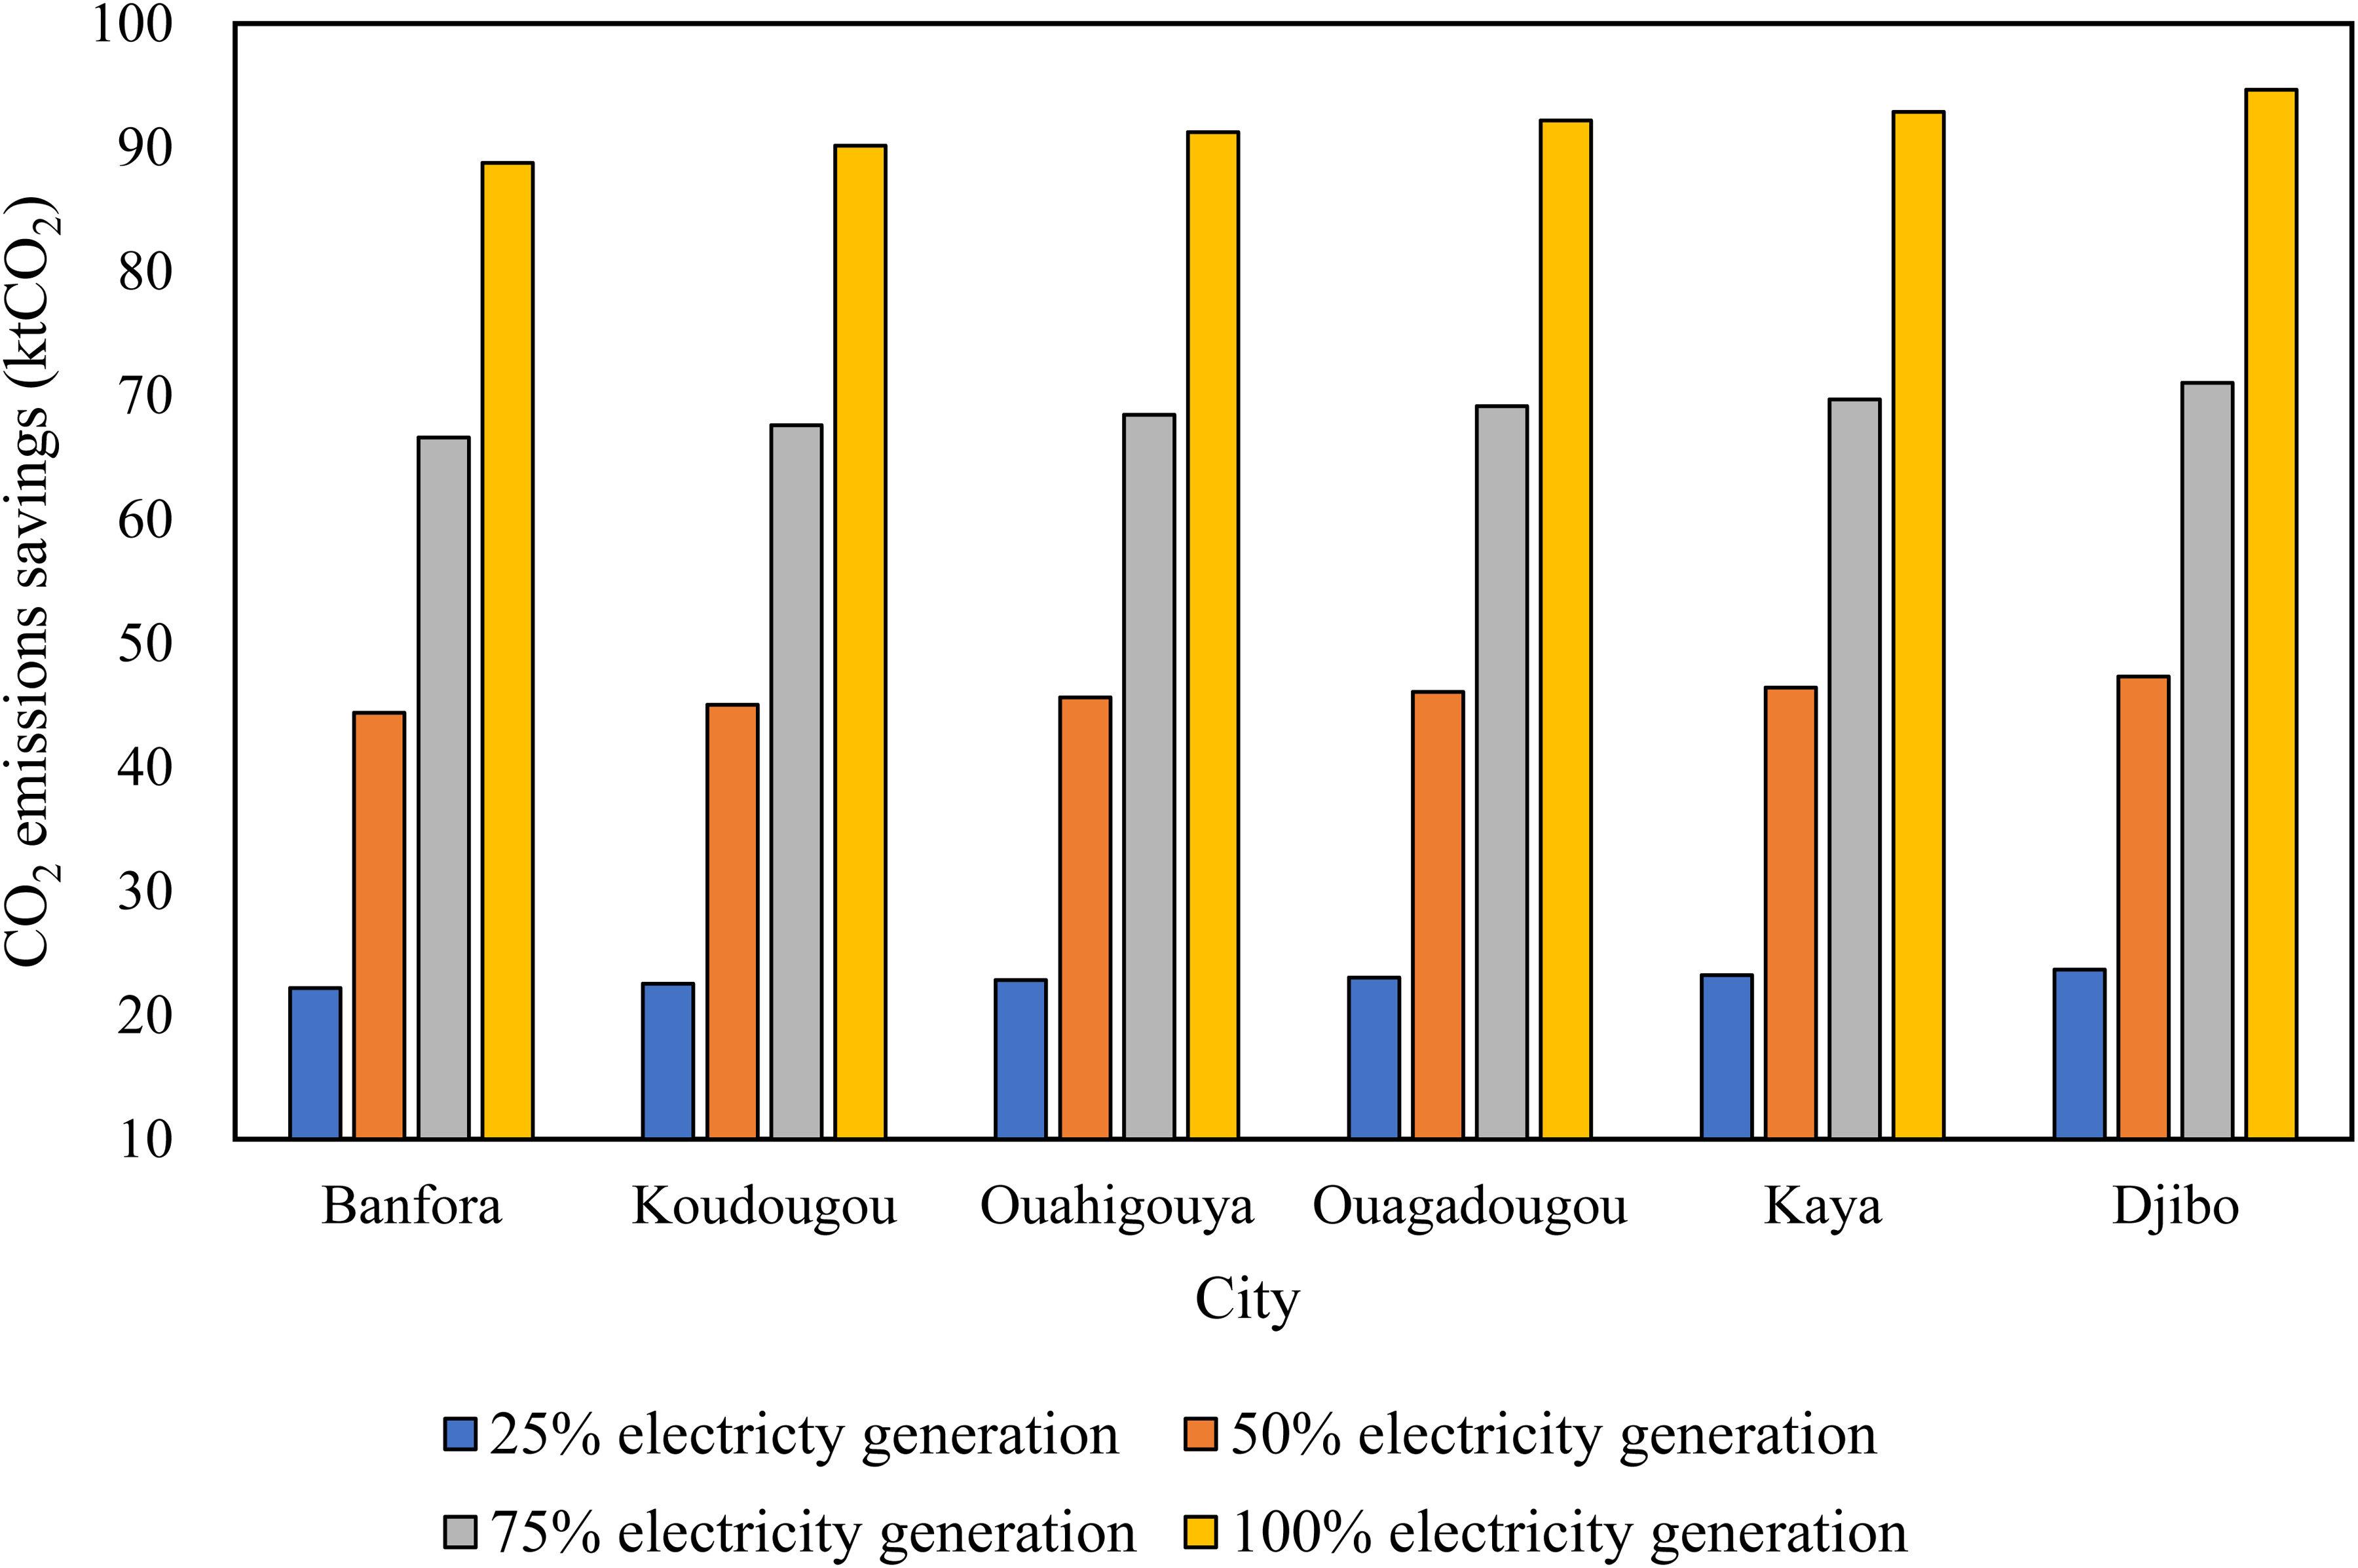
CO2 emissions savings.
A conventional ammonia plant emits about 1.694 tonnes of CO2 per tonne of ammonia produced (Demirhan et al., 2019; Kakavand et al., 2023). Burkina Faso has an annual NH3 fertiliser demand of 72,590 tonnes to support its 6.1 million hectares of arable land, as highlighted above. If the production of ammonia for fertilisers in Burkina Faso were to transition from conventional methods to a hydrogen-based process, using the hydrogen produced from the electricity generation scenarios shown in Figure 13, it could result in significant CO2 emission savings. Specifically, the annual CO2 emission savings would be approximately 122,967.5 tonnes (72,590 tonnes of NH3 × 1.694 tonnes of CO2 per tonne of NH3). This emission reduction potential highlights the importance of exploring green hydrogen-based processes, such as ammonia synthesis, in agriculture and fertiliser production, where conventional methods contribute to greenhouse gas emissions. However, implementing such a transition would require careful planning, infrastructure development, and a thorough assessment of the hydrogen-based ammonia production process's economic feasibility, energy requirements, and sustainability.
Proposed potential implementation roadmaps and policy recommendations
This section highlights potential implementation roadmaps and policy recommendations to accelerate the deployment of a centralised solar PV power plant for electricity, hydrogen, and ammonia production in Burkina Faso. The proposed implementation roadmap is as follows:
Perform an in-depth analysis of potential sites, resource availability, grid integration, water resources, and infrastructure requirements to identify the optimal location and design for the project. Establish a clear and supportive regulatory framework that addresses issues such as land acquisition, permitting, grid interconnection, and the legal and fiscal regime for renewable energy projects. Engage with international development banks, bilateral agencies, and private investors to secure the necessary financing for the project's substantial capital investment. This can be done by exploring innovative financing mechanisms such as green bonds and public-private partnerships. Implement training programmes and incentives to develop local expertise in designing, constructing, operating, and maintaining solar PV, hydrogen, and ammonia facilities. Encourage the growth of local manufacturing and service industries to support the project and future initiatives. Establish long-term power purchase agreements for electricity sales and develop domestic and export markets for the hydrogen and ammonia produced. Continuously monitor the integrated system's performance and implement measures to optimise operations, reduce costs, and increase efficiency.
The proposed policy recommendations are as follows:
Establish ambitious yet achievable renewable energy targets and provide fiscal incentives, such as tax credits, feed-in tariffs, or accelerated depreciation, to promote the development of solar PV and related technologies. Simplify and expedite renewable energy projects’ permitting and land acquisition processes to reduce delays and uncertainties. Formulate a comprehensive strategy to support the production, utilisation, and export of green hydrogen and ammonia, including infrastructure development, market creation, and international partnerships. Invest in research and development activities to foster technological advancements, cost reductions, and local innovation in solar PV, hydrogen, and ammonia production. Strengthen the capacity of relevant government agencies and institutions to effectively plan, implement, and regulate large-scale renewable energy projects. Facilitate public-private partnerships to leverage private sector expertise, resources, and financing while sharing risks and rewards with the public sector. Implement awareness campaigns and engage with local communities, industry, and other stakeholders to build support, address concerns, and ensure the project's long-term sustainability.
Conclusion
This study analysed the potential for a 100 MW PV power plant in different cities across Burkina Faso to generate electricity and produce hydrogen via electrolysis. RETScreen software was used to conduct the PV system's technical, economic, and emissions analyses. In addition, mathematical equations were adopted to estimate the hydrogen and ammonia production potential. The solar PV systems simulation results yielded performance ratios ranging from 64.40% to 65.44% and capacity factors between 14.70% and 15.44%. These values are consistent with similar regional studies, indicating the suitability of Burkina Faso's climatic conditions for solar PV installations. The recorded annual electricity generation potential of 126.83–135.24 GWh could improve energy access by supplying 1.6–1.7 million people or 258,618–275,776 households. Moreover, the analysis revealed a considerable hydrogen production potential of 0.60–2.57 kt annually, with just 1% of the generated electricity capable of meeting Burkina Faso's ammonia fertiliser demand for 6.1 million hectares of arable land. The LCOE of 0.089–0.095 USD/kWh is 73–76% lower than current residential and business tariffs, while the LCOH decreases from 19.50–20.76 USD/kg at 25% electricity utilisation to 5.21–5.52 USD/kg at 100% electricity utilisation. Emissions savings increased linearly with the percentage of electricity dedicated to hydrogen production, reaching 94.67 ktCO2 at 100% utilisation in Djibo. It is worth mentioning that incorporating hydrogen and ammonia production facilities strengthens the value proposition of the solar PV plant and aids in diversifying Burkina Faso's energy mix. The availability of green hydrogen and ammonia can support various sectors, including transportation, agriculture, and industrial processes, fostering sustainable economic growth and minimising dependence on imported fossil fuels. Furthermore, the establishment of such a large-scale renewable energy project would create employment opportunities, stimulate local industries, and attract foreign investment, thereby contributing to the socio-economic development of Burkina Faso. Policymakers and stakeholders could consider implementing favourable policies, incentives, and financing mechanisms to facilitate the deployment of this and similar projects, unlocking the vast renewable energy potential of Burkina Faso and supporting the country's transition towards a sustainable, low-carbon future. Burkina Faso can unlock the potential of its renewable energy resources, achieve energy security, and contribute to sustainable economic development while mitigating climate change impacts by implementing the proposed comprehensive roadmap and supportive policies.
Footnotes
Acknowledgements
The authors acknowledge Ransford Opoku Darko for proofreading the manuscript.
Funding
The authors received no financial support for the research, authorship, and/or publication of this article.
Declaration of conflicting interests
The authors declared no potential conflicts of interest with respect to the research, authorship, and/or publication of this article.
Data availability
The data that support the findings of this study are available from the corresponding author upon reasonable request.