
Abstract
The transition from centralized to decentralized power generation presents a significant opportunity to enhance grid resilience and energy independence, particularly in regions with unstable grids or vulnerability to natural disasters. Distributed Generation (DG), particularly solar photovoltaics, has become a key component of modern power systems, especially in distribution networks. However, its increasing penetration at both utility and distributed levels poses challenges related to voltage, frequency, and angular stability, requiring advanced monitoring and control strategies. In this context, energy storage systems (ESS) emerge as a crucial player, playing a significant role in mitigating these challenges. ESS stabilizes power supply fluctuations and enhances grid reliability, providing a safety net for the intermittent nature of renewable energy sources. This study examines the impact of DG on the stability and operation of the National Interconnected Electric System (SENI) of the Dominican Republic, with a focus on integrating ESS at both utility and distribution levels. Using DIgSILENT, future scenarios (2027) with high renewable penetration were simulated. The methodology included data collection, modeling of actual automatic load shedding (EDAC) events from 2024, and the simulation of three scenarios: without storage, with utility-scale storage, and with both utility-scale and distributed storage. The results indicate that energy storage systems (ESS) significantly enhance system stability, reducing both the total disconnected load and the number of EDAC steps. In the absence of storage, 640 MW were disconnected; with utility-scale storage, this was reduced to 540 MW, and the addition of distributed storage further decreased the disconnected load to 440 MW while also delaying EDAC activation times. Findings highlight the critical need for ESS investments and grid flexibility mechanisms to accommodate increasing renewable penetration, particularly in Small Island Developing States (SIDS). Future research should optimize ESS deployment and conduct detailed economic analyses to support the development of sustainable power systems.
Keywords
Introduction
The transformation of the power generation landscape from centralized to decentralized systems presents a significant opportunity, similar to the evolution of power systems (Dranka and Ferreira, 2020), as well as energy independence and resilience (Shahzad et al., 2023). This shift, driven by substantial modifications in the architecture of power grids, has given rise to Distributed Generation (DG), a vital component of power systems, especially in distribution networks (DNS). DG, which utilizes renewable energy sources close to the point of demand, plays a pivotal role in this market, facilitating the transition from centralized to decentralized power generation. (Ufa et al., 2022), a vital component of power systems, especially in distribution networks (DNS). DG, which utilizes renewable energy sources close to the point of demand (Baldwin et al., 2025), is driven by the quest for energy independence and grid resilience, particularly in regions prone to natural disasters or characterized by unstable grids (U.S. Department of Energy, 2024). Technologies such as fuel cells, microturbines, wind turbines, combustion turbines, micro-hydro, reciprocating engines, and solar photovoltaics, among others (The Business Research Company, 2025) play a crucial role in this market.
As distributed energy resources (DERs) become more common, distributed system operators (DSOs) take on a more significant role in optimizing local energy generation and consumption (Domínguez-Garabitos et al., 2022; International Renewable Energy Agency, 2019). However, the incorporation of renewable energy technologies, both at the utility and distributed generation levels, into the electricity distribution grid has increased the need to monitor and regulate critical parameters such as voltage stability (Rahman et al., 2021), frequency (Putri et al., 2021), and angular stability (M. Chen et al., 2022b), to ensure system reliability (J. Chen et al., 2022a) and security (Haider et al., 2021). The conversion of the electricity grid into active systems with bidirectional flow (consumption and injection) implies that, at times, the power supplied by distributed generation sources may not match local demand (Iweh et al., 2021). Innovative energy storage solutions, such as batteries, enhance intermittent renewable sources by mitigating their fluctuations and stabilizing the energy supply for both distributed generation and the grid.
The Dominican Republic aims to have 30% of its energy matrix come from renewable sources by 2030 (Comision Nacional de Energía (CNE), 2022)The Dominican Republic aims to have 30% of its energy matrix come from renewable sources by 2030. To achieve this goal, distributed generation (DG), especially solar photovoltaic, plays a crucial role. This paper's objective is to assess the effects of distributed generation on the stability and operation of power systems, particularly in those that do not integrate storage in the distribution and transmission networks of the electrical grid in Small Island Developing States (SIDS). The focus is on analyzing how the implementation of DG, combined with energy storage systems, can contribute to the sustainable development of SIDS, considering their specific vulnerabilities and the need for a reliable and high-quality electricity supply.
The article is organized as follows: the methodology is explained in Section 2, the impact of distributed generation on power system stability in Small Island Developing States (SIDS) is discussed in Section 3, a case study is presented in Section 4, scenarios and simulation are explained in Section 5, and conclusions and future work are outlined in Section 6.
Methodology
This study investigates the impact of distributed generation and energy storage systems on the stability and operation of electric power systems. A detailed simulation methodology was developed to analyze future scenarios, with a specific focus on the year 2027, characterized by high penetration of renewable energy sources. The simulations were conducted using DIgSILENT PowerFactory software. The methodology is structured in the following stages:
System data collection and modeling
Dispatch Projection 2027: Dispatch data projected for the year 2027 is compiled, considering the generation of renewable and thermal energy at both the utility (centralized) and distributed levels. The information is obtained from the 2025–2028 Long-Term Program and the National Energy Plan (PEN) of the National Energy Commission (CNE). The long-term scheduling is conducted by the System Operator (OC) of the National Electric System. The projections of the energy storage systems specified in the CNE's PEN are included in the model, considering their technical characteristics and location. A specific simulation period is identified and selected, characterized by a high penetration of renewable energy, specifically the P13-P14 h (12:00–14:00). This period enables the analysis of the system's behavior under conditions of high variability in renewable generation.
Event analysis and renewable generation reduction modeling
Analysis of Automatic Load Disconnection Scheme (EDAC) 2024 Events: An exhaustive analysis of the activation events of the EDAC that occurred during the year 2024, where there was no generation trip, is conducted. The average reduction in renewable generation observed in the EDAC events analyzed is calculated. This value represents the typical magnitude of fluctuations in renewable generation. The calculated average reduction is modeled and applied to renewable generation at both the utility and distributed levels in the simulations. This enables the simulation of the system's response to actual fluctuations in the environment.
Simulations and scenario analysis
Scenario A (without battery): A simulation of the system is performed without the inclusion of energy storage systems to establish a baseline for comparison. A simulation is performed, incorporating energy storage systems only at the utility level, configured to provide Primary Frequency Regulation (PFR).
Scenario B (Utility Scale Battery) and Scenario C (Utility Scale and Distribution Battery): A simulation is conducted with the inclusion of energy storage systems at both the utility and distributed levels, both configured for PFR. These percentages of installed storage capacity—10% of utility-scale renewable generation (240 MW) and 25% of distributed generation (160 MW)—were chosen as representative of the capacities considered in official system planning documents (PEN, OC-SENI) for the year 2027 and the proposed regulatory frameworks. These values ensure the simulation of realistic and technically feasible scenarios based on projected system conditions. In each simulation, the following variables are monitored:
System frequency. Reduction of renewable power. Contribution of energy storage systems.
Comparative analysis and evaluation of results
Comparison of Scenarios: Comparative Analysis and Evaluation of Results: The results obtained in each simulation scenario are compared, evaluating the differences in the system's frequency, EDAC action times, and unbalanced power. The impact of distributed generation and storage systems on the stability and operation of the system is evaluated, identifying the benefits and challenges associated with each scenario. The relevance of the results is verified in terms of the capacity of storage systems to mitigate the adverse effects of fluctuations in renewable generation. Additionally, the study emphasizes the benefits of using DIgSILENT Software for analyzing frequency and voltage stability in power systems. DIgSILENT is highlighted for its ability to simulate and assess the dynamic behavior of the grid, especially under high variability conditions typical of renewable generation (Aybar-Mejía et al., 2023).
Figure 1 illustrates the modeling and simulation framework used in this study. The analysis begins with the integration of updated data from the Interconnected Electrical System (SENI) database, including projections for utility-scale renewable energy and distributed energy resources (DERs). These data inputs are incorporated into the DIgSILENT Power System Model, where three distinct scenarios are developed: (1) a baseline case with no Battery Energy Storage System (BESS), (2) a scenario where BESS supports utility-scale renewable generation, and (3) a scenario where BESS is implemented for both utility-scale and distributed energy resources. Each scenario is subjected to a renewable generation ramp event simulation, and the results are evaluated to assess the impact of integrating a battery energy storage system (BESS) into system stability and operation.

Simulation process flowchart.
Dynamic simulations for stability evaluation
To complement the frequency response and operational analysis of the power system, dynamic simulations were conducted to evaluate its angular stability and the rate of change of frequency (RoCoF) under critical disturbance scenarios.
Two types of time-domain simulations were developed in DIgSILENT PowerFactory:
Angular Stability Simulation: A three-phase fault was applied to one of the system's most critical transmission lines. The fault duration was set to 300 milliseconds, corresponding to the typical clearing time of a Zone 2 protection scheme. The simulation focused on monitoring the rotor angle trajectories of the main synchronous generators to assess system damping characteristics. Scenarios with and without the inclusion of battery energy storage systems (BESS) were compared, with BESS configured to provide both active and reactive power support during the disturbance.
RoCoF Analysis Simulation: A separate dynamic scenario was developed to evaluate the system's frequency stability following the sudden disconnection of a large generator. The generator's capacity was modeled to represent approximately 10% of the real-time generation. The RoCoF was calculated within the first 200 milliseconds following the disturbance. Simulations were performed both with and without BESS participation, where BESS units were modeled to inject active power in response to the frequency deviation.
These dynamic simulations enabled a quantitative assessment of the system's response under transient conditions, particularly regarding angular stability and the mitigation of frequency excursions. The setup allowed for consistent comparison across scenarios and aligned with the technical assumptions used in previous simulation stages.
Distributed generation impact on power system stability in Small Island Developing States (SIDS)
The incorporation of distributed generation (DG) into power systems is a vital factor, particularly for Small Island Developing States (SIDS), where energy systems often encounter issues related to stability, reliability, and economic viability. However, the increasing integration of renewable energy sources, such as solar and wind, in these locations is having an increasingly negative impact on power system stability. Research indicates that distributed generation (DG) can influence the stability of electrical grids in Small Island Developing States (SIDS) both positively and negatively, contingent upon variables such as generation capacity, the availability of storage devices, and grid architecture (Judge et al., 2023; Judge et al., 2024; Patil et al., 2021).
Distributed generation can facilitate the decentralization of power production, thereby enhance energy security, and reduce reliance on imported fuels, a significant issue for many island governments. Nevertheless, the sporadic characteristics of renewable distributed generation sources, such as solar and wind, can result in frequency and voltage variations, complicating grid management. Therefore, the variability of renewable resources presents a distinct challenge to grid operators in Small Island Developing States (SIDS), where the energy composition is frequently characterized by a predominance of imported fossil fuels and a limited number of centralized power plants. (Kelly et al., 2019) Moreover, the integration of energy storage systems (ESS) has been acknowledged as a viable approach to alleviate the adverse effects of distributed generation (DG) on grid stability. Accordingly, ESS can mitigate the variability in Distributed Generation (DG) output, hence maintaining a stable power supply during instances of diminished renewable generation or peak demand. This is especially crucial in Small Island Developing States (SIDS), where the potential for grid growth is frequently constrained, and swift fluctuations in power can disrupt the system (Alqahtani et al., 2023; Katsaprakakis et al., 2019).
Recent studies have simulated scenarios both with and without storage, illustrating that storage systems can significantly enhance voltage and frequency stability, reduce renewable energy curtailment, and improve the overall economic viability of distributed generation in small island power systems (Adewumi et al., 2022; Akmal et al., 2024; Leal Filho et al., 2022; Niles and Lloyd, 2013). With the growing need for clean energy solutions, these scenarios offer critical insights into the optimal design and management of electric grids in Small Island Developing States (SIDS), underscoring the necessity of integrating storage with distributed generation (DG) to ensure reliable and sustainable energy systems. (Eras-Almeida and Egido-Aguilera, 2019).
Case study
The 2024 Annual Report of the Organismo Coordinador (OC) provides a detailed overview of the SENI. According to the report, the SENI generation matrix is characterized by a diverse range of energy sources, although fossil fuels remain the predominant source. The total installed capacity amounts to 4915.2 MW, distributed as follows: 623.3 MW from hydroelectric sources, 1040 MW from coal, 678.3 MW from natural gas, 187.5 MW from solar photovoltaic, 370 MW from wind power, 30 MW from biomass, 400 MW from fuel oil #2, 1095.7 MW from fuel oil #6, 34 MW from gas-fuel oil #6, 185 MW from fuel oil #6-#2, and 223.2 MW from gas-fuel oil #6 (Organismo Coordinador del Sistema Eléctrico Nacional Interconectado de la República Dominicana, 2024b). Despite the significant contribution of renewable sources, such as hydroelectric, wind, and solar photovoltaic power, petroleum derivatives and fossil fuels continue to dominate the generation sector. The SENI transmission network, managed exclusively by a single entity, consists of transmission lines operating at various voltage levels. Specifically, the system includes 1696 km of 69 kV lines, 3141 km of 138 kV lines, 275 km of 230 kV lines, and 350 km of 345 kV lines. (Organismo Coordinador del Sistema Eléctrico Nacional Interconectado de la República Dominicana, 2024b). This infrastructure is crucial for efficiently transporting electricity from generation plants to distribution centers and large consumers.
Regarding distribution, five utility companies operate within geographically defined areas regulated by agreements and legislation, serving the country's three macro-regions (Consejo Unificado de las Empresas Distribuidoras & Presidencia de la República Dominicana, 2021) (Congreso Nacional & Gobierno de la República Dominicana, 2001). These companies are responsible for delivering electricity to end consumers, ensuring service reliability and coverage within their respective concession areas.
The state of the SENI can be analyzed through data published in the 2024 Annual Report by Organismo Coordinador (OC) and energy sector statistics provided by the National Energy Commission (CNE). (Organismo Coordinador del Sistema Eléctrico Nacional Interconectado de la República Dominicana, 2024b; Comisión Nacional de Energía (CNE), 2024) These sources reveal key metrics, including the approximate average demand at interconnection points, which are essential for understanding energy flow and distribution across the system.
Figure 2 presents a simplified diagram of the SENI by region.

Simplified representation of the SENI by zones. The numbers represent the names of the electrical interconnections that occur in Table 1, and the arrows represent the direction of the flow of energy.
Technical data of the interconnection lines of the zones in the SENI.

Acronym: Aluminum (Al), Steel Tower (ST), All Aluminum Alloy Conductor (AAAC), Aluminum Conductor Alloy Reinforced (ACAR).
Table 1 presents the technical data of the interconnection lines of the different areas within the SENI. The transmission lines at the 138 kV and 345 kV levels that connect the northern region with the SENI are detailed, highlighting the key infrastructure for the stability and flow of energy in the network. This information is crucial for analyzing transmission capacity and evaluating the impacts on system operation resulting from variations in generation and demand.
Table 2 presents the projection of electricity demand in different areas of the system for the years 2025 and 2027, where the estimates for 2027 have been calculated using a linear and stratified approximation based on the data reported by the National Energy Commission (CNE) and the Coordinating Body of the National Interconnected Electric System (OC-SENI).
SENI demand by zones for 2025 and 2027.

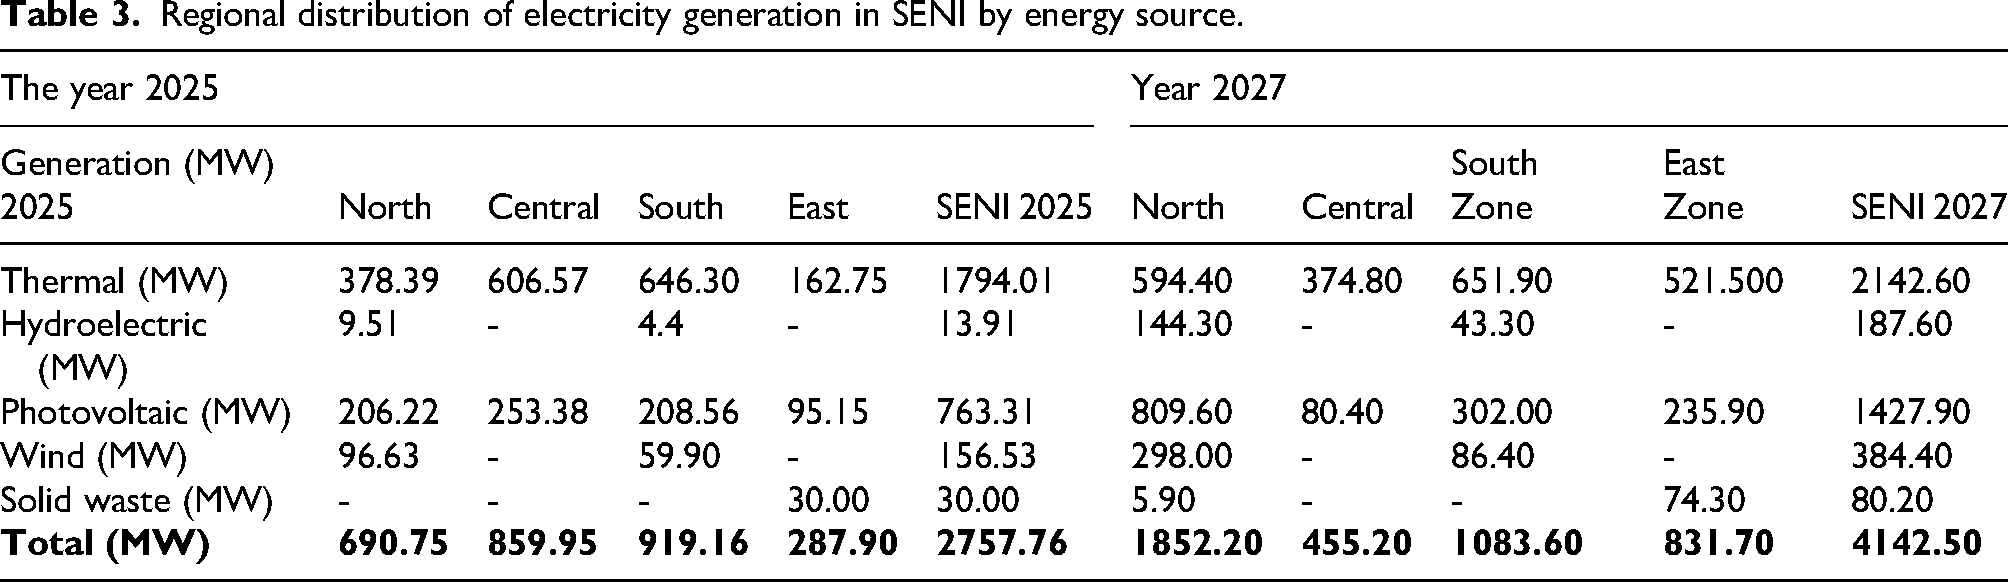
Table 3 presents the regional distribution of electricity generation in the SENI, breaking down the different energy sources used and detailing contributions from thermal, hydroelectric, photovoltaic, wind, and solid waste generation in the North, Central, South, and East regions. This analysis enables an evaluation of the diversification of the energy matrix and its impact on the stability and reliability of the electricity system, considering the increasing penetration of renewable sources and their spatial variability. The 2027 projection is based on the National Energy Plan of the National Energy Commission (CNE) and the medium-term planning of the Coordinating Body of SENI (OC-SENI).
Regional distribution of electricity generation in SENI by energy source.
Tables 4 and 5 provide a comprehensive characterization of generation, demand, and losses within the SENI by geographical area for 2025 and 2027, respectively, using key electrical parameters. Specifically, these tables delineate active (MW) and reactive (MVAr) power generation. Table 4 highlights generation outputs derived from a 2025 load flow analysis during peak hours of renewable energy penetration, along with the contributions of distributed generation, total demand, transmission losses, and installed capacity for each region. This data facilitates an in-depth analysis of generation distribution relative to demand and the impact of distributed generation on system stability. Notably, the Central region exhibits the highest demand, while the North region boasts the highest installed capacity. Across all areas, distributed generation plays a crucial role in reducing SENI grid demand. The 2027 projections indicate a substantial increase in total system generation, primarily driven by expanded capacity, particularly in the North and South zones, as well as the integration of additional distributed resources. Furthermore, the expansion of the 345 kV transmission system is expected to enhance grid reliability and mitigate losses. This analysis is crucial for planning and operating the electrical system, supporting strategies to enhance efficiency, optimize resource allocation, and ensure a more stable and resilient electricity supply.
Distribution of generation, demand, and losses in the SENI by geographical area for 2025.

Distribution of generation, demand, and losses in the SENI by geographical area for 2025.

As stated in the introduction, the Dominican Republic has set a goal of having at least 30% of its energy matrix come from renewable sources by 2030. In this context, distributed generation (DG), particularly solar photovoltaic generation, plays a crucial role in diversifying and sustaining the electricity system. Driven by economic and environmental incentives, thousands of households and industries have incorporated this technology into their operations. Currently, the installed capacity of distributed generation, primarily photovoltaic, has reached 414 MW, representing a 234% growth compared to 2020, according to data from the National Energy Commission (CNE) (Comisión Nacional de Energía (CNE), 2024). Figure 3 illustrates the upward trend of distributed generation in the SENI. This trend has been used as a reference to estimate the demand and projected growth in installed capacity for 2027.
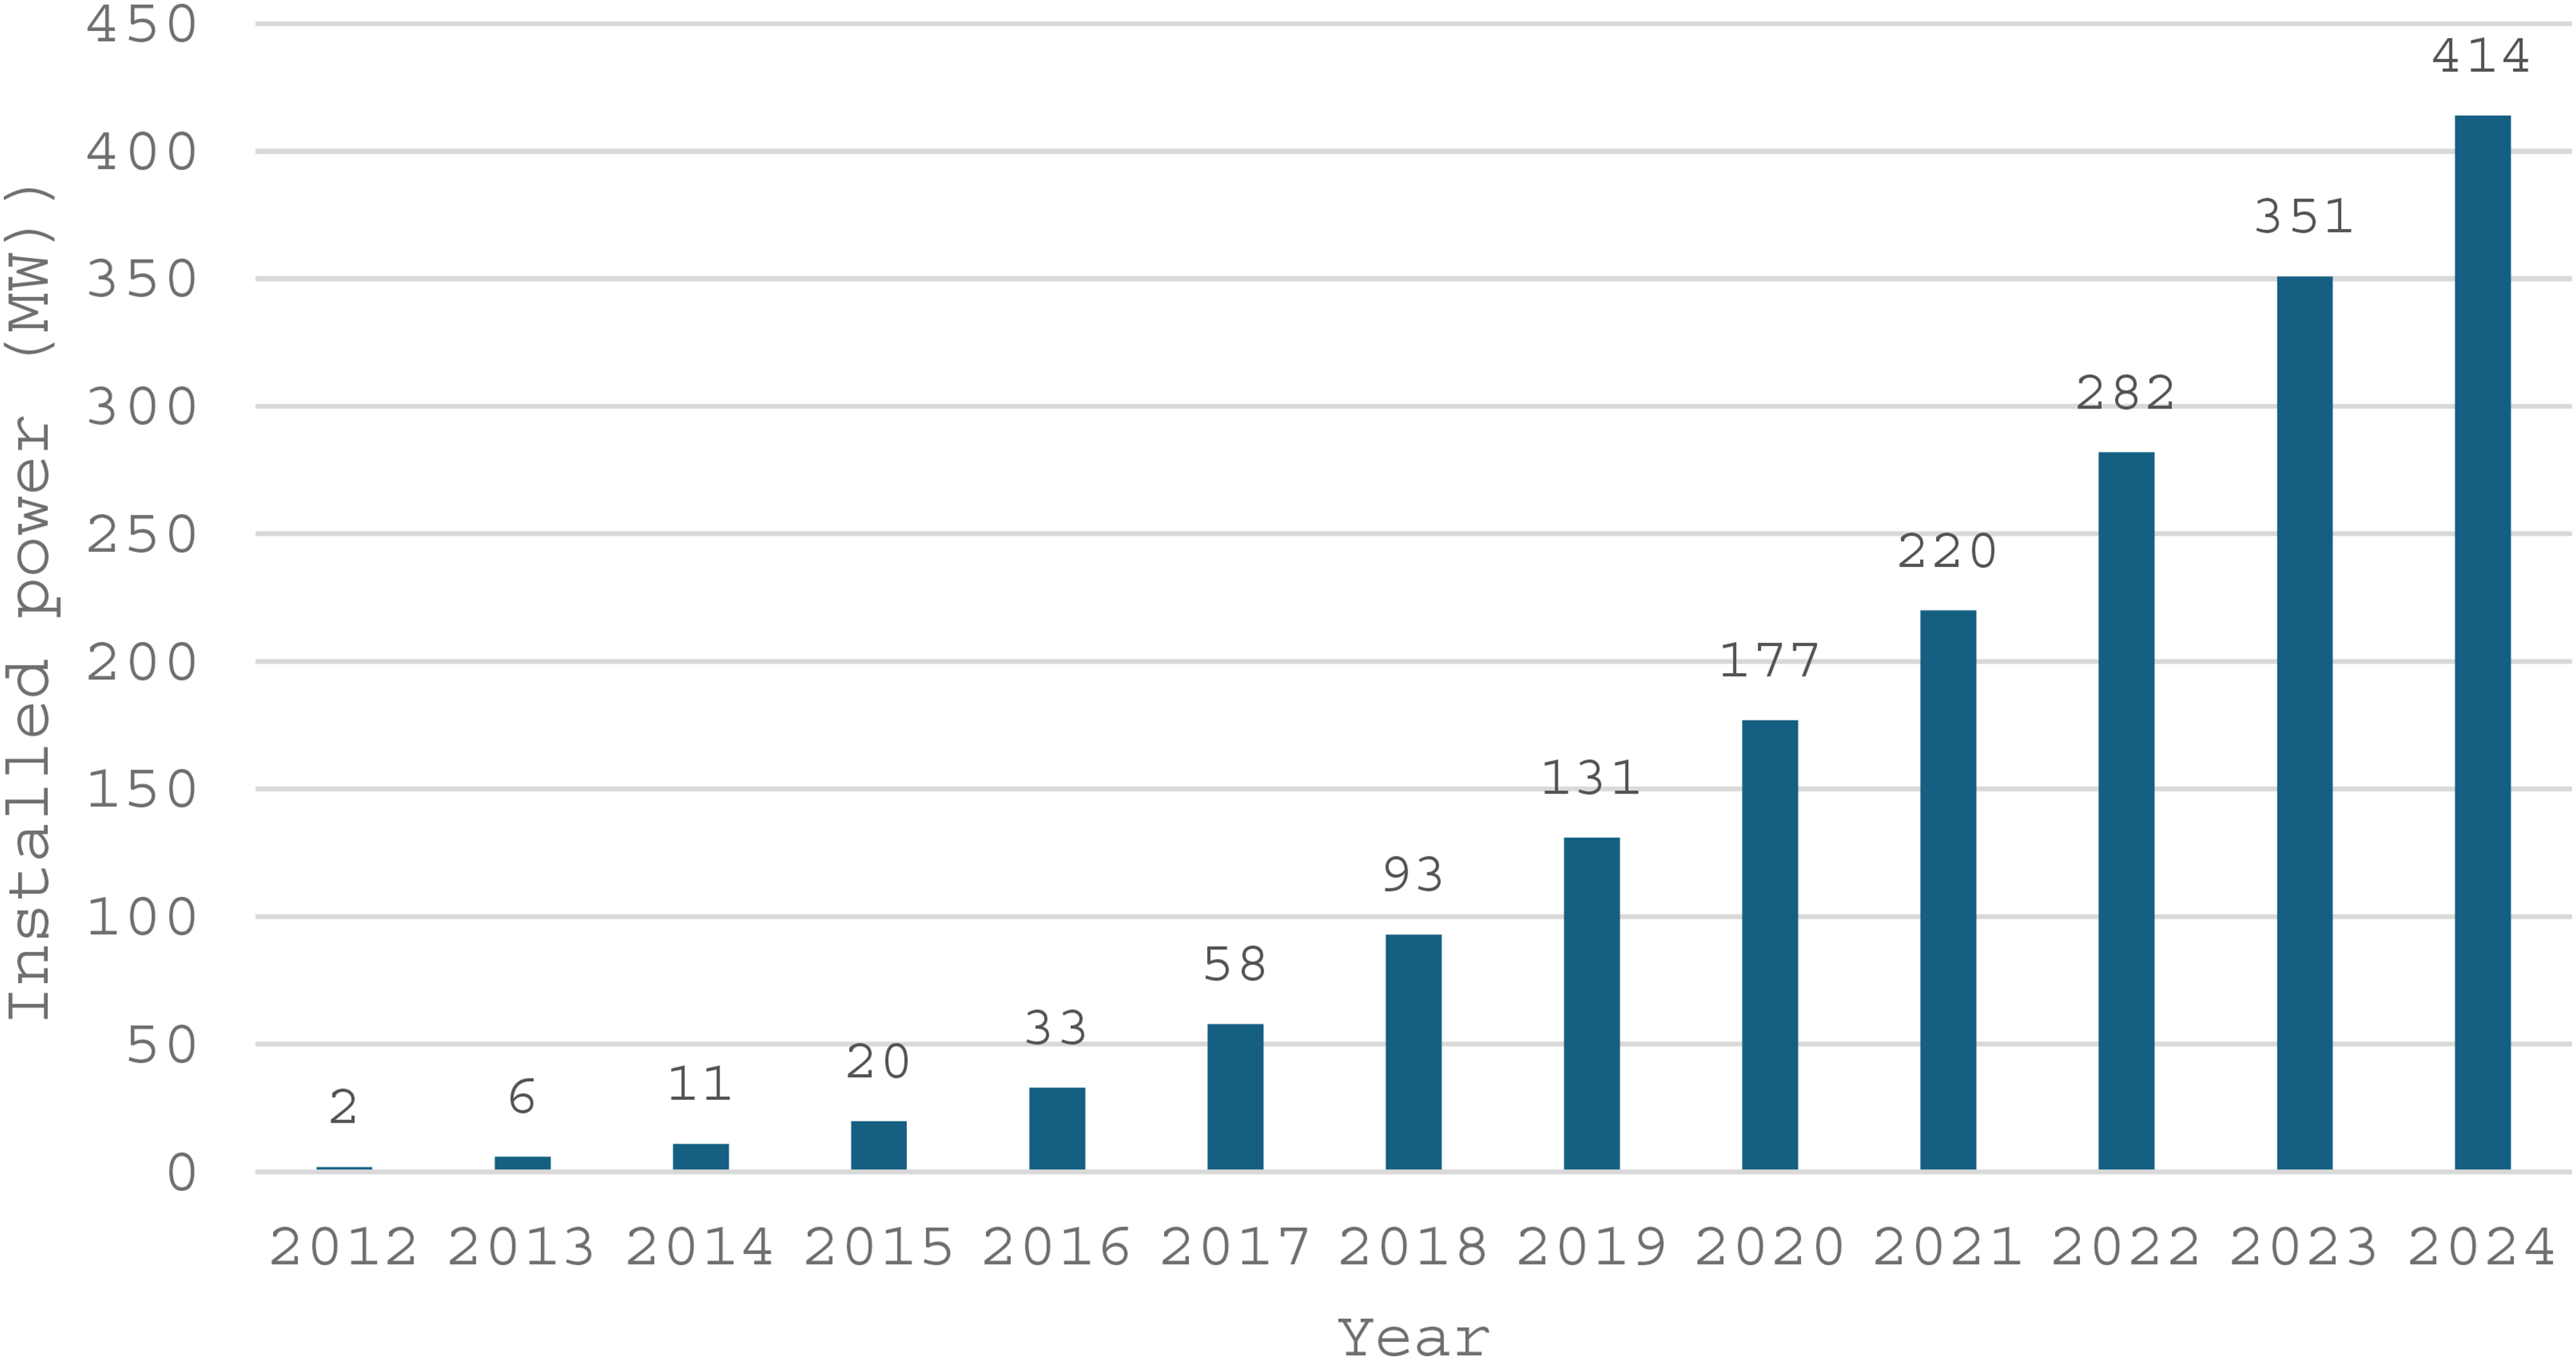
Annual installed capacity in distributed generation.
The Automatic Load Shedding Scheme (EDAC) (Organismo Coordinador del Sistema Eléctrico Nacional Interconectado de la República Dominicana, 2024a) It is an essential mechanism to preserve the stability of the National Interconnected Electric System (SENI), automatically disconnecting specific loads when the frequency drops to critical levels. Traditionally, its activation was associated with the sudden disconnection of large generation plants. However, with the increasing integration of large-scale renewables, EDAC has become more active due to fluctuations in renewable production, such as variations in solar radiation or wind speed. This phenomenon has introduced greater variability in the generation-demand balance, increasing the incidence of EDAC without failures in conventional plants. The current configuration of the EDAC is presented in Table 6. It consists of seven steps, with a total disconnected load of 850 MW.
Automatic load shedding scheme (EDAC) configuration in the SEN.

In 2024, an average of 1.2 weekly activations of the EDAC were recorded without tripping, which demonstrates the growing impact of renewable generation on system stability. A detailed analysis of October 1, 2024, event revealed that a 129.88 MW reduction in large-scale renewable generation, combined with an unexpected 107.52 MW increase in demand, depleted the frequency regulation reserve, causing the activation of the EDAC. This pattern has been repeated in multiple events, where approximately 41.32% of the generation-demand imbalance has been attributed to the reduction in distributed renewable generation. These findings highlight the need for advanced renewable variability management strategies to mitigate its impact on SENI stability.
In 2024, an average of 1.2 weekly activations of the EDAC were recorded without generation tripping (Organismo Coordinador del Sistema Eléctrico Nacional Interconectado de la República Dominicana, 2024a). This illustrates the increasing impact of renewable variability on the system's stability. The annual activations are shown in Figure 4.

The action of the EDAC without annual generation tripping.
Table 7 presents events of reduction in the generation of Variable Renewable Energy (VRE) in the SENI, including their impact on system stability. Key values are detailed, such as the magnitude of the reduction, the duration of the event, the frequency reserve used, the increase in demand, and the total imbalance generated, as well as the percentage of imbalance attributed to distributed renewable generation (DER). Additionally, the average value of the events recorded between 2023 and 2024 is included, providing a reference to the historical behavior of these variations.
Summary of events related to renewable and distributed generation at SENI.

Large-Scale Renewable Energy (LSRE), Distributed Renewable Energy (DER), Available capacity to compensate for variations in generation/demand (Frequency Reserve), Difference between generation and demand that affects the stability of the system (Total Imbalance).
Non-generation trip EDAC activations are not solely driven by reductions in large-scale generation within the system. A sizable portion of the imbalance in each event is attributed to increased demand. Figure 5 illustrates the historical causes of total imbalance during the 2023–2024 events.
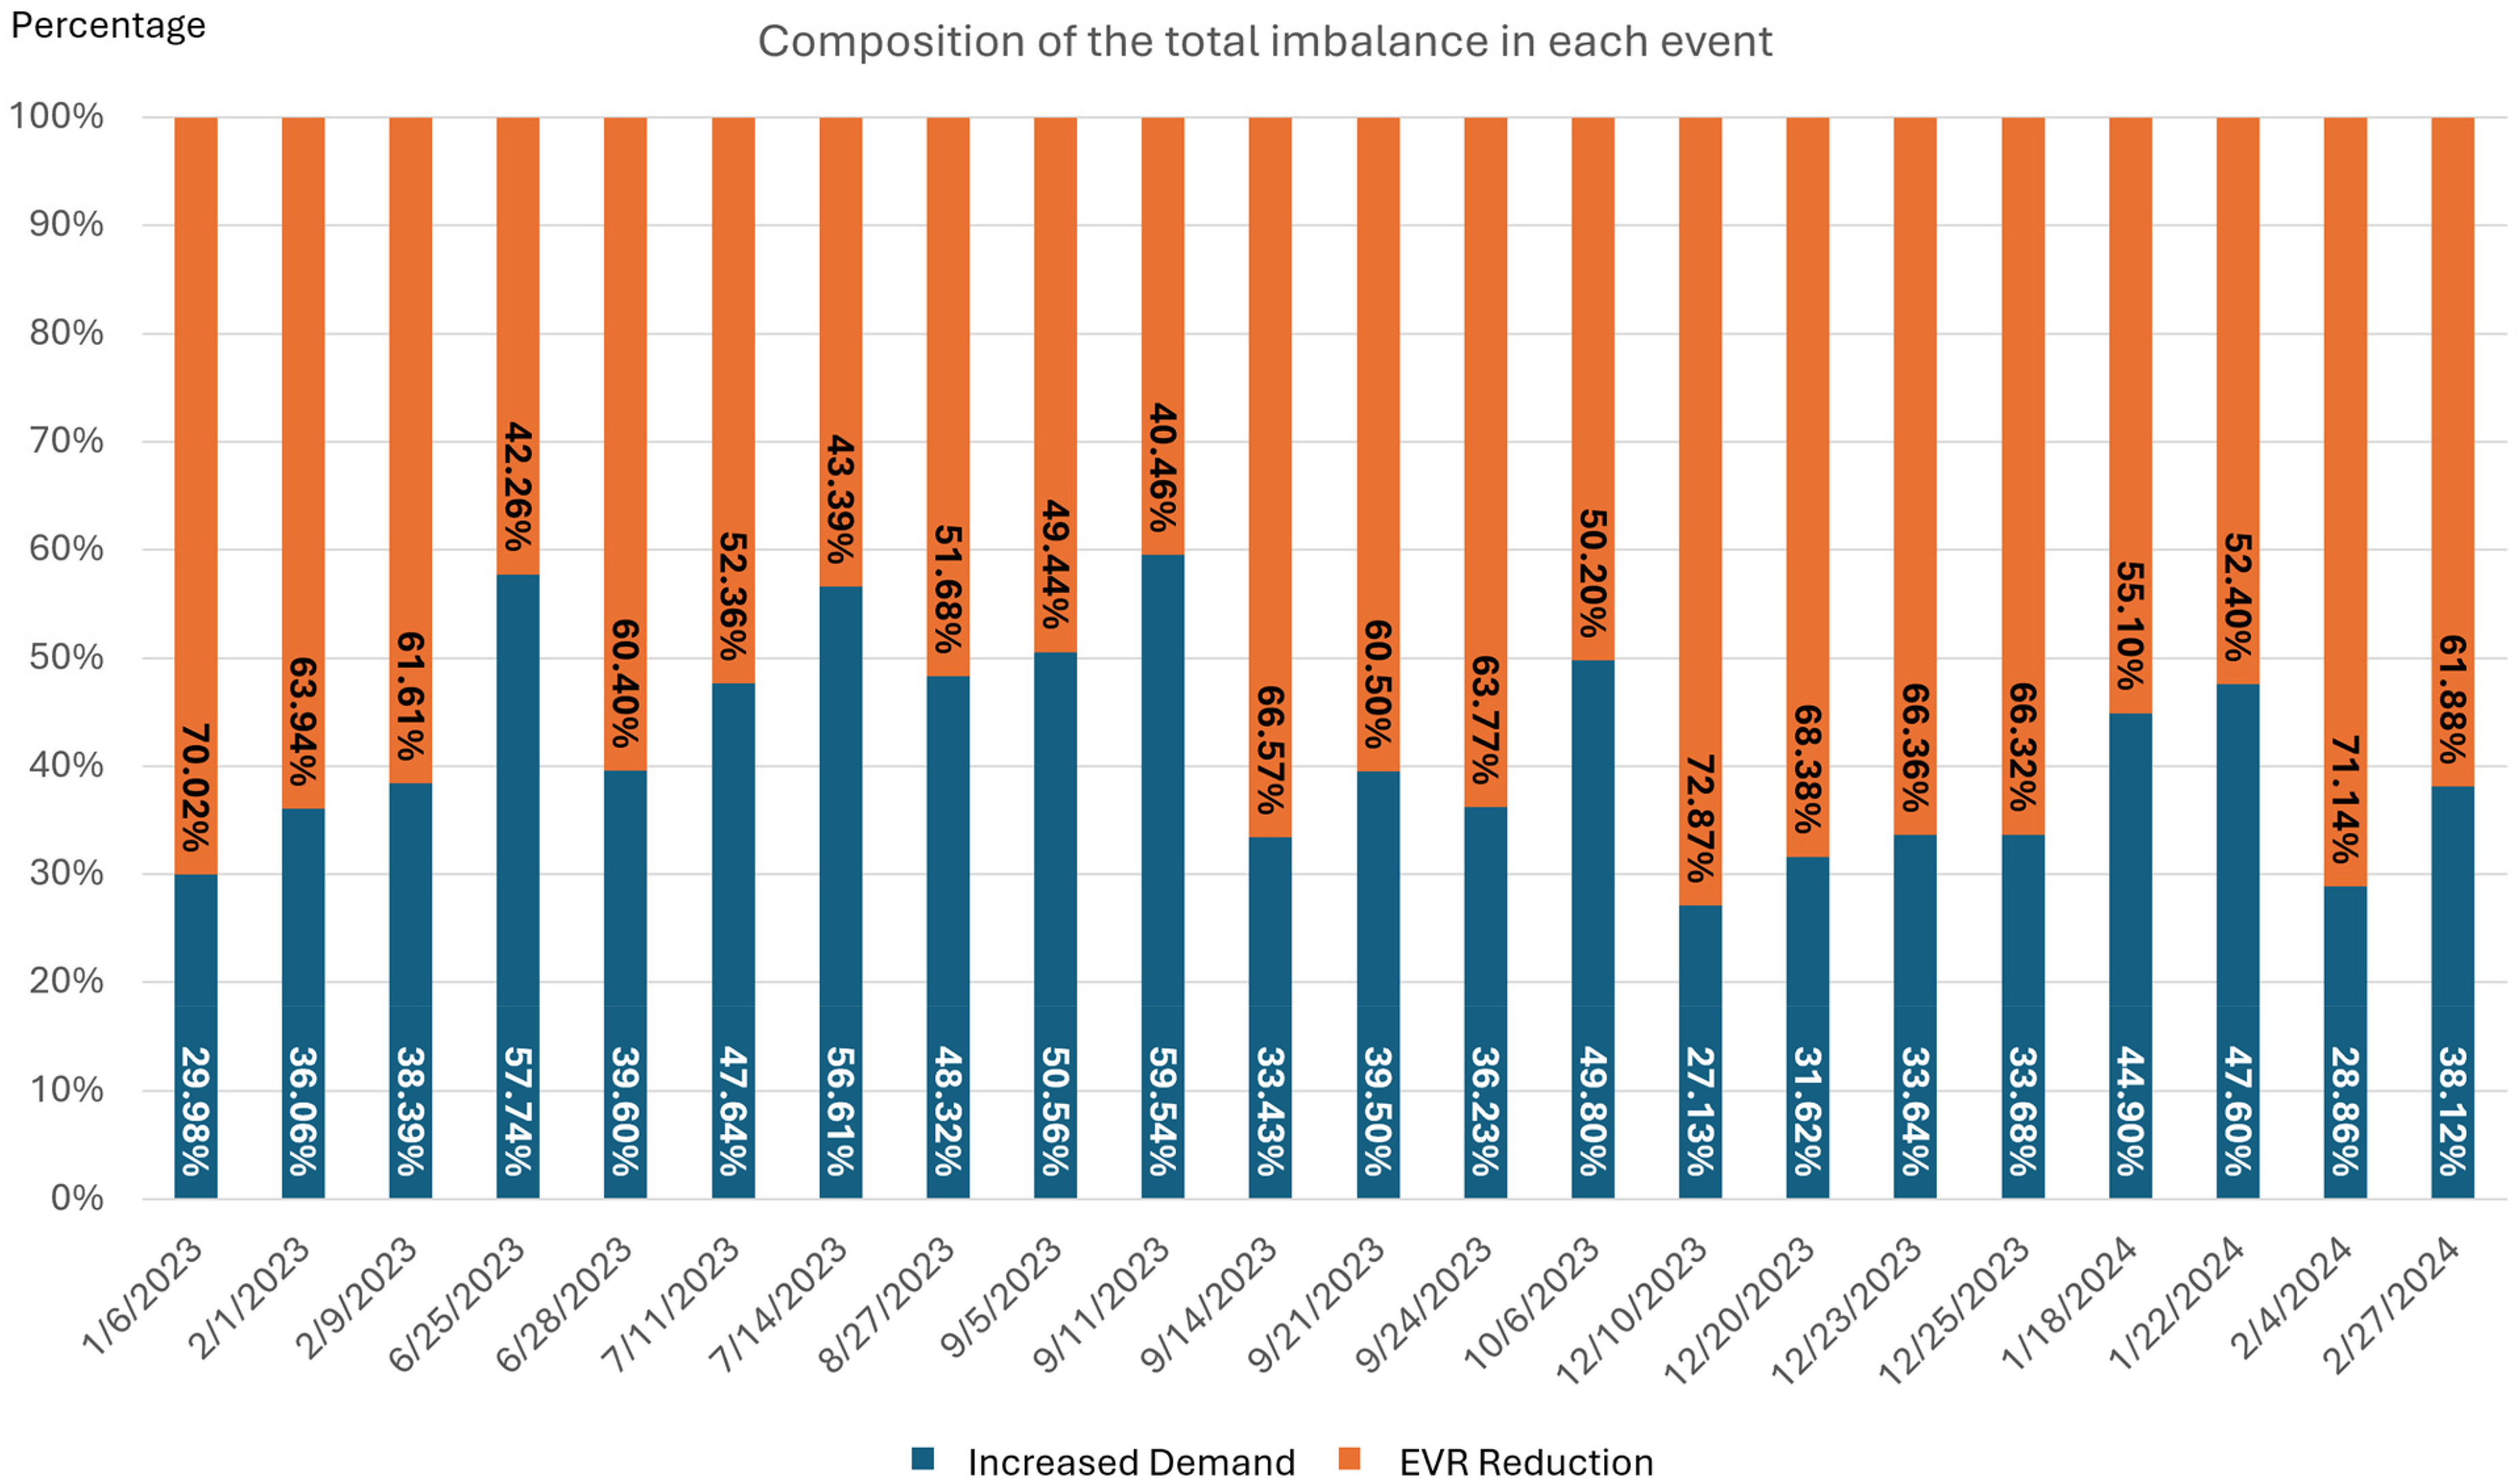
The cause of the total imbalance in the 2023–2024 events. EVR = Renewable Variable Energy.
Non-generation trip EDAC activations are not only caused by the reduction of large-scale generation connected in the system. A significant portion of the imbalance in each event is attributed to increased demand.
Scenarios and simulation
To define the scenarios to be evaluated, the EDAC activation events without a generation trip that had the most significant impact on the study were selected. These events were projected based on the expected system configuration in 2027. Consequently, the average projected demand for 2027, estimated at 3500 MW, was used. Furthermore, renewable generation at the utility level is estimated at 2400 MW, while renewable generation in distribution reaches 656 MW. Regarding the model implemented, it considers a 30.1% reduction in renewable power at the utility level within 23 s, equivalent to 742 MW. Additionally, an increase in demand was incorporated due to the reduction of renewable energy in distribution, estimated at 7.13% (249.4 MW in 23 s).
For the BESS reserve, 10% of the installed power at the utility level, equivalent to 240 MW, was considered. With this reserve margin, storage presents the same delivery commitment as conventional generation for frequency regulation, considering the worst-case scenario, where 5% primary frequency regulation and 5% secondary frequency regulation would be required. As for batteries at the distribution level, 25% of the projected distributed generation was considered, which represents 160 MW under the regulations proposed by the CNE for arbitration services. This regulatory limitation has been sized based on the flow studies that can be assumed to occur in the current distribution networks when storage is withdrawn from the grid. In this way, the security of supply to the end-user is guaranteed (Comisión Nacional de Energía, 2024). These percentages were chosen as representative of the capacities considered in the system planning (PEN, OC-SENI) for 2027 and the proposed regulations to simulate realistic scenarios under these projections.
To evaluate the impact of energy storage on the stability and operation of the SENI, three simulation scenarios were defined. Scenario A represents the baseline situation in which no storage systems are present on the grid. In Scenario B, a utility-scale battery system with a capacity of 240 MW is introduced, enabling improved management of renewable generation variability and enhanced system stability. Finally, Scenario C expands storage integration by including, in addition to utility-scale batteries (240 MW), distributed storage systems in the distribution grid with an additional capacity of 160 MW. This last scenario not only enhances the system's dynamic response but also optimizes demand management and reduces congestion in the transmission grid. Figure 6 presents a simulation of scenarios with varying storage capacities for the impact of energy storage integration on the stability and load-shedding response of the SENI.

Simulation of scenarios with varying storage capacities.
Figure 7 shows the simplified section of the simulated SENI in DIgSILENT PowerFactory, where colors represent the island's geographic regions (North, South, East, and West), each with its corresponding generation sources, transmission lines, transformers, and equivalent demand per region. Additionally, the figure illustrates the planned expansion of the 345 kV interconnection network within the SENI. This information was obtained from the database developed by the OC.
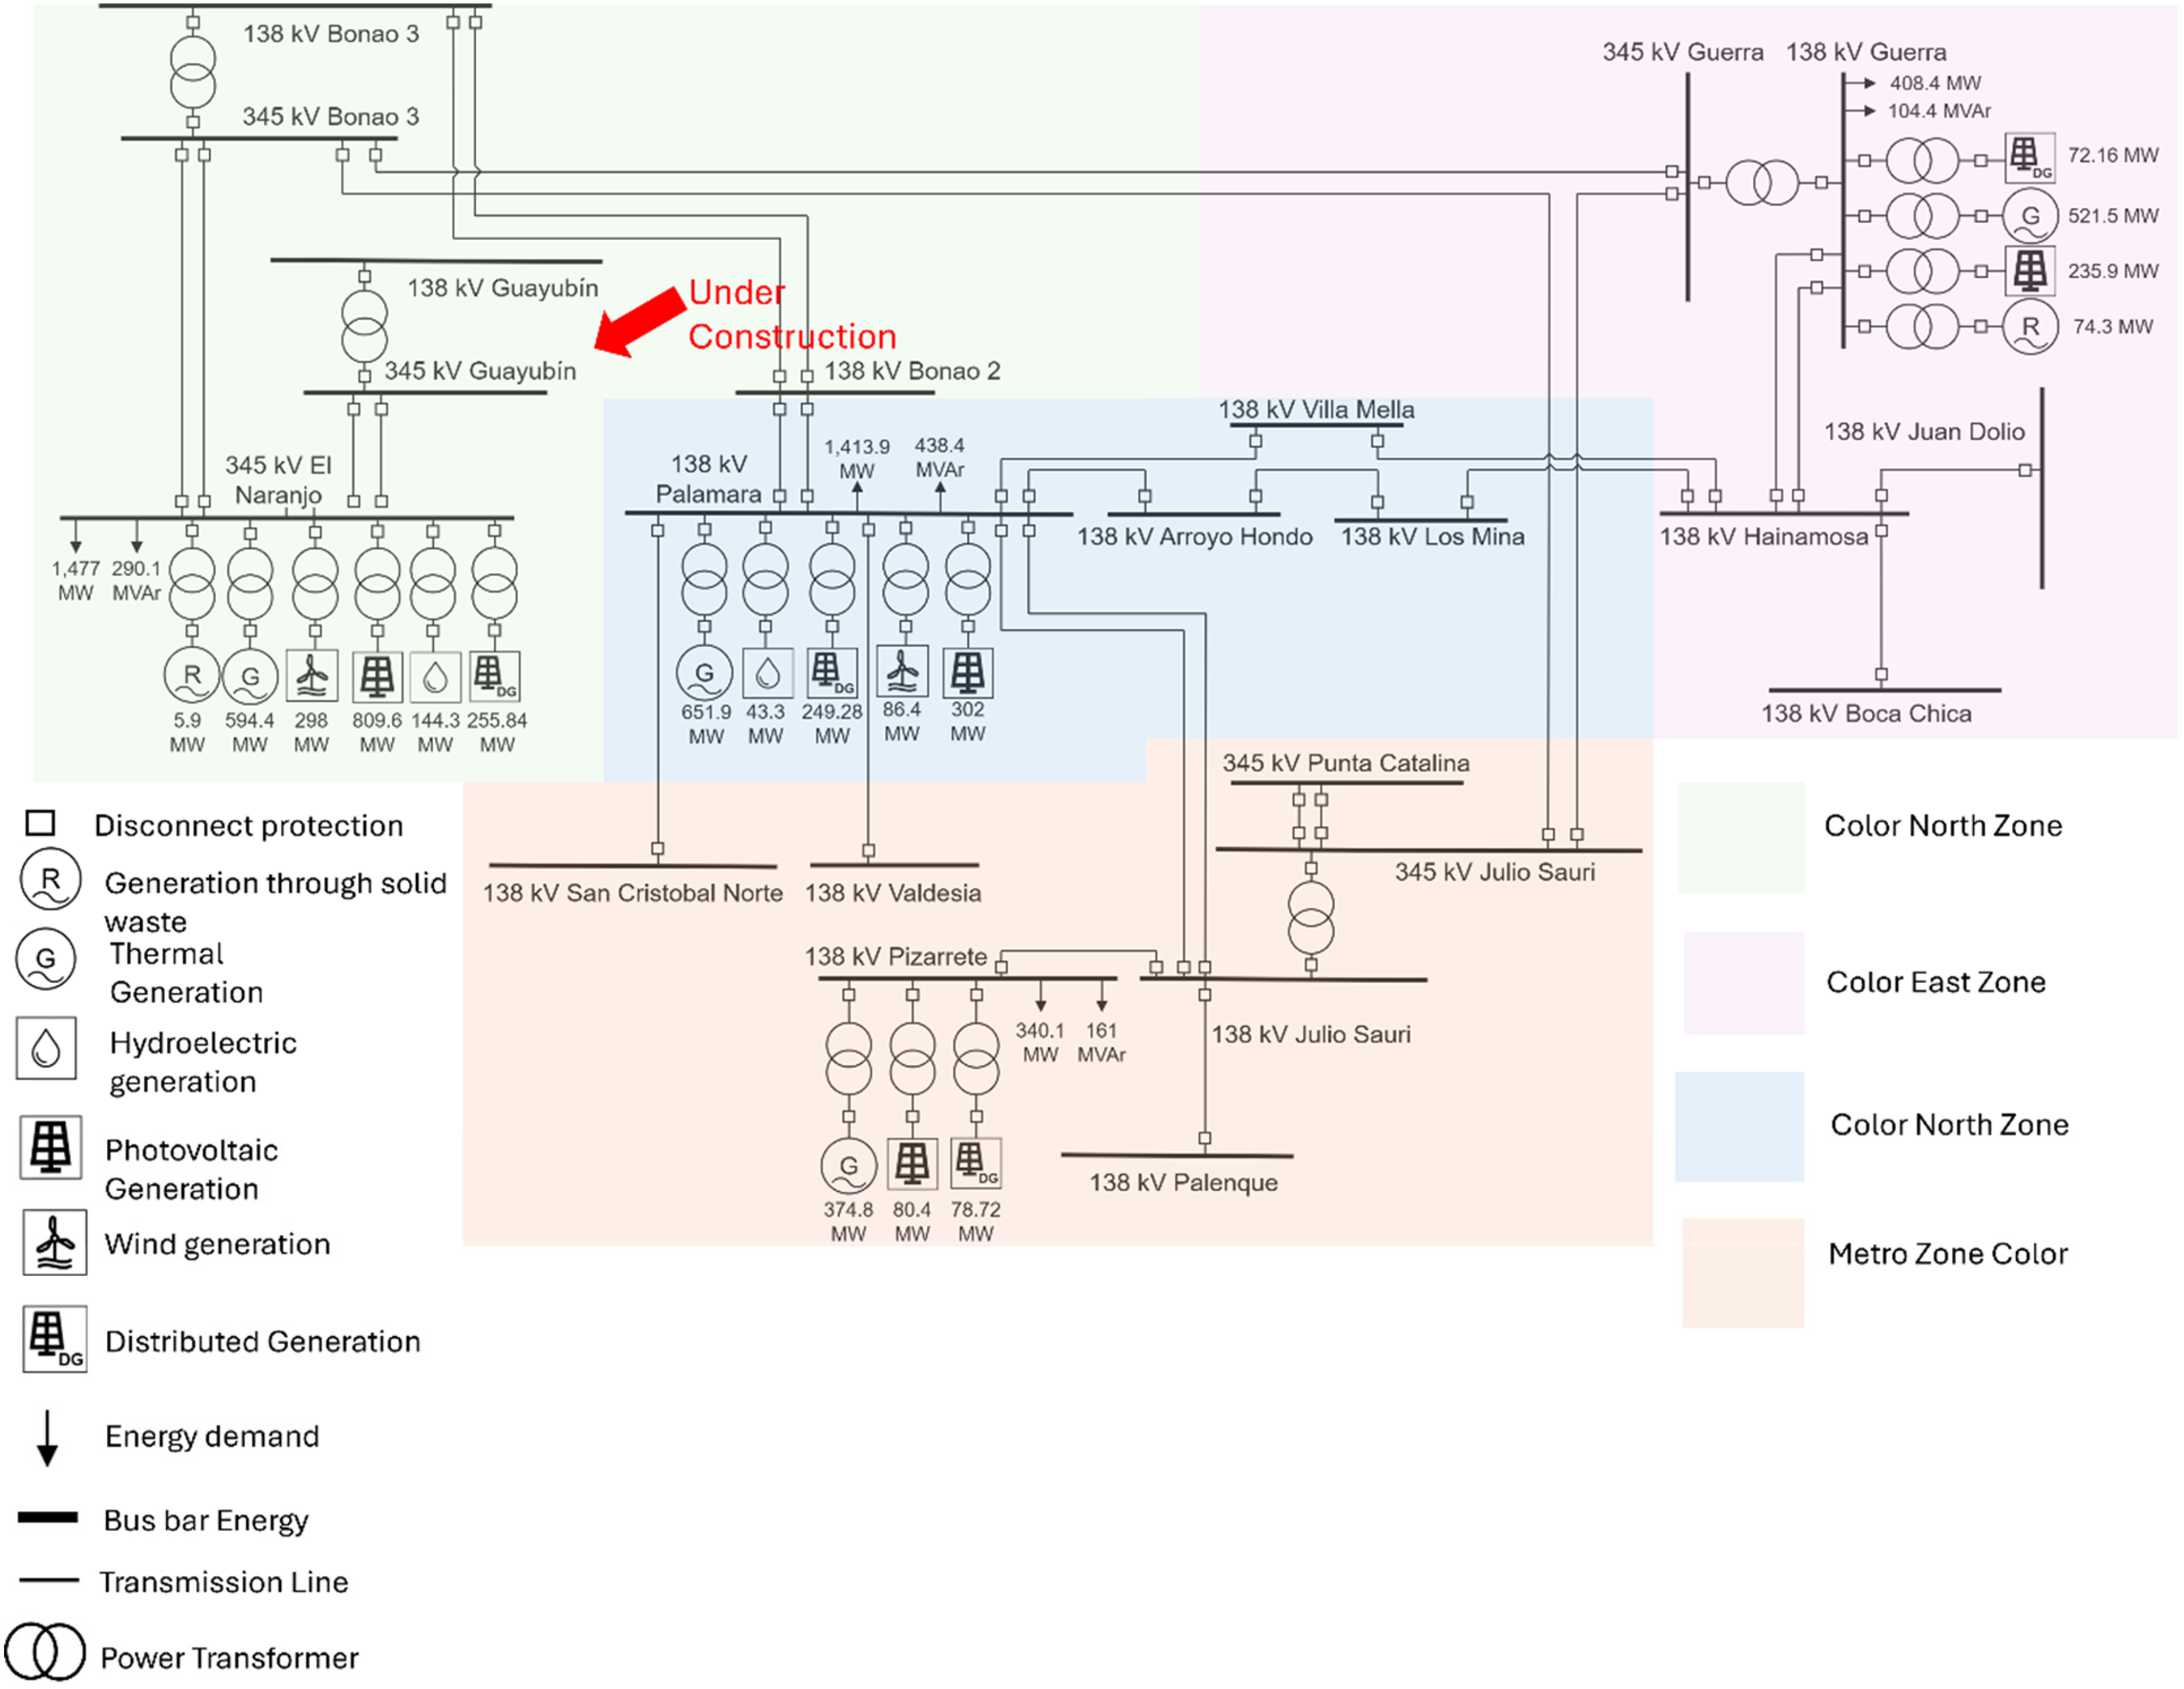
Simplified section of the simulated SENI in digsilent power factory.
Results and discussion
The simulation of the reduction of variable renewable energy was conducted in each of the defined scenarios. Figure 8 illustrates the evolution of system frequency under various scenarios involving utility-scale renewable generation reduction and increased demand in the distribution grid, including: (a) increased demand due to Electric Vehicle Recharge (EVR), (b) reduction in EVR utility-scale generation, (c) combined effects of reduced utility-scale renewable generation and increased demand from lower distributed renewable energy, (d) frequency response under reduced utility-scale generation and higher demand from diminished distributed renewable sources, and (e) the overall impact of renewable generation reduction on frequency stability and demand growth in the distribution network.

Evolution of frequency in response to utility-scale renewable generation reduction and increased demand in the distribution grid. (a) Increased demand for EVR, (b) EVR utility scale reduction, (c) Evolution of frequency, reduction in utility-scale renewable generation, and increased demand due to the decline in renewable energy in the distribution grid, (d) Evolution of frequency, utility-scale renewable generation reduction, and increased demand due to decreased renewable energy in the distribution y (e) Impact of renewable generation reduction on frequency evolution and demand increase in the distribution grid.
Figure 8(c) illustrates the evolution of frequency, the reduction in utility-scale renewable generation, and the increase in demand resulting from the decrease in renewable energy within the distribution grid. It is observed that as renewable energy generation decreases, the system frequency begins to drop, reaching the activation threshold for the first step of EDAC after 5.88 s. In total, six steps of the EDAC were activated, disconnecting a total load of 640 MW.
Figure 8(d) shows the evolution of the electrical system frequency, the reduction in renewable generation at the utility scale, and the increase in demand due to the decrease in renewable energy in the distribution grid. It is observed that, because of the reduction in renewable energy, the system frequency begins to decrease, reaching the activation threshold of the first step of the Automatic Load Shedding Scheme (EDAC) in 11.6 s. In total, five EDAC steps were activated, with a total disconnected capacity of 540 MW, illustrating how the variability of renewable generation affects system stability and the need for control measures to maintain the balance between generation and demand.
Figure 8(e) illustrates the evolution of system frequency, the reduction of utility-scale renewable generation, and the increase in demand resulting from the decrease in renewable energy within the distribution grid. As renewable energy generation decreases, the system frequency begins to decline, triggering the activation of the first load-shedding step at 15.49 s. In total, four steps of the EDAC were activated, resulting in a complete disconnection of 440 MW. This behavior underscores the impact of renewable energy variability on system stability, highlighting the importance of load-shedding mechanisms in maintaining grid reliability and preventing further frequency deviations.
Table 8 presents a detailed comparison of the simulation results for all evaluated scenarios, offering an analysis of the system's performance under varying conditions. As shown, the system's performance improves with an increase in storage capacity, as evidenced by a reduction in both the number of activated EDAC steps and the total disconnected load.
Comparison of EDAC step activation and load shedding for different scenarios: no battery, utility-scale battery, and utility-scale + distribution battery.

In
This analysis highlights the crucial role that energy storage plays in maintaining grid stability. As storage capacity increases, the system's ability to absorb fluctuations in renewable generation improves, resulting in fewer and slower load-shedding activations. Moreover, the delay in load-shedding activation times as storage increases illustrates the grid's enhanced ability to manage and mitigate the impacts of reduced renewable energy, increasing the reliability and stability of the system.
Figure 9(a) illustrates the system's behavior without any battery storage. It highlights the internal rotor angles of the main synchronous generators, showing oscillations following a fault and their subsequent damping. The system demonstrates satisfactory dynamic performance, with effective attenuation of the oscillatory response.
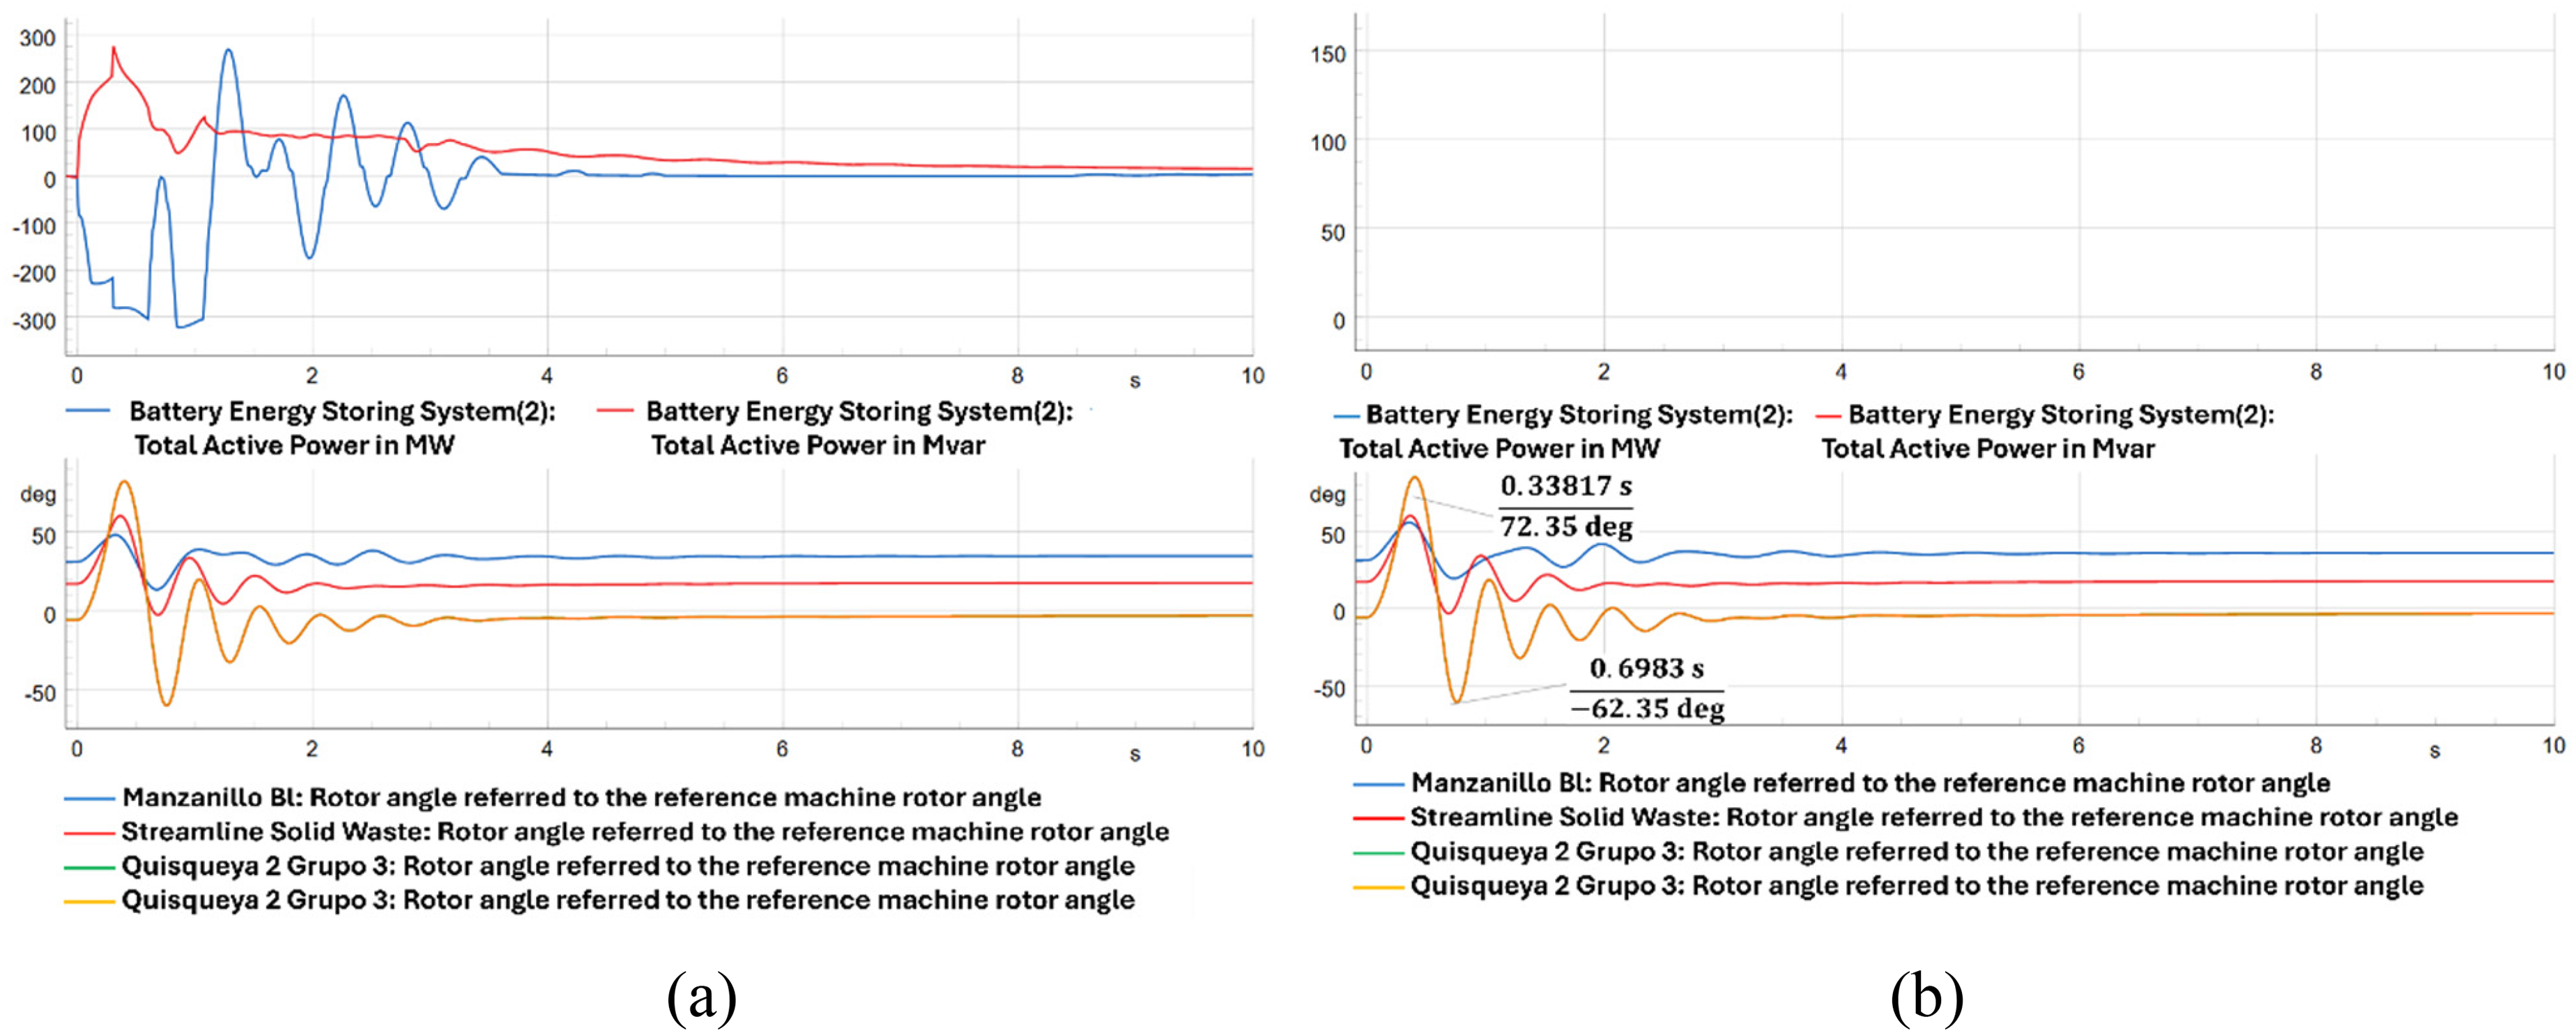
Rotor angle response for case 1 – (a) With battery storage, (b) Without battery storage.
Figure 9(b) shows the system's response to the same fault, this time with the battery storage systems active. During the event, both active and reactive power support from the batteries can be observed. The rotor angles of the main generators exhibit well-damped oscillations, confirming that the system remains stable both with and without the presence of battery energy storage systems.
To assess the impact of battery storage systems on the rate of change of frequency (RoCoF), a sudden disconnection of a 300 MW generator, equivalent to approximately 10% of the system's real-time generation, was simulated. Figure 10(a) illustrates the frequency response without battery support following the generator outage. In this scenario, the RoCoF reached 402 mHz/s, and frequency stabilization was not achieved within the simulation timeframe. Figure 10(b) presents the same generator disconnection event, but with the battery energy storage systems activated. A significant power injection from the batteries is observed, reaching 150 MW in less than 500 milliseconds. In this case, the rate of change of frequency (RoCoF) was reduced to 300 mHz/s, demonstrating the batteries’ effectiveness in mitigating frequency deviations.

Rocof response – case 3: (a) With battery storage, (b) Without battery storage.
In the context of the economic dimensions, one of the potential barriers to the deployment of BESS in SIDS is related to investment recovery. In 2024, the average marginal cost of energy in the Dominican Republic''s national interconnected electricity system reached US$122/MWh, as reported by the Organismo Coordinador del Sistema Eléctrico Nacional Interconectado de la República Dominicana (2024b). If storage provides the frequency regulation service, in addition to energy valuation, it will require an incentive within the framework of economic compensation for frequency regulation of the system. In the case of arbitrage, it would be necessary to adapt the market rules, considering that this activity does not currently exist in the wholesale electricity market for storage.
From an economic perspective, this would be an opportunity, as off-peak marginal power plants may correspond to technologies that use coal or natural gas as fuel. During these periods, batteries can be charged, as they have the lowest variable production costs, which can reach around US$36/MWh. The behavior of the marginal cost of energy during peak hours typically corresponds to the variable cost of production for fuel-based technologies. In the case of a shortage, it would be an administrative cost of shortage, or a marginal cost cap established by the regulatory authority, which can reach values higher than $ 180/US/MWh. Under these conditions, it is advisable to discharge the batteries.
Conclusions and future works
This study assessed the integration of renewable energy sources—particularly solar and wind—into the Dominican Republic's National Interconnected Electric System (SENI), with a focus on the role of energy storage systems (ESS) at both the utility and distribution levels. The simulation results demonstrate the critical contribution of ESS to system reliability and resilience under high renewable penetration scenarios.
In scenarios without energy storage (Scenario A), the system was exposed to frequent and severe load shedding events, with up to 640 MW of demand disconnected. The inclusion of utility-scale batteries (Scenario B) significantly reduced the frequency of these events. At the same time, Scenario C—featuring both utility- and distribution-level storage—achieved the most favorable results, lowering curtailed demand to 440 MW.
In addition to improving load management, battery energy storage systems (BESS) have been found to impact dynamic system stability positively. Under a three-phase fault applied to a critical transmission line, simulations showed improved damping of rotor angle oscillations in synchronous generators when BESS were present. Furthermore, in frequency response analysis, a sudden disconnection of a 300 MW generator (about 10% of total real-time generation) resulted in a RoCoF of 0.4 Hz/s without storage. When storage systems were activated, they delivered up to 150 MW in less than 500 milliseconds, reducing the RoCoF to 300 mHz/s and helping stabilize the system.
These findings confirm that the integration of ESS not only mitigates demand disconnection during critical events but also improves both angular and frequency stability. This is particularly relevant for Small Island Developing States (SIDS), where the variability of renewable energy poses significant challenges. Achieving the Dominican Republic's goal of 30% renewable energy by 2030 will require coordinated investments in grid flexibility, regulation, and the deployment of both centralized and decentralized storage solutions.
Future work should prioritize optimizing the deployment of hybrid energy storage systems by combining different technologies to enhance grid flexibility and efficiency. It should also include a deeper analysis of how renewable energy variability affects long-term grid stability, alongside economic evaluations that consider regional conditions and specific factors. Additionally, exploring demand-side strategies and potential grid interconnections could further support system reliability. Ultimately, developing effective regulatory and market frameworks that recognize the value of energy storage in both primary energy supply and ancillary services will be crucial for a successful energy transition.
Finally, it is important to acknowledge the study's limitations. The simulations were based on projections for 2027 and employed simplified representations of renewable variability and grid behavior. Future work should incorporate more accurate, real-time data and advanced modeling techniques to enhance the accuracy and precision of the results. Moreover, interregional power exchanges and market transaction dynamics were not included, which could be key to further improving system stability and economic performance. Addressing these limitations will enhance the robustness and practical relevance of future analyses.
Footnotes
Acknowledgements
Fondocyt Grant funded this research No. (FONDOCYT-2023-1-3C1-0547) and (FONDOCYT-2023-1-1C3-0732) in the Dominican Republic. The authors acknowledge the support provided by the Thematic Network 723RT0150 “Red para la integración a gran escala de energías renovables en sistemas eléctricos (RIBIERSE-CYTED)”. To the company, EGEHAINA, for its collaboration in the simulations using the DIgSILENT software, and to the Organismo Coordinador of SENI (OC-SENI) and the National Energy Commission (CNE) for providing information on distributed generation interconnected to the grid and its planning in the medium and long term.
ORCID iDs
Author contributions
Conceptualization, MA-M., E.J., and K.C.; methodology, MA-M., E.J., and K.C.; writing—original draft preparation, MA-M., E.J., and K.C.; writing—review and editing, D.M.-H., R.Q., G.S.-Z., J.D.C.H., M.D.G., L.T.L.V., and A.J.T.C.; supervision, MA-M., E.J.; All authors have read and agreed to the published version of the manuscript.
Funding
The authors disclosed receipt of the following financial support for the research, authorship, and/or publication of this article: This work was supported by the Fondo Nacional de Innovación y Desarrollo Científico–Tecnológico, (grant number 2023-1-1C3-0732, 2023-1-3C1-0547).
Declaration of conflicting interests
The authors declared no potential conflicts of interest with respect to the research, authorship, and/or publication of this article.