
Abstract
Photovoltaic solar technology is economically competitive, modular, and has a low environmental impact. The problem addressed is understanding how the reliability of components in a grid-connected solar photovoltaic (PV) system impacts its performance. This review systematically explores the existing literature on the Performance indicators of solar PV systems. Through a structured search process in Scopus and Web of Science databases, a total of 292 references were found from which 21 were selected, organized into five main topics, and a base article was chosen to update knowledge with a practical and statistical approach. The literature review confirms that reliability, availability, and maintainability (RAM) are directly linked to solar PV system performance. Reliability Engineering techniques were applied to study trends, comparisons, and future system behavior. A RAM analysis was developed for seven practical solar PV system designs, using failure and repair rate data from the literature. The RAM study focused on three subsystems: Balance of System (BOS), photovoltaic modules (PV modules), and inverters. Results showed that while all three subsystems are reliable and available over 1 and 20-year periods, the inverter consistently had the lowest reliability and is therefore the most likely component to fail first. Furthermore, the study identifies gaps and proposes avenues for improvement, recommending a shift toward analysis approaches of Useful life Characterization techniques using Distribution ID and Overview Plot Analysis, multivariable analysis and incorporating the Weibull distribution into the study due to its special characteristics and typical bath tube curve for a predictive approach to decision-making that contributes to photovoltaic system performance.
Introduction
Background and relevance
Solar-photovoltaic (PV) systems have become one of the most significant contributors to global renewable electricity. In 2023, renewable electricity capacity additions reached an estimated 507 GW, a nearly 50% increase from 2022. This rapid growth was largely driven by China's expanding solar PV (+116%) and wind (+66%) markets. Solar PV and wind will account for 96% of renewable power capacity additions over the next five years, primarily due to their lower generation costs and supportive policies (IEA, 2023). To maximize photovoltaic energy production, a reliability, availability, and maintainability (RAM) assessment is advisable for grid-connected solar PV system planning (Chiacchio et al., 2018). RAM analysis helps estimate system production effectiveness, identifying critical components that significantly impact overall system reliability, facilitating the development of well-timed maintenance plans. As such, RAM analysis plays a crucial role in the global development and economic viability of renewable energy systems (Benbow and Broome, 2013).
RAM analysis is recommended for PV system planning and long-term operation but is limited by the lack of robust data and the complexity of these systems. Most existing studies focus only on the reliability of vulnerable subsystems like the inverter, PV module (PVM) (Suresh and Sarkar, 2013), and balance of systems (BOS) (Ahadi et al., 2014), considering only failure information. As a repairable system, the repair interval, including fault detection and part replacement, must be considered in the solar PV system's operation. Few studies evaluate the reliability of the entire system, often using oversimplified assumptions, which can lead to discrepancies between simulated and real results (Sayed et al., 2020).
Reliability Engineering provides tools for reliability modeling assumptions that are established based on conditions and factors that affect performance and quality. They can be multivariate according to geographic location, environmental conditions such as temperature and relative humidity, photochemical reactions, stress, and strain levels of the same components due to their design and manufacturing nature. Mechanism-by-mechanism level comparison is required to build an effective overall reliability model to understand the operation of the PV system in terms of the actual performance and safety of each component. This remains of interest to researchers and stakeholders (manufacturers, suppliers, and stakeholders), requiring a significant amount of additional research.
Problem statement: review and proposal type article
This article proposes a review-type (Sayed et al., 2019) update of the knowledge related to performance indicators in solar PV system for the characterization of its useful life and the prevention of early failures. The need for an update arises from a research project on reliability at the Tec Solar Field during the year 2024.
The study object is a solar PV system is a set of components that convert sunlight into electricity. These systems are primarily composed of solar panels (photovoltaic modules) that capture the sun's energy, an inverter that converts direct current (DC) into alternating current (AC), and other elements such as cables, support structures, and sometimes batteries for energy storage (IEA, 2023).
The question posed by the team of researchers is: What performance indicators are being used in solar PV system that ensure its useful life and prevention of early failures?
And the objective related to it is: The main objective of this review is to comprehensively examine the key performance indicators of solar PV systems over the past decade and systematically analyze their relationship and significance with the reliability of system components.
In Literature review section, the exhaustive literature review process obtained through databases subscribed to the university library is deployed, the formulation of the search criteria and related filters, execution of the search, collection of the resulting information, selection and study of the articles and review meetings with the researchers for the final selection of the base article and related articles with which the updated proposed article will be developed.
The main contributions of this review, in comparison to existing reviews, include:
A timely analysis of the evolution of solar PV system performance and reliability topics, considering recent advancements and challenges through a holistic approach. A broader scope that explores key performance indicators that impact the foundation of criteria and factors related to the operation, monitoring, and maintenance of PV plants for effective real-world management. An outlook of future research scopes in reliability research as a discipline for the improved performance in the management of the operation and maintenance of solar PV systems, aiming to contribute to the establishment of future standards and best practices.
To achieve a comprehensive review of key performance indicators for solar PV systems, a systematic methodology is employed that integrates the definition of topics related to the main topic of performance and reliability for the search, the use of databases subscribed to the TEC Library, the application of search, filtering, and refining algorithm(s), the compilation of article summaries, the analysis of article content, the selection of the base article for review, and the updating and improvement of the main topic.
To address this, systematic literature review tools are incorporated to evaluate the inherent characteristics of the articles’ content. The research publications are from 2010 to 2024 as a representative time window to evaluate the evolution of scholarly production and identify significant trends.
The remaining sections of this work are organized as follows. Literature review section presents the search criteria, including an overview of existing review articles and preselection of potential articles. This section also outlines the literature search strategy and selection process and provides an overview of the evolution of solar PV system performance and reliability topics is implemented to select relevant articles, which concludes with the classification of articles into research themes. Building on this, Methodology for the modeling, measurement, and analysis plan section presents the methodology for the modeling, measurement and analysis plan, Configuration of Solar-PV System section the configuration of the Solar PV system at the level of component details per subsystem and sub-assemblies, Foundation for the development of the Reliability-Availability-Maintainability (RAM) Analysis Section presents the fundamental components & statistical techniques for the RAM Analysis, data processing, reliability modelling, including the criteria, concepts and analysis tools. In addition, the experiment planning and data collection plan for the BOS, PV modules, and inverters subsystems. RAM results and discussions proposes a section of results and discussion. Finally, Conclusions Section provides a concise conclusions that respond to the research question and aim posed, including limitations and future recommendations.
Literature review
Planning the literature review process
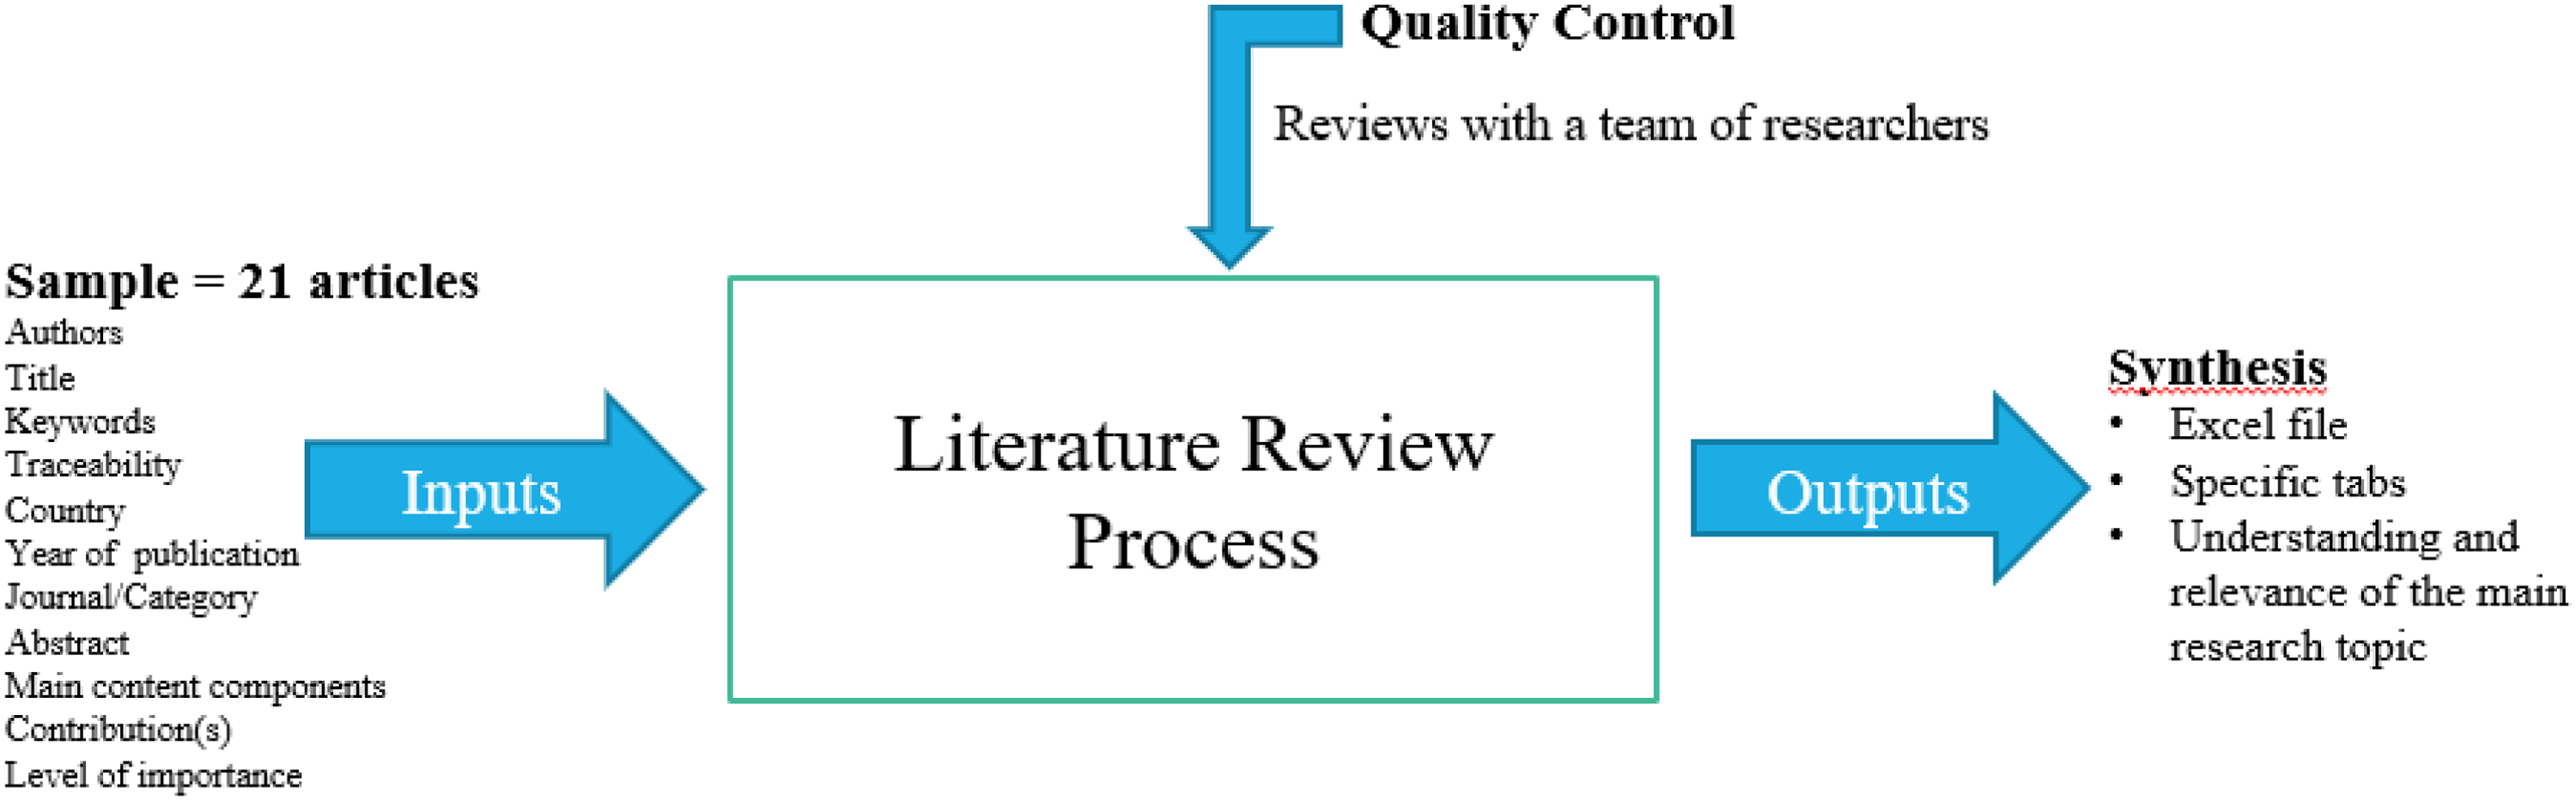
The literature review is carried out through a systematic process involving six main stages to achieve useful and accurate information for creating a proposal to update knowledge based on the criteria and characteristics relevant to the performance and reliability of solar PV systems. Figure 1 presents the planning of the stages to follow in the literature review process.

Literature review process planning diagram.
Figure 1 presents the stages of the literature review process planning using the following criteria:
Development of the literature review process
Define related topics and search strategy
The first step in the literature review process is to define the topics or keywords related to the main research topic for performance and reliability in subscribed databases searches.
The research team established the related topics and keywords shown in Table 1, which specifies four key topics related to the main research topic and the proposed keyword chain building for the search engine's logical mechanism.
Related topics and building the keyword chain for the main research topic.
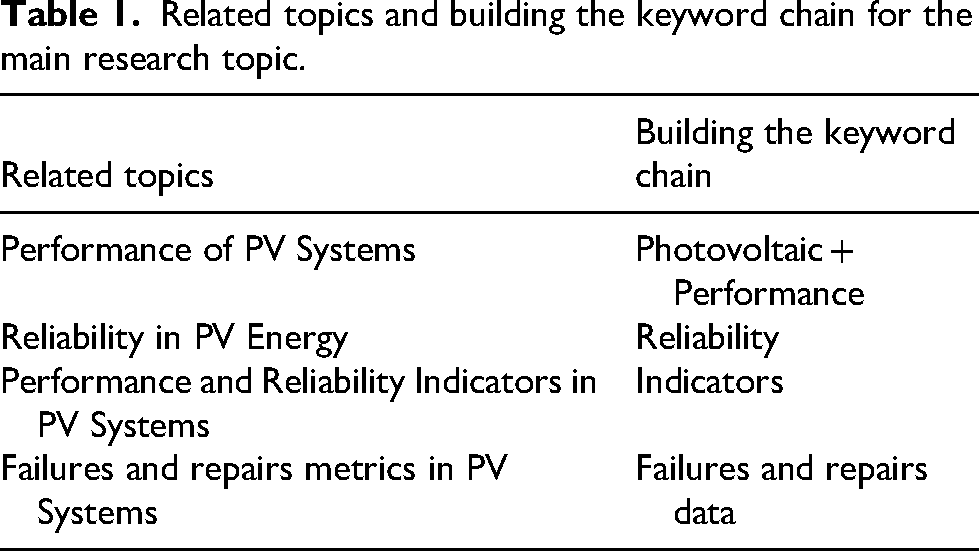
The search strategy was conducted using a preliminary test approach using the keywords defined in Table 1. Subsequently, two literature databases were used for the initial retrieval phase; these selected databases are Scopus and Web of Science. A detailed description of the search strategy used in this study is presented in Table 2. In the search strings, keywords related to “photovoltaic”, “performance”, “reliability” and “indicators” were carefully applied to the title, abstract, and keyword sections of the publications. In addition, the inclusion and exclusion criteria and the time interval of the 2010 to February 2024 (the date of the search). This time range was chosen to reflect the significant technological advancements that have occurred in the solar photovoltaic industry over the past decade.
Overview of search strategy including search string, inclusion and exclusion criteria, and language considerations.

Execution of the search
As discussed in the previous section, the information search uses subscribed databases from the Library System (SIBITEC), which offer a broad range of recognized literature databases such as Scopus and Web of Science. The search strings indicated generated 93397 references in Scopus and 90051 references in Web of Science using the initial search algorithm. Filters or refinements were then applied by time interval, subject area, document type per research article and reference, source type "all," and source type of journal and conference proceeding. Refined results were obtained for 150 references in Scopus and 142 references in Web of Science. Figure 2 displays a flowchart of the four-step search process: initial search, screening, eligibility, and inclusion, and the modification of references based on the systematic filtering and refinement of the references obtained by the search engines.

Search execution process diagram.
Collection and review of the resulting information
Information from the 12 (Scopus) and 9 (Web of Science) references is collected to conduct a comprehensive bibliographic review through systematic tabulation structured by author, title, keywords, abstract, year of publication, country, traceability, category, main content components, contribution(s), and level of importance assigned by the researchers. The research team holds verification meetings based on the tabular evidence from the information collection. Figure 3 summarizes the above.
Literature review process approach diagram.
Synthesis of selected articles
As shown in Figure 3, during the literature review process, specifically in the inclusion step, 21 references were selected for the synthesis. This result is shown in Table 3, which presents a categorization of results by related topic, scope, bibliographic sources, and article file number. In summary, five categorized topics and articles studied in depth are: Reliability in Solar PV Energy (6 articles), Performance and Reliability Indicators (7 articles), Installation conditions (2 articles), Identification of failure modes and effects (3 articles), and Operation and Maintenance (M&O) (3 articles).
Categorization of literature reviews on topics related to analysis of performance indicators for solar photovoltaic (PV) systems.

Selection of the base article for updating
After the research team conducted quality control meetings in the analysis of the contents of Table 3, it was decided to select article file number 10, entitled "Reliability, Availability, and Maintainability Analysis for Grid-Connected Solar Photovoltaic Systems", as the base article selected aligned with the research question and objective. This is because it is the reference that clearly provides the key indicators and failure and repair data that allow describing the performance of the photovoltaic solar system in the three technical disciplines, namely, and expanding its effect and impact; the indicators are reliability, availability, and maintainability. A critical analysis of the literature review carried out shows that the base article from 2019 is correlated with two subsequent publications by the main author in 2020 (Sayed et al., 2020) and (Elshahed et al., 2023), which made it possible to use this sequence of publications to obtain data on failure and repair reasons for estimating the performance-related indicators that are developed in the results and discussion section.
Methodology for the modeling, measurement, and analysis plan
This section presents the proposed methodology for the modeling, preparational stages in data processing and analysis plan, providing a systematic approach to updating and improving the selected article.
Kanban methodology
The methodology used is the Kanban method (Kanban tool, 2025). It consists of a visual system of the work to be improved, identifying what needs to be improved, the priorities to be addressed through criteria and characteristics such as specifications and desired operating conditions, the flow of the study process, and the expected result.
The modeling plan includes:
Need and expectation: the research question and objective are specified. Priorities doing: the fundamental criteria and characteristics for RAM modeling and analysis are indicated from the Useful life Characterization approach. This includes required data, specifications, methods and tools, and operating conditions. Process: description of the process under study at the level of its component components. Expected results: Results of the RAM analysis, identifying which component(s) or subprocess(es) have the lowest performance and therefore require improvement.
Figure 4 shows a Kanban Board presenting the parts of the plan, and it is also important to note that the Kanban Board serves as the roadmap for the development of the following sections.

Kanban Board Diagram for criteria selection of the base article for updating.
Measurement and analysis plan
The measurement and analysis plan proposal consists of three stages, the first is the preparatory stages in data processing includes the processes of data collection in terms of plant specifications and data sets, the second process is tabulation which is the organization of data in an appropriate record, the third process is classification of data by failure, operation, repair and environmental factors such as temperature, irradiance and wind speed. The second stage is the application of statistical methods using statistical techniques and tools specified in the Kanban Board in the previous section and the third stage is the reporting of relevant results, conclusions and recommendations for making decisions based on results to improve the performance of the photovoltaic system.
Figure 5 presents the necessary steps in a data collection and verification process to ensure the veracity, consistency, and security of the RAM Analysis study in Foundation for the development of the Reliability-Availability-Maintainability (RAM) Analysis section.

Measurement and analysis plan diagram.

Macroprocess: grid connect solar pv systems diagram.
Configuration of solar-pv system
Grid-Connected systems
In areas with extensive public grids, the energy storage costs for medium- to large-sized PV systems can be reduced by directly connecting such systems to the electricity grid using compatible inverters. The proposed model to be studied is presented in Figures 6 (macroprocess) and 7 (microprocess) and shows the configuration design of the solar photovoltaic system connected to the grid. The grid connection is integrated for a photovoltaic module, an inverter, the Balance of System (BOS), and the utility grid.
In addition, the BOS is part of the structures on which the modules are mounted and oriented as well as other elements necessary to build a solar PV system. Figure 7 shows the details of the integrating elements by subsystem and subassemblies.

Microprocess: detail of subassemblies by subsystem of Solar PV System.
Detail of subassemblies by subsystem
Figure 7 shows the diagram of the solar PV system to be studied in this article, made up of three main components (subsystems) that are explained below.
Balance of Systems (BOS): are all the subassemblies such as cables and peripheral components that make the connection of the subsystems possible, such as bypass diodes, DC and AC switches, differential, mains power outlet, connectors, and DC combiner (Zini et al., 2011). A photovoltaic array comprises a serial and parallel connection of PV modules. A PV module is composed of individual photovoltaic cells connected to each other (Al-Rawi et al., 1994; Wu et al., 2014; Cristaldi et al., 2015). Inverter: an electrical device that plays a fundamental role in renewable energy systems. Its main function is to convert direct current (DC) electricity, generated by the photovoltaic modules, into alternating current (AC) electricity. Its components are the IGPT module, DC link capacity, microcontroller, AC and DC contactors, cooling fans, and PCB (Alonso et al., 2012; Battistelli et al., 2010).
This paper will focus only on the large-scale grid-connected solar PV system with grid that has low reliability.
Foundation for the development of the reliability-availability-maintainability (RAM) analysis
This section presents the concepts and statistical fundamentals of reliability, availability, and maintainability, which is the approach applied to this review article as an opportunity for improvement when conducting a study, taking into consideration the RAM Analysis of a solar PV system in general.
Reliability-Availability-Maintainability relationship approach
According to Sayed et al., 2019; Zhang et al., 2013 and Hu et al., 2013, RAM analysis focuses on large-scale grid-connected solar PV systems and is carried out using design reliability methods, conceptualization of system configuration, and event and failure analysis. For an adequate development of reliability work, a reliability block diagram (RBD) and fault tree analysis (FTA) must be considered in the system understanding stage. In FTA, the physical layout is interpreted into a logical diagram, whereby each block represents a system component. Each block is described only by the failure rate. The reliability of the overall system is determined using the failure rates of each sub-assembly, and thus, every failure is very important. Commonly, failure rates are assumed constant. More recent work has introduced dynamic FTAs with failure rates described by time-dependent probability density functions (Chiacchio et al., 2018). However, this approach does not rely on actual field values or the best probability density functions of each sub-assembly. It´s important to incorporate the metrics of Mean Time to Repair (MTTR) and Mean Time Between Failures (MTBF) to understand how the useful life cycle of the PV system behaves (Hamdy et al., 1989).
Within the context of the failure data, it is essential to know its probabilistic behavior and treat it that way for RAM estimation (Chiacchio et al., 2018; Sayed et al., 2019; and Wohlgemuth et al., 2006). The required input data are obtained from literature-based failure rates (see Table 5). Data quality is achieved through the proper planning and implementation of measurement and traceability controls.
Data processing
Data quality is a driving factor for the reliability of any statistical estimation or inferential. In reliability, it is necessary to have data on failures, operation, and maintenance, since these three types of data will provide confidence in how the system performs over time. Figure 5 presents the stages of data processing preparation, statistical methods and tools, reporting, and improvement actions required for the proper systematic study of the PV System's performance indicators. However, since this is a review-type paper, the source data is taken from the original paper (Sayed et al., 2019). Using this framework, a thorough mapping of the provenance of the databases used as sources for the datasets presented was carried out, and the results of this article were developed to verify the criteria explained below.
Data collection: the data in this paper were collected from several reliable research papers (Sayed et al., 2019) and (Baschel et al., 2018), the largest amounts of reliable data, failure, and repair rates as the J. Power Sources database (Ahadiet al., 2014). To address this, large amounts of reliability data, including failure and repair rates, were collected from various literature sources, covering different technologies and layouts. Data segmentation per PV Plant type: the largest PV system with a generation capacity of 80 MW was installed in Sarnia, Ontario, Canada, in 2010. Additionally, the European PV Technology Platform Group reports that PV systems are predicted to reach network parity in most of Europe in 2019 (IEA, 2019). Data type: failure and repair rates the median values were calculated. Intervals time: the data were collected over varying scan times. Rational subsets: the subsets were established during different scan times and for each subassembly. Uncertainty: median values were calculated for each sub-assembly to reduce uncertainties, as noted in Table 5. Design of Experiment Scheme: to evaluate RAM results, seven large-scale grid-connected solar PV systems, with power outputs ranging from 100 kW to 2500 kW, were designed. The number of sub-assemblies increased with the system's power output, as listed in Table 6.
Reliability concepts, functions, and metrics
Reliability
In context, the Reliability R(t) of solar PV system components is the probability it will adequately perform its specified purpose for a period of time under specified environmental conditions. The probability of solar PV system components is the function of the configuration, subsystem, or even sub-assemblies and is the proportion of times that the system is expected to occur when the system is conducted repeatedly under identical conditions. Because it is a probability, reliability must always take on a value between 0 and 1.
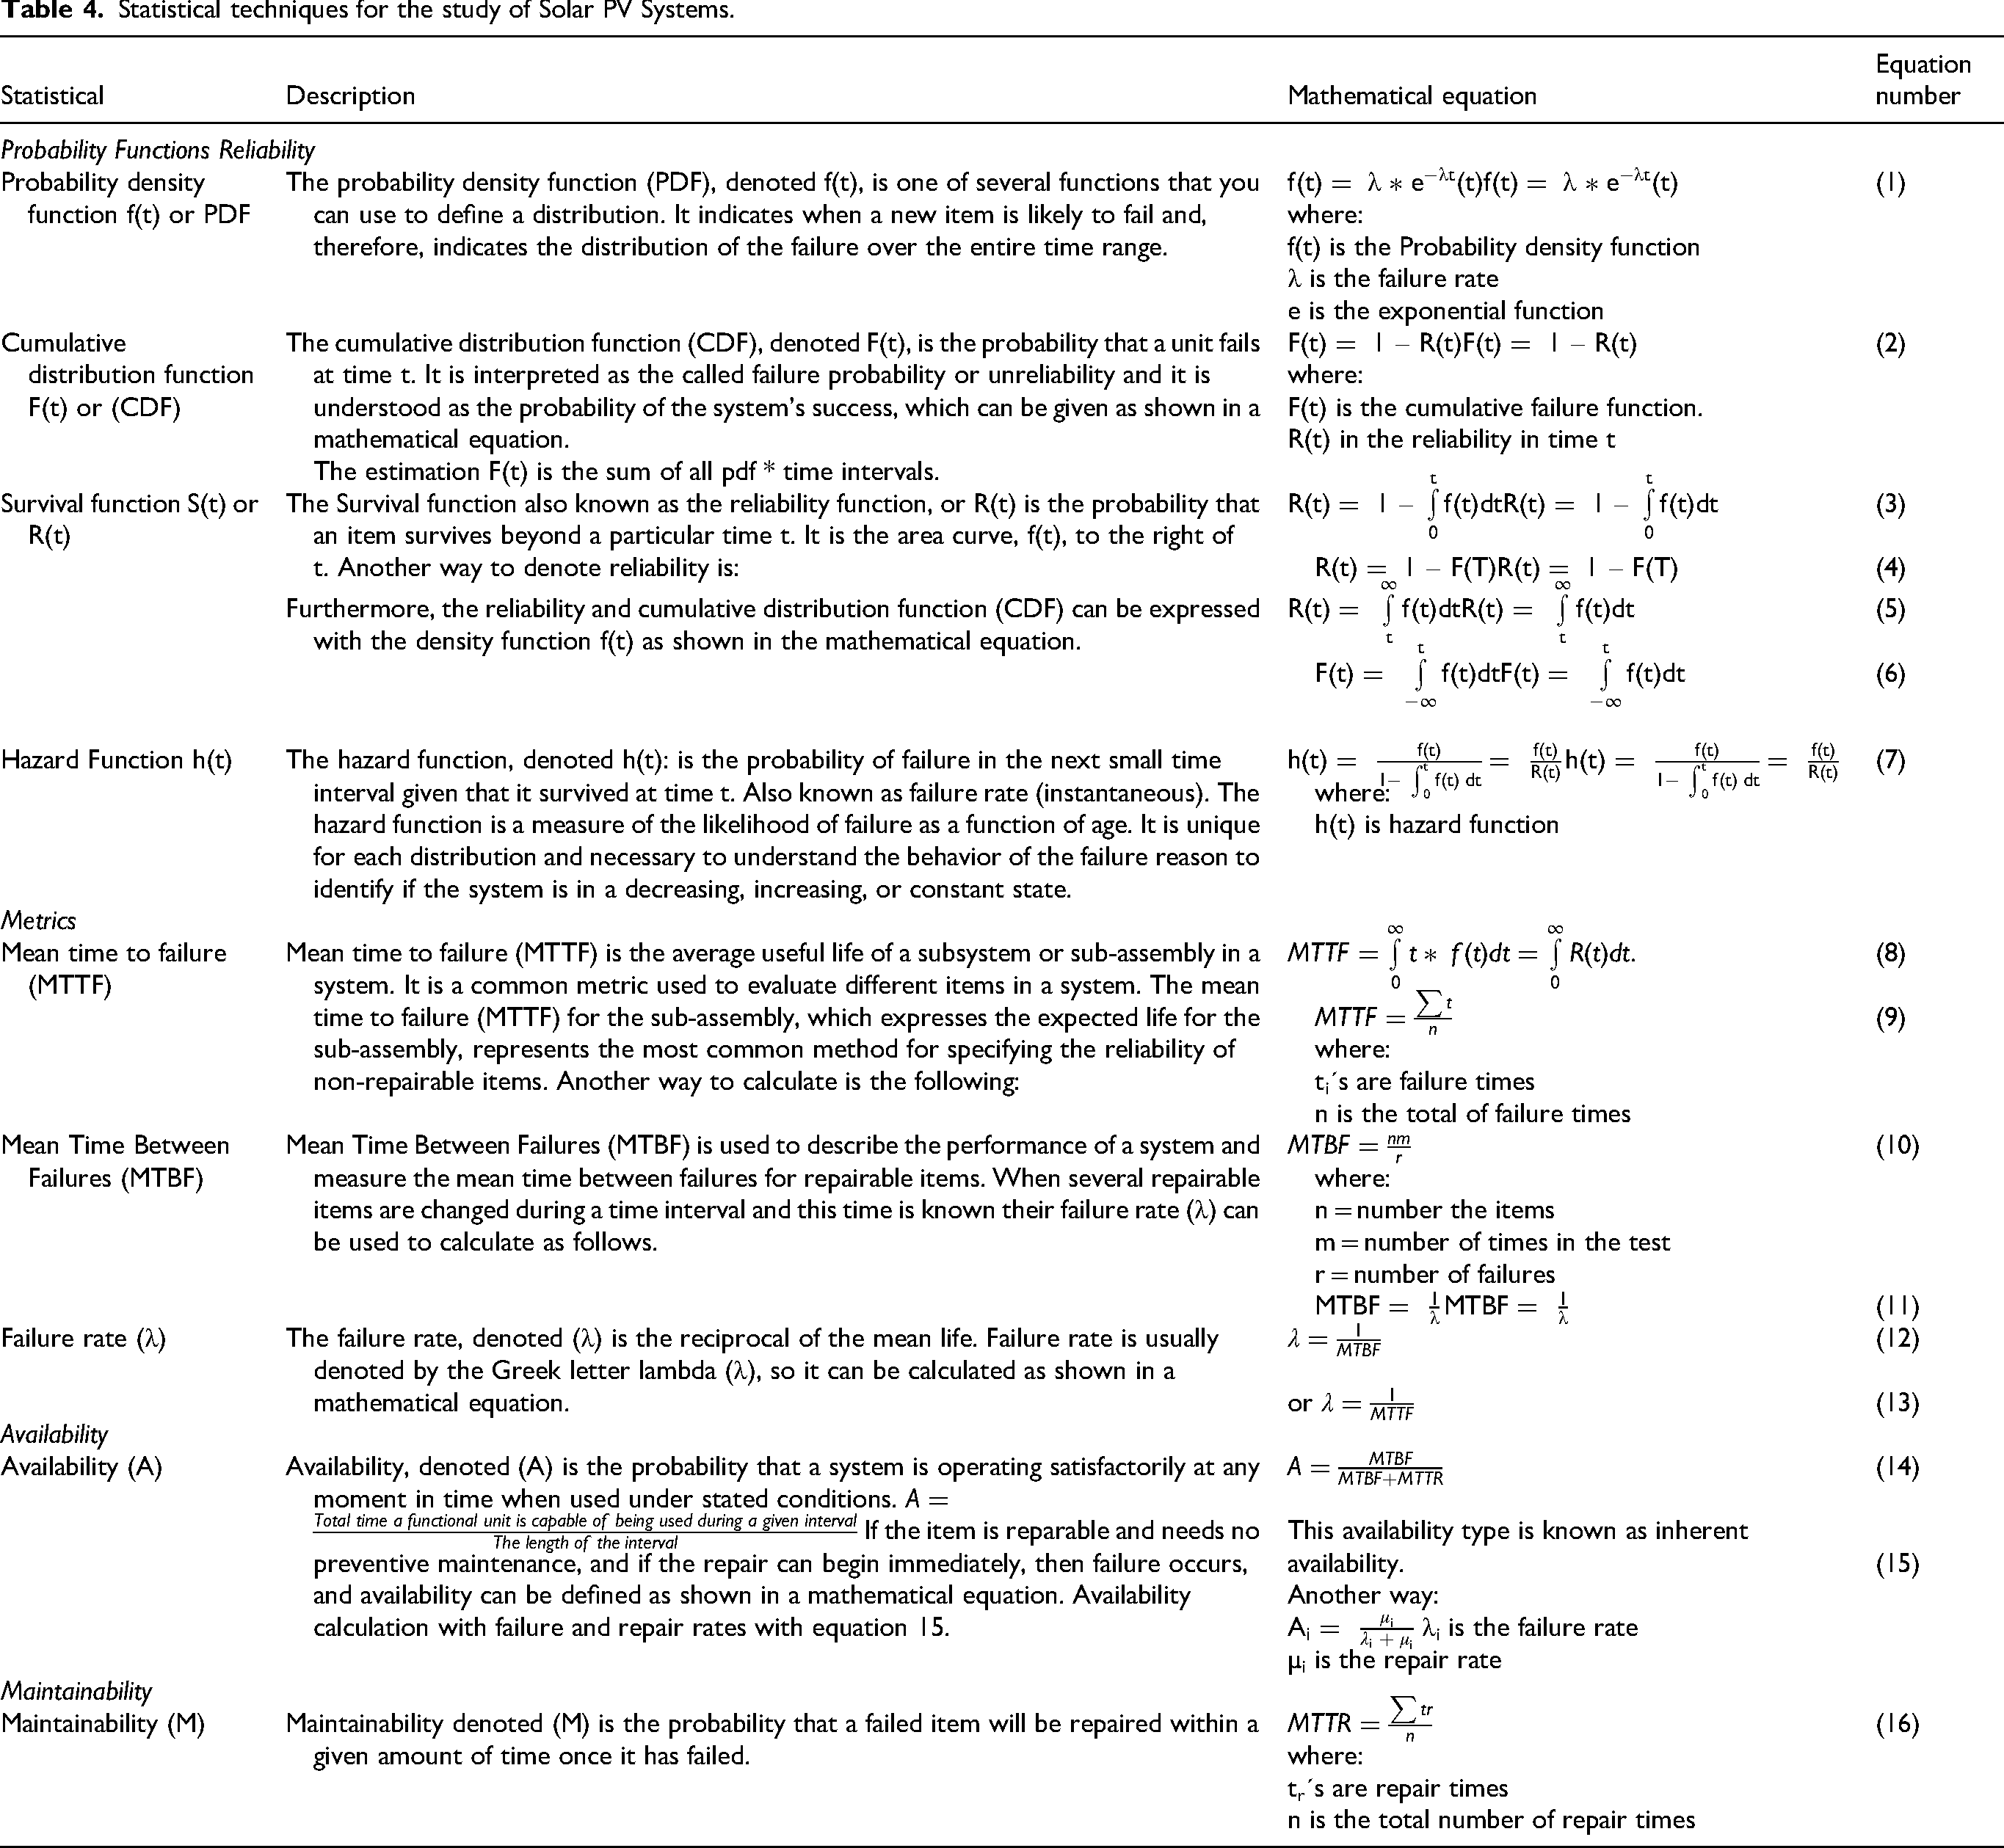
Figure 8 shows a diagram of statistical techniques with the probability functions, metrics, and percentiles in reliability and the metrics related to availability and maintainability. Table 4 presents the reliability, availability, and maintainability statistics applied in this study and the analysis of the results obtained. This table is constructed by the statistic, description, mathematical equation, and equation number.

Fundamental components of RAM analysis diagram.
Statistical techniques for the study of Solar PV Systems.
Availability
Availability is the probability that a system is operating satisfactorily at any moment in time when used under stated conditions. This measure considers an item´s reliability and maintainability. Another way to express this is the proportion of time a system is in a functioning condition (Benbow and Broome, 2013). Table 4 equation 15 shows the mathematical equation that allows its calculation.
Maintainability
Maintainability is the probability that a failed item will be repaired within a given amount of time once it has failed. Thus, maintainability is a function of time. It is necessary to have a confidence level, for example, 95%. In defining maintainability, it is necessary to describe exactly what is included in the maintenance action. The following items are typical: diagnosis time, part procurement times, teardown time, rebuild time, and verification time. To understand the performance of maintainability about of metric the mean time to repair (MTTR) (Benbow and Broome, 2013). Table 4 equation 16 shows the mathematical equation that allows its calculation.
Multivariate control charts
The multivariate control chart is a type of variable control chart that shows how correlated or dependent variables together influence a process or outcome. This strategy is especially useful for understanding interactions. Minitab draws multivariate charts for up to four factors and displays the means for each factor at each of its levels (Minitab Inc, 2024).
Experiment planning and data collection plan
Figure 9 presents the scheme of the experiment proposed at the level of integrating elements by system-subsystem-subassemblies and the test method of 7 power systems in a range of 100 kW to 2500 kW, which we will define as test levels to which the system is subjected to estimate reliability based on its performance and behavior in two periods of 1 and 20 years.

Design of experiment for solar PV system diagram.
Data collection plan
The data collection plan outlines the primary sources for statistical treatment, detailing information based on sub-assembly numbers, failure causes, and repairs for each PV system. Obtaining accurate failure and repair rates is a critical challenge in RAM analysis.
To address this, large amounts of reliability data, including failure and repair rates, were collected from various literature sources, covering different technologies and layouts. The data were collected over varying scan times, and median values were calculated for each sub-assembly to reduce uncertainties, as noted in Table 5. To evaluate RAM results, seven large-scale grid-connected solar PV systems, with power outputs ranging from 100 kW to 2500 kW, were designed. The number of sub-assemblies increased with the system's power output, as listed in Table 6. More details on sub-assemblies and design methods are provided in (Sayed et al., 2019).
Failure and repair rates for various subassemblies of solar-PV systems (Sayed et al., 2019).

Number of subassembly for each PV system (Sayed et al., 2019).

Using the data from Tables 5 and 6, along with the RBD method, the failure and repair rates for each sub-assembly of the seven systems are shown in Tables 7 and 8.
Subsystem failure rate (yr−1). [1].

Subsystem repair rate (yr−1). [1].

Reliability modelling
Reliability modeling is the second stage in RAM analysis. Several reliability methods have been discussed for RAM evaluations, with one of the most effective being the Reliability Block Diagram (RBD) for grid-connected solar PV systems. In RBD, system components are represented by sequential or parallel blocks, linked based on their impact on the system. Each block is defined by the component's failure and repair rates. Figure 10 shows a grid-connected solar-PV system consisting of three subsystems arranged in series, meaning the system functions only when all subsystems are operational.

Simple reliability block diagram (RBD) of grid-connected solar PV system.
The failure rate (λi) and repair rate (µi) of this system, as a whole, can be calculated by Equations (17) and (18).

Sub-assembly and system reliability
The solar PV systems are complex and contain a large number of sub-assemblies that may be connected in series, in parallel or even a combination of series and parallel. When the sub-assemblies are connected in series, the overall system will be interrupted in case of failure of one sub-assembly. On the other hand, all subassemblies must fail in order to interrupt the overall system in the parallel system.
According to equations 19 and 20, which show the Boolean techniques, the reliability performance for a repairable system containing an independent series n subassembly can be calculated by:
For an Exponential distribution, the total sub-assembly reliability becomes:
If the system contains x series units with M parallel subassemblies, as you can see in equation 21, the system reliability can be obtained using:
Overview plot analysis
The Weibull distribution is the most commonly used distribution for analyzing reliability data. It is an extremely flexible distribution that cam model many situations. For the general analysis of the Weibull distribution, its estimation and parameters, the following equations are used.
Beta parameter:
Eta parameter:
Data sources: failure and repair rates for various sub-assemblies of solar-pv systems
This section presents the main data sources for statistical treatment, where the details of the documented information collected are based on the criteria of sub-assembly numbers, failure reasons and repair for each solar PV system. Equations (17) and (18) were used for the calculation respectively.
RAM results and discussions
Probability id distribution
The probability distribution used for data analysis is the Exponential Distribution. Its selection is based on the criterion of the best fit of the data to this probability distribution and the ease of estimating its parameter λ, which guarantees greater accuracy in the results that characterize the system's behavior at the subassembly level during its useful life. The mathematical equation used is (20).
Failure rate analysis
This section presents the failure analysis by subsystem. The unit of measurement analyzed is the failure rate, with the purpose of determining which subsystem presents the greatest magnitude and frequency at the time the failure occurs. The event graph allows visualizing the failure rate in time intervals and the failure frequencies. Figure 11 presents an event graph that compares the behavior of the BOS, PV module, and inverter subsystems. The PV module presents the shortest failure time and frequency, with intervals between 0.02061 and 0.51251 years; this means that it is the component that will take the longest to fail. The BOS is in second place, presenting a failure magnitude and frequency between 0.07812 and 1.07718 years. The inverter presents the widest interval, with failure frequencies spaced between 0.125 and 2.9999 years; therefore, it is the subsystem that will fail the earliest. In conclusion, the inverter will be the component of the overall system that will fail first, this will be reflected in the reliability estimate later.

Event chart of failure rate.
Reliability overall analysis
As shown in Figure 8 and using equations 20 and 21, the overall reliability analysis is based on the estimation of the four functions of the probability density function (PDF), cumulative failure function (CDF), survival function (R(t)), and hazard function (h(t)). Table 9 presents the tabulation of the experiment specified in Figure 9 in terms of power levels conditions (100 kW to 2500 kW) and results by subsystem and overall system of reliability results for the BOS, PV modules, and inverter for 1 and 20 years of comparison periods.
Summary of subsystems and system reliability for the solar PV system about power levels and time condictions (in %).

The power level of 100 kW BOS subsystem has a reliability of 92.48% in the first year, which drops to 20.96% by year 20. Similarly, PV modules show a decline from 97.96% to 66.22%, while the inverter drops from 88.85% to 8.20%. All three subsystems show a decrease in reliability over time, and as the power system's capacity (kW) increases, reliability further decreases. Notably, of the three subsystems, the inverter has the lowest reliability with respect to power levels and time, so the inverter is the subsystem that will fail first the inverter has the lowest reliability and is likely to fail first. Figure 12 (a) shows the behavior of reliability in the first year, with the PV modules subsystem having the highest reliability at 97.96% and the inverter subsystem having the lowest reliability at 88.85%. Over the 20-year period, reliability remains the same for the PV modules and inverter with 66.22% and 8.21%, respectively. Likewise, for the other test systems, reliability decreases as the power level increases. In effect, which shows the 20-year period, shows how reliability decreases more rapidly as the power level of the systems increases from 100 kW to 2500 kW.

Comparison Chart of subsystem and overall reliability by time of 1 and 20 years vs power level conditions (kW) test.
Confirming the above statement, Figure 13 presents a comparative reliability graph (y-axis) that groups the variables by the power level (kW) related to the subsystem (BOS, inverter, PV modules) and this in relation to the 1 and 20-year time periods. It is clearly observed how in year 1 the reliability is higher than the 20-year period. Note that in the 1-year period, the inverter is the limiting subsystem, reflecting lower reliability in the power levels (kW), and this behavior is repeated in the 20-year period, where reliability practically tends to zero. The subsystem that shows the greatest reliability in both time comparison scenarios is the PV modules, so it will be the subsystem that will take the longest to fail. In conclusion, this comparative graphic analysis allows a clear and concise visualization of the reliability performance of the developed experiment.

Comparison reliability performance subsystems of Solar PV Systems for a period of 1 and 20 years.
Total reliability
An important contribution of the analysis is estimating the total reliability of each test system over time, which helps identify practical reliability performance and propose preventive measures to maintain solar PV system operation (Lindig et al., 2024).
The total reliability was estimated using equation (21) and is presented in Table 9. Figure 12 (b) illustrates the total reliability behavior of each test system from 100 kW to 2500 kW. The results from the 1-year and 20-year test periods confirm that reliability decreases as power increases, with 1-year reliability dropping from 80.50% to 1%. For the 20-year period, reliability ranges from 1.13% (at 100 kW) to 0% (at 500 kW), with the inverter reaching 0% reliability, indicating system failure. A preliminary conclusion is that by the end of the 20-year period, the solar PV system will almost certainly have failed, as shown in the dotted line graph of this period time.
Multivariable analysis: A relevant analysis compares subsystems using multivariate analysis, showing how each subsystem behaves relative to power levels (kW), as illustrated in Figure 14. The multivariate chart for 1-year reliability (Figure 14(a)) shows that the inverter subsystem has the lowest performance compared to the BOS and PV Modules, with an interaction average of 40.62%. Figure 14(b) shows in the 20-year period, the inverter again shows the lowest interaction average, with only 1.27% reliability, confirming that the inverter subsystem is the one most likely to fail first. Some studies classify the PV inverter as just another sub-assembly within the BOS (Dhere et al., 2013), while most current research focuses on inverter reliability estimates and improvements (Cristaldi et al., 2017; Fife et al., 2010; Haberlin, 2012; Harb and Balog, 2013; Pregelj et al., 2002).

Multi-variable chart of comparison reliability performance subsystems of Solar PV Systems (a) for a period of one year and (b) for a period of 20 years.
This study, however, separates the BOS and inverter subsystems. The inverter's reliability decreases to 0.7858 after 2 years and 0.2996 after 10 years. The BOS subsystem has a reliability of 0.5942 after 10 years and 0.2098 after 30 years. The MTTF (Mean Time to Failure) for the inverter and BOS are 8.3 and 19.21 years, respectively. The lower MTTF for the inverter is mainly due to its complexity and the electronic components that are more affected by stress factors. As a result, the inverter's lifespan is much shorter than the typical solar PV system's predicted lifetime of 20–25 years.
Availability
Availability is a fundamental characteristic of understanding the operation of a system. Table 10 presents the availability results by subsystem according to the power level (kW) of the test system. Availability is calculated with equation (15), where of BOS, PV modules, and inverter subsystems decreases as the PV power increases; this is better visualized in Figure 15, where the decreasing trend is evident. The above is consistent with the reliability analysis presented in the previous section. Another important aspect is that the inverter subsystem is the one that decreases most rapidly in availability with respect to the other two subsystems.

Availability chart of subsystems vs. power (kW) systems test (in %).
Availability of subsystems vs. Power (kW) Systems Test (in %).

Availability as an integrating variable of performance as a key success indicator of a solar PV system is, according to equation (18), a function of the failure (λi) and repair rates (µi), where this relationship has a linear dependence between the failure and repair reasons that directly affects the condition that the subsystems and the system, in general, are in adequate operating and control conditions at the time “t” and that maintainability management is effective. The maintainability is discussed in greater detail in the following section.
Figure 16 illustrates the relationship between reliability, availability and maintainability according to metrics, state, time, variable and condition.

Relational diagram of RAM vs metrics.
Maintainability
Maintainability is the third indicator in the performance of a system in general (Ma and Thomas, 2011). In our context, together with reliability and availability, they create the perfect trinomial to understand the solar FV system. The challenge of this article is to get the message across about of the relationship between maintainability, reliability, and availability (see Figure 16).
Then, as mentioned in Maintainability section, maintainability is the probability of repair in a specific period of time. Table 8 presents the repair rates of the BOS, PV modules, and inverter subsystems across different test power levels. It shows that repair times remain constant from 100 kW to 2500 kW, helping to predict subsystem behavior over time and improve maintenance management. Figure 17 illustrates subsystem behavior, with PV modules having the lowest repair rate (11.6964 years) and BOS the highest (64.532 years), while the inverter repair rate is 12.6547 years, just 1 year longer than PV modules.

Chart of subsystem´s repair rate of Solar FV System.

Comparison chart of MTBF subsytem vs. power level systems (kW).
MTBF subsystem vs. Power level Systems (yr-1).

Consequently, according to Figure 18 the behavior of the mean time between failure (MTBF), it shows that the inverter is the subsystem with the lowest MTBF and that as the power level (kW) increases, this decreases, therefore in the maintenance program the inverter will have a higher frequency of preventive maintenance with respect to the other subsystems.
Distributions id and overview plot analysis
Distribution Identification (ID)
As mentioned in Probability ID Distribution section, the identification of probability distribution is relevant for the quality of useful life characterization of the solar PV system. The analysis of probability distribution models is essential for correctly selecting the probability distribution that best represents the behavior of the failure data. The choice criteria are based on the best fit value to the data. This study uses the Anderson Darling (AD) statistic as the goodness-of-fit parameter. The second criteria are the ease of estimating the parameters according to the probability distribution that characterizes the physical principle of failures, which guarantees greater certainty in the results that characterize the useful life of the solar PV system. This section presents the analysis of the identification of probability distributions, as established in Figure 8, and uses the Minitab data analysis software in the Reliability/Survival module to present an example of development under this analytical approach.
Table 12 shows the data taken from (Suresh, 2013) where there is a comparison test of two PV modules called “set 1 and set 2”, each sample has 10 failure data in survival hours until failure.
Failure data from test sample PV module sets (Suresh, 2013).

The statistical treatment of the data is shown in Table 13 and Figure 19, the results of the Minitab output were tabulated based on the 11 most known probability distributions in reliability that Minitab uses for analysis.

Probability plot of probability distributions goodness of fit.
Probability distributions goodness of fit.

Symbology:
☑: Acceptable
⮾: Not acceptable
As can be seen in Table 13, of the 11 distributions studied for the set 1 and 2, there are four probability distributions: Weibull, Loglogistic, Lower Extreme Value and Logistic, which present lower adjustment values, and the distributions with the lowest adjustment value (AD = 1359) are the Logistic distribution and 3-Parameter Loglogistic distribution. However, this distribution is not the best choice in terms of the ease of estimating parameters and their suitability. In the case of the Weibull (AD = 1455) and Smallest Extreme Value (AD = 1471) distributions, they have the three selection criteria and with the magnitudes of the Anderson Darling adjustment values, we can ensure that they are adequate, and their parameters are easy to estimate.
Now, the next step is to carefully review the graphical behavior of the adjustment, then Figure 19 shows graphically that the distributions that do not have a good fit are Exponential, 3-Parameter Weibull, 3-Parameter Lognormal, 3-Parameter Exponential, and 3-Parameter Loglogistic, so these 5 probability distributions are discarded for selection.
In summary, the results of the fit are presented based on the Anderson Darling statistic and an analysis of three criteria is developed for the selection of the best probability distribution that represents the failure data, the first is the criteria of the smallest fit value, the second is the ease of estimation of the parameters of the probability distribution and three if the distribution is adequate according to the physical principle that represents the variable under study.
However, it is decided to choose the Weibull distribution for its special characteristics, such as being an extremely flexible distribution for reliability studies (Picado, 2017) and because its shape (β) and scale (η) parameters are represented in the bathtub curve graph, an important diagram to understand the behavior of a variable during its useful life and the behavior of how failures occur. Therefore, it is decided to choose the Weibull distribution for the overview plot analyses.
Overview plot analyses
Now, once the Weibull distribution is selected to perform the general analysis of reliability in the four basic functions as shown in Figure 8, they are the Probability Density Function (pdf), Cumulative Failure Function (CDF), Reliability or Survival (R(t)) and Hazard Function (h(t)). Use the appropriate Weibull distribution to understand relevant aspects in a behavior such as PV modules, since this Weibull is a widely used distribution in reliability because it is an extremely flexible distribution and with an estimate of its Beta parameter (β) it is possible to know and interpret in which phase of the bathtub graph the study item is located and how the failures behave. In this case, using the equation (22), a beta value is obtained as in Figure 20 and indicates that both PV modules set 1 and 2 are in stage 3 of aging and failures occur very quickly as the Beta (β) parameter is of the order of 16,30 and 12,21 respectively.

Reliability overview plot analyses for PV modules sets 1 y 2.
Figure 20 presents the results of these four probability functions that determine the useful life characterization of the PV modules. The PDF graph shows how the failure data of both groups set 1 and 2 behave, where both have similar behaviors, but group set 1 has a higher bell curve than set 2, the bell curve behavior with deeper tails on the left is typical of the behavior of a Weibull distribution. The Weibull graph represents the accumulated failures, where the PV module set 1 tends to have a greater number of failures and take longer, that is, the time later with respect to set 2. In the Survival Function graph, the behavior of set 1 and set 2 are very similar, with set 2 having a slightly faster downward curve compared to set 1. Hazard Function graph shows that the failure rates for set 1 and set 2 tend to be constant up to approximately 220 000 h and then increase in both, with set 1 having the greatest tendency.
The general graph presents a statistics table (lower left corner), where it shows that the Beta (β) values for set 1 and set 2 are 16,3015 and 12,3197 respectively, which means that in both cases the failures are located in the aging phase and the frequency of occurrence of failures originates quickly, that is, it increases as time goes by. This can be seen in Figure 21 which depicts the event in the bathtub tub curve.

Typical bath tube curve.
Conclusions
This systematic review explores the current literature on key indicators related to the performance and reliability of solar PV systems, due to an interest in knowing how to evaluate from a systematic and statistical approach that supports the execution of best practices in the operation and control, ensuring the best use of resources and the useful life of the system in general.
The article identifies reliability, availability, and maintainability as the key indicators of solar PV system performance. These indicators helped define the article's focus, scope, and contributions. Compared to existing reviews, this work updates the discussion on solar PV performance and reliability, expands the analysis of key performance factors for real-world operation and maintenance, and provides guidance for future research aimed at setting new standards and best practices.
The literature review followed a 5-stage systematic process, creating search keywords and a database search string covering the past 10 years. From this, 21 references were selected and grouped into five topics: Reliability in Solar PV (6), Performance and Reliability Indicators (7), Installation Conditions (2), Failure Modes and Effects (3), and Operation and Maintenance (3). The 2019 article "Reliability, Availability, and Maintainability Analysis for Grid-Connected Solar PV Systems" was chosen as the main reference based on the research question and objective.
Using the Kanban methodology and a measurement and analysis plan, the study developed the modeling, evaluation, and analysis of reliability, availability, and maintainability indicators, offering both theoretical and practical guidance for best practices. The article studies a grid-connected solar PV system, describing two configuration levels: the macroprocess level, with three main subsystems (PV module, inverter, and BOS, plus the utility grid), and the microprocess level, detailing each subsystem's components for better understanding and clarity.
The literature review synthesis helped establish the connection between reliability, availability, and maintainability for developing the RAM Analysis shown in Figure 8. Using proper methods, techniques, and statistical tools (Table 4), following Reliability Engineering standards and international guidelines like those from the IEA, this approach offers an innovative way to integrate these three indicators and understand their impact on solar PV system performance. A gap was found in the data processing stage, highlighting the need for direct measurement of failure, repair, and operation data. This would improve data collection, organization, and segmentation by plant specifications, time intervals, subgroups, and uncertainty, rather than relying on failure and repair data from various research articles.
The RAM Analysis, using failure (λ) and repair (µ) rates with an Exponential distribution, found:
The inverter subsystem has the widest failure rate range (0.125–2.9999 years) and fails earliest. Reliability decreases over time and with higher power levels (kW). For instance, inverter reliability drops from 88.85% at 1 year to 8.20% at 20 years (100 kW). The PV module is the most reliable, followed by BOS and then the inverter. Multivariate analysis confirms the inverter consistently has the lowest performance, with reliability dropping sharply from year 1 to year 20. Availability testing showed PV modules and BOS maintain high availability (>95%), while the inverter drops significantly (99.02% to 80.83%). Maintainability analysis shows consistent repair time trends across subsystems. Mean Time Between Failures (MTBF) is lowest for the inverter and decreases as power increases, requiring more frequent maintenance. MTBF is key for planning maintenance actions. A RAM vs. Metrics diagram helps visualize the relationship between reliability indicators and factors like status, time, variables, and conditions for better decision-making.
A key contribution of the paper is a practical example of Distribution ID and Overview Plot Analysis. It shows how to use failure data from two PV module sets to select the best probability distribution based on the Anderson-Darling goodness-of-fit test and ease of parameter estimation. This improves the accuracy of important statistical estimates. The Weibull distribution was chosen because of its flexibility for reliability studies and its connection to the bathtub curve, which illustrates failure behavior over a product's lifetime. The Overview Plot Analysis is a new graphical tool that visualizes four functions: the Probability Density Function (pdf), Cumulative Failure Function (CDF), Reliability (R(t)), and Hazard Function (h(t)). This tool should be used in future studies. Another important future recommendation is to apply the RAM Analysis scheme (Figure 8) to properly estimate reliability, availability, and maintainability, ensuring strong and reliable statistical results for decision-making and system improvements.
Footnotes
Abbreviations
Acknowledgments
All authors for supervising and approving the paper for publication. This article is part of a research strengthening activity project on Reliability in Solar PV Systems, CF#1351030.
Funding
The authors received no financial support for the research, authorship, and/or publication of this article.
Declaration of conflicting interests
The authors declared no potential conflicts of interest with respect to the research, authorship, and/or publication of this article.