
Abstract
In this work, the factors leading to string outages are examined, and an enhanced method for detecting faults at the substring level is presented. Utilizing GPT4-o to analyze O&M reports of 5089 photovoltaic plants, we classified outages according to the affected components and the underlying origin, identifying the most frequent string fault causes. An approach employing CUSUM Charts is introduced to identify substring outages within PV systems effectively. The methodology utilizes fundamental field data that is commonly available in practice. A filtering approach, combined with the use of CUSUM control charts, minimizes false positives, ensuring that only consistent underperformance is flagged as an outage. The methodology returns far fewer false positives and more stable error intervals for substring outages than a former monitoring approach. Overall, the study demonstrates a significant improvement in detecting substring outages. The advanced methodology enables more effective O&M for PV plants, where substring outages are reliably identified after a short detection time.
Introduction
Identifying outages of PV strings is essential for Operation and Maintenance (O&M) within PV plants. An O&M Manager must be automatically informed about revenue losses, enabling timely measures such as plant repairs. For significant revenue losses, such as the complete outage of large inverters, the O&M Manager should be notified immediately for prompt assessment. For smaller revenue impacts, like underperforming individual PV strings, delayed communication to the O&M Manager is acceptable if it improves the fault detection algorithm’s accuracy.
In this work, a study on the factors leading to string outages and a commercially viable method for detecting string failures is presented. The methodology relies on inverter data, thereby eliminating the need for additional hardware or sensors. It enables the detection of individual string outages for plants with multiple strings connected and monitored in parallel.
This work is an extended version of the publication Reliable and Commercially Viable Detection of String Outages in Photovoltaic Plants presented at the 2024 International Conference on Renewable Energies and Smart Technologies (Schönau et al., 2024).
Causes of string outages
String outages are a common type of failure within a plant, which were reported frequently by O&M Managers collaborating with smartblue AG. Using GPT4-o by OpenAI (OpenAI Platform, nd; Hello GPT-4o, 2024; Vaswani et al., 2023), these reports were analyzed to create a study of the causes of string outages.
5089 medium to large-scale ground-mounted and rooftop PV plants were analyzed. The distribution of construction dates in the dataset ranges from April 1999 to January 2025. Approximately 25 % of the constructions occurred before October 2013, and 75 % before September 2020.
The PV plants should represent the typical distribution of technologies used in the last 10 years in Germany: Most plants are traditional PV-plants with Si modules. Thin-Film modules were installed in less than 0.3 %, and tracker systems were installed in 3 % of the plants.
Using GPT4-o for the classification of string outages
As a first step, O&M reports were anonymized and then filtered using keyword identification of the word string, resulting in 9375 comments. Most of these comments were filtered out by GPT4-o, as they referred not to faults but to problems like temporary power losses, such as shading and snow or improper installations. The aimed result was a statistic about the distribution of actual string outages occurring in the operation of PV plants. Inspired by Sepúlveda-Oviedo et al. (2023), the residual comments were classified by the component where the fault occurs and the origin of the fault.
Component where the fault occurs
Fuse MC Connector Inverter Connection Inverter Cable Module Bypass Diodes Other
Origin of the fault
Weather events Animals Degradation / Aging Human Errors Theft Other
These categories were created after manual data inspection. To allow the result of additional categories by the classification of GPT4-o, the category Other was added as a class that the model may return. In addition to that, the model was configured to return the animal responsible for the fault. The full prompt used for the classification is in the Appendix. The model was allowed to return multiple components and origins.
Many asset managers’ entries only speculated about the component and origin; these comments were filtered out, as were comments with only vague components, such as short circuits.
Benchmarking the classification of GPT4-o
A single prompt was used for both filtering and classifying the individual comments. To benchmark the classification, the two core tasks, filtering (identifying valid string fault entries) and classification (attributing fault origins and components), were evaluated individually.
The filtering capability of GPT4-o was evaluated by manually labeling the comment as true if it contained valid and specific information about a string fault, including a clear component or fault origin, and as false if it contained no relevant fault or only vague, unspecific, or unrelated information (e.g., mentions of weather or shading effects without evidence of hardware failure).
Of 9375 initial comments, 7031 were filtered out as irrelevant by GPT4-o. Table 1 presents the confusion matrix of the filter’s performance on the manually labeled subset of 469 random comments:
Confusion matrix for GPT4-o filtering.

The filter achieved a high overall accuracy (94 %). Inspection of misclassified entries revealed that ambiguous or speculative comments were most prone to filtering errors. Typical examples of ambiguous comments are phrases such as weather may cause deviations between strings or probably a sheep again. These comments were often attributed to the speculated error cause when they should have been filtered out because of their speculative nature, as specified in the prompt.
The filtered subset with valid fault components or fault origins was classified by GPT4-o according to the given categories by the prompt. The subsets were manually reviewed for 10 % of the comments, respectively. Tables 2 and 3 display the confusion matrices for benchmarking the classification tasks. The component classification was very accurate, with only 9 misclassifications of 177 comments, yielding a weighted average F1 score of 98 %. The classification of the origin was less accurate, with 9 misclassifications out of 101 comments; yielding a weighted average F1 score of 95 %.
Confusion matrices for GPT4-o component classification.

Confusion matrices for GPT4-o origin classification.

Most misclassifications arose from flawed model assumptions and from the ambiguity of some reports. The model wrongly tagged two unspecific theft-related comments as the theft of cables. Compared to manual annotation, GPT4-o more often designated human error as the underlying cause of string outages. Among others, the ambiguous comment I suspect that string 4.3 has more modules attached than intended, was attributed to a human error by GPT4-o (reasoning, the comment suggests a possible human error in the installation), and was not attributed to any origin by the manual labeling.
Overall, the results of the component and origin classification using GPT4-o demonstrate a high accuracy. It might have been improved by separating the filtering and classification tasks into separate prompts. In practice, we observed that increasing prompt length and complexity to cover multiple tasks (stretching the model’s context window) reduced the overall quality of the outputs. Therefore, a more structured prompting strategy that isolates filtering and classification could potentially improve the classification further. In addition, domain-specific fine-tuning of the model could be beneficial but requires labor-intensive data annotation. But even without fine-tuning, the model can be used for accurate text data mining in the domain of photovoltaic O&M.
Component and origin of string outages reported to smartblue
The classification resulted in 1944 comments with a component reported and 1059 comments where the origin was reported.
Tables 4 and 5 display the result of the classification, which is visualized in Figure 1.
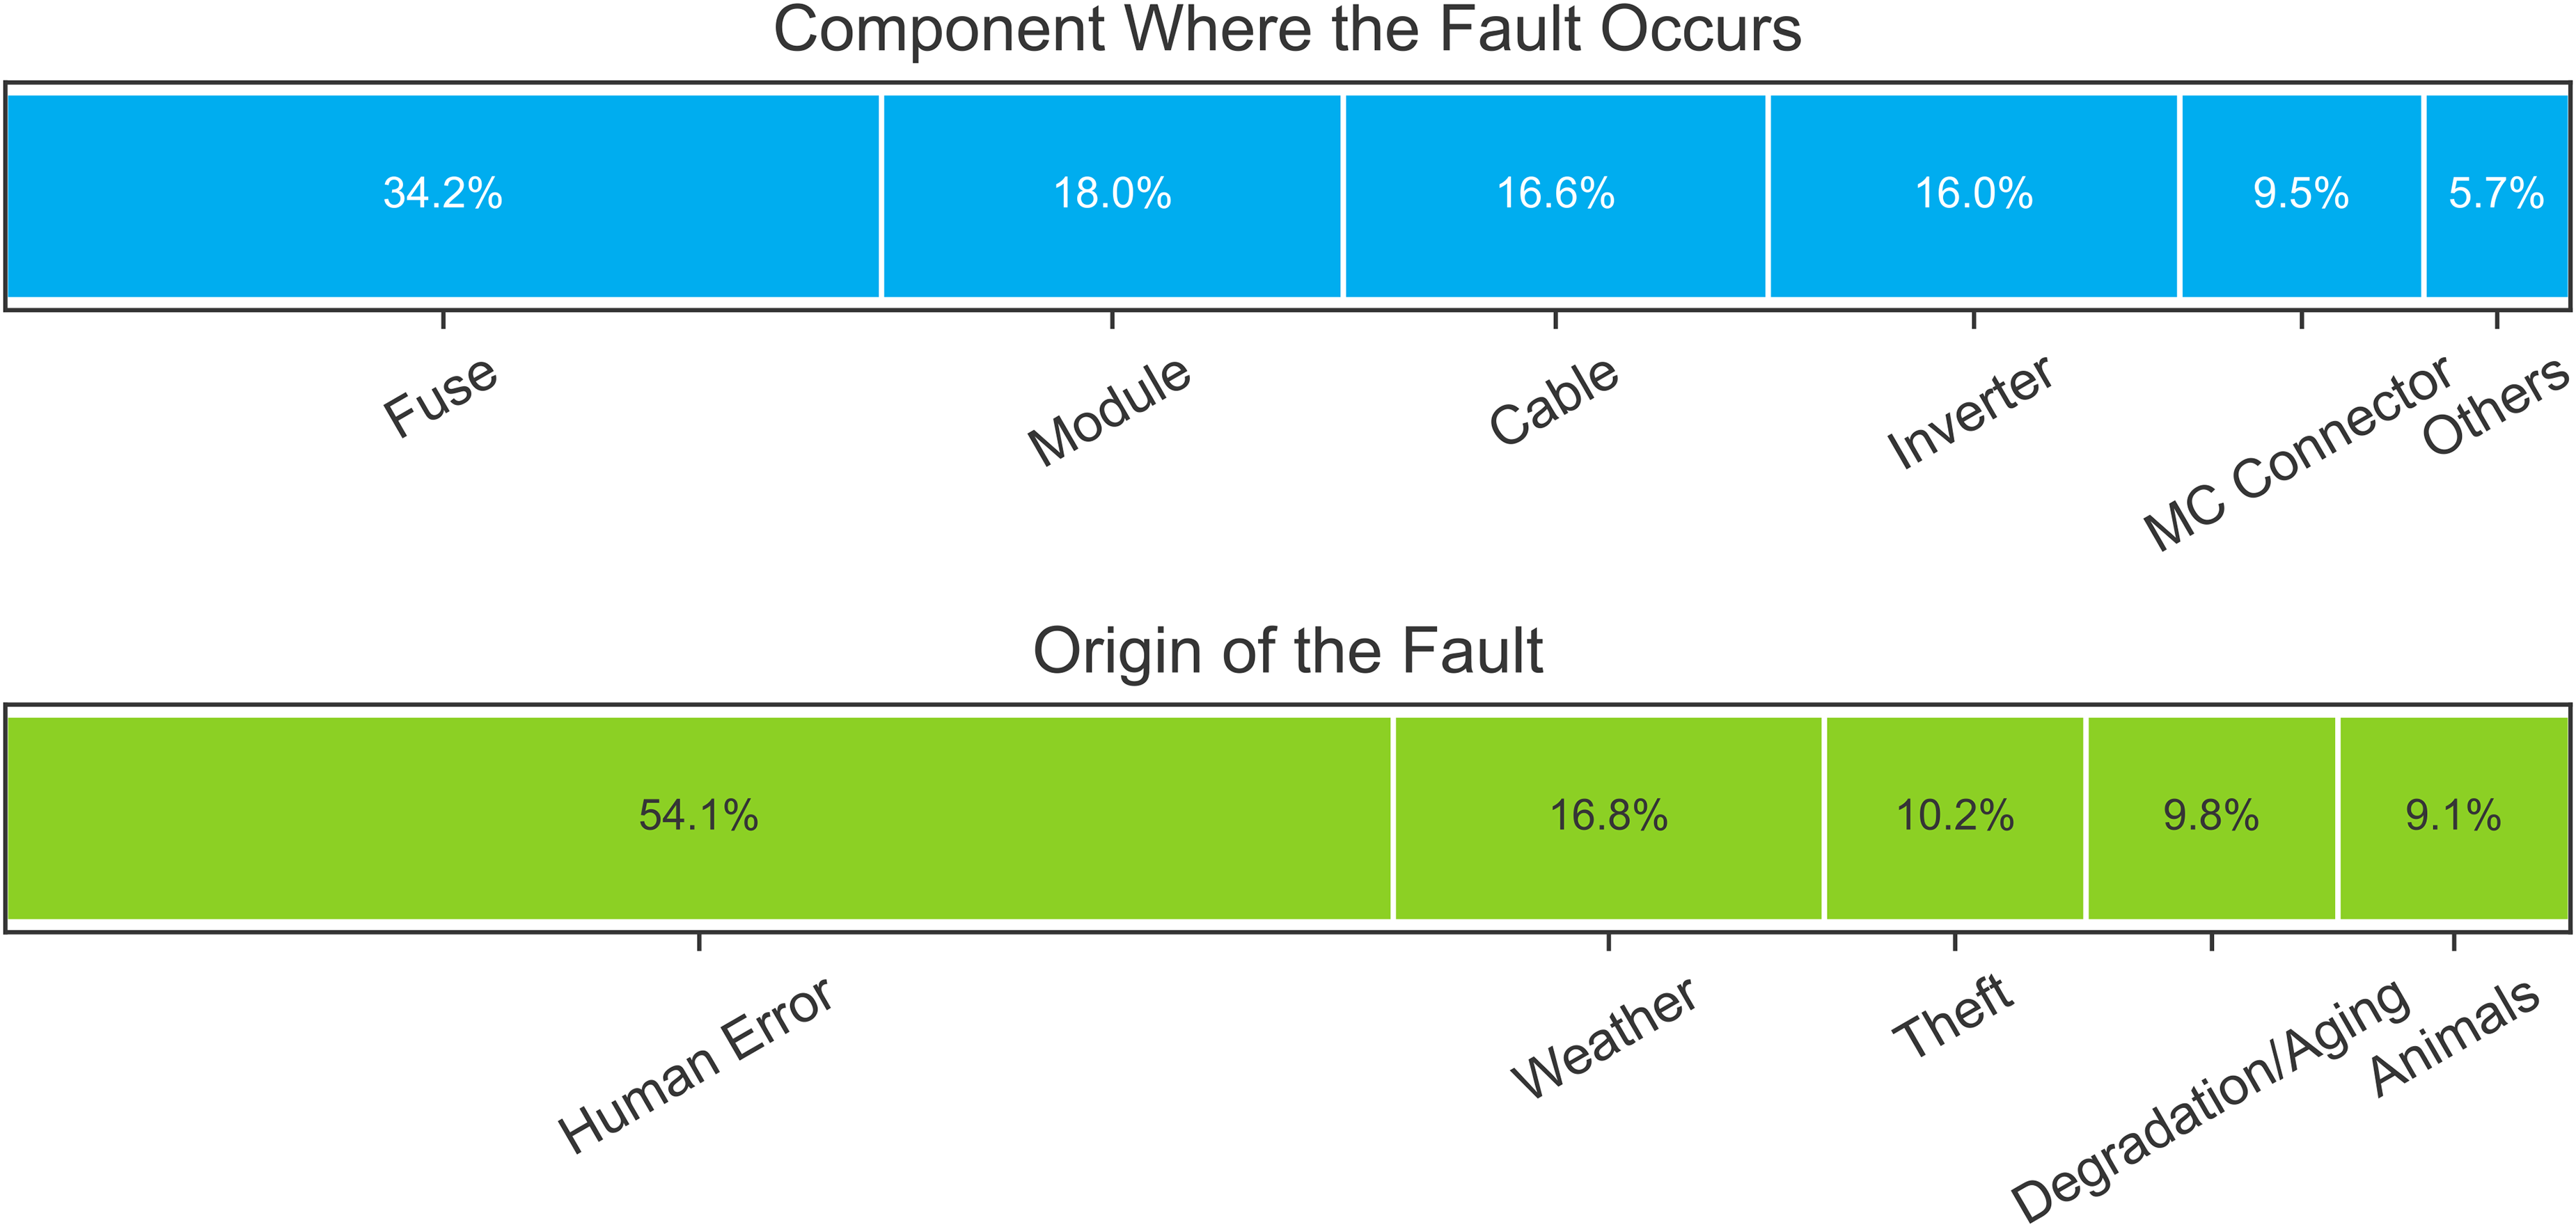
Component and origin of reported string outages classified using GPT4-o. 1944 components and 1059 origins were reported.
Component where the fault Occurs.

Origin of the Fault.

The most common failure type is associated with fuses, which account for 34 % of all issues, followed by module failures at 18 %, and cable issues at 17 %. Inverter problems also represent a significant fraction, contributing to 16 % of the failures. The data highlights the criticality of maintaining robust connections and component quality, as evidenced by the 10 % failure rate attributed to MC connectors and another 4 % to inverter connections. Bypass diodes and other components contribute to less significant percentages, 1 % each. Among the components classified as other by GPT-4o, some comments did not strictly fit any predefined category, for example, unspecific motherboard issues that did not reference the photovoltaic system component.
Human error was identified as the cause in 54 % of cases where an origin was specified, underscoring the need for enhanced training, clearer operational protocols, and possibly automated verification methods to reduce installation and maintenance mistakes. Weather-related issues and theft each account for 17 % and 10 %, respectively. Degradation or aging and animal activity also contribute to the failure rates, each by 10 % and 9 %.
Sheep grazing on PV plants is common in Germany, reflected by 90% of animal-related outages being due to sheep, while martens, cattle, and rodents accounted for just 9 reports.
Table 6 displays the distribution of comments that stated both the component affected and the origin of the faults. While these comments are relatively scarce, they offer critical insights into the relationship between component malfunctions and their underlying causes. The distribution in Table 6 differs from the result displayed in Figure 1 because the subset of comments indicating both component and origin differs from the raw subset, with components such as fuses being very common, but seldom indicating the origin of the fuse outage.
Relationship between origin and component of the Fault.

Human errors often arise when connecting strings and modules. Animal interference often results in cable faults, which underscores the need for custom protective strategies for agrivoltaic installations.
Discussion of the outage study
The findings of this study should be approached with caution and do not replace the need for a more rigorous and statistically robust investigation into PV plant outages. The method involved analyzing comments from asset managers preselected using the keyword ’string.’ This approach may have inadvertently introduced biases reflected in the disparate error distributions shown between Tables 4 to 6.
Specifically, asset managers’ documentation (meant initially for asset management rather than systematic scientific analysis) may have selectively emphasized easily identifiable faults, potentially overlooking subtle yet significant outage causes. For instance, human errors might be more frequently identified and thus documented clearly compared to complex issues like overvoltage caused by thunderstorms.
Nevertheless, the amount of data that could be accurately analyzed by GPT4-o does hold relevant information about the most common problems that have been reported at the string level to smartblue AG. Using GPT4-o replaced an elaborate classification process with human effort or ”conventional” text data mining methods (Salloum et al., 2018). Large Language Models enable novel workflows that were previously difficult to implement.
The resulting dataset, with origin and component attributed to specific outages of specific devices in time, can serve as a basis for supervised learning methodologies in the future.
Detection of string outages
For strings that are monitored individually, string outages are easy to detect, with the measured power dropping completely. However, for plants with multiple strings connected and monitored in parallel, these failures are harder to detect since for a group of
To detect these substring failures, a modified version of Skomedal et al. (2021) algorithm was implemented, which compares the power output of strings at the same site to identify underperforming devices.
The proposed algorithm is not suitable for the detection of soiling. Soiling is often hard to differentiate from aging (Nygard et al., 2023) and is characterized by different patterns of power losses than erroneous strings: Soiling happens typically slower than a string outage. It also tends to affect many strings simultaneously, while string outages commonly occur spontaneously.
Performance indicator
Figure 2 shows the top of the device tree of a typical medium-sized PV plant. Such a plant may have multiple power inverters, each equipped with several Maximum Power Point (MPP) trackers. Most plants have strings or groups of strings connected with Generator Junction Boxes (GJB) that are monitored individually. In this example, there are two strings connected with GJBs on the lowest level.

Exemplary device tree displaying the typical structure of a medium-sized PV plant.
The substring outage detection operates at the lowest level of every plant in this study, where the current and sometimes voltage are measured. The more strings are connected to the generator junction box (or the MPP), the worse the sensibility of the string outage detection.
The median specific power of a group of strings is used as the reference value for the fault detection. This value is prudent for a larger amount of compared strings, where most of the strings perform well. For plants with many faults or only small groups of strings, higher percentiles, up to the maximum, may be used instead of the median of the specific power as a reference.
Thus, the algorithm uses the relative difference of the specific power 
The variables are defined with tensors, where
If only the current of a string over time 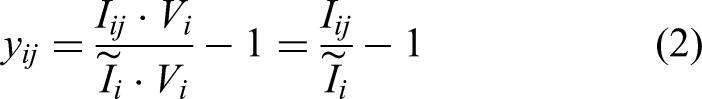
Using strings of the same PV plant as a reference is a reliable and easy way to account for many systematic environmental factors.
Properties of the performance indicator
Using the relative power of a string compared to the mean power output of a PV field clears many environmental factors, including weather conditions, aging, and soiling, which mostly affect all devices of a PV plant simultaneously in a similar manner and which would be difficult to model precisely.
Without comparing strings to each other, one would have to model the power output of a string based on the given environmental data, which is difficult to do with high accuracy in practice, even at ideal conditions.
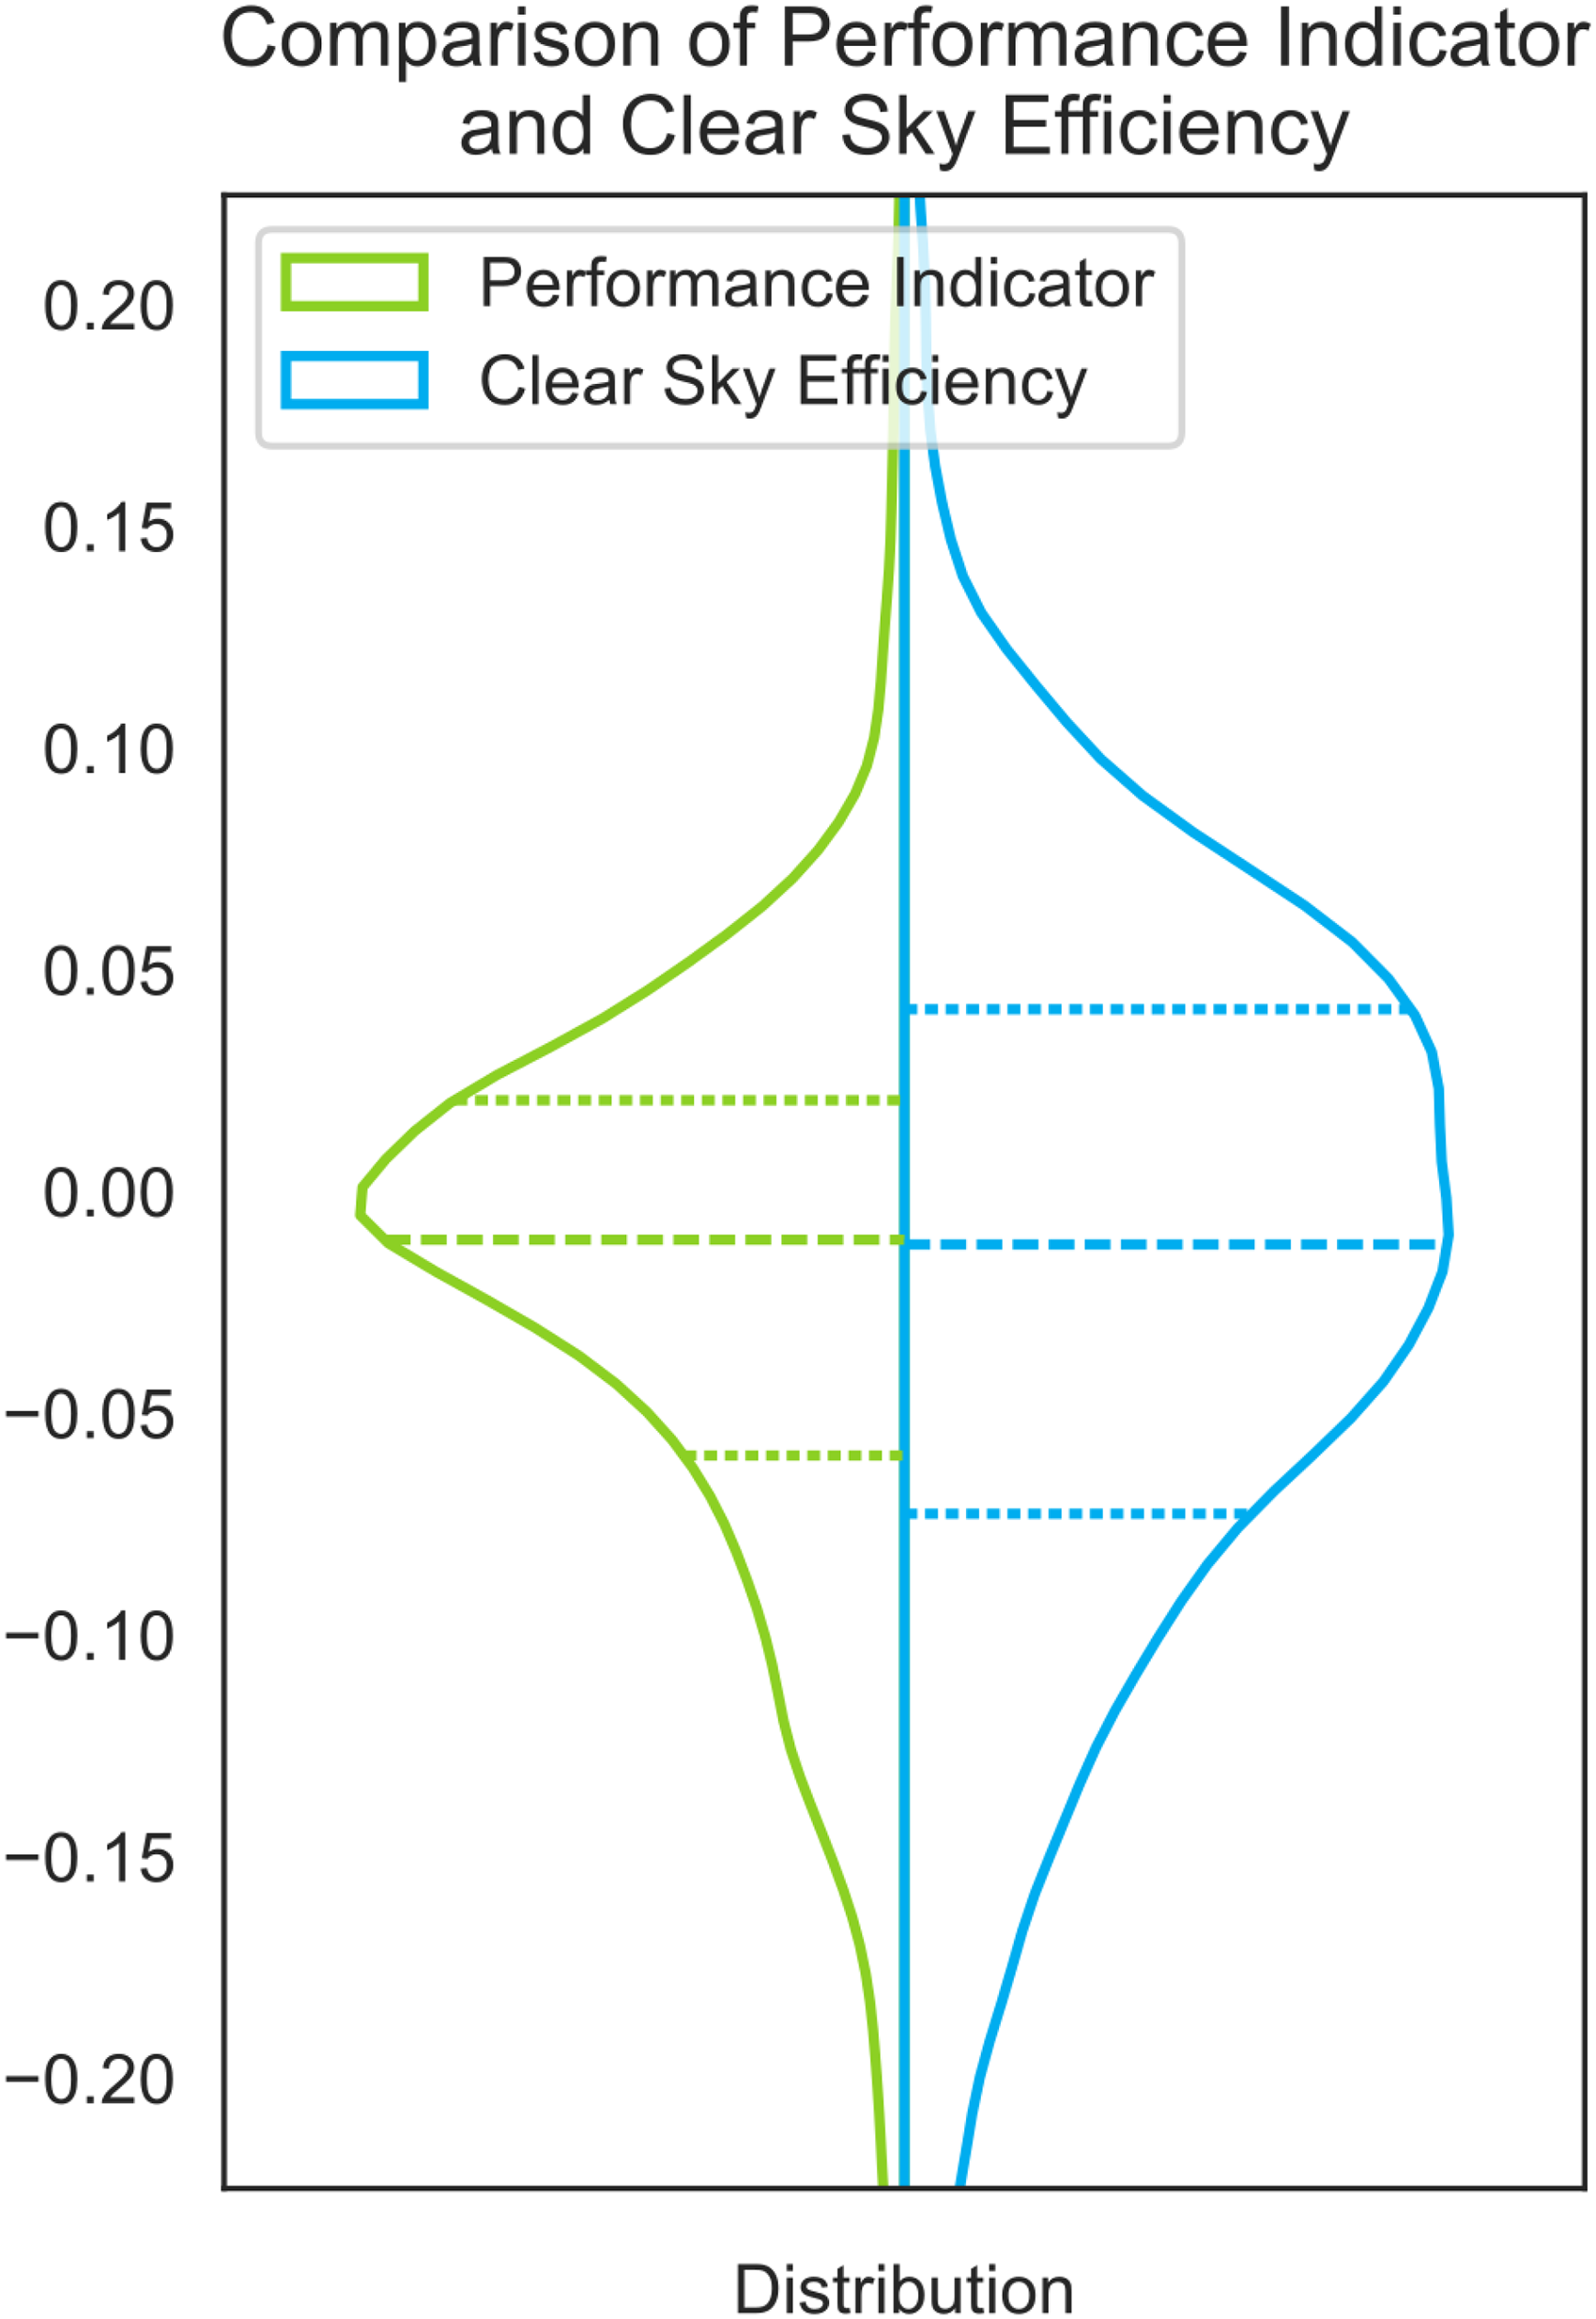
Figure 3 displays in blue an exemplary Clear-Sky performance indicator for comparison, which utilizes a modeled power output as a reference instead of using a comparison device. The Clear-Sky performance indicator 
Distribution of the performance indicator
In green, the plot displays the histogram of the relative performance indicator used in this work. The distribution was calculated for all devices of 1703 power plants and then averaged over 2024. The Clear-Sky performance indicator was only calculated at ideal conditions, while the performance indicator was calculated without regard to cloud cover. Nevertheless, the relative performance indicator shows much less deviation and noise.
The modeled clear-sky performance indicator shows a much broader distribution because of differences in the modeled power output to the measured output, which result from unreliable information about the weather, soiling, configuration, and aging of the strings.
In our experience, the comparison of strings is even more effective than using sensors to detect string outages in PV plants. Sensors, which are frequently not maintained or even absent in smaller plants, may provide unreliable data due to irregular cleaning. Moreover, cleaning sensors can hinder outage detection: A cleaned sensor can diverge from the performance of soiled strings and, therefore, skew the reference value. Cleaned sensors are useful for estimating soiling losses, but detrimental for identifying string outages when the amount of soiling is unknown.
Skomedal et al. (2021) used Seasonal Trend Decomposition (STL) (Cleveland et al., 1990) for the correction of seasonal patterns within the performance indicator, which was implemented by an offline phase of the algorithm. Internal studies showed that this requires extensive historical device data with minimal data gaps over multiple years, a condition rarely met in practical scenarios for PV O&M.
Figure 4 shows the seasonality of the performance indicator over the devices of 1703 power plants for the year 2024. The boxplots were calculated with
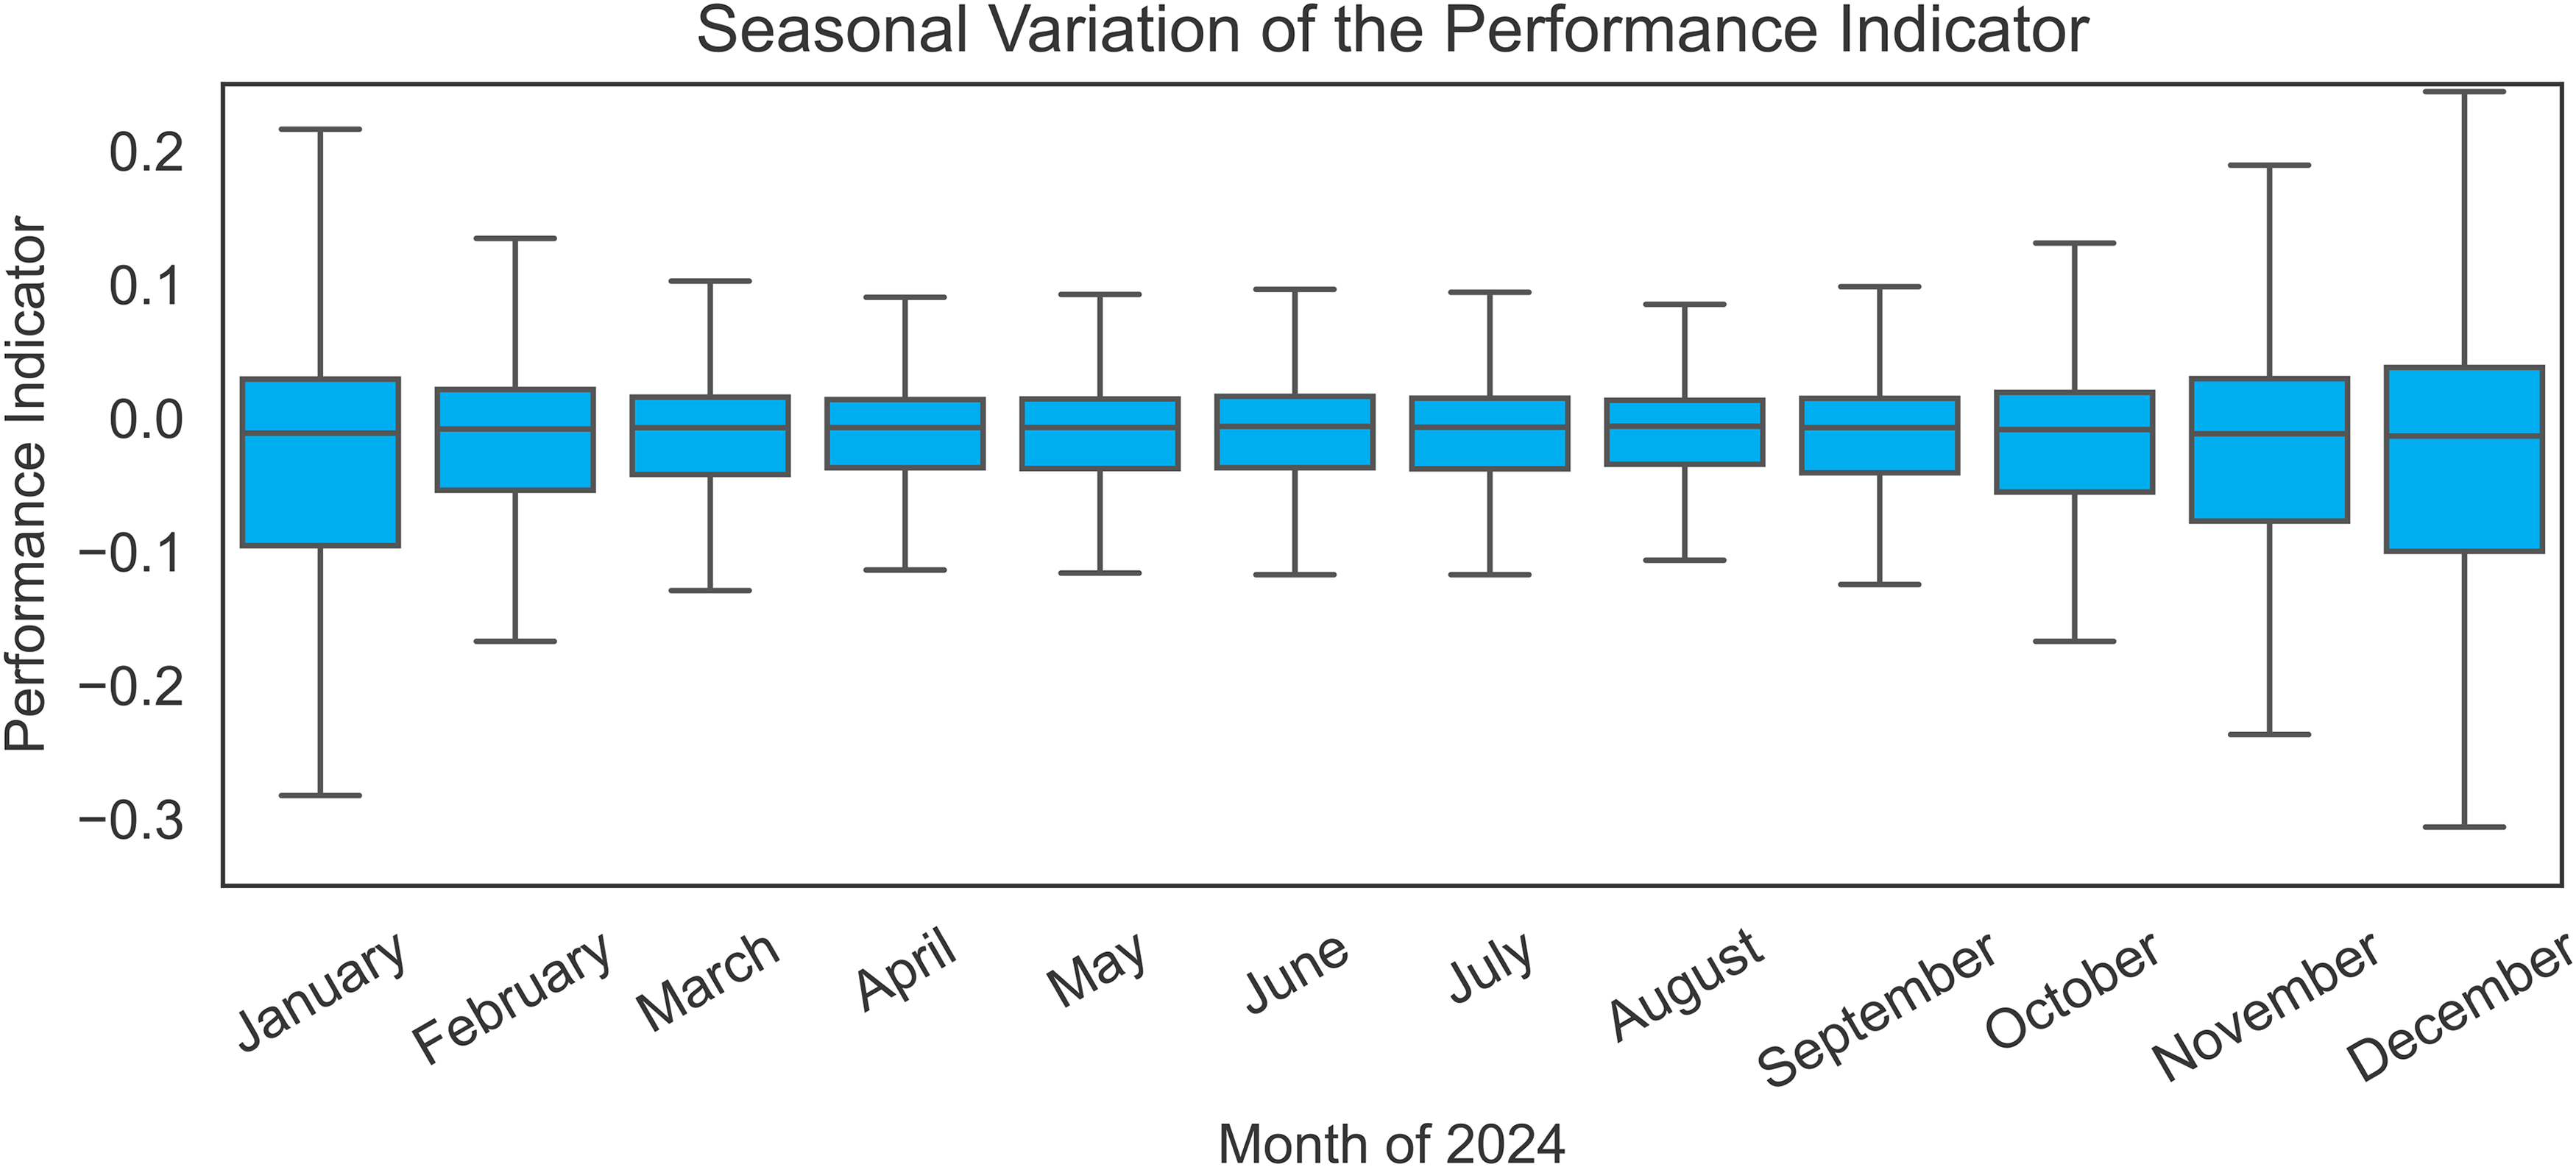
Seasonal variation of the performance indicator in 2024.
The deviation of the performance indicator shows a seasonality, increasing for months with less irradiation. This is the result of a reduction of measurement accuracy for low power outputs, which increases the uncertainty of the performance indicator, which depends on the uncertainty of the measured device as well as the measured comparison device. In addition to that, days in winter with fewer sun hours have fewer data points than days in the summer, which is reinforced by the filtering of data points with power outputs below
While individual strings showed seasonality over time, there is no systematic seasonality visible over all devices, with the median of the performance indicator staying constant. We thus suspect that the seasonality that was observed for individual devices in our data as well as by Skomedal et al. (2021) to be a result of differences in slope and orientation: When a device and the control device have slight differences in orientation or slope, the performance indicator may show under- or over-performance relative to the control device during specific months, leading to seasonal patterns of the performance indicator. Instead of using STL, seasonal differences for the performance indicator of individual strings may be rectified by the identification and correction of the true slope and orientation of a PV plant, which often differs from the configuration documented.
Using the detection engine 3 as a data filter
The relative power difference of the devices over time
Among others, the Detection Engine 3 enabled the filtering of following data points:
MPP / inverter failures Artificial restrictions of the PV plant because of requirements of the electrical grid operator Underperformance because of snow Misconfigured plants Illogical data Automatically identified time points, for which a string was shaded (Schulze et al., 2024)
In addition to these filters, a minimum irradiance filter of
Since there is less reliable data for fault detection in winter (see Figure 4), it may be beneficial to loosen the filter in winter for a higher detection time while accepting a reduction of the sensitivity of the algorithm for this time period.
The filter process was done on the smallest time interval of each PV plant, which is typically a five-minute interval. If there were enough data points of the filtered performance indicator
CUSUM control charts
Incorporating the methods of Skomedal et al. (2021), the approach for detecting string outages employed CUSUM median control charts. These charts are highly efficient for identifying deviations from normal performance levels, with the capability to detect larger deviations faster than smaller ones. Smaller deviations are only flagged as errors if they persist over a significant duration, thereby minimizing the incidence of false alarms.
Out of various control charts, Skomedal et al. (2021) recommended the CUSUM median control chart, as it proved to be robust and consistently ensured the detection of small faults. We thus iteratively calculate the CUSUM chart with:

The calibration and the parameter values for the CUSUM charts used in our methodology are proprietary to smartblue AG. Due to competitive considerations, we are unable to disclose specific parameter settings.
The chart is limited at the top with 0 and at the bottom with a value that is below the lower control limit 
When the performance indicator drops below the reference value because of a broken string, the CUSUM chart becomes negative. Once the lower control limit is reached, a substring outage is indicated.
The CUSUM chart delays the time, after which an underperforming string is labeled as broken, which is advantageous since this reduces false positives. However, using the resulting predicted time interval of a string outage of this methodology directly is disadvantageous for the O&M since the time point of the error detection is some point after the actual fault. The same problem persists for automatic revocation of an error (e.g., after a repair).
This problem is solved using the differentiation of the CUSUM chart: For every time interval 
The endpoint of a string outage 
By Eq. (7) and (8), the time interval of every detected substring outage for every device
Figure 5 displays the methodology of the CUSUM chart: The performance indicator is displayed in blue, showing slight deviations over time. As shown at the beginning of the plot, these deviations may be larger than the reference value

Exemplary data of the detection of a substring fault with the retrospective adjustment of the start of the outage.
Benchmarking the string outage detection
To benchmark the proposed string outage detection method, a basic underperformance detection algorithm was utilized. This algorithm facilitated the identification of general underperformance time points. These points were then automatically and manually compared with the outcomes produced by the proposed algorithm to assess its accuracy and reliability.
The basic underperformance detection operated on data that was largely unfiltered by the Detection Engine 3. This approach was specifically chosen to test for false negatives in our fault detection system. The objective was to verify that the data filtering process does not inadvertently eliminate data indicative of substring outages. This routine for identifying basic underperformance was applied to the mostly unfiltered, daily aggregated data using the following methodology:
This approach to detecting underperformance has been applied with variations across the literature (Buerhop et al., 2023; Ding et al., 2020; Rapaport and Green, 2021) and is a common practice among PV monitoring service providers (Solare Datensysteme GmbH. Solar-Log – Leistungsüberwachung Konfiguration, nd; Meteocontrol Help Center, 2025).
Results
The substring fault detection technique was parameterized and then analyzed by a dataset of 549 PV plants over the year 2023. In sum, the new algorithm returned 7,713 substring outages across all sites, while the old algorithm resulted in 170,496 intervals of underperformance.
PV Plant 42 was labeled for the whole dataset day by day. The 218 kWp plant, located in Nordrhein-Westfalen, Germany, has been operational since 2011. It consists of modules mounted on a flat roof, with an orientation of 135°(southeast) and a tilt of 15°. The plant’s electrical configuration includes 10 inverters, each with a single input linked to either 6 or 7 strings in parallel.
The strings of inverters 3 and 7, and to a lesser extent 1 and 2, have significant shading issues, particularly in the morning during winter months. During the year 2023, the examined photovoltaic plant faced several operational challenges, notably technical problems. In detail, inverter 8 faced sporadic, nearly full-day outages early in the year. On March 9th, two of its four strings were disconnected due to insulation faults caused by connectors submerged in water. One of those strings returned to operation on August 3rd. Between April 17th and 26th, Device 7 was offline due to a burnt-out fuse holder. Beginning on May 10th, Device 6 experienced failures and was identified as defective, necessitating a replacement, which took place on May 31st.
Figure 6 shows a comparison of time points of underperformance with detected substring outages for the plant. The substring outage detection shows a stable result without false positives. while the basic underperformance algorithm returns outages for shaded time intervals, snowy days, and inverter outages.
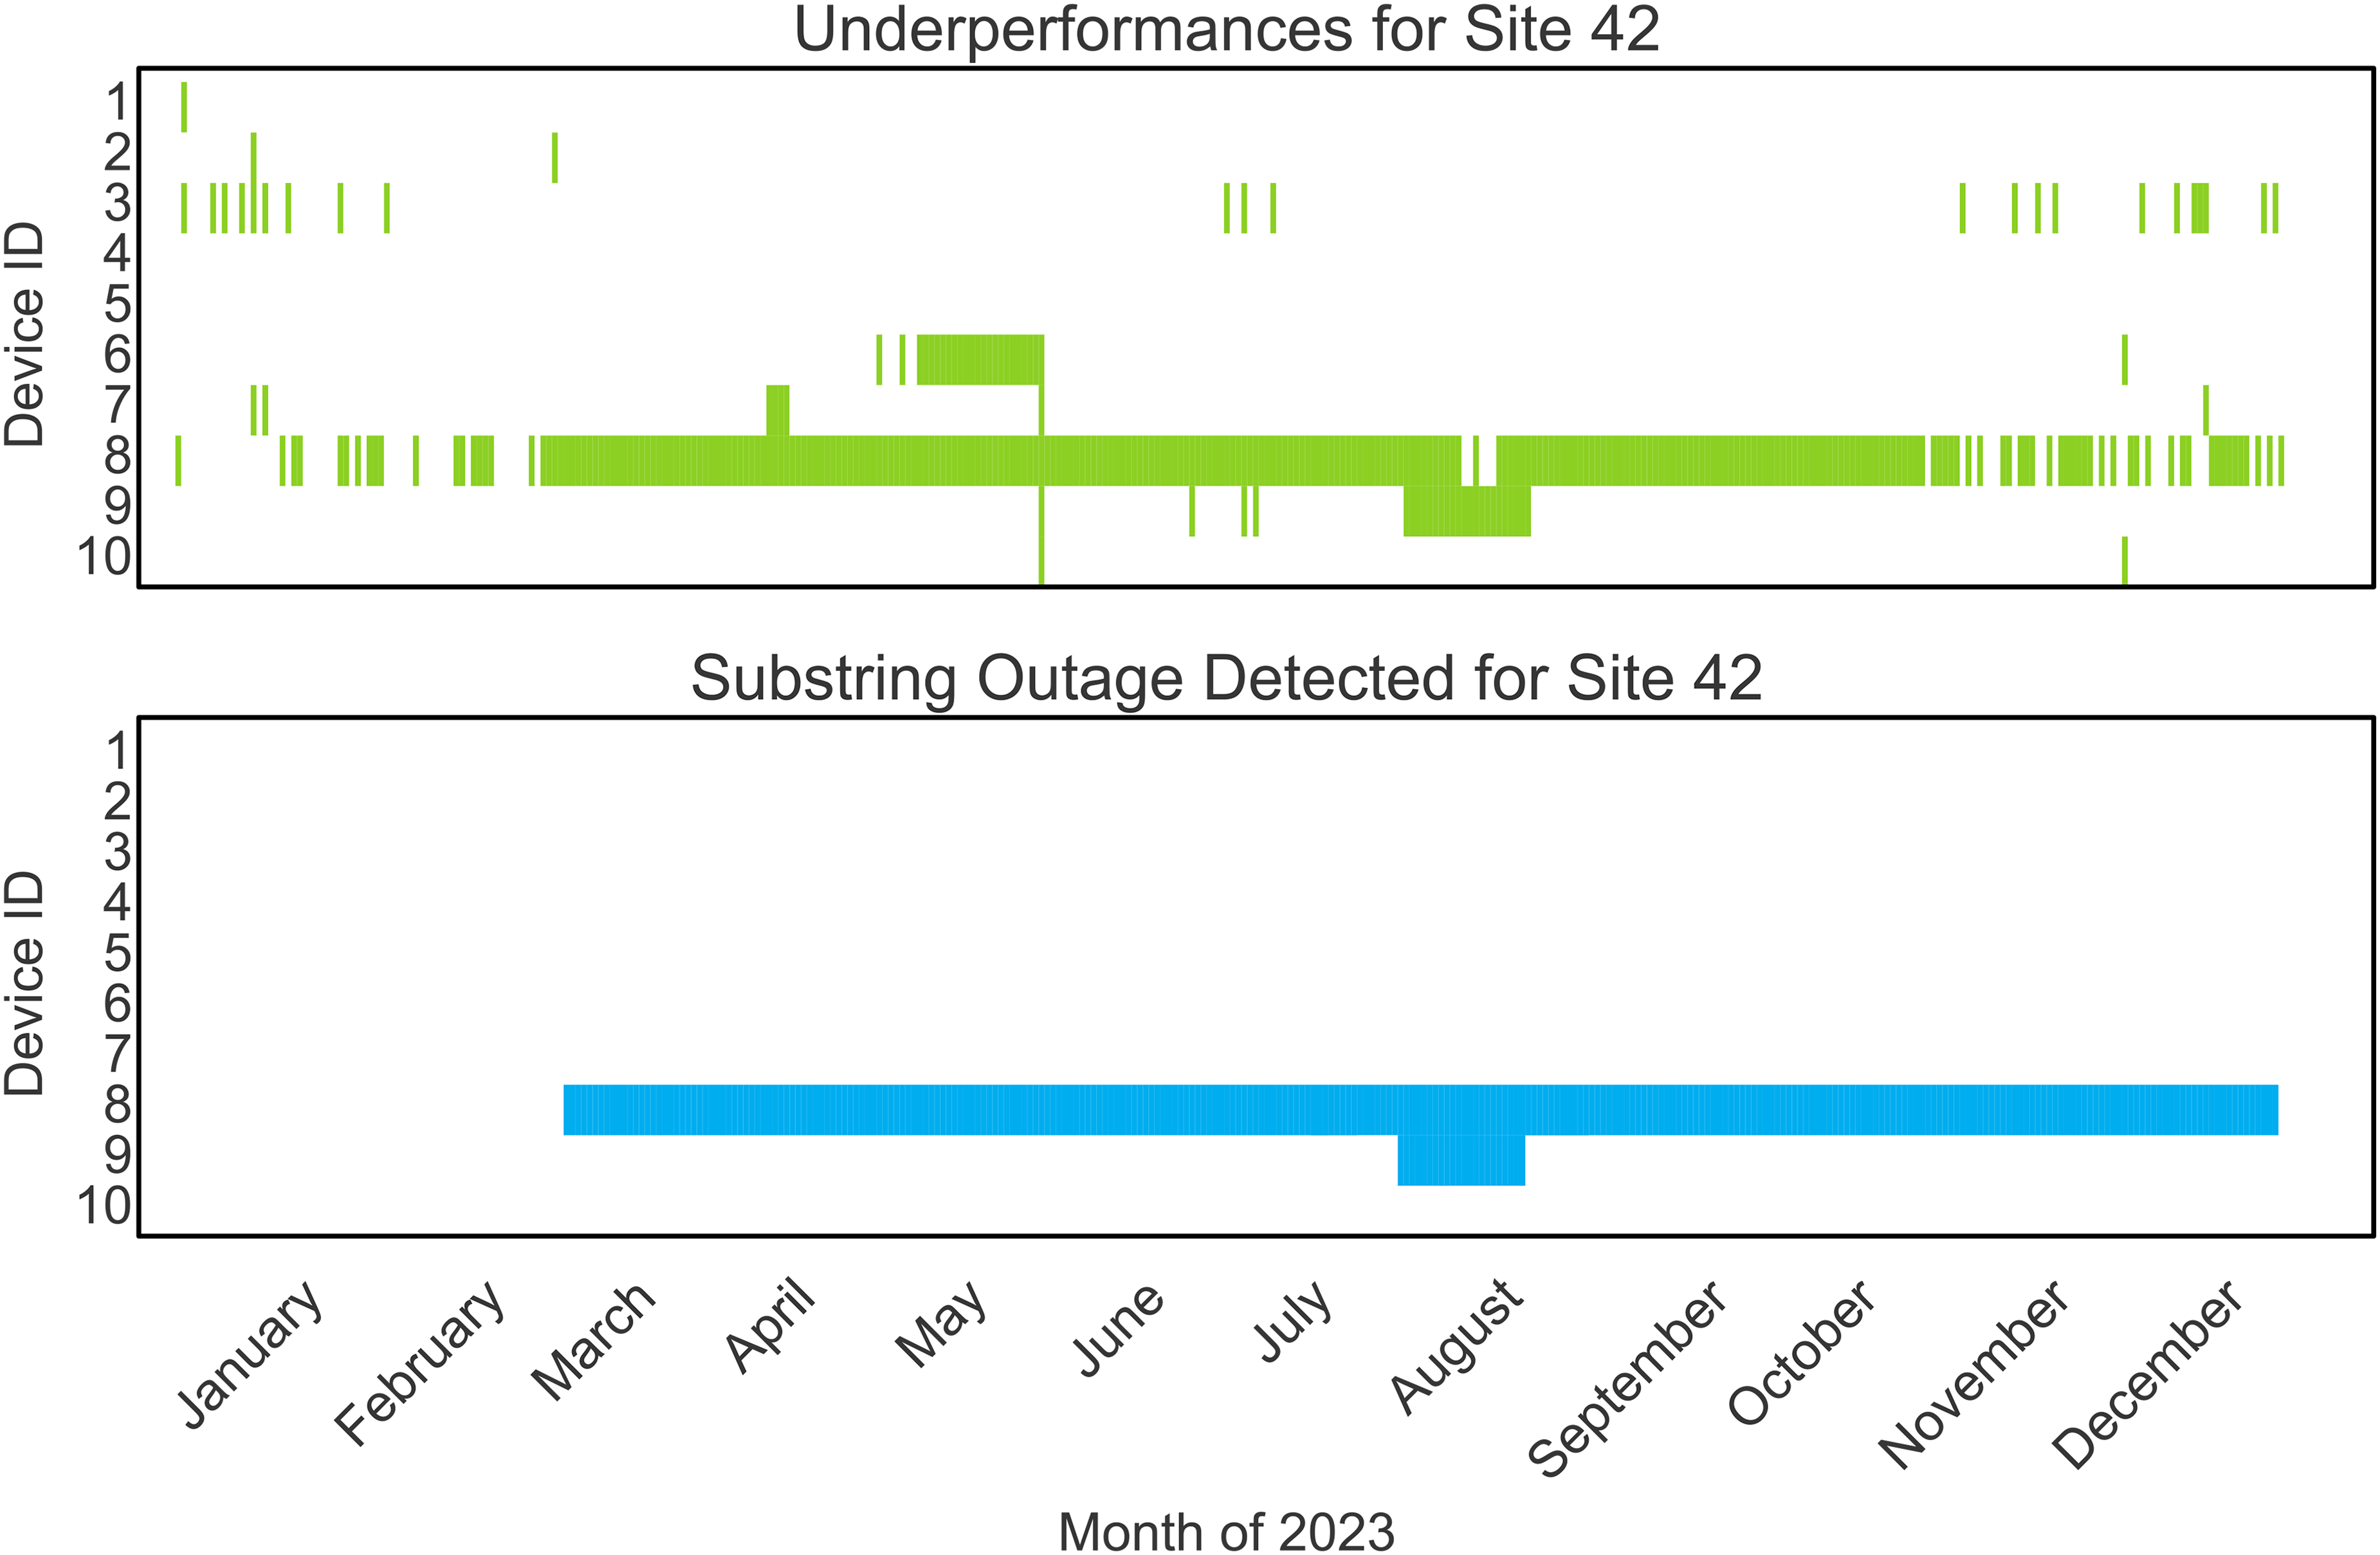
Comparison of time points of underperformance with detected substring outages for an exemplary PV plant.
Table 7 contains the result of the basic algorithm
Days of unterperformance in 2023 for site 42.
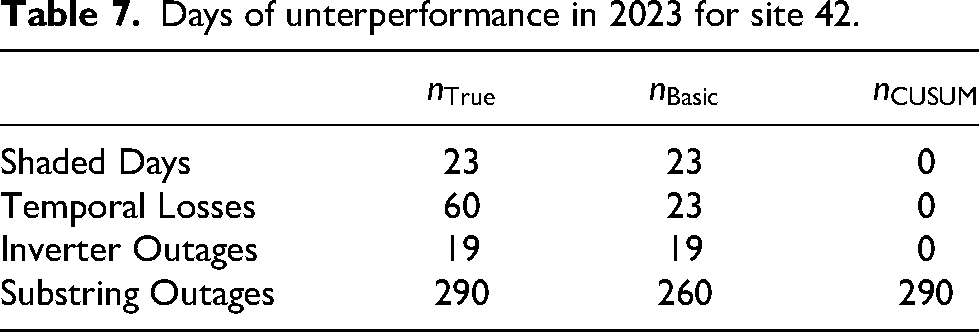
Table 8 shows the confusion matrix of the CUSUM chart algorithm for the detection of substring outages. By adjusting the result using (7) and (8), the beginning and end of the substring outages were correctly identified retrospectively. The outage of strings of Device 8 is detected without false negatives throughout the whole year after March 9th, while the basic algorithm contains many false negatives, especially after August 3rd when one of the strings returned to operation. Thus, although both algorithms were parameterized with the same reference value
Confusion matrix of the CUSUM chart for 2023 and site 42.

As a result of the missing filters of the Detection Engine 3, the basic algorithm returned shaded days and inverter outages as a fault. In addition to that, it also returned many temporal losses as erroneous. Using the CUSUM chart algorithm in combination with the Detection Engine 3 of smartblue AG thus drastically reduced false positives.
Discussion
The methodology was tested on various plants monitored by smartblue AG over a period exceeding one year and proved highly effective.
Short periods of underperformance were reliably not returned as a broken string to the asset manager, while prolonged periods of smaller power losses were reliably flagged. Due to its statistical nature, the methodology was particularly suitable for medium to large-scale rooftop and ground-mounted plants, where numerous strings can be used as a comparative baseline. However, the performance of the methodology diminishes in plants with very few strings or those that only measure the current of a few strings in parallel, limiting evaluation to Eq. (2). Additional challenges arise in plants with non-uniform photovoltaic fields, potentially resulting from variations in slope and orientation (e.g., due to uneven ground), the coexistence of new and old PV devices, or highly aged plants with significantly variable string conditions.
With the CUSUM approach, most devices were reliably categorized as either faulty or functioning properly. However, certain devices consistently underperforming near the reference value
Conclusion
In this work, the factors leading to string outages were examined, and an enhanced method for detecting faults at the substring level is presented. GPT4-o was utilized to analyze O&M reports of PV plants, classifying the outages according to the affected components and the underlying causes of these outages. Our analysis indicates that fuses represent the most frequently faulted component (34 %), while human error accounts for the majority of identified fault origins (54 %).
After that, an industry application of a substring detection technique is demonstrated, which is implemented through a modified version of the CUSUM chart algorithm by Skomedal et al. (2021). The methodology was improved, especially in the filtering process, by using the Detection Engine 3 of smartblue AG, which contains domain expertise that enabled reliable detection of underperformance intervals that were not the result of a substring outage.
The applied methodology was utilized to analyze data from 549 PV plants for the year 2023. 7,713 time intervals were marked as substring outages across 170,496 intervals of underperformance by the new algorithm. Specifically, PV Plant 42 underwent manual labeling for each day and device throughout the year. The proposed methodology resulted in a perfect accuracy for Plant 42. With the incorporation of this methodology into the offerings of smartblue AG, O&M Managers will be equipped with dependable information regarding substring outages.
Footnotes
Acknowledgements
The authors gratefully acknowledge the scientific support and HPC resources provided by the Erlangen National High Performance Computing Center (NHR@FAU) of the Friedrich-Alexander-Universität Erlangen-Nürnberg (FAU). The hardware is funded by the German Research Foundation (DFG) and the Hitech Agenda Bavaria of the Free State of Bavaria. Special thanks to Tim Menzner, Alexander Schönau and Nils Biemann.
Funding
The author(s) disclosed receipt of the following financial support for the research, authorship, and/or publication of this article: The authors express their gratitude to the Bavarian Research Foundation for financial support of the project Kick-PV: AI-Based Characterization and Classification of PV Plants for Predictive Maintenance.
Declaration of conflicting interests
The author(s) declared no potential conflicts of interest with respect to the research, authorship, and/or publication of this article.
Author biography
Appendix
Below is the prompt that was provided to GPT-4o for classifying outages. Line breaks have been added to the prompt displayed here for improved formatting.