
Abstract
Identifying optimal sites for the deployment of hydrokinetic turbines (HKTs) is crucial to maximize renewable energy generation while ensuring environmental sustainability. This study proposes a methodology based on Multi-Criteria Decision Analysis (MCDA) integrated with Geographic Information Systems (GIS) to assess the suitability of the site for the installation of HKT. The approach considers hydrological, environmental, infrastructural, and socioeconomic factors, weighted using the analytical hierarchy process to generate spatial suitability maps. The methodology is validated through a case study in Ecuador, using its extensive river networks to identify promising locations for HKT projects. The analysis highlights dozens of high-potential sites, assessed through GIS spatial modeling and energy estimation. A comparative evaluation of energy output at two selected sites, Río Esmeraldas and Río Napo, demonstrates the feasibility and effectiveness of hydrokinetic energy exploitation in Ecuador. To validate the selected sites, high-resolution satellite imagery was used to confirm compliance with all predefined criteria and restrictions, providing a practical verification method in the absence of detailed on-site measurements. The estimated annual energy generation potential for the selected sites is approximately 1.25 GWh for Río Esmeraldas and 1.08 GWh for Río Napo, demonstrating the viability of HKT implementation in Ecuador’s riverine environments. Despite the effectiveness of the proposed approach, certain limitations must be acknowledged, including the resolution of available geospatial datasets, the lack of in situ flow velocity measurements, and the absence of detailed economic feasibility evaluations. Future research should focus on refining the methodology by incorporating real-time hydrological monitoring and exploring hybrid renewable energy solutions. The results confirm that GIS-based MCDA provides a scalable and data-driven decision support tool for researchers, policymakers, and industry stakeholders, facilitating strategic planning of renewable energy and accelerating the transition to sustainable power generation.
Keywords
Introduction
The increasing global demand for sustainable energy solutions has driven the transition from fossil fuels to renewable energy sources. This shift aims to reduce carbon emissions and mitigate the environmental impact of energy production. Among various renewable energy technologies, hydrokinetic turbines (HKT) have emerged as a promising yet underutilized alternative, particularly in regions with abundant hydrological resources (Martínez et al., 2024; Rasooli et al., 2024). Unlike traditional hydropower plants, which rely on large dams and reservoirs, HKT harnesses the kinetic energy of flowing water in rivers, canals, and tidal currents without requiring extensive civil infrastructure. This characteristic makes HKT an attractive option for decentralized power generation, particularly in developing countries with limited access to large-scale electrical infrastructure. Ecuador, for instance, possesses an extensive network of rivers, making hydrokinetic generation a viable low-impact renewable energy solution (Córdova-González et al., 2024; Durán-Siguenza et al., 2024).
HKT systems offer several advantages, including continuous and predictable energy generation, minimal ecological disruption, and the ability to complement solar and wind energy in hybrid renewable systems (Mutule et al., 2019; Reddy Bhosale, 2023). However, successful HKT deployment requires an optimized site selection process that accounts for multiple factors. These include technical aspects such as water velocity and depth, environmental constraints like protected areas, and socio-economic considerations such as infrastructure accessibility and grid connection feasibility. The lack of standardized methodologies for identifying suitable locations remains a significant challenge, limiting large-scale adoption. In this context, Multicriteria Decision Analysis (MCDA) integrated with Geographic Information Systems (GIS) has proven to be a practical tool for renewable energy planning and spatial optimization. By incorporating diverse datasets and assigning relative importance to different factors, GIS-based MCDA enables a systematic and data-driven evaluation of potential HKT deployment sites (Rikalovic and Cocić, 2014).
Despite increasing interest in hydrokinetic energy, a fundamental research gap remains in the efficient selection of deployment sites that balance technical feasibility, environmental constraints, and infrastructure accessibility. This study seeks to answer the following research question: “How can a GIS-based MCDA methodology be structured to optimize site selection for hydrokinetic turbine deployment while ensuring environmental sustainability and technical viability?” Addressing this question is essential for advancing the integration of HKT technology into renewable energy systems, particularly in developing countries where decentralized power generation is needed.
Previous studies have demonstrated the effectiveness of MCDA-GIS methodologies for site selection in various renewable energy projects, including wind farms, solar power plants, and hydropower stations (Amsharuk Łaska, 2023; Türk et al., 2021; Yegizaw and Mengistu, 2023). Research efforts have focused on integrating hydrological, environmental, and economic factors into decision-support models. These tools enable policymakers to prioritize optimal locations while minimizing ecological and social conflicts. The Analytic Hierarchy Process (AHP) has been widely adopted within MCDA frameworks, providing a structured mechanism for assigning priorities to multiple evaluation criteria. Recent advancements in GIS spatial modeling and remote sensing technologies have further improved the accuracy and applicability of MCDA in renewable energy planning. Despite these developments, few studies have explicitly focused on HKT site selection (Córdova-González et al., 2024; Fouz et al., 2022; Khan et al., 2023). The unique characteristics of hydrokinetic energy—such as its reliance on river flow velocity, bathymetry, and proximity to infrastructure—necessitate a tailored methodological approach that integrates hydrodynamic and environmental constraints into a comprehensive decision-support model.
Ecuador represents an ideal case study for evaluating the applicability of GIS-based MCDA for hydrokinetic energy deployment. As a country with extensive river networks, growing demand for renewable energy, and a commitment to sustainable development, Ecuador has significant potential for integrating HKT technology into its national energy matrix (Reinoso-Avecillas et al., 2024). The Ecuadorian electricity sector is currently dominated by large-scale hydropower, which accounts for the majority of the country’s energy production (Agencia de Regulación y Control de Energía y Recursos Naturales No Renovables (ARCERNNR), 2024). However, reliance on centralized hydroelectric plants poses challenges related to climatic variability, seasonal water availability, and infrastructure resilience. To address these challenges, distributed renewable energy sources such as HKT can enhance diversification and improve energy system reliability (Córdova-González et al., 2024). Moreover, off-grid hydrokinetic installations could provide sustainable electricity solutions for remote and isolated communities lacking access to conventional power infrastructure. Despite its potential, hydrokinetic energy has received limited attention in Ecuador’s national energy policy, highlighting the need for comprehensive feasibility assessments and spatial planning frameworks (Reinoso-Avecillas et al., 2024).
This study proposes a structured GIS-based MCDA methodology for selecting optimal HKT deployment sites. The methodology integrates hydrological, environmental, infrastructural, and socio-economic criteria, with a weighting system based on AHP to generate suitability maps through GIS spatial modeling. The objectives of this study are threefold: (1) to develop a replicable site selection framework using MCDA and GIS, (2) to validate the methodology through a case study in Ecuador, and (3) to provide insights into the feasibility of HKT deployment in regions with significant hydrological resources.
The remainder of this paper is structured as follows. Section “Materials and Methods” details the MCDA-GIS methodology, including data collection, processing, and analysis. Section “Results” presents the results of the site selection process, highlighting the most suitable locations for HKT deployment. Section “Site Selection” discusses the validation process and the approach used to confirm compliance with the proposed criteria. Section “Annual Energy Calculation” provides an estimation of the annual energy output for selected sites. Finally, Section “Conclusion” summarizes key findings, discusses limitations, and proposes future research directions.
Materials and methods
Multicriteria decision analysis methodology
The selection of optimal sites for renewable energy projects requires an integrative approach that considers multiple technical, environmental, and socio-economic factors. MCDA is a well-established method for handling complex decision-making scenarios by systematically evaluating various criteria that influence site suitability (Rikalovic and Cocić, 2014). When integrated with GIS, MCDA becomes a powerful tool for spatial analysis (Karbassi Yazdi et al., 2025), enabling the identification of ideal locations for HKT deployment. This study employs a GIS-based MCDA methodology, structured into six systematic stages, to determine the most suitable locations for HKT installation. The AHP is utilized to assign weights to different criteria, ensuring an objective and data-driven approach. The methodology is designed to be generalizable and adaptable to diverse geographical contexts beyond the Ecuadorian case study presented in this research.
Stages of the multicriteria decision analysis process
The proposed methodology for selecting optimal HKT sites follows a structured workflow consisting of multiple stages, ensuring a systematic evaluation of diverse influencing factors. Each stage integrates GIS with MCDA to create an optimized decision-support framework.
Hydrological maps with flow velocity and river network data. Digital Elevation Models for topographical analysis. Land use classification for environmental and geographical assessments. Infrastructure datasets detailing roads and electrical infrastructure.
Collected data is standardized and transformed into GIS-compatible formats for spatial analysis.
Stacking spatial data layers according to defined criteria. Applying AHP-derived weights to influence suitability calculations. Computing a final suitability index, generating a site suitability heatmap.
The resulting map visually represents the most favorable locations for HKT installation, considering all influencing parameters. This suitability map is vital for narrowing down potential sites before further validation.
Cross-referencing identified locations with field data and expert assessments. Eliminating sites located in flood-prone areas or environmentally sensitive zones. Prioritizing locations that exhibit high hydrokinetic potential while maintaining logistical feasibility.
Only the most technically viable sites are retained for energy potential estimation.
Figure 1 illustrates the step-by-step process of the proposed MCDA-GIS methodology. It encompasses key stages such as criteria definition, data acquisition, normalization, weighting, spatial analysis, and final site selection. The integration of hydrological maps, river networks, meteorological stations, population, and infrastructural data layers within a GIS environment enables an objective and data-driven decision-making process.

MCDA Process for Hydrokinetic Site Selection Using GIS.
Site suitability verification approach
To validate the reliability of the MCDA-GIS model, a preliminary site verification protocol was implemented. This approach consisted of visual cross-validation using freely accessible high-resolution satellite imagery, specifically through platforms such as Google Earth. For each of the top-ranked sites identified through the suitability analysis, a spatial comparison was performed between the raster-based output and the real-world terrain visible in satellite images. This visual verification allowed confirmation that the selected locations were adjacent to active watercourses, avoided protected areas and densely populated zones, and exhibited apparent accessibility for future interventions.
This strategy constitutes a preliminary validation step appropriate for prefeasibility assessments, particularly where in-situ hydrological measurements are not available. Although not a substitute for ground-truthing, this method offers a practical basis for evaluating spatial consistency and ensuring that model outputs align with predefined hydrological and environmental criteria. Future studies may incorporate more comprehensive validation procedures such as hydrodynamic modeling, field-based discharge measurements, or stakeholder-driven site evaluations.
The preparation of geospatial datasets followed defined selection and exclusion criteria. Datasets were included if they met the following conditions: (1) relevance to hydrological, environmental, infrastructural, or socio-economic dimensions of HKT deployment; (2) availability in georeferenced raster or shapefile formats compatible with ArcGIS; (3) spatial resolution appropriate for regional-scale analysis (typically between 10 m and 90 m); and (4) publication or update date within the last 10 years. Official sources included institutions such as the Ministry of Environment, the National Institute of Meteorology and Hydrology (INAMHI), and academic repositories. Data were excluded if they were outdated, poorly documented, lacked spatial consistency, or exhibited low resolution.
The MCDA-AHP framework was implemented using a semi-structured weighting process informed by technical literature, expert consultations, and contextual relevance to the Ecuadorian setting. Weight assignments reflected a balance between hydrological suitability (e.g., flow velocity, water depth) and infrastructural and socio-environmental factors (e.g., accessibility, conservation areas). Given the methodological intent to demonstrate the applicability of the GIS-MCDA approach for hydrokinetic planning, no sensitivity analysis was conducted. Nevertheless, future extensions of this work may consider integrating sensitivity studies to evaluate the influence of different weighting configurations and improve robustness in context-specific applications.
The spatial analysis was conducted using ArcGIS version 10.5. Core processing steps included raster calculation through the “Map Algebra” tool and spatial interpolation using the “Geostatistical Tools” module. All spatial layers were processed under a unified projection system and resolution to ensure consistency in the weighted overlay analysis. Default software settings were applied unless otherwise noted. This configuration provides a replicable workflow for researchers aiming to adapt the methodology to other geographical contexts.
Results
This section presents the implementation of the MCDA-GIS methodology for identifying optimal HKT sites in Ecuador. The results detail the definition of objectives and criteria, data collection, data normalization, and the multicriteria spatial analysis, following the structured methodology described in the previous section. Ecuador, located in northwestern South America, has a continental surface area of approximately 256,370 km2. The country exhibits a complex hydrological network, with numerous rivers that originate in the Andean mountain range and drain into the Pacific Ocean or the Amazon basin, creating diverse hydrographic conditions. The application of the MCDA-GIS methodology in this study takes advantage of these natural features to systematically identify the most suitable locations for HKT deployment, ensuring that technical, environmental and infrastructure constraints are taken into account.
The geospatial datasets used for this study were derived from cartographic sources developed by the Instituto Geográfico Militar on a scale of 1:25,000, which implies a suitable spatial resolution for regional-scale planning applications. These datasets were compiled and made available by the Universidad del Azuay through its open-access platform for geographic information (Universidad del Azuay, 2025b). Although the datasets correspond to different years, all of them fall within the last decade. Due to the nature of the available data, some layers—particularly hydrological ones—may include generalized or interpolated values inherent to their original production scale. These aspects were considered during analysis and interpretation. Future research efforts should incorporate higher-resolution or real-time data where available, especially when transitioning from prefeasibility assessments to detailed project design.
In the absence of comparable historical studies employing spatially explicit MCDA-AHP methodologies for hydrokinetic site selection in Ecuador, the validation of results was carried out through visual inspection using high-resolution satellite imagery. This approach confirmed the plausibility of the identified locations in relation to actual river morphology, environmental constraints, and infrastructure proximity. While this method offers a practical solution for prefeasibility-level analysis, it does not replace field-based validation or longitudinal hydrological assessments, which remain essential for robust model performance evaluation in future work.
Definition of objectives and criteria
The primary objective of this study is to identify optimal locations for HKT deployment based on hydrological, environmental, infrastructural, and socio-economic factors. The criteria selection process was guided by:
Technical feasibility (water velocity, depth, proximity to rivers). Environmental constraints (protected areas, flood risk zones). Economic and infrastructural considerations (grid accessibility, distance to roads). Social impact (proximity to communities).
Each criterion was carefully weighted and ranked using the AHP to reflect its relative importance in site suitability.
Figure 2 presents the hydrological map of Ecuador, highlighting the primary river networks and their flow characteristics. Additionally, environmental constraints are considered in the site selection process. Figure 3 illustrates the restricted areas taken into account in this study, including national parks, biodiversity hotspots, and flood-prone zones. These shaded regions are excluded from the MCDA-GIS analysis to ensure environmental sustainability and regulatory compliance.

Hydrological map of Ecuador displaying the national river network (in green), used as a base layer for hydrokinetic site suitability analysis.
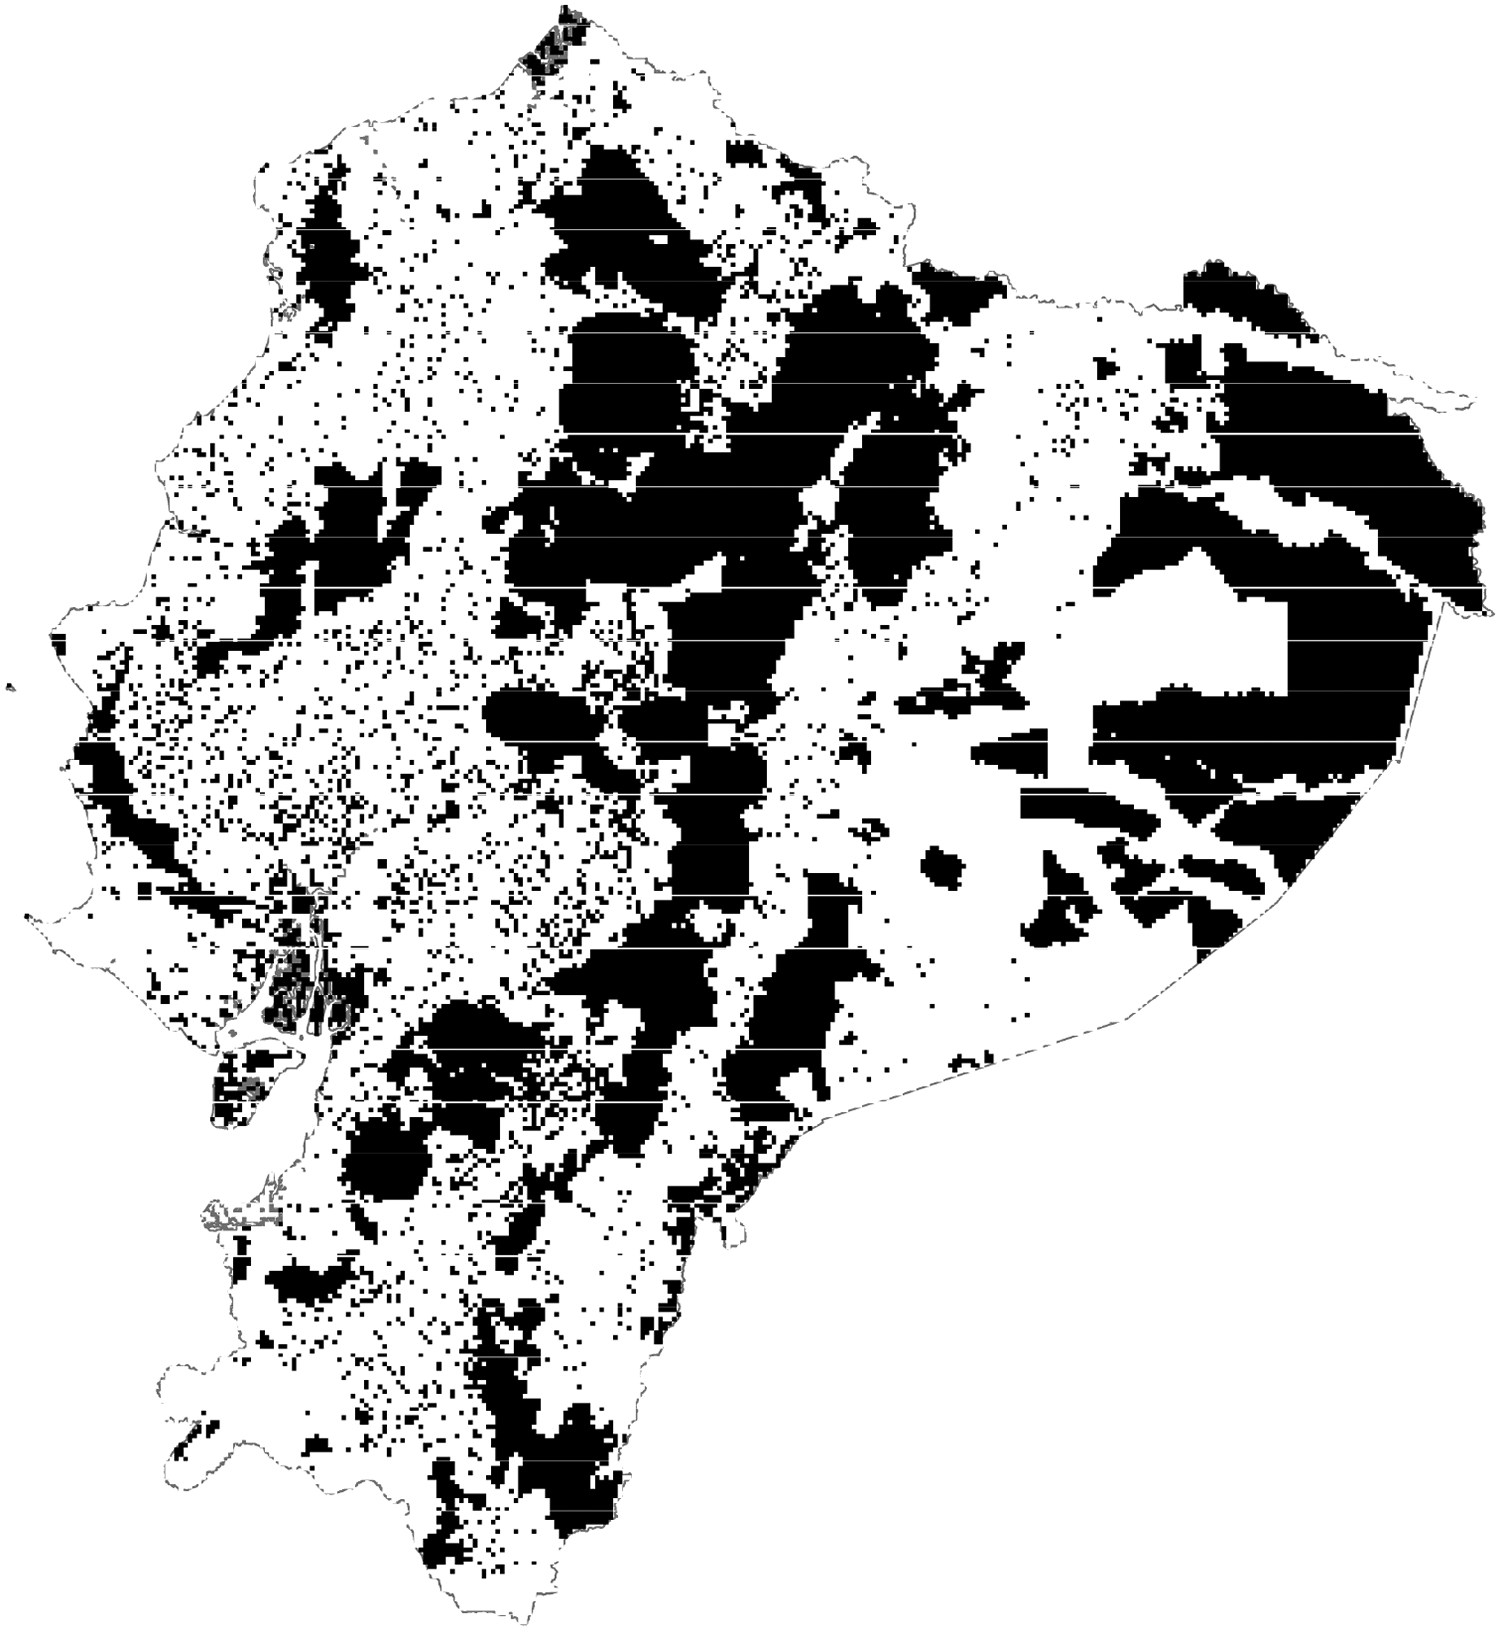
Environmental constraint map highlighting excluded areas in black, including protected zones and flood-prone regions.
Data collection and GIS integration
To implement the MCDA-GIS methodology, multiple geospatial datasets were collected from Ecuadorian government agencies, research institutions, and open-access geographic portals (Universidad del Azuay, 2025a, 2025b). These datasets were processed in ArcGIS to create layers for spatial analysis.
The collected datasets included:
Hydrological data: River flow velocity, stream direction, and water depth. Hydrological map: Spatial representation of Ecuador’s river networks and water availability. Meteorological stations: Geographic distribution of weather monitoring stations across the country. National electrical grid and substations: Locations of main connection points to the grid and substations. Populated areas: Urban and rural settlements.
Each dataset was imported into ArcGIS and transformed into a georeferenced spatial layer, ensuring consistency in projection and resolution for subsequent analysis.
A comprehensive hydrological map of Ecuador was developed by the researchers using primary data from Ecuadorian governmental agencies. As shown in Figure 4, the blue zones on the map indicate low flow rates, while the orange zones correspond to high flow rates. The Amazon Basin, characterized by larger and more persistent watercourses, exhibits the highest flow rates, whereas smaller rivers in the Pacific and Andean regions tend to have lower discharge levels.

Hydrological map of Ecuador. The color scale represents the flow rates (
To refine the spatial evaluation, Euclidean distance calculations were applied to specific geospatial layers, generating heat maps that quantify proximity relationships relevant to HKT site selection. These distance-based criteria enhance the MCDA-GIS methodology by integrating infrastructural and environmental considerations.
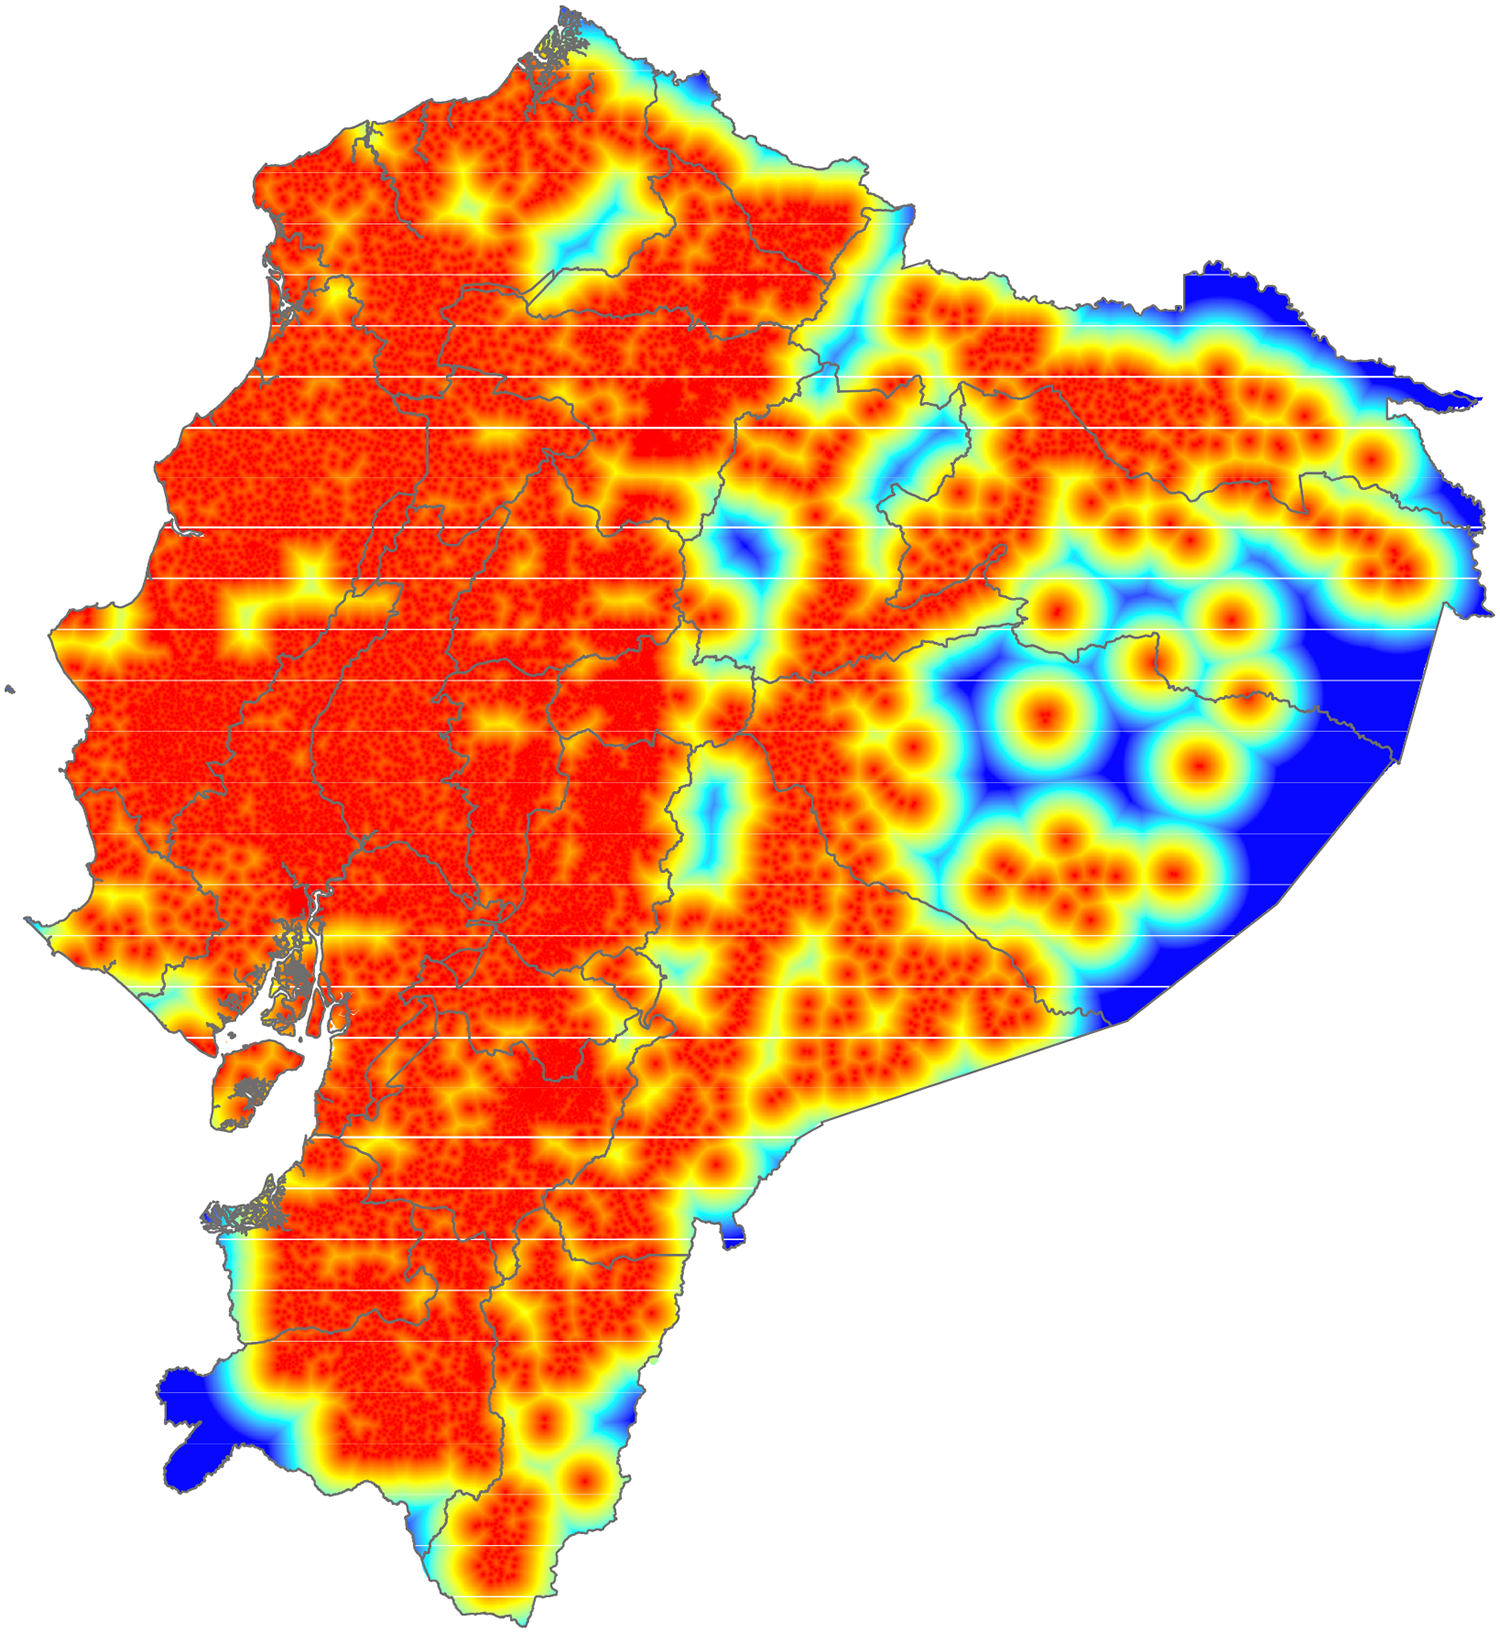
Figure 5 presents the distance to major river systems, emphasizing the importance of site location relative to flowing water bodies. Proximity to rivers is a fundamental factor in hydrokinetic energy feasibility, as sites closer to primary watercourses exhibit greater energy potential.

Euclidean distance to major river systems, represented as a heatmap from red (shortest distance) to blue (farthest distance).
Figure 6 illustrates the Euclidean distance to populated areas, where red represents high proximity to settlements, and blue indicates more remote locations. This criterion ensures that selected sites maintain a balance between accessibility and minimizing potential social conflicts.
Euclidean distance to populated areas, visualized as a heatmap from red (shortest distance) to blue (farthest distance).
Figure 7 displays the distance to hydrometeorological stations, which provide critical data for monitoring river flow variations. Sites closer to these stations (red areas) benefit from enhanced real-time data acquisition, improving the precision of hydrokinetic energy assessments.

Euclidean distance to hydrometeorological stations, shown using a red-to-blue gradient where red indicates proximity and blue indicates greater distance.
Finally, Figure 8 shows the Euclidean distance to the existing power grid infrastructure. The color gradient highlights regions where connection to the electrical network is more feasible (red areas), optimizing energy distribution and minimizing transmission losses.

Euclidean distance to the existing electrical infrastructure, using a red-to-blue gradient where red indicates closer proximity and blue indicates greater distance.
Data normalization and weighting
After collecting and integrating the data into GIS, normalization was performed to standardize the evaluation process. Each dataset was reclassified into a suitability scale from 1 to 5, where:
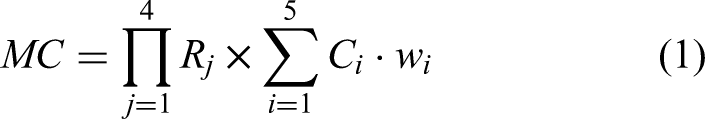
1 represents the least suitable conditions (e.g., low water velocity, distant from power lines). 5 represents the most favorable conditions (e.g., high flow velocity, proximity to infrastructure, and populated zones). MC = Multicriteria suitability score (normalized from 0 to 5).
Additionally, environmental constraints such as protected areas and high-risk flood zones were incorporated as binary exclusion layers (1 = allowed, 0 = restricted). The final suitability score, MC, for HKT site selection is computed using the following equation:
The weight factors (
Multicriteria spatial analysis and suitability mapping
Using GIS-based weighted overlay analysis, all reclassified datasets were combined into a final suitability heatmap. The process included:
Stacking spatial layers for each criterion. Applying AHP-derived weights to reflect relative importance. Generating a composite suitability map, identifying regions most favorable for HKT deployment.
The final suitability map provides a spatial representation of the best potential locations for HKT installation in Ecuador, considering all technical, environmental, and economic constraints.
Figure 9 illustrates the results of the MCDA-GIS analysis. The heatmap highlights the most suitable points for HKT deployment, with red pixels indicating the highest-scoring locations. These areas meet the established multicriteria conditions, including high hydraulic potential, proximity to populated areas and rivers, accessibility to meteorological stations, and proximity to evacuation infrastructure.

Final suitability map generated through MCDA-GIS analysis. The red-to-blue gradient indicates site suitability, where red zones (value 5) represent optimal conditions for HKT deployment—characterized by high water flow velocity, close proximity to infrastructure and populated areas—while blue zones indicate the least suitable areas.
As observed, the red-colored zones represent the most promising areas for hydrokinetic energy projects. These locations exhibit optimal site characteristics, making them primary candidates for further feasibility assessments and potential implementation. The initial prospection of viable areas could begin by focusing on these high-suitability zones.
Site selection
Following the multicriteria analysis and suitability mapping, this section details the validation of selected sites and the final decision-making process for implementing HKT in Ecuador. The selection process ensures that the identified sites are both technically viable and practically implementable within the national energy framework.
Validation and selection of optimal sites
Once the site suitability map was generated, a validation process was conducted to ensure the accuracy and reliability of the results. A crucial step in this phase is to confirm that the identified high-potential sites align with real-world conditions. Ideally, this would involve direct field visits to the selected areas; however, in preliminary feasibility studies, it is a common practice to first verify site suitability through remote sensing techniques, particularly satellite imagery.
In this study, Google Earth was used as a complementary tool to cross-check the validity of the MCDA-GIS results. Figure 10 illustrates this validation process. In subplot (a), the MCDA-GIS results are filtered to display only the locations that achieved the highest suitability scores. These high-priority areas represent the most optimal sites for hydrokinetic turbine deployment based on all evaluated criteria. In subplot (b), the corresponding locations are overlaid onto a satellite image from Google Earth, allowing for an orthogonal verification of terrain conditions, river characteristics, and accessibility.

Comparison of MCDA-GIS filtered results and their spatial verification. (a) Filtered MCDA-GIS results showing only locations with the highest suitability scores. (b) Corresponding site positions overlaid onto a satellite image from Google Earth.
The satellite-based validation was performed using Google Earth Pro, which provides access to high-resolution optical imagery from multiple sources. While the resolution of the imagery varies by location, it is generally sufficient to distinguish water channels, built infrastructure, and vegetation cover. This level of detail enables a visual inspection to ensure consistency between the GIS-modeled outputs and observable landscape features. Although not a substitute for field measurements, this approach offers a cost-effective and scalable validation method for prefeasibility assessments.
To complement the spatial visualization of results, Table 1 presents the distribution of the most suitable HKT locations across Ecuadorian provinces. A total of 124 optimal points were identified, with the provinces of Orellana, Morona Santiago, Zamora Chinchipe, and Sucumbíos concentrating the highest number of suitable sites. These percentages offer insight into the regional distribution and can guide future policy planning and investment prioritization.
Geographic distribution of suitable HKT sites by province.

This remote validation step helps ensure that the selected sites meet practical feasibility conditions before conducting field inspections. For exemplification purposes, two specific locations have been selected in this study, as marked in yellow in the Figure 10. These locations will serve as reference points for future on-site evaluations, providing a methodological framework that can be replicated in other interest zones and other geographic contexts.
Final site selection and validation
The final decision-making process was based on four criteria:
Among the identified locations, two case study sites stand out due to their strategic hydrological and infrastructural advantages:

Orthophoto of the Río Esmeraldas site near Viche, Esmeraldas province, obtained from Google Earth.
A review of the satellite images confirms that the river with high hydrokinetic potential is located near a populated center, reinforcing the reliability and accuracy of the proposed methodology.

Orthophoto of the Río Napo site near El Coca, Orellana province, obtained from Google Earth.
Similarly, satellite imagery of Río Napo corroborates that the selected site is located near a populated area. This proximity ensures access to electrical infrastructure, making energy evacuation feasible. Additionally, the likelihood of pre-existing meteorological stations is high, further validating the precision and applicability of the MCDA-GIS methodology used in this study.
Annual energy calculation
The energy potential of HKT at the selected sites was evaluated based on hydrological data, turbine performance, and site-specific characteristics. This assessment considers flow velocity, power output, and expected energy generation to estimate the feasibility of hydrokinetic energy exploitation in Ecuador.
Power calculation for hydrokinetic turbines
The power generated by a hydrokinetic turbine, P, can be estimated using the following equation (Reddy Bhosale, 2023): P = Generated power (W) A = Swept area by the turbine rotor (m2) v = Water flow velocity (m/s)
The water flow velocity (v) is determined by the following equation: Q = Effective flow rate incident on the turbine (m3/s)
The capacity factor, CF, which represents the ratio of actual energy production to the theoretical maximum, is calculated as: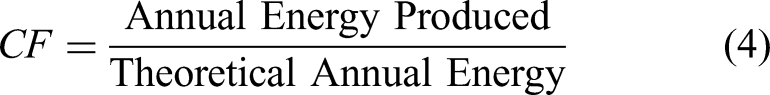
Energy potential at Río Esmeraldas
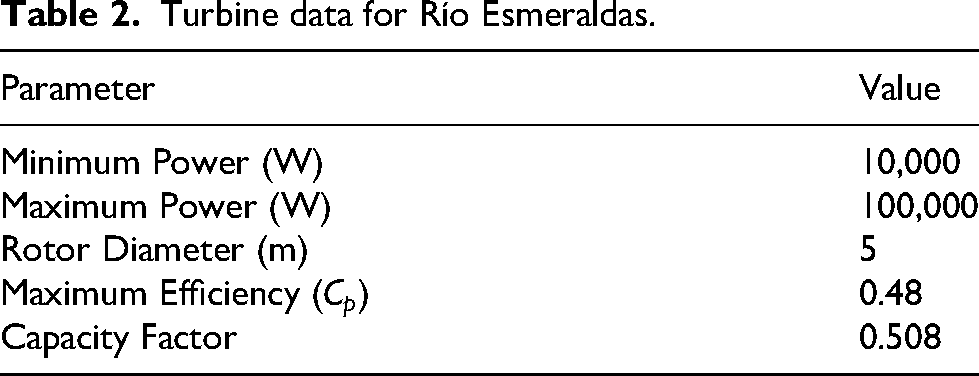
The Río Esmeraldas site demonstrates high hydrokinetic energy potential due to its stable flow regime. In this study, the effective flow rate incident on the turbine for a lateral channel is considered as 10% of the river’s total flow rate. The turbine characteristics and monthly energy production are presented in Tables 2 and 3, while Figure 13 illustrates the distribution of energy production throughout the year. The histogram highlights the seasonal nature of hydrokinetic potential, with the highest energy output observed during the first half of the year, reflecting the hydrological patterns of the Pacific watershed.
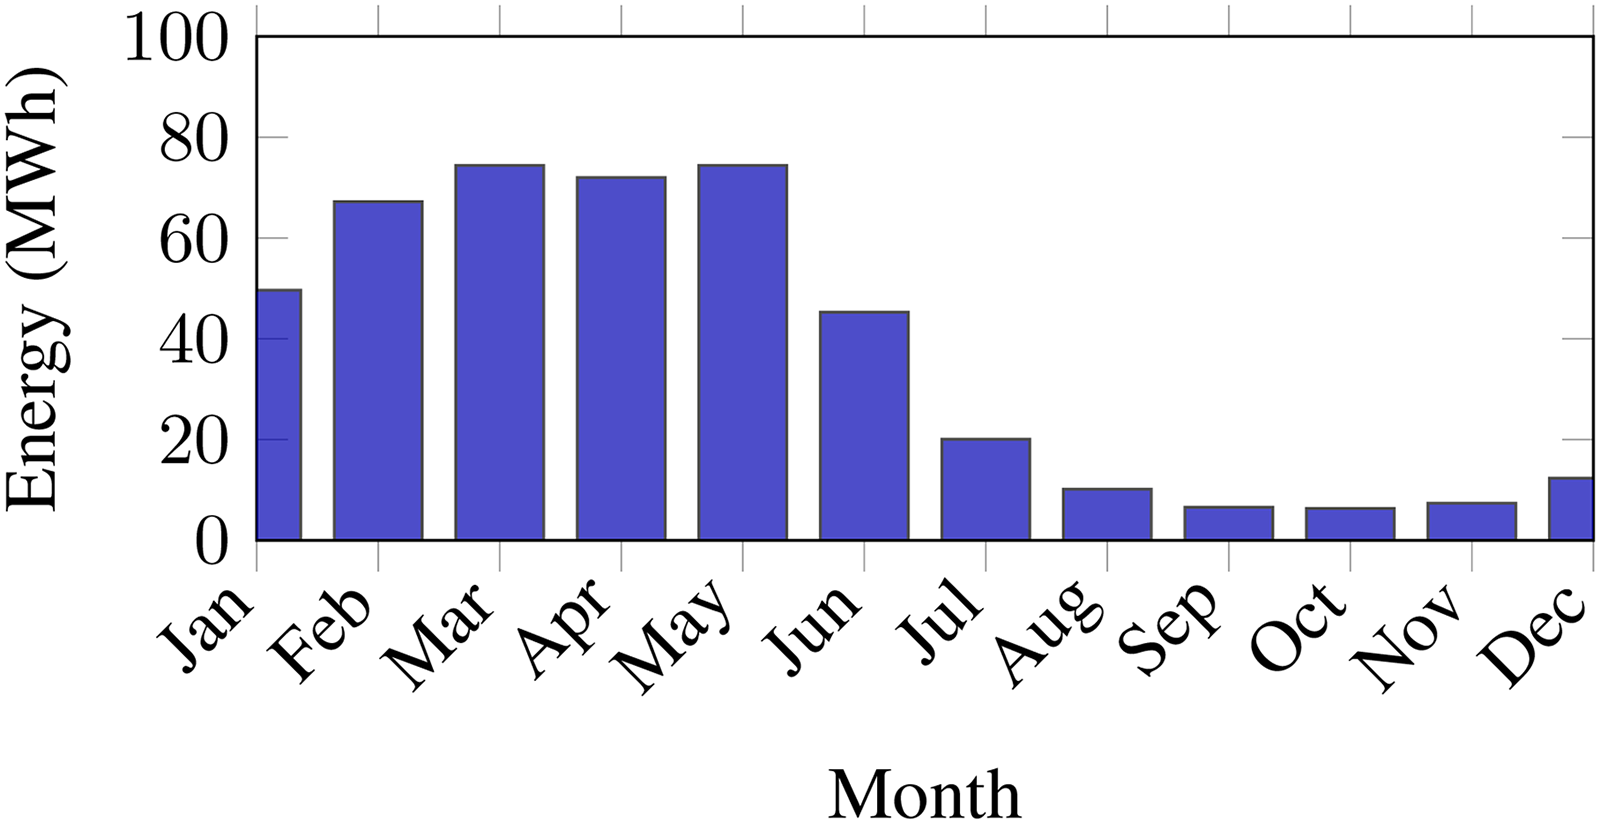
Monthly Energy Production for Río Esmeraldas.
Turbine data for Río Esmeraldas.
Monthly energy potential at Río Esmeraldas.

Energy Potential at Río Napo
Río Napo, a major river in the Amazon Basin, offers a significant hydrokinetic resource. In this study, the effective flow rate incident on the turbine for a lateral channel is considered as 10% of the river’s total flow rate. The turbine characteristics and monthly energy production are presented in Tables 4 and 5, while Figure 14 provides a visual representation of the seasonal variation in energy production. The peak hydrokinetic generation occurs in the middle of the year, consistent with the hydrological patterns of the Amazon Basin.

Monthly Energy Production for Río Napo.
Turbine data for Río Napo.

Monthly energy potential at Río Napo.

Comparison and analysis
The results indicate that Río Napo has a higher total annual energy production (1356.81 MWh) compared to Río Esmeraldas (445.72 MWh), mainly due to its larger flow rate and higher turbine power output. However, both sites demonstrate stable generation potential, with capacity factors of 0.774 for Río Napo and 0.508 for Río Esmeraldas, highlighting efficient energy conversion relative to their theoretical maximums. The seasonal hydrological patterns of these rivers reveal a complementary energy generation dynamic, where the Pacific Basin (Río Esmeraldas) reaches its peak hydrokinetic potential in the early months of the year, while the Amazon Basin (Río Napo) experiences maximum hydrological activity in the middle of the year. This temporal offset suggests that hydrokinetic generation from these two basins could contribute to a more balanced and diversified renewable energy supply throughout the year. Future research should focus on enhancing real-time monitoring of flow variability to improve energy production predictions, integrating hybrid renewable systems such as solar-HKT configurations to optimize output and grid stability, and conducting cost-benefit analyses to assess the economic feasibility and long-term sustainability of large-scale deployment. Additionally, field validation studies remain essential to confirm GIS-based site selection and optimize turbine placement strategies, ensuring that hydrokinetic resources are effectively harnessed in Ecuador’s renewable energy portfolio.
Conclusion
The results of this study confirm the viability of HKT as a renewable energy solution for electrification in hydrologically rich regions such as Ecuador. By integrating MCDA with GIS, this research provides a systematic and scalable framework for identifying optimal HKT deployment sites while considering technical, environmental, and socio-economic factors.
The selected sites, Río Esmeraldas and Río Napo, demonstrated significant hydrokinetic energy generation potential. The updated annual energy production estimates for these locations are 445.72 MWh for Río Esmeraldas and 1356.81 MWh for Río Napo. The capacity factors obtained—0.508 for Río Esmeraldas and 0.774 for Río Napo—indicate efficient energy conversion and stable generation potential, though with notable differences due to site-specific hydrological conditions. The complementary nature of energy generation from these two basins is particularly relevant: while Río Esmeraldas, part of the Pacific watershed, reaches its peak hydrokinetic production in the early months of the year, Río Napo, located in the Amazon Basin, experiences its maximum hydrological activity mid-year. This seasonal offset enhances the feasibility of integrating hydrokinetic power into Ecuador’s renewable energy matrix, reinforcing its role as a complementary source to existing hydropower, solar, and wind energy.
An advantage of the proposed methodology is its applicability to off-grid and rural electrification projects. Many remote communities in Ecuador remain underserved by traditional energy infrastructure due to the high costs and logistical challenges of grid expansion. Deploying HKT systems in suitable river locations offers a decentralized, low-impact solution to provide clean and continuous electricity, reducing reliance on fossil fuels and improving energy security in isolated regions. Additionally, the methodology developed in this study can be adapted to other countries with similar hydrological characteristics, allowing policymakers and energy planners to make data-driven decisions for sustainable energy development.
Despite its potential, the accuracy of the MCDA-GIS approach is inherently dependent on the reliability and recency of the geographic data utilized. The precision of the results is influenced by factors such as hydrological data accuracy, infrastructure mapping updates, and environmental constraints. Furthermore, field validation remains a crucial step in site selection to confirm GIS-based predictions, assess river flow conditions, and evaluate logistical feasibility before final project implementation. In practice, on-site inspections and hydrological monitoring are necessary to ensure the technical and economic viability of hydrokinetic deployments.
It is also important to acknowledge that the assignment of weights in the AHP process, while informed by expert knowledge and relevant literature, is inherently subjective and context-dependent. This subjectivity limits the generalizability of the weights used in this study to other national or regional contexts. Consequently, while a sensitivity analysis was not included in the present work to avoid diluting the clarity of the methodological demonstration, it is strongly recommended that future studies incorporate detailed sensitivity assessments. These should explore how variations in weight assignments affect the final suitability outputs and help to establish robustness in site selection outcomes. Such an enhancement would contribute to the methodological rigor of future HKT deployment frameworks.
Furthermore, the practical implementation of HKT systems may face technical and economic constraints that extend beyond the spatial suitability identified in this study. These may include access to electrical infrastructure, installation and maintenance costs in remote areas, sediment transport risks, and regulatory challenges. These barriers underscore the importance of integrating techno-economic feasibility analyses into future stages of planning to complement the spatial approach introduced here.
Although this study does not perform historical or field-based validation due to the absence of comparable site selection frameworks in the Ecuadorian context, a structured visual verification using satellite imagery was conducted to ensure consistency with hydrological and environmental constraints. The study also considers seasonal variability between basins, which influences annual generation patterns and supports the potential integration of HKT into hybrid renewable systems.
Given the promising results, it is also recommended that national energy policy frameworks explore the integration of HKT technology into rural electrification programs and long-term renewable energy strategies. Targeted incentives, technical guidelines, and investment frameworks would support the deployment of HKT in riverine areas, aligning with national sustainability goals and fostering inclusive energy access.
Future research directions
Several avenues for future work emerge from the present study. First, efforts should be made to incorporate real-time hydrological monitoring and dynamic flow modeling to enhance the accuracy of energy production estimates and enable more responsive site selection. Second, the integration of hybrid systems—particularly HKT combined with photovoltaic or battery storage—should be explored to ensure stable output and maximize renewable penetration in isolated grids. Third, economic feasibility analyses are necessary to evaluate lifecycle costs, return on investment, and financing models for rural deployment, especially in low-income or off-grid regions.
Fourth, the application of advanced validation techniques, including field-based hydrological measurements and stakeholder engagement, would strengthen the credibility of MCDA-GIS results and support the transition from planning to implementation. Fifth, future research may also consider the adoption of alternative decision-making frameworks such as PROMETHEE, ELECTRE, or fuzzy logic systems, which could provide enhanced flexibility in modeling complex trade-offs. Finally, improvements in geospatial data quality—including higher-resolution terrain models, regularly updated infrastructure maps, and integration of remote sensing—will play a crucial role in refining multicriteria models and supporting more nuanced energy planning decisions.
Footnotes
Acknowledgments
The authors thank the Universidad de Cuenca, Ecuador, for easing access to the facilities of the Micro-Grid Laboratory of the Faculty of Engineering, necessary to carry out the work described in this article. The results of this research document the partial findings of the project titled “Implicaciones energéticas de la transformación urbana en ciudades intermedias: Caso de estudio Cuenca-Ecuador,” winner of the Convocatoria Fondo I+D+i XIX, Project Code IDI No. 007, by Corporación Ecuatoriana para el Desarrollo de la Investigación y la Academia—CEDIA and cofinanced by the Vicerrectorado de Investigación e Innovación of the Universidad de Cuenca, Ecuador.
Funding
The author(s) received no financial support for the research, authorship, and/or publication of this article.
Declaration of conflicting interests
The author(s) declared no potential conflicts of interest with respect to the research, authorship, and/or publication of this article.