
Abstract
Landfilling is the main method to manage municipal solid waste (MSW) in Latin America due to the economic, technological and political characteristics of the region. The disposal of MSW in landfill sites may affect the quality of the environment and compromise a considerable share of the municipal budgets. The selection of suitable sites reduces the environmental and economic impact of landfills. In the present study the sustainable location index (SLI) is proposed as a methodology to assess environmentally, and economically, sanitary landfill site selection in the Metropolitan Area of Monterrey, a representative large-size city of Latin America. EVIAVE methodology was modified to include administrative and economic dimensions, which are assessed as a sustainable approach using together the SLI integrated with geospatial and multicriteria analysis tools. The assessment showed that the zones with the lowest SLI changes drastically when the importance of the economic or environmental factor varies. This result suggest that the inclusion of sustainability in landfill site selection decision-making is complex and it may requires the inclusion of local particularities such as municipal budgets, policies of MSW management and public perception about environmental deterioration.
Keywords
Introduction
The increase in the urbanization rate and the economic development are the main drivers in the growth of municipal solid waste (MSW) (Hoornweg and Bhada, 2012). Developing countries, with the areas with the fastest urbanization processes (United Nations, 2014), are expected to generate 2.52 billion tons of MSW in 2050 (Kaza et al., 2018). This will account for 66% of the MSW generation worldwide, with third-world countries generating close to double the amount of MSW with respect to 2016 figures (Kaza et al., 2018). The management of this imminent increase of MSW poses a challenge for cities around the world (Srivastava and Nema, 2012).
MSW management systems use different methods to handle waste. Regulatory agencies and legislative bodies, such as the Environmental Protection Agency (EPA, 2015) and European Council (UE, 2008) have hierarchized these methods from most to least environmentally preferred. Reduction, reusing and recycling are the top priority options. While, disposing MSW in landfills is the least recommended alternative.
Developing countries from regions such as Latin America struggle to follow the MSW management hierarchy. Latin American countries (LAC) manage most of their MSW in disposal sites (e.g., Argentina: 94%, Brazil: 91%, Chile: 94%, Colombia: 83%, Mexico: 95%), which in several cases are uncontrolled landfills (Kaza et al., 2018). Other waste management practices (i.e. recycling, anaerobic digestion, incineration) are still at a developing stage in LAC (Margallo et al., 2019).
The predominance of the landfill disposal in LAC is explained by several factors: (i) the relative low cost of landfilling. The capital cost of a landfill is 5–52 USD Mg−1 over its lifetime, while anaerobic digestion costs 220–660 USD y−1 Mg−1, and incineration costs 190–1000 USD y−1 Mg−1(Kaza et al., 2018). (ii) The presence of informal labour in several stages of the MSW management systems, specifically during collection and recycling. It has been reported that informal collection of valuable solid waste reaches 72% in some Mexican cities (Botello-Álvarez et al., 2018) and there are approximately 4 million informal waste pickers in the region (Grau et al., 2015). (iii) The lack of waste separation at the source. LAC generates MSW with around 50% of organic matter. However, the presence of other waste streams affects the compost process (Margallo et al., 2019). (iv) The lack of planning in the waste sector. It is estimated that only 19.8% of the municipalities in LAC have a solid waste management plan (Grau et al., 2015).
The disposal of MSW in landfill sites have economic and environmental impacts. Municipalities from developing countries expend on average 10% of their budgets in MSW management, where infrastructure investment, such as disposal sites, is one of the largest expenditures (Kaza et al., 2018). Landfills are the third largest contributors to methane emissions globally. It is projected that for 2030 landfills will emit 959 Mg CO2 eq−1 (EPA, 2013). The presence of landfill sites has also been correlated with the increase of respiratory, circulatory and nervous system disorders in the surrounding population (Latushkina et al., 2019). One study carried out by Rabl et al. (2008) found that the external cost of landfilling (i.e. economical cost for health and global warming impacts) were 13 € Mg−1 of MSW disposed.
The environmental and economic impacts from landfills can be minimized through a correct selection of their location (Afzali et al., 2014). Several studies proposed different factors to assess the land suitability for landfill location, the distance to surface water and distance to urban area being the most frequently evaluated (Donevska et al., 2021). Güler and Yomralıoğlu (2017) evaluated eight environmental and three economic criteria. They found that 2% of the area studied was suitable. Chabuk et al. (2017) assessed 15 factors such as land use, presence of oil and gas pipelines, urban infrastructure, among others. This study showed that depth of groundwater and distance to urban centres were the most important factors. Soroudi et al. (2018) evaluated socioeconomic, geological, physiography and edaphological criteria and concluded that urban infrastructure was the most significant factor. Other authors have focused on using different multicriteria decision analysis (MCDA) (e.g. analytical hierarchized process, weighted linear combination, analytical network process) combined with geographic information systems (GIS). Othman et al. (2021) assessed MCDA methods in the location of a landfill in Iraq, finding that suitability map for methodologies such as weighted linear combination and analytic hierarchy process were the more accurate and with similar results with a correlation factor (i.e. R2) between these methods of 0.6 . However these methodologies lacked rigorous assessment of the environmental and economic consequences to quantify the impacts and to ease the decision-making process in a sustainable way.
Methodologies of environmental impact assessment, such as life cycle assessment (LCA) have been used for landfill site selection in the past. For instance, Sumiani et al. (2009) compared potential areas to site landfills using LCA to identify the location with the lowest environmental impact due to MSW collection. These methodologies are evaluated from a global approach (e.g. global warming potential, acidification and eutrophication). Nevertheless, environmental impacts are influenced by the spatial distribution and different results may arise when local conditions are assessed (Cherubini et al., 2009).
Some methodologies have included the local conditions in the landfill site selection with more robust models that consider the quality and vulnerability of the environmental components from the location along with the site selection criteria. Santhosh and Sivakumar Babu (2018) incorporated the characteristics of the environmental components of groundwater and air in a landfill suitability assessment. However, other environmental spheres that can also be affected by the landfill (e.g. human health) were not evaluated in this methodology.
EVIAVE is a methodology that assesses the environmental impact of landfill location for five environmental components (i.e. surface water, groundwater, atmosphere, soil and human health) using the features of the landfill and the environmental characteristics of its location (Zamorano et al., 2005). EVIAVE was proposed by Calvo et al. (2005) as a tool for environmental diagnostic of active landfills. Zamorano et al (2008) adapted the methodology to a landfill siting tool and presented a case of study for a region of Spain. The study found that the atmosphere was the environmental component most affected by landfill location since the area assessed was located far from urban sites, making it very vulnerable to air contamination. Avelino et al. (2019) added administrative factors to the EVIAVE methodology to associate legal and technical factors that interfere with the site selection. However, this study assessed pre-established sites, not an entire region. In addition, these methodologies have not studied the influence of economic variables in landfill site selection.
The economic evaluation is a main factor for decision makers in MSW management (Reich, 2005). Its importance is linked to the high capital and operational costs associated with the implementation of methods such as landfilling (Moutavtchi et al., 2008). The economic impacts of landfill location may vary spatially. Therefore, these impacts can be evaluated using a spatial approach as well. The land cost fluctuates within a city, being very relevant for a suitable landfill site selection (Güler and Yomralıoğlu, 2017). Similarly, collection cost may represent 50–70% of the total cost of MSW management (Noche et al., 2010). This is especially important in LAC, where the cost of MSW management represents 11% of the municipal budgets (Kaza et al., 2018).
Previous studies have evaluated factors that influence the economic impacts of landfill siting. Gbanie et al. (2013) assessed land cost and distance to municipalities. They analyzed that construction costs were higher in locations with an elevation of 550 m, while the lower land costs were in zones below 200 m. Milosevic and Naunovic (2013) evaluated accessibility to local infrastructure, land cost and ownership relation of land as economic factors. They found land cost was one of the most important parameters, while the ownership of land was the least important factor. Nevertheless, all these studies assess these economic parameters via a multicriteria decision approach and lack a robust cost model for evaluating the economic factors.
There are few studies of landfill site selection for the Mexico context. Hernandez-Santiago et al. (2014) assessed with geospatial tools 26 municipalities from the southern part of Mexico, where they found 230 sites available for landfill siting. Marín et al. (2012) found that the available land to locate landfills in a state from the centre of Mexico was 4.3%, using Mexican guidelines. Despite these studies using GIS tools to assess the landfill site selection, they just focus on the normative evaluation. Environmental and economic assessment for landfill siting are still lacking in Mexico.
This study proposed the sustainable location index (SLI), a holistic tool for landfill site selection based on the EVIAVE methodology. The indicator couples in a rigorous way normative, environmental and economic assessment with spatial analysis, achieving a novel approach for landfill site selections and facilitating sustainable decision-making. The economic dimension added to the EVIAVE gives an integral methodology to locate landfills in Latin American metropolitan areas from a sustainable approach, employing GIS tools and MCDA.
Methodology
Description of the area of study
The Metropolitan Area of Monterrey (MAM) is the most important urban centre in the northeast of Mexico. It is located in the state of Nuevo Leon (EPSG:4326 WGS 84-25°40′30″ N, 100°19′06″ W). MAM comprises 12 municipalities, shown in Figure 1, with an area of around 7500 km2 and a population of 4,689,601 inhabitants in 2015 (SEDATU et al., 2015). However, neighbouring municipalities were assessed on the landfill site selection process, since MAM is an urban area with fast urbanization and municipality integration processes.
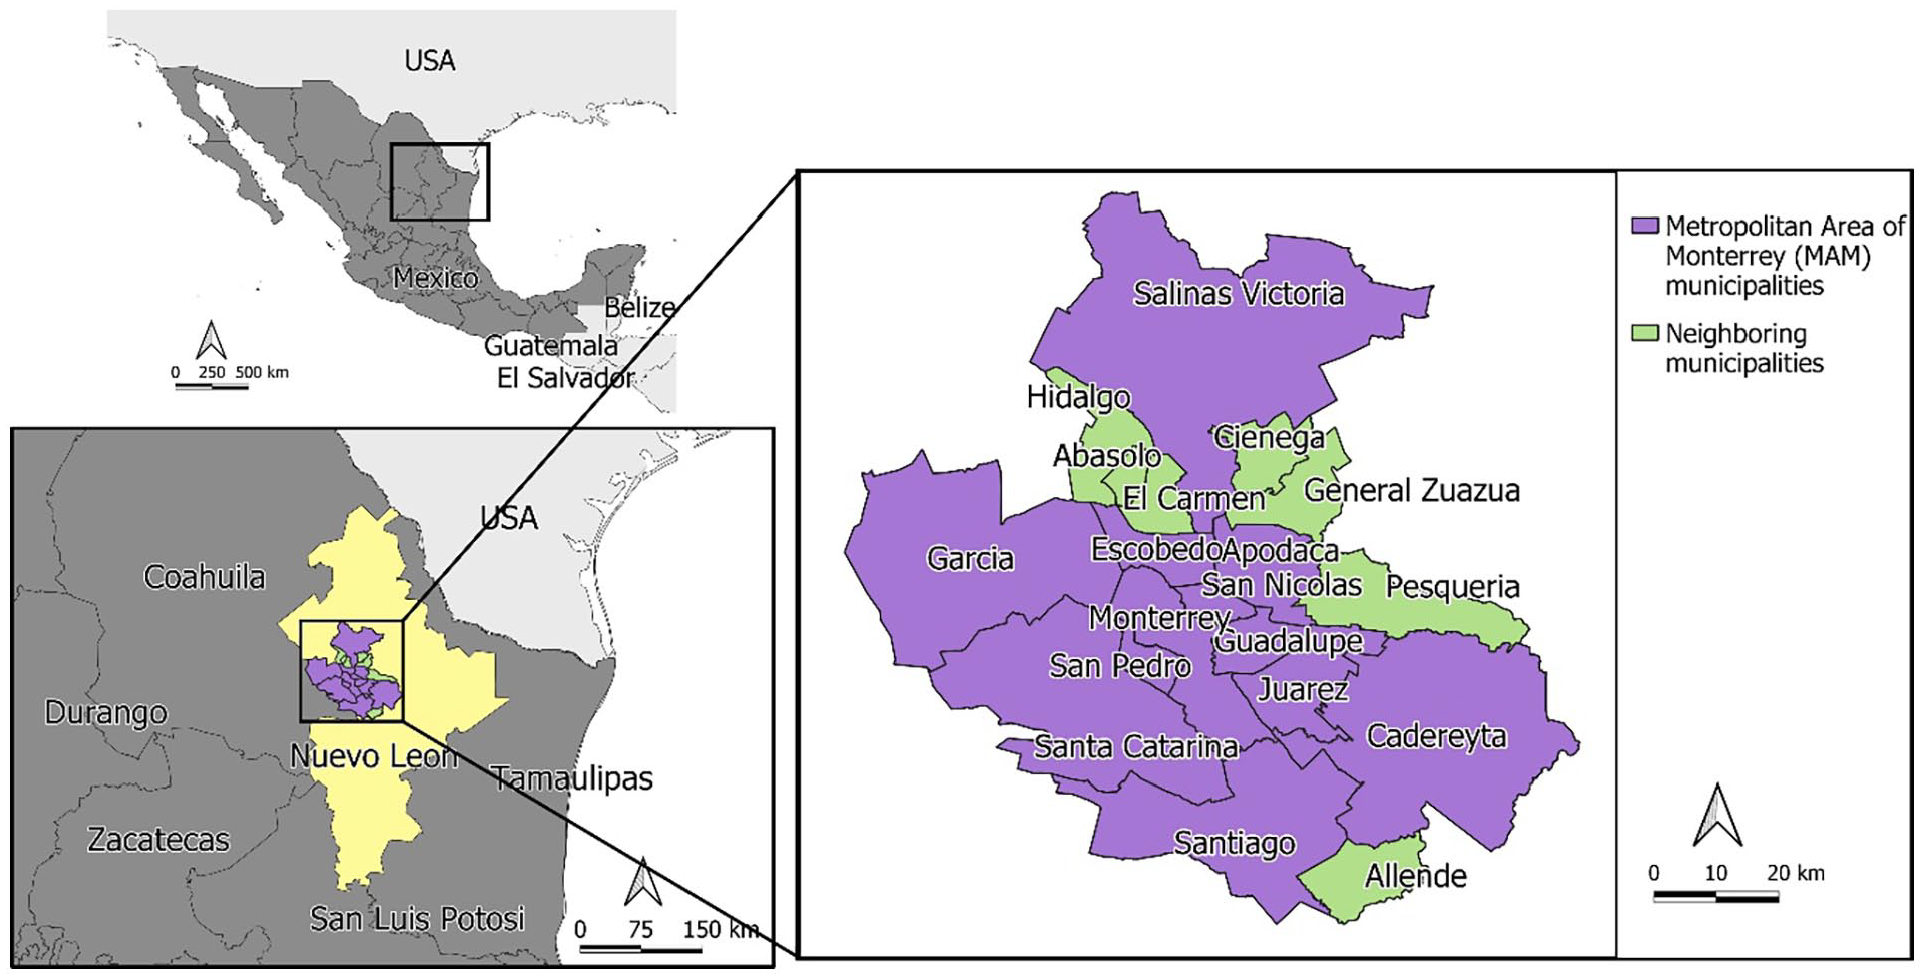
Location of the MAM.
The climate of MAM is arid and semiarid with a precipitation of 300–600 mm (INAFED, 2010). Xerophytic scrubs are the main type of vegetation in the zone (INEGI, 2017). Most water bodies are seasonal and the region presents water stress due to being the second zone in Mexico with less renewable water per capita (CONAGUA, 2017). The MAM is the fourth city in Mexico with the highest concentration of PM10 and PM2.5 (INECC, 2020). The air pollution is related to traffic, industrial activities and open mining (González et al., 2011).
MAM is the second metropolitan area of Mexico (INEGI, 2014), with the highest per capita income, accounting for 9% of the Mexican Gross Domestic Product (IMCO, 2017). The service sector is the main economic driver in MAM, with 62%, followed by the industrial sector, with 37.5% (INEGI, 2016).
EVIAVE methodology
EVIAVE methodology was used as the base to develop the SLI. The original methodology considered a hierarchized model of four levels. In each level, a set of environmental indices are calculated to finally get one global environmental impact index (i.e. Environmental Landfill Index). This work included two more dimensions: administrative, as it was proposed by Avelino et al. (2019), and economic. A fifth level was included to assess the administrative, environmental and economic factors in a holistic indicator: the SLI. Three approaches were assessed to consider different realities of cities. The hierarchical structure is shown in Figure 2.
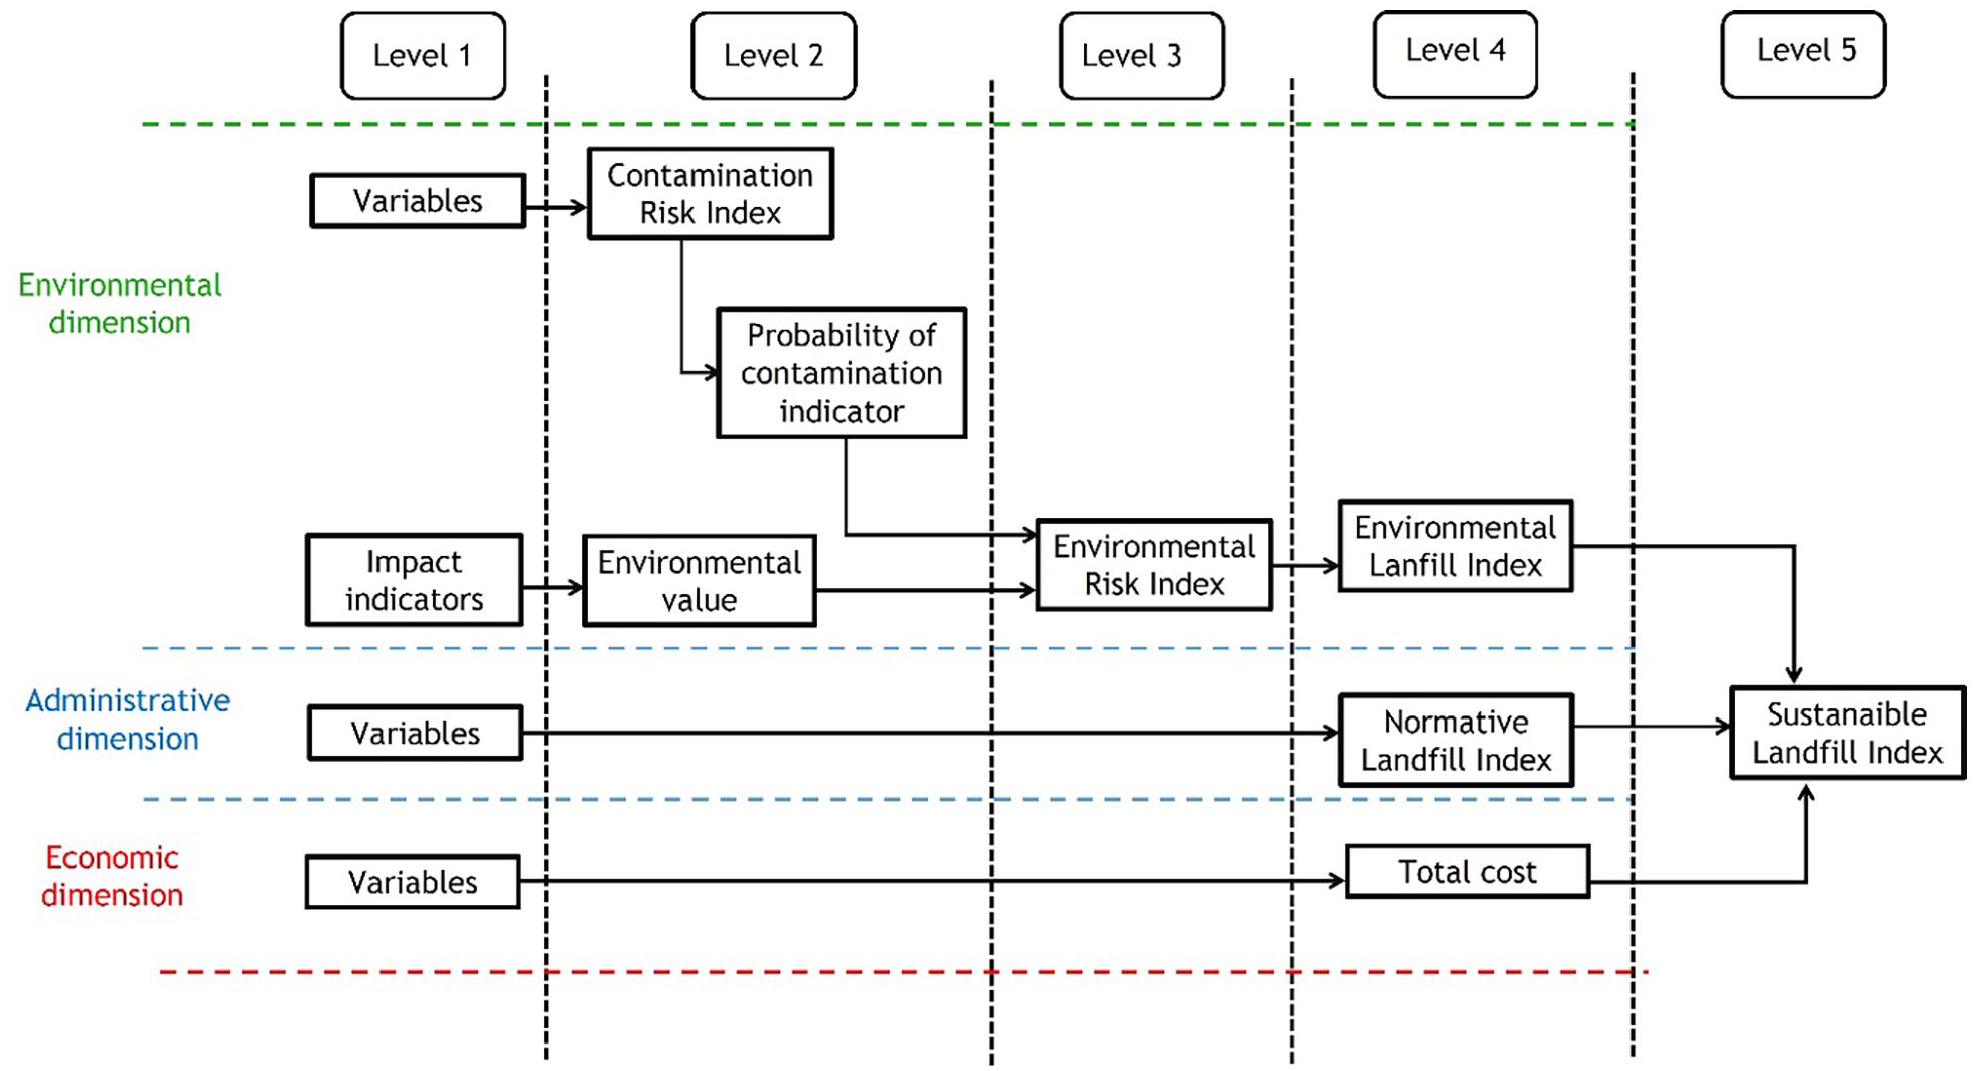
Modified scheme of EVIAVE methodology.
Data acquisition
Geographic, geological, hydrogeological and census information were collected in a vector GIS and raster format from governmental agencies such as INEGI (National Institute of Geography and Statistics), CONAGUA (Water National Commission) and CONABIO (National Commission for Knowledge and Use of Biodiversity). This data was used to build a spatial model with EVIAVE methodology using the GIS software QGIS 3.10 (QGIS Development Team, 2019). Metadata about the spatial information which include year, scale and source is shown in Supplemental Table S1.
Environmental dimension
The environmental dimension assesses the impact caused by landfill location to five environmental components (i.e. surface water, ground water, atmosphere, soil and health), as it was proposed by Zamorano et al. (2008)
Level 1
Variables. Variables are the characteristics that affect an environmental impact of different environmental components (Garrido, 2008). EVIAVE considers 12 variables related to landfill location. These variables can affect the five environmental components (i.e. groundwater, surface water, atmosphere, soil and health), and are shown in Supplemental Table S2. Variables for landfilling operations were not studied as they are not related to landfill site selection.
Every variable had a classification from one to five based on their spatial condition, as suggested in EVIAVE. Lower classification represented a condition with low environmental impact, while higher classifications were for variables with a high environmental burden. Supplemental Tables S3 to S15 shows the classification for each variable, which were adapted for this study from Garrido (2008). Raster maps were made for each variable to evaluate all the areas of study. Each raster map had a pixel size of 100 × 100 m. This resolution was chosen for the size of the study area (i.e. more than 7000 km2) and the size of the landfill (i.e. 4000 t d−1of MSW). A value of one to five was assigned to each pixel of all the maps.
Impact indicators. Impact indicators are the environmental aspect that can be affected by the landfill location (Arrieta et al., 2016). Impact indicators are used to calculate the environmental values (eVs). Supplemental Table S16 show the environmental impacts for all the environmental components with the exception of health which is always considered as the maximum value. The value of impact indicator was 1–5, in which high values represented zones with high vulnerability to landfill location. Raster maps for each impact indicator were made with the same characteristics of variables.
Contamination risk index. The contamination risk index (CRI) is a factor used to classify and weigh the potential affectation to the variables of the environmental components (Garrido, 2008). The CRI is calculated using equation (1), where C is the classification of the variable, w is the weighting of the variable with respect to the environmental component and subscript j refers to the variable. The value of w considers the level of potential affectation of each variable of the landfill to the environmental and structural elements (i.e. organic matter, humidity and waste density). w ranges from 0 to 2; where w = 0, when the variable is not related with the environmental element; w = 1, when the variable is not related to any structural element and it is indirectly related with the environmental component; and w = 2, when the variable is related with a structural element or it is directly related with the environmental component (Zamorano et al., 2008). Supplemental Table S17 shows the weights for each variable.

Level 2
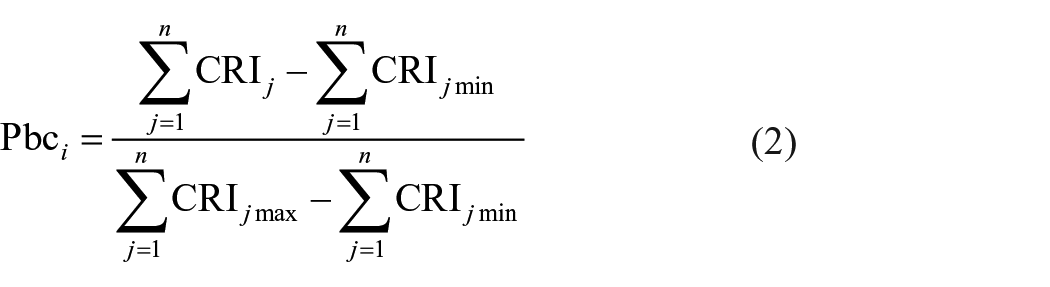
Probability of contamination indicator. The probability of contamination indicator (Pbc) evaluates how the landfill location in a geographic point may cause environmental impacts to the different environmental components (Garrido, 2008). Equation (2) describes the calculation of Pbc, where CRI j is the contamination risk index of the variable j, CRIj min is the minimum contamination risk index that each variable can obtain, CRIj max is the maximum contamination risk index that each variable can obtain and Pbc i is the probability of contamination indicator of the environmental component i. A map was made with the Pbc for each environmental component.
Environmental value. The eV is a factor used to define quantitatively the characterictics of the environmental components in the potentional location of the landfill (Paolini et al., 2008). Supplemental Table S18 shows a summary of the equations used to calculate the eV for each environmental component. The eV for health is always the maximum, since health is also affected by the state of the other environmental components.
Level 3
Environmental risk index. The environmental risk index (ERI) assesses the potential environmental impact due to the interaction between the landfill and its environment (Garrido, 2008). Equation (3) shows the compute of ERI, which Pbc i is the probability of contamination indicator of the environmental component i, and eV is the environmental value. An ERI map was made for each environmental component.

Level 4
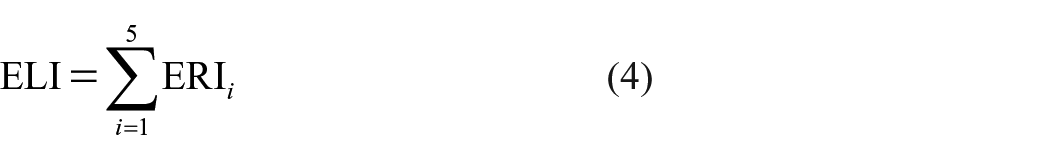
Environmental landfill index. The environmental landfill index (ELI) expresses the environmental interaction between the potential environmental impacts which are caused by the landfill and the environmental components (Garrido, 2008). Equation (4) describes the calculation of the ELI, where ERI i is the environmental risk index of the environmental component i. ELI was spatially represented with a single map.
Administrative dimension
Level 1
Variables. The variables of the administrative dimension depends on the normative restrictions to locate landfills. Guidelines from five LAC (i.e. Argentina, Brazil, Chile, Colombia and Mexico) were compiled to consider the normative context of the region. Guidelines from developed countries (e.g. European Union countries or United States) were not considered since their waste management policies are focused into not opening new landfills, and reducing organic matter disposal into the landfills (European Parliament, 2018). The variables (i.e. compiled constraints) are shown in Supplemental Table S19.
Level 4
Administration Landfill Index. Buffer zones with a radius equal to the most restrictive normative for each criterion showed in Supplemental Table S19 were created and overlapped following the methodology proposed by Marín et al. (2012). Equation (5) represents the mathematical expression of this spatial assessment, where Ar means the restricted area, ci represents the criterion i and di is the distance of the buffer. The restriction of distance to urban centres was assessed considering the projected urban growth of the MAM until 2050, in accordance with a prior study (Rueda-Avellaneda, 2019).
The available area according to administrative restrictions was assessed via Boolean logic. As it was proposed by Baiocchi et al. (2014), a binary map was carried out. Values of 0 were considered for the Ar while values of 1 otherwise.
Economic dimension
Level 1
Variables. The SL construction costs and MSW collection costs were the variables used to evaluate the economic impact of the SL location. Initial construction was assessed using a cost model proposed by (Thorneloe, 2000). Supplemental Table S20 shows the parameters used for each stage of landfill construction. The cost of land was supposed to be the only variable that changes spatially. Cadastral information was used to assess the cost of land. A raster map with the unitary cost of initial construction of a landfill for the area of study was built using cadastral information.
The other economic variable assessed was collection costs of MSW. The studied area were divided in a grid with a cell size of 1 km2. The distances that waste collection units would have to travel from the centres of the municipalities to each 1 km2 cell were spatially assessed using the shapefile of the roads (Supplemental Table S1) and network analysis (i.e. shortest path algorithm in Qgis). Finally, the unitary cost of MSW transport per kilometer was used to build a raster map with the collection cost for each cell.
The maps of landfill construction costs and MSW collection costs were added in the software QGIS 3.10. One raster map with construction and collection costs (Ct) was obtained.
Level 5
Sustainable location index. The SLI is based on a multicriteria decision-making method, the simple additive weighting. This MCDA evaluates the contribution of two or more factors to make the decision on the selection of the areas with the lowest environmental and economic impact. The results of environmental and economic dimensions (i.e. ELI and Ct) were normalized using equations (6) and (7), where ELInorm and
The SLI can quantify the environmental and the economic impact of landfill location and ranges from 0 to 1. Equation (8) shows the mathematic expression of SLI, where wamb is the environmental criterion weight, ELInorm is the normalized environmental landfill index, wecon is the economic criterion weight and
The SLI classification was divided into the following five categories, similarly to EVIAVE, very low (SLI < 0.2), low (0.2 ≦ SLI < 0.4), medium (0.4 ≦ SLI < 0.6), high (0.4 ≦ SLI < 0.8) and very high (0.8 ≦ SLI < 1).

The map of SLI was overlapped with the administrative landfill index map, using Boolean logic, to exclusively obtain the SLI for available areas.
Effect of the weight of economic and environmental dimension
Three scenarios were proposed to evaluate the effect of the weighting in landfill site selection. The scenarios were defined as environmental approach (e.i wamb = 0.75, wecon = 0.25), economic approach (e.i. wamb = 0.25, wecon = 0.75) and egalitarian approach (e.i. wamb = 0.5, wecon = 0.5) as it was suggested by Eskandari et al. (2012). One map for each approach was developed. For each area that was found as very low impact, its SLI pixel value was averaged to determine significant differences among areas and to select the zones with the lowest environmental and economic impact.
Results and discussions
Environmental dimension
Figure 3 shows the ERI of the MAM for the different environmental components, which is the level 3 of the EVIAVE methodology. The ERI for surface water (Figure 3(a)) shows that areas with the highest environmental (labelled red and yellow) impact to this component are in the south of the area of study. These zones are in the region with the highest precipitation of the MAM. In addition, they are near to a mountain chain (i.e. Sierra Madre Oriental) and main water bodies (e.g. Presa La Boca, i.e. an important water supply for the MAM). Locating landfills in these sites may cause environmental impact due to the high slopes of the hills and the soil with low infiltration may ease the runoff of leachates and their interaction with water masses located in areas of great ecological importance. Increase of NH4+-N, and dissolved organic carbon levels associated to leachate runoff for rainfalls had been reported in water bodies near to controlled landfill sites (Yusof et al., 2009).
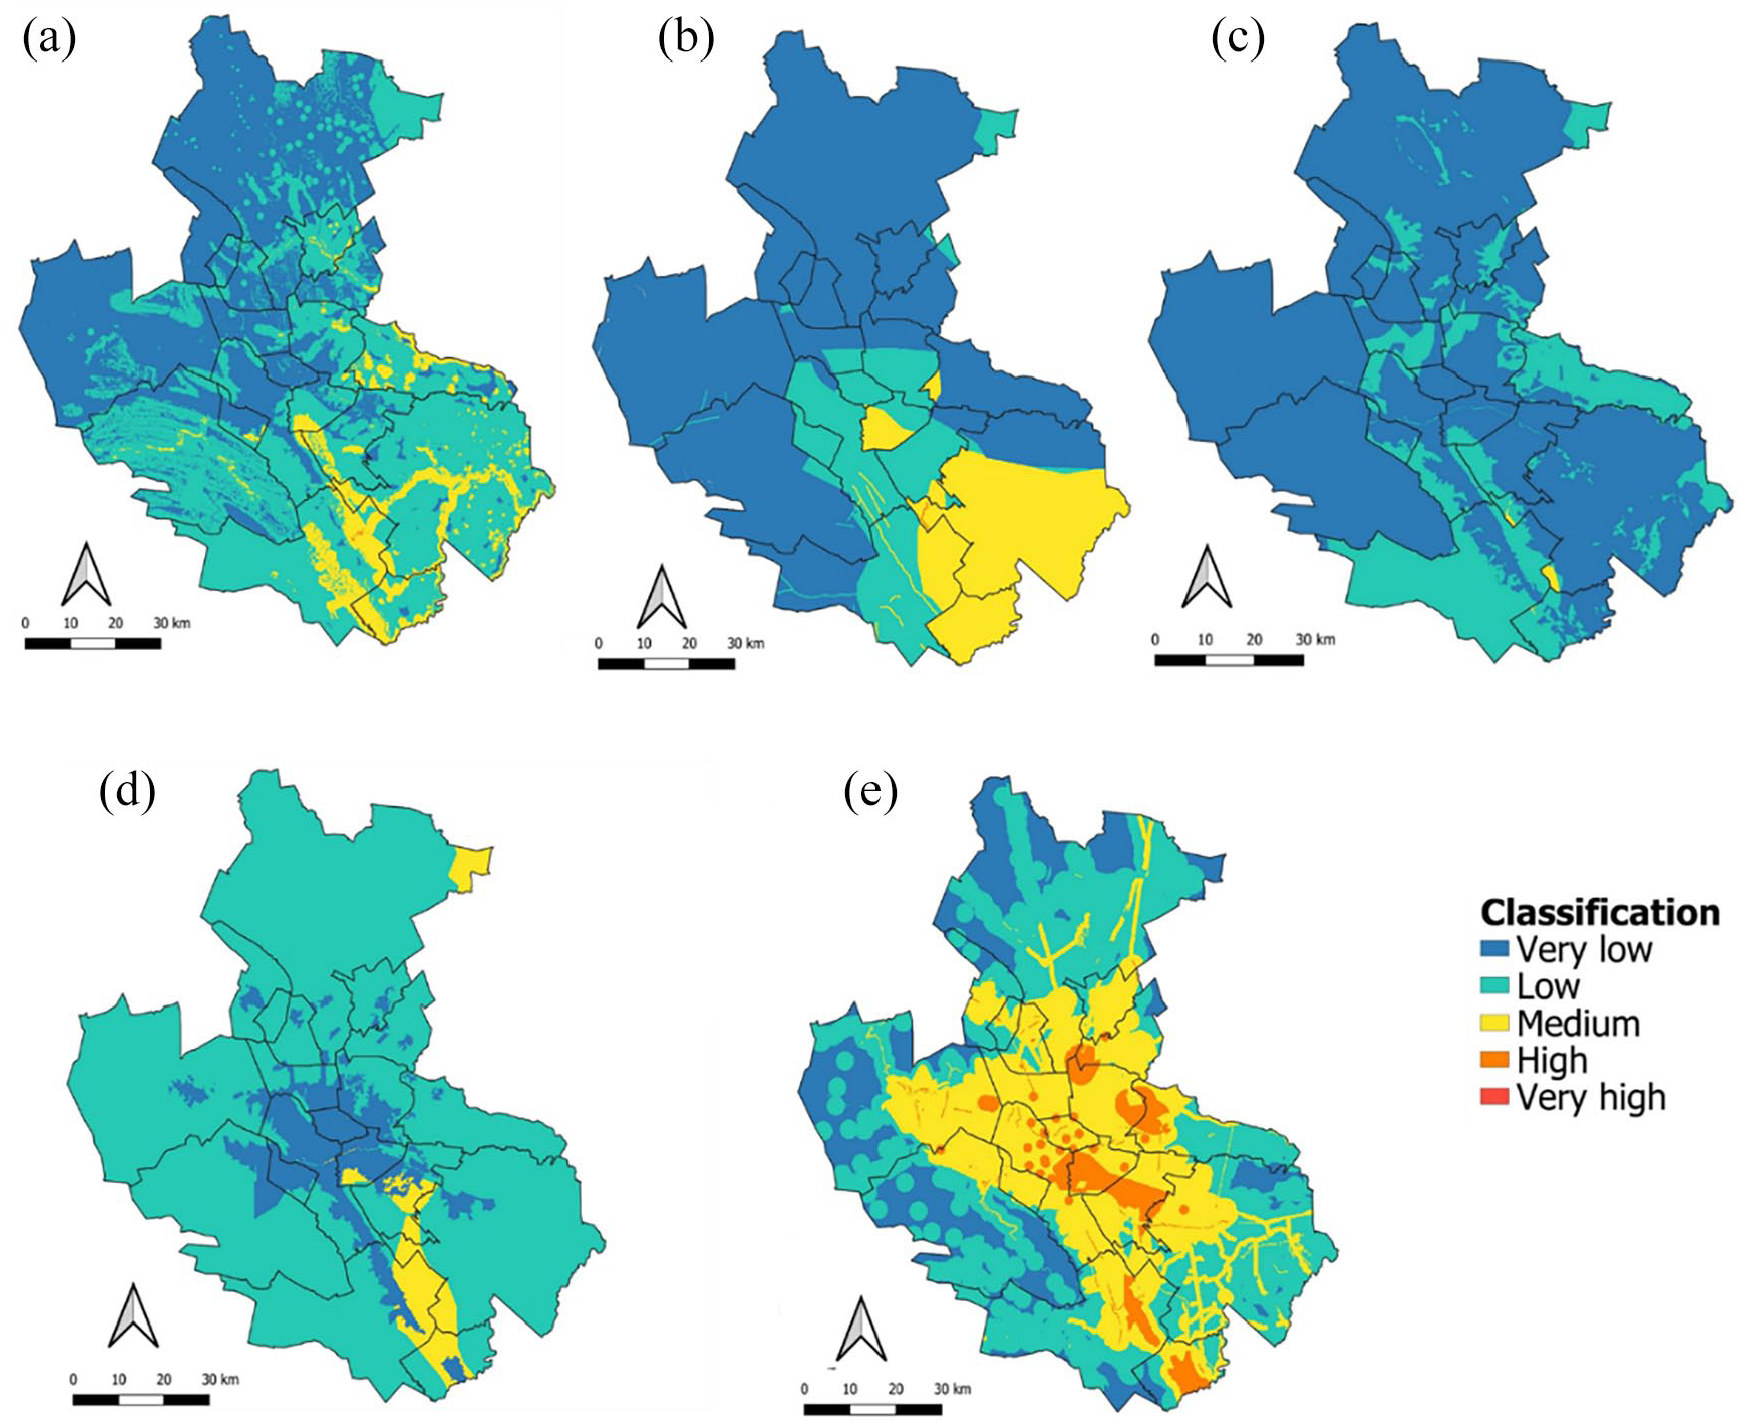
Environmental landfill index for landfill location in the MAM: (a) surface water, (b) ground water, (c) soil, (d) atmosphere and (e) health.
Figure 3(b) shows the ERI for groundwater. The areas with the highest impact (labelled in yellow and red) are located in the south east of the MAM. This zone is classified as medium level of vulnerability due to the geological characteristics from the aquifer. The presence of geologic faults increase the environmental risk due to the leaking out of the leachates that can use the fault as preferential flow channel (Garrido, 2008). Contamination of groundwater for landfill leachate have been detected in groundwater depth of 4–14 m (Parhusip et al., 2017).
Figure 3(c) shows the ERI for soil. The highest environmental risk for this environmental component was identified in the eastern region of the MAM. These areas have soils susceptible to erosion. Erosion is one of the main problems that deteriorate the cover landfill system (Shaikh et al., 2019). In addition, this region is more prone to flooding, which increase the runoff of the leachate and the environmental impact of the soil.
Figure 3(d) shows the ERI for atmosphere in the MAM. The areas with the highest environmental risk to atmosphere were in the south of the MAM and a portion in the northeast (labelled in yellow). These areas have more precipitations than the rest of the MAM. The pluviometry is one of the main factors in the landfill gas generation. More humid landfills produce more landfill gas since water is a medium of transport for the bacteria and nutrients (Aguilar-Virgen et al., 2011). The emission of the landfill gas affects the air quality. Furthermore, these zones are comprised of non-urban areas. The selection of these sites may cause environmental damage to zones with good air quality.
Figure 3(e) represents the ERI to health in the area of study. The highest environmental risk to human health was found in the central part of MAM. This result is explained by the urban sprawl and the presence of urban infrastructure (e.g. airports, aerodrome or electrical station). The very low ERI was found in the northern and western regions. This result is associated with the lack of urban centres, which reduces the social rejection of the landfill.
Table 1 presents the percentage of land allocated to each ERI classification for the five environmental components in the MAM, where human health is the environmental component with more risk of affectation. The high potential impact to health (5.8% of the territory) is explained by the fast urbanization process and the industrialization level of the MAM. These results are in accord with other EVIAVE methodology implementation in LAC such as Venezuela (Paolini et al., 2008) and Colombia (Arrieta et al., 2016). The lack of areas classified as very high was due to the climatic conditions of aridness and the poor conditions of some environmental components such as atmosphere and soil. For instance, the MAM is the city with the worst air quality in Mexico (INECC, 2014) and the vegetation cover in large areas of the MAM is less than 10% (Merla-Rodríguez, 1990).
Classification of the land of MAM for the ERI for different environmental components.
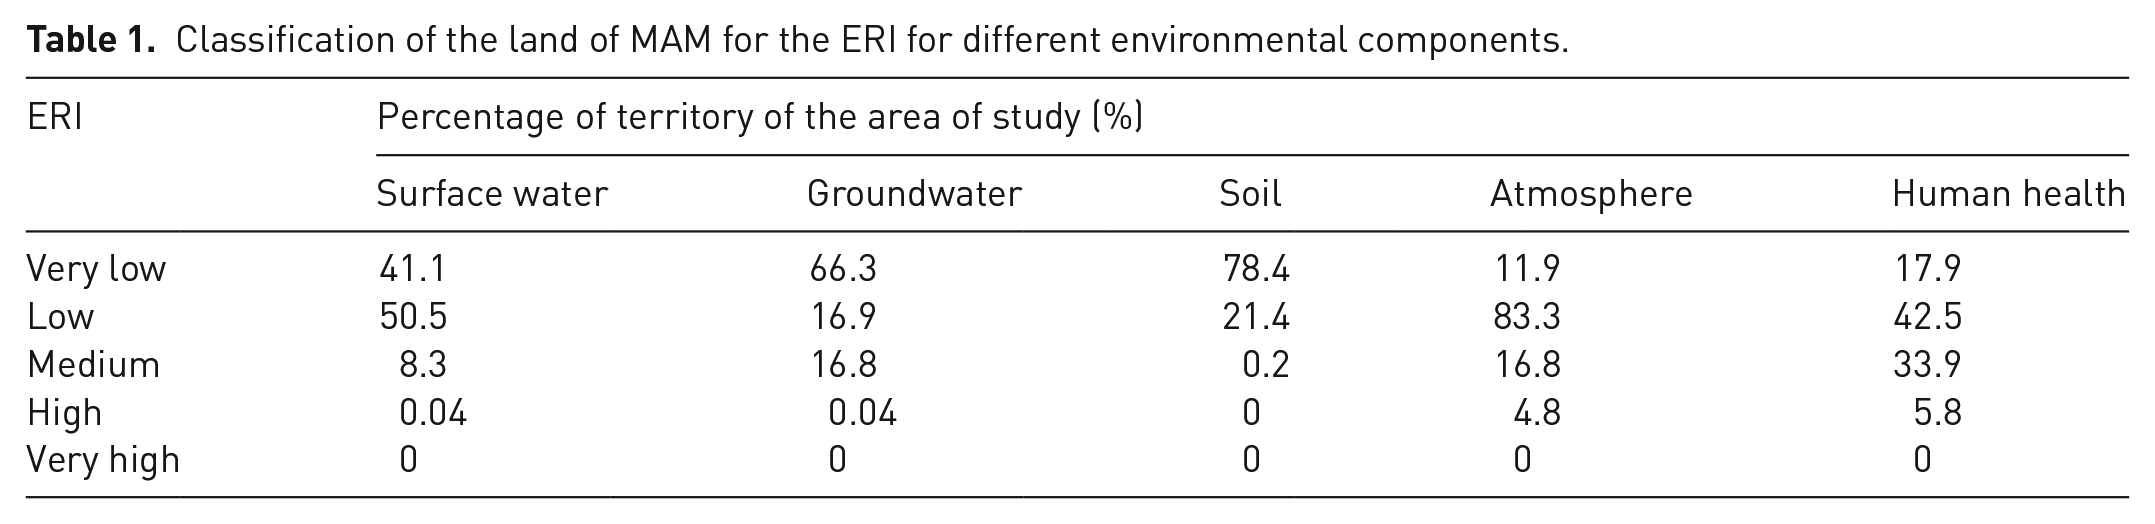
Figure 4 shows the single score indicator of ELI for the available areas to site landfills in the MAM. Low and very low classification of ELI was obtained for all the available land to locate a landfill. These results show the first legal restrictions screening was a useful tool to discard areas with high environmental impact. However, the legal restriction screening fails to qualify the suitability of the available area from an environmental or economic approach. This situation represents a problem for a rigorous decision-making process, since large extensions of available land are considered with the same suitability, despite that their different characteristics can pose an environmental and economic impact for landfill location. Furthermore, siting a landfill based just in normative restrictions, may cause rejection from population to the landfill. For instance, Simsek et al. (2014) found that considering variables related to social rejection such as visibility, odours, distance to urban centres, traffic load and aesthetic issues can reduce up to 80% of the available sites to locate landfills.
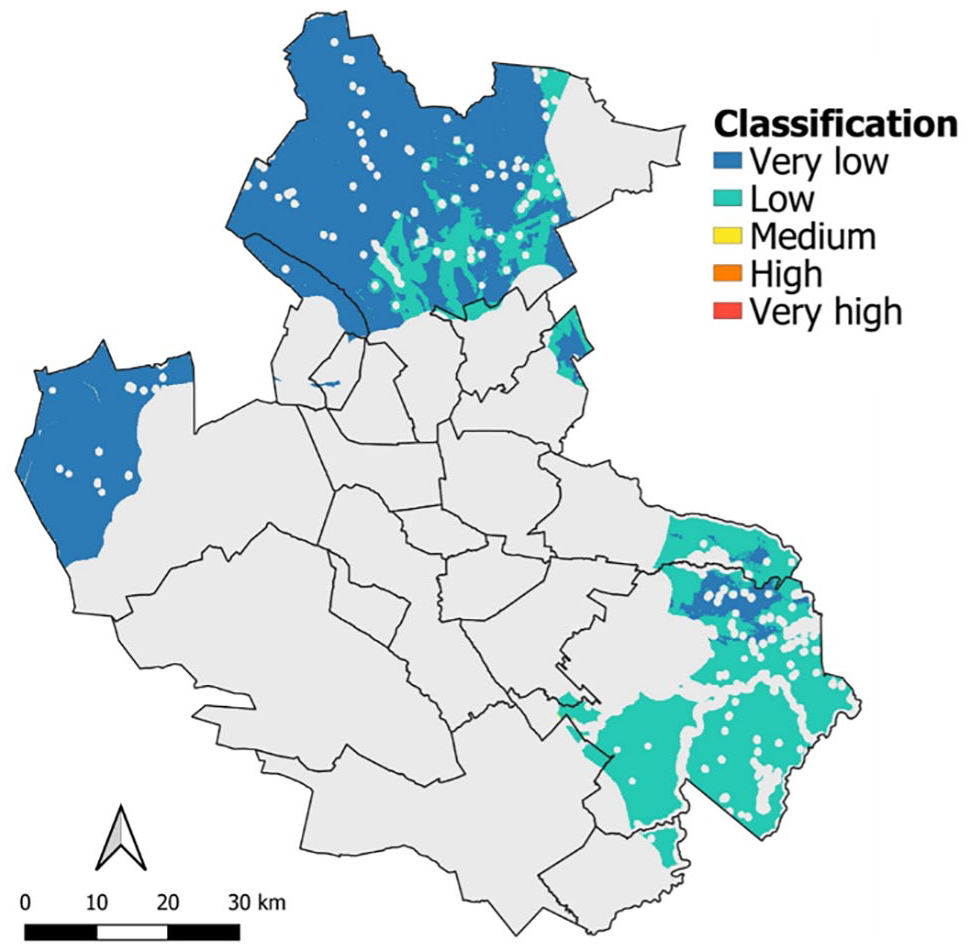
ELI of the available areas to site landfill in the MAM.
The lowest value of ELI was found in the northern and western regions of the MAM. There, the lack of water bodies, human settlements and mountain chains reduce the potential environmental impact for siting landfills. The total land classified with very low ELI was 1518 km2. This territory represents 19.5% of the area of study. ELI values between 1.74 and 10.3 were obtained in the area of study. These values are in the classification ranges of very low and medium. Previous studies presented similar values for the highest ELI (11.2), while the lowest ELI was higher (5.2) (Zamorano et al., 2008).
Normative dimension
Seven legal regulations to allocate landfill were chosen and they are summarized in Table 2. From this data, it can be seen that some of the strictest regulations are from Brazil and Colombia. This may be explained by the fact that Colombia and Brazil are two of the most biodiverse countries in the world (Silva, 2005), and that their solid waste management policies are based on the environmental principles of developed countries (Cetrulo et al., 2018).
Criteria and restriction value considered in the landfill site selection study.
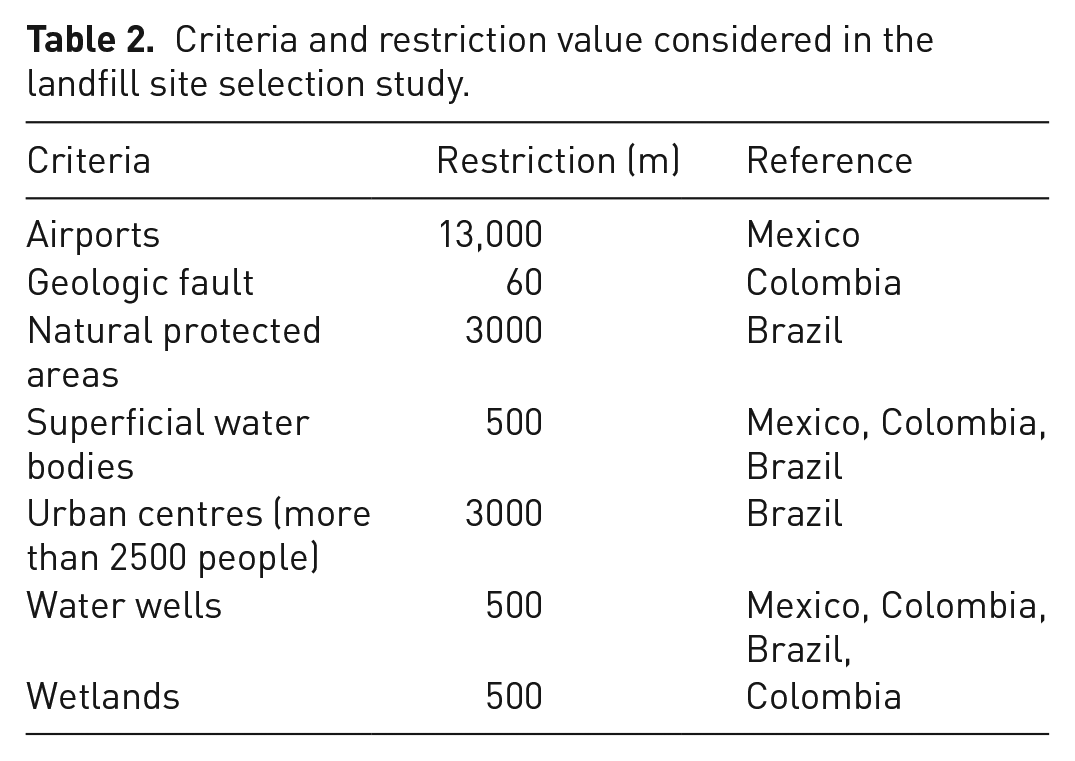
Figure 5 shows the available areas to locate landfills according to normative assessment. There are three main zones to site landfills, which are located in the periphery of the area of study. The available land represents 31.0% from the area of study. It is noteworthy that if the assessment just considered the municipalities of the MAM (i.e. without considering neighbouring municipalities) the portion of available land will remain practically the same (31.5%). This can be explained since distance from urban centres was the criterion with the largest exclusion area, blocking up to 42% from the studied area.
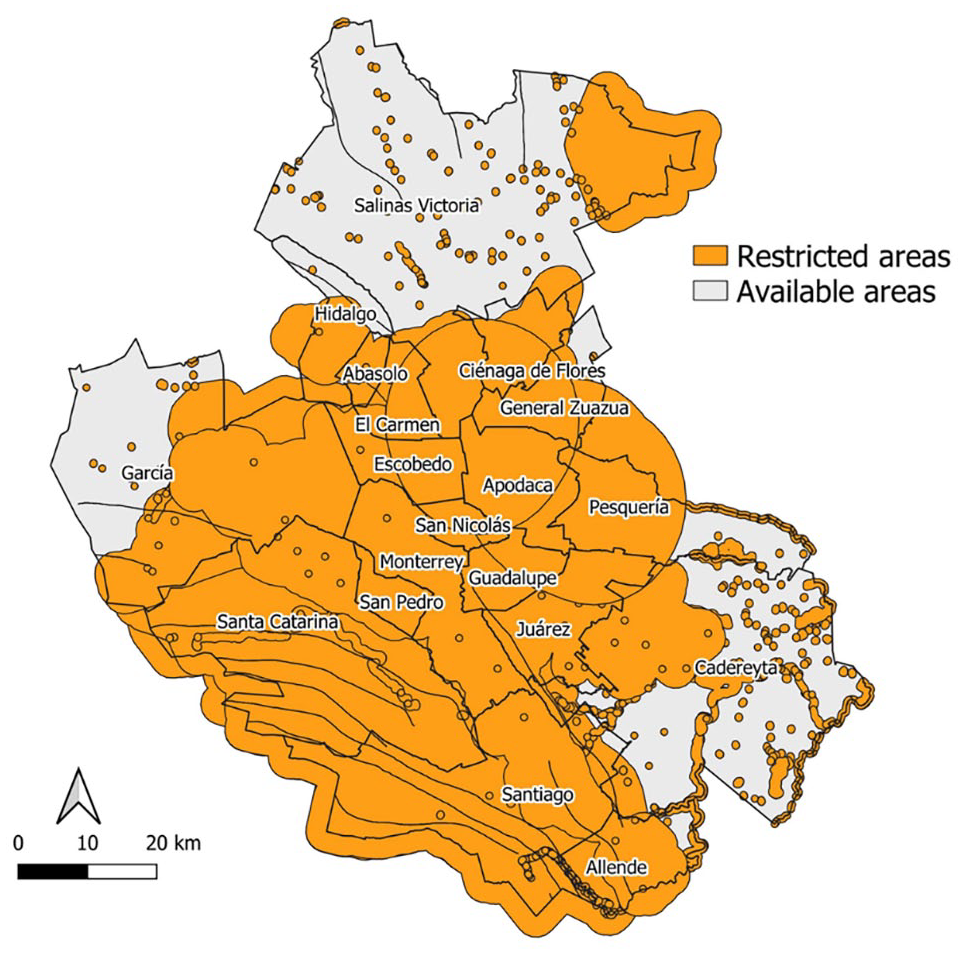
Restricted and available areas.
Economic dimension
Figure 6(a) shows the map of landfill construction cost for the MAM. The highest value (49.95 MXN Mg−1 MSW) was located in the municipalities of San Pedro and San Nicolas. These municipalities are main centres of the economic development of the MAM. San Pedro and San Nicolas account for almost 20% of the jobs in the MAM (INEGI, 2015) and they have been considered in the top four of cities with the greatest quality of life in Mexico (Gabinete de comunicación estratégica, 2019). These characteristics and the lack of space to expand inside them explain the high cost of the land of these municipalities. The lowest value (29.98 MXN Mg−1 MSW) was obtained in the northern municipalities (e.g. Salinas Victoria, Abasolo, Cienega de Flores, El Carmen and General Zuazua). The low construction cost in this area may relate to the low economic development of these municipalities (INEGI, 2015).
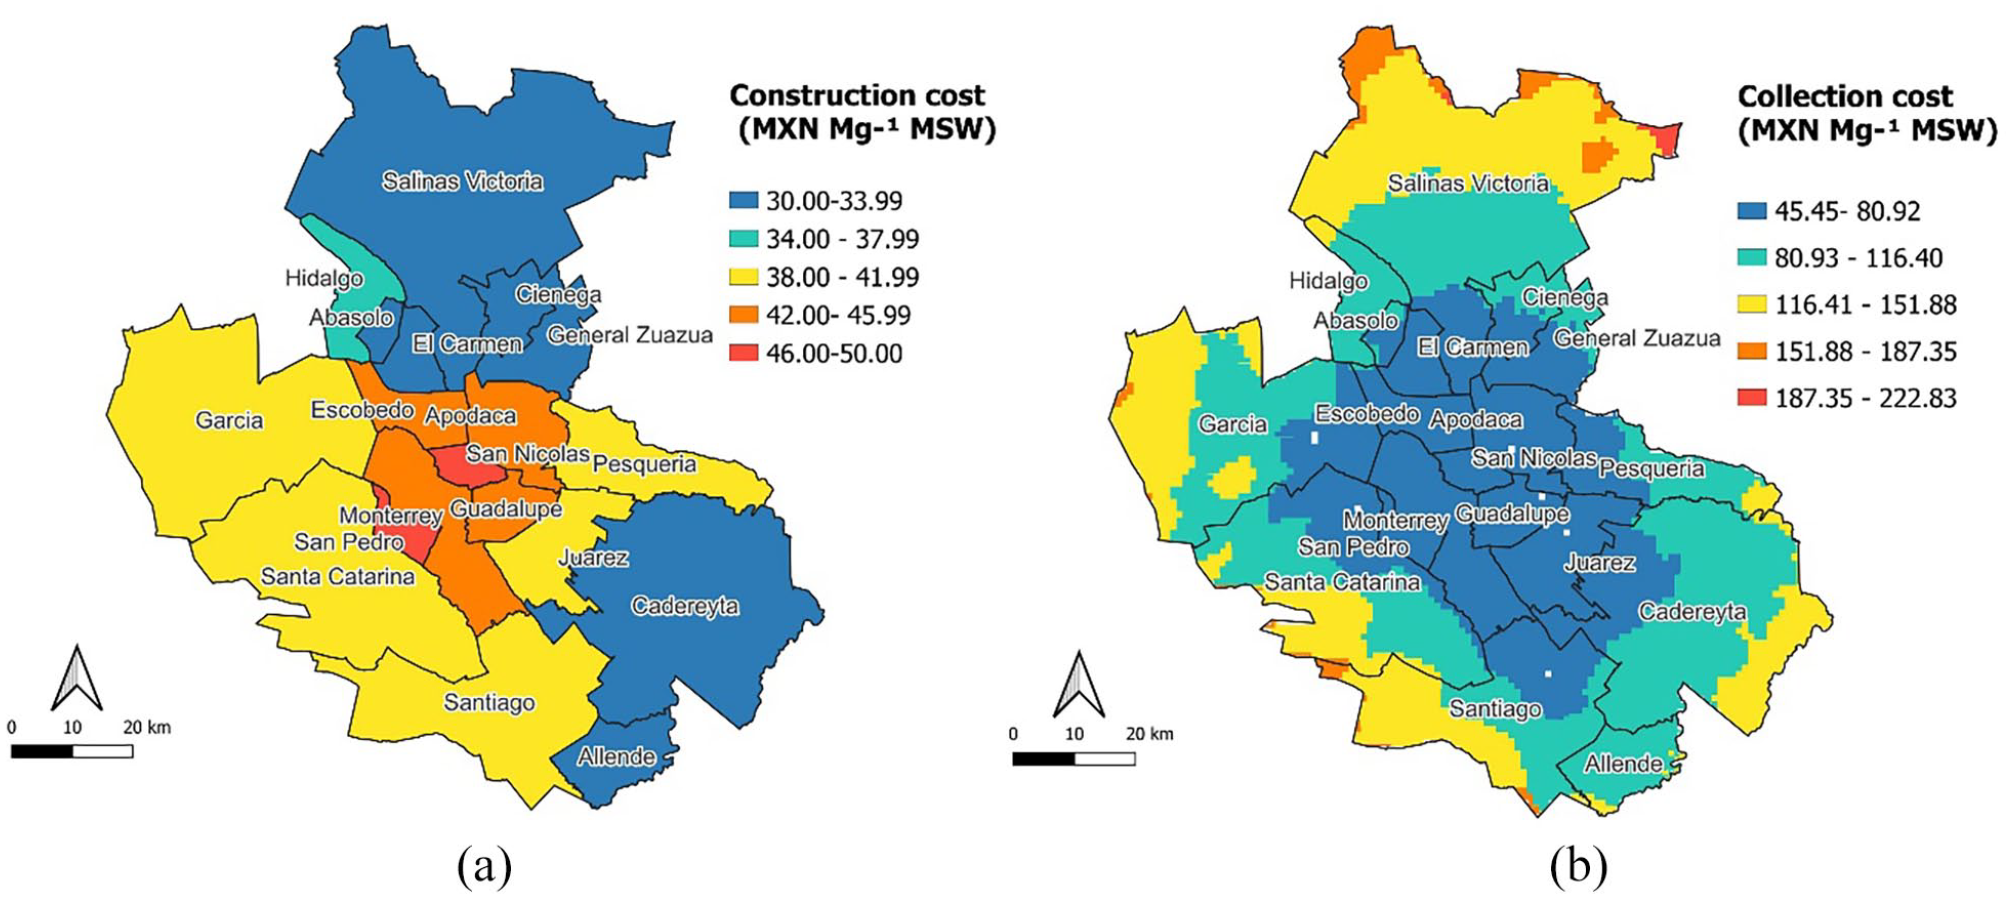
(a) Map of initial construction and (b) collection and Ct costs.
Figure 6(b) presents the collection costs of MSW for the MAM. Locating landfills in the centre municipalities (e.g. Monterrey, San Nicolas, Escobedo), will cause the lowest transport cost (i.e. 45–80 MXN Mg−1 MSW). On the other hand, the highest costs (more than 222 MXN Mg−1 MSW) were found in the peripheral zones of the MAM (e.g. Salinas Victoria, Garcia and Allende). These transport costs were due to the long distances that collection units would have to travel from the municipalities to these distant locations and the lack of road infrastructure in these municipalities. Espinoza-Tello et al. (2011) reported higher collection costs for Mexico. A possible explanation of the differences in the costs is that this research just considered the distance of the collection trucks from the centroid of the municipalities, while the study by Espinoza-Tello et al. (2011) is an average collection cost from the households to the disposal site.
Figure 7 shows the Ct (collection and construction) costs per Mg of MSW disposed for the available areas to site landfills. The collection costs had more impact than the construction costs since upto the collection stage this cost represents on average 73% of Ct costs. This result is in accord with the costs reported by Noche et al. (2010). They found that collection costs are in a range of 50–70% of the total costs. In addition, it is observed that available zones which are in the centre region of the MAM have a lower Ct and consequently, less economic impact than peripheral areas.
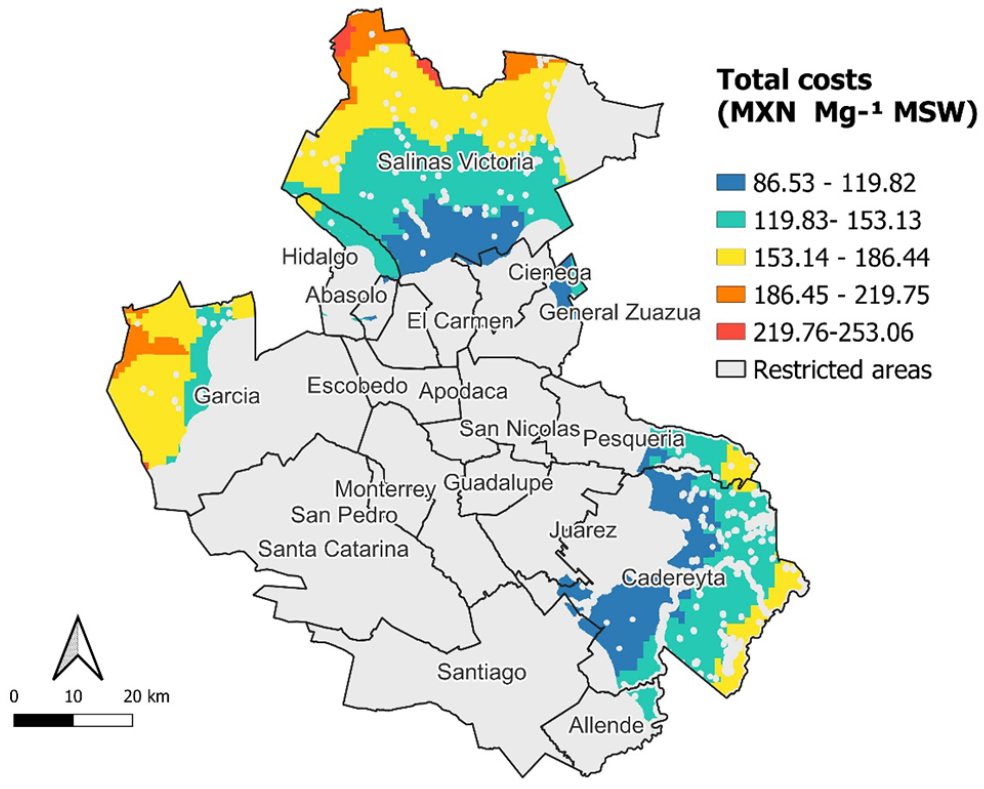
Total cost (Ct) for landfill.
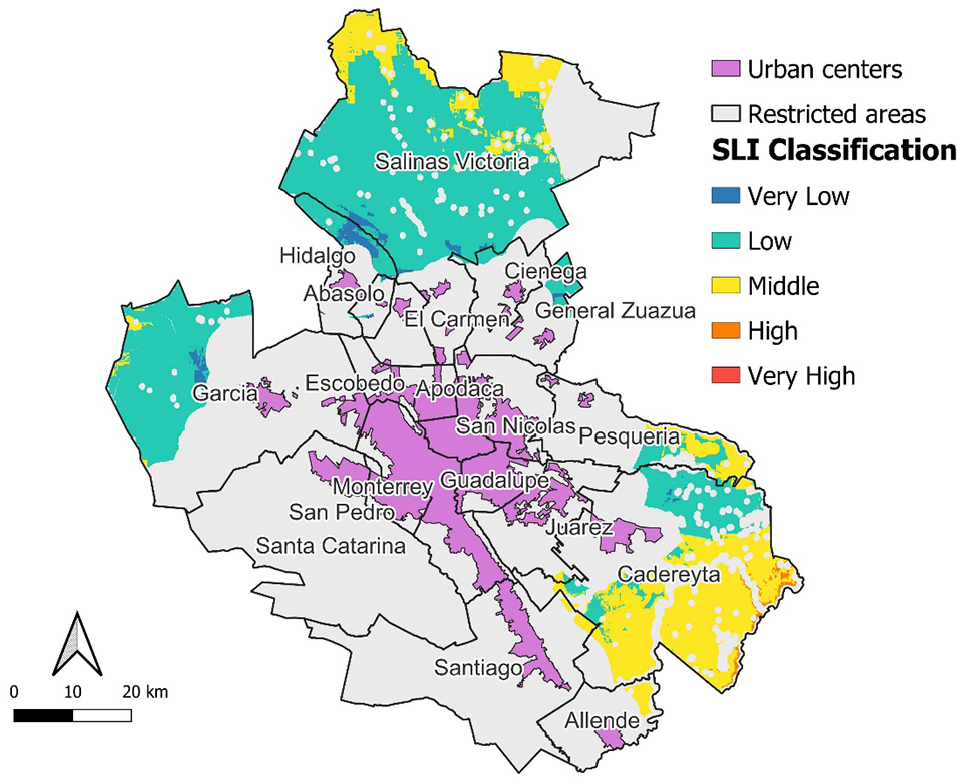
Sustainable location index
Environmental approach
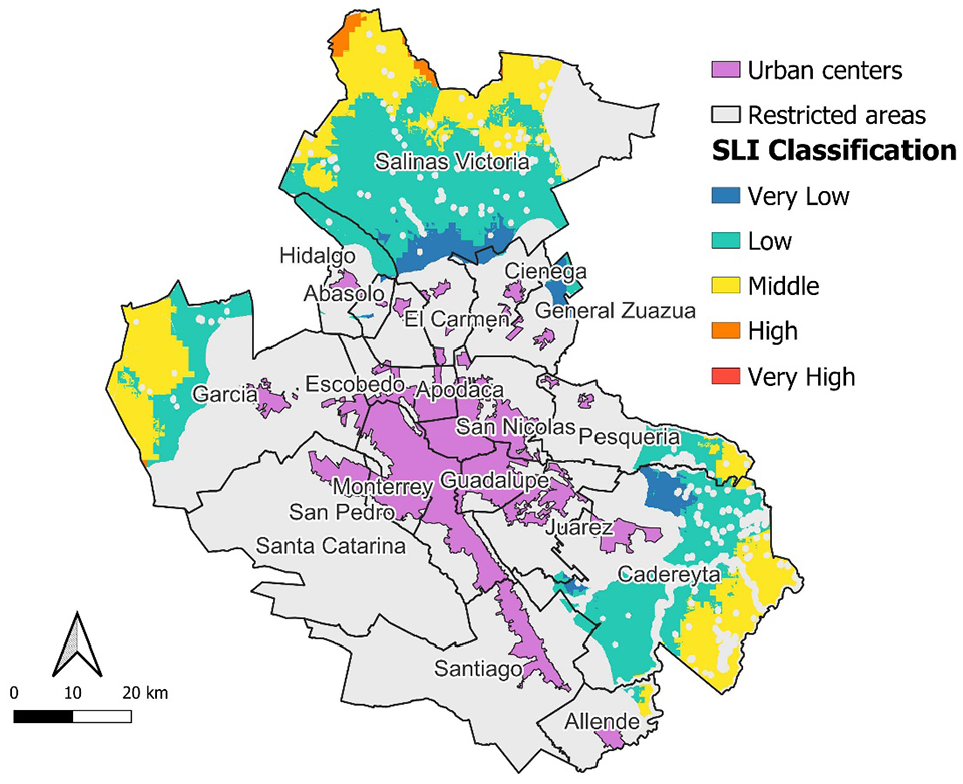
Figure 8 shows the SLI from an environmental approach, for the available areas to site a landfill in the MAM. In some areas it was observed that the economic and environmental perspectives were in conflict among themselves. This situation was more relevant in the west of the area of study, where the land with very low SLI was 16% in the environmental approach, while when the economic factor is totally neglected (wecon = 0 and wamb = 1) the land classifies as very low SLI increased up to 93%.
Map of sustainable landfill index (SLI) from an environmental approach.***
Economic approach
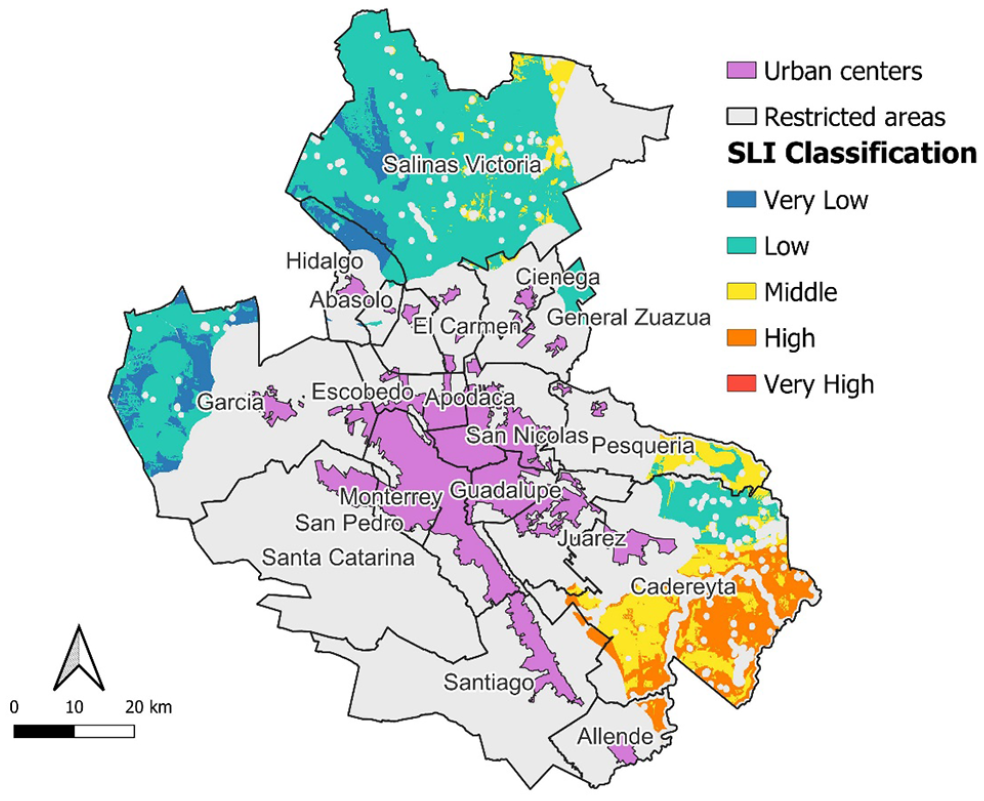
Figure 9 presents the SLI from economic approach. The zones with the lowest SLI were found in the municipalities of Salinas Victoria, Cadereyta and General Zuazua. The lowest impact of these zones is because they are located in zones with low land cost but are near to the centre of the MAM. This proximity reduces the distance that collection trucks would have to travel.
Map of sustainable landfill index (SLI) from an economic approach.
Egalitarian approach
Figure 10 shows the SLI for egalitarian approach. The location of the areas with less impact to sustainability in this approach are similar to those found in economic and environmental approach (e.g. municipalities of Garcia, Hidalgo, and Salinas Victoria). This approach had the smallest suitable area to locate landfills, with four and six times less area than economic and environmental approach.
Sustainable landfill index (SLI) from an egalitarian approach.
Implications of the sustainability in the landfill site selection
Figure 11 shows the areas classified with very low SLI. It is noteworthy that none of the areas with the lowest SLI match for environmental and economic approach. This finding shows that including sustainability in landfill site selection is very complex, since several times the economic and environmental variables are in conflict among them. The conflict between environmental and economic variables in landfill site selection have been reported by several authors (Eskandari et al., 2012; Manyoma et al., 2015). In this case, the difference could be attributed to the peripheral areas having less population that may be affected by the landfill, but it is quite expensive transporting MSW to these zones. Güler and Yomralıoğlu (2017) reported a similar result when they assessed the influence of weighting factor for an analytic hierarchized process for landfill site selection. They found a decrease in the available area when economic approach was more preponderant.
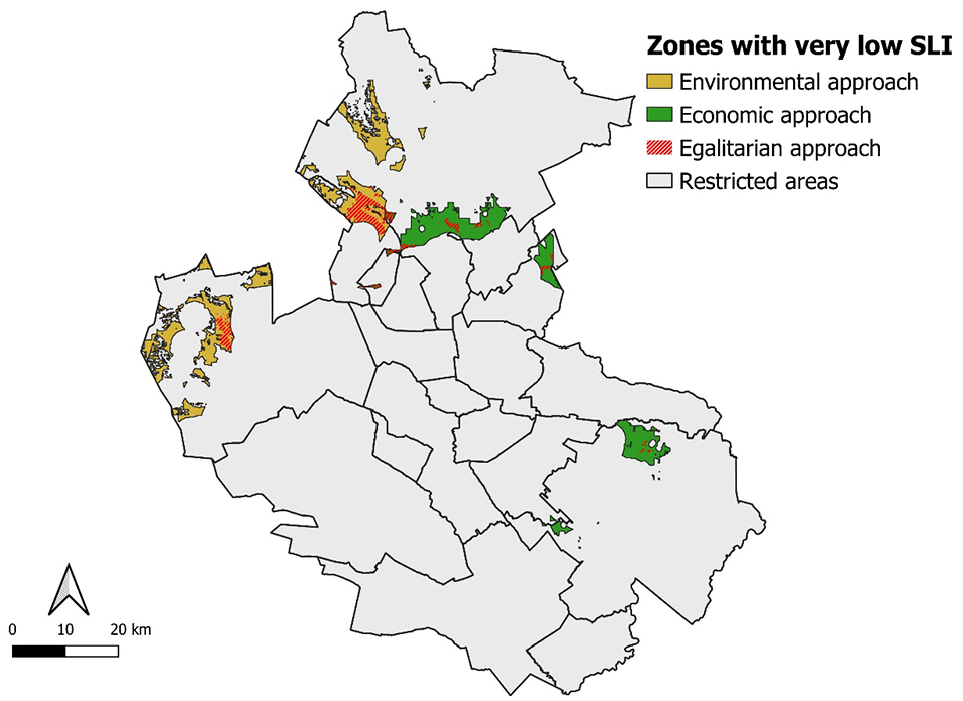
Zones classified as very low SLI for environmental, economic and egalitarian approach.
Conclusions
The purpose of this study was to develop and evaluate a holistic methodology to assess landfill site selection, which is a main issue for metropolitan areas of LAC. The results showed that the combined use of economic, environmental and administrative factors enhanced the decision-making process in a sustainable way.
The study showed that urbanization is one of the most important factors in landfill site selection. The factor of distance to urban centres restricted up to 42% of the available land in the area of study, the urban sprawl and presence of urban infrastructure caused health to be the environmental component more vulnerable to the landfill affectation (17.9% of the area of study had high ELI), and the travelled distance for the collection trucks makes peripheral zones to have the highest economic impact. These results indicate that over time, suitable land for landfill siting will be more scarce and further away from the MAM, making the landfill site selection process more difficult and increasing the costs of the MSW management. The evaluation of the different approach with the SLI showed evidence that economic and environmental factors could be in conflict in the evaluation. This situation may be disadvantageous for decision makers to find locations for landfill sites which contribute to sustainability of the MSW management. The disparity between economic and environmental approach suggests that decision-making process for landfill site selection may include local particularities as municipal budgets, policies of MSW management and public perception about environmental deterioration to enhance the sustainability in the landfill location process. Further work is necessary to include social dimension in the landfill site selection to comprise all the spheres of the sustainability.
Supplemental Material
sj-docx-1-wmr-10.1177_0734242X221138733 – Supplemental material for Application of a sustainable location index approach to landfill site selection in Monterrey, Mexico
Supplemental material, sj-docx-1-wmr-10.1177_0734242X221138733 for Application of a sustainable location index approach to landfill site selection in Monterrey, Mexico by Juan Felipe Rueda-Avellaneda, Ricardo Gomez-Gonzalez, Pasiano Rivas-García, Reyes Benitez-Bravo, José Enrique Botello-Álvarez and Zhao Wang in Waste Management & Research
Footnotes
Acknowledgements
The authors would like to acknowledge the Department of Chemistry, Facultad de Ciencias Químicas, UANL, for the laboratory space. J.F. Rueda-Avellaneda would like to acknowledge CONACYT for the national scholarship granted.
Declaration of conflicting interests
The authors declared no potential conflicts of interest with respect to the research, authorship and/or publication of this article.
Funding
The study was financially supported by CONACYT via the scholarships (636131) and (862015).
Supplemental material
Supplemental material for this article is available online.
References
Supplementary Material
Please find the following supplemental material available below.
For Open Access articles published under a Creative Commons License, all supplemental material carries the same license as the article it is associated with.
For non-Open Access articles published, all supplemental material carries a non-exclusive license, and permission requests for re-use of supplemental material or any part of supplemental material shall be sent directly to the copyright owner as specified in the copyright notice associated with the article.