
Abstract
This study examines the wind shear coefficient (WSC) values at three coastal wind sites in the southern region of Balochistan, Pakistan: Pasni, Ormara, and Jiwani. These WSC values were obtained using 10-min collected wind speed data at elevations of 20, 50, and 80 meters above ground level (AGL). Extrapolation techniques were employed to estimate wind speeds at higher altitudes since wind measurements are typically recorded at lower heights due to cost and resource constraints. However, using a constant WSC value for extrapolation may lead to significant errors between extrapolated and actual wind speed measurements, impacting the energy output of wind turbines. To evaluate the effect of WSC on energy yield, the study employed power curves and frequency distributions using the RETScreen Software for 2MW and 1.5MW wind turbines. Additionally, wind power density was calculated using air density covering two years from November 2016 to August 2018. The overall mean WSC and air densities values were 0.076 and 1.166 for Pasni, 0.094 and1.170 for Jiwani, and 0.053 and1.173 for Ormara. The study further investigated the seasonal, monthly, and daily variations of WSC. For assessing wind resources at a height of 80 m, the study utilized wind Roses, wind power density, and Weibull parameters. These findings will be essential for planning and financing new projects in the electric energy generation sector.
Introduction
The wind resource assessment's optimum goal is to predict energy performance accurately. For power generation forecasting, information on wind speed near the wind turbine wave height and power curve is required. The exterior environmental conditions at the wind farm development spot directly impact the yearly energy production (AEP) calculations (Brower, 2021). The wind turbine's power curve relative to the external conditions of the environment should be considered as correctly as possible to minimize prediction gaps in the energy production calculation method (Lee et al., 2020). Environmental factors affecting wind turbines’ performance can be broadly expressed into terrain impacts, atmospheric conditions, obstacles, surface friction, and wakes from nearby wind power turbines (Landberg, 2015). Atmospheric conditions can be categorized into wind shear coefficient (WSC), turbulence intensity (TI), and environmental stability. Various studies have been carried out to investigate the effects of these environmental conditions on the performance of wind turbines (Antoniou et al., 2009). Such investigations provide detailed information on wind and other renewable sources characteristics to boost the potential value of the sites (Hulio et al., 2017; Mutale et al., 2023, 2024b).
Actual sites mostly present a variety of atmospheric conditions. Though the variation may differ within every site, strong daily fluctuations caused by solar energy radiations are generally practiced (Mutale et al., 2024a, 2024b; Wharton and Lundquist, 2012). Atmospheric stability due to thermal factors provides stable, unstable, and neutral conditions during the day. This atmospheric stability influences the formation and dissipation of air mixing and wind shear vertically and horizontally. This effect ultimately flows into the swept area and reflects the wind field affecting the wind power output and the performance of a turbine (Zhang, 2015). Hence, the manufacturer's performance curve (MPC) varies from the performance curve of the wind turbine actually installed on the site which usually gives errors in the calculation of AEP (Optis and Perr-Sauer, 2019; Wagner et al., 2009). The performance of wind energy conversion systems from wind turbines and to smoothen output power has also been focused on ensuring the stability of wind turbines in past literature (Huang et al., 2021; Liao et al., 2022). It is to overcome environmental concerns and provide huge economic savings and grid support for the utilities (Muqeet et al., 2019).
In most of the metalogical stations in the world, wind speed is measured at one specific height due to which wind shear values are hardly available (Azad et al., 2011). Various studies have been carried out to examine wind shear and other related atmospheric conditions to show stable, unstable, and neutral states of stability due to changes in factors in daily variation, which impacts the production of energy. This difference generally results in errors in the annual energy production (AEP) calculation (St Martin et al., 2016). One study was conducted in Jeju Island, South Korea to analyze atmospheric factors, stability, and wind shear coefficient on the wind power performance and annual energy production (AEP). It was revealed that variation of 1.4–4% was found due to a difference in wind shear coefficient (Kim et al., 2021). The wind shear impacts on annual energy production for Phagan Island were collected at 65 m and 120 m above ground level with the help of Weibull parameters. It showed up to 35% difference in wind energy production due to variations in wind shear coefficient (Werapun et al., 2017). Another study was conducted in southern Namibia where energy yield and the hub height were found to be dependent on wind shear coefficient. The mean wind shear coefficients were found to be 0.197 and 0.132 with maximum values during winter and minimum in the month of summer. The diurnal values were maximum in night stable hours and minimum in daylight hours (Okorie et al., 2017). Furthermore, measurement of wind shear coefficient variability was conducted at three coastal sites of Malaysia at a height of 55 m to 70 m from ground level by applying the Power law equation. The results showed wind shear values larger than the 1/7 power law (0.143) which confirms the variation in wind energy potential with the change in wind speed and shear coefficient accordingly (Li et al., 2021; Wagner et al., 2009).
Wind data for one year was collected in Balikesir by using power law and Weibull parameters to show the effect of wind shear coefficient on the production of energy. The difference in wind energy production from collected data at hub height and extrapolated data was up to 49.6% due to wind shear coefficient influence (Firtin et al., 2011). Another study was conducted in Dhahran Saudi Arabia from the data 20, 30, and 40 m above the ground level to find the effect of wind shear coefficient on energy yield from a 60MW wind farm. Higher values of wind shear coefficient were observed at nighttime duration and smaller in daylight hours. The energy yield achieved was around 11–12% more for the actual wind shear coefficient compared with the obtained using the 1/7 power law (Rehman and Al-Abbadi, 2007). The wind shear coefficient was also calculated for three coastal locations in southern Italy by using power law for diurnal, monthly, and annual variation. Furthermore, wind resources were assessed to study the effect and compare it with the energy yield. The extrapolated data were used at 50 m from 10 m measurements using wind roses, wind speed frequency distribution, and Weibull's parameters (Liao et al., 2022). The wind shear coefficient was investigated using wind energy resources for scale-up contribution to renewable energy in rural, pre-urban, and urban areas by using power law and wind velocity profile. The effect of diurnal wind shear resulted in be maximum at nighttime and a minimum in daytime hours, which suggested the ground surface cooling and above air (Kim et al., 2021). Annual mean wind shear was calculated on 4-year data in a location in the South of Pakistan with elevation of 10 m and 30 m above ground level. The value of WSC was reported at about 0.269–0.318(Rehman et al., 2015).
This study used the wind parameter measurement made at 20, 50, and 80 m above the ground level in three different coastal sites Pasni (PS), Jiwani (JW), and Ormara (OR). The power performance of different suitable turbines was analyzed with the variability of vertical and horizontal wind speeds. The site-specific air density was analyzed with the help of local temperature and pressure measurements available at ground level. The main aim of the study is to address the feasibility of wind farms, planning, and projects, and identify the gaps for harnessing wind energy. Moreover, this study influences aviation & maritime activities and optimizes energy efficiency by understanding the seasonal and diurnal patterns for wind shear and its applications. It also provides a wide range of opportunities for local stakeholders to invest in the Coastal wind power regions of Balochistan.
Data collection
This study was conducted in the coastal area of Mekran in the Balochistan province of Pakistan along a stretch of semi-desert coastline connected with the coast of Iran and the Gulf of Oman, as shown in Figure 1. It stretches west from Sonmiani Bay in the northwest to Karachi (Pakistan's largest city) in the east. Mekran's coastline is about 750 km long and has a dry climate with little rainfall. The main port cities are Ormara, Pasni, Gwadar, Ganz, Pishukan, and Jiwani. Mekran coastline offers great potential for a wind power project shortly where there are currently no wind turbines installed. Pasni is a city located at 25° 15’ 47” N, 63° 28’ 9” E, 7 m (20 ft.), with a hot arid/desert subtropical climate at low latitudes (Pasni weather profile 2023). The average annual temperature is about 25.5°C with an average of 98.2 mm of rainfall. Another city, Jiwani is located in the northern hemisphere at a latitude 25° 3’ 1” N, 61° 44’ 48"E, 10 m above sea level. The annual average temperature of the coast is 27°C. Jiwani has a much lower annual rainfall of around 13.66 mm and winters here are short, pleasant, and dry, with mostly clear skies of temperature 23°C, while summers are relatively warm with temperatures reaching 32°C (Ormara Weather & Tourism 2023). Jiwani also has an airport with a weather forecast system, just 10 km from the city center. Furthermore, Ormara is also a coastal city in Balochistan, Pakistan at 25° 12’ 38” North, 64° 38’ 15”, 4 m with a hot desert climate (Jiwani Overview 2023). The maximum annual average temperature here is 29°C (from 24°C in January to 33°C in May) with annual precipitation of about 75 mm. Like Pasni and Jiwani, Ormara City has also its own domestic airport flight forecast system.

Location of the three coastal sites of Mekran: PS, JW and OR.
The data used for this research was collected between November 2016 and August 2018 at three stations and is provided by the Meteorological Department of Pakistan. Temperature, barometric, humidity, and pressure measurements were taken at 5 m AGL, while average wind speeds were reported at 20 m, 50 m, and 80 m, and wind direction at 58.5 m AGL. Each measurement was recorded with a duration of ten minutes.
Materials and method
Wind data analysis
The wind data is crucial for studying the wind potential of specific locations and estimating energy production. There are different available methods, however, the below method is chosen as it fits more with the available data and site description noticed from the literature. Furthermore, it is important to understand the factors involved in variation of Wind shear coefficient with heights in coastal regions. Coastal regions experience diurnal wind pattern variations because of the heating ratio of sea and land. In addition, there is also different surface roughness between smoother sea and rougher land surface. This often results higher values of wind shear in coastal regions as compared with global data from the past literature (Werapun et al., 2017).
The impact of the wind shear coefficient on the technical feasibility of three different wind turbines was tested based on different parameters. This includes weather patterns of various Altitudes, frequency of collected data, seasonal & diurnal variation, nearby obstruction, temperature profile capacity factor, availability factor, full load hour, and energy output. The maximum energy production of three different cities was tested using RETScreen Software comparing different turbine models. The wind energy potential was estimated based on Weibull parameters C and K, wind speed, wind power density, and energy production.
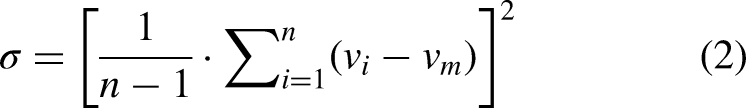
Wind speed
The mean wind speed Vm can be described as


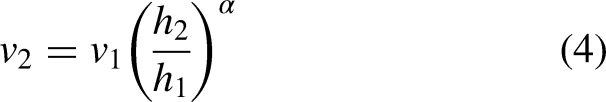
The power law
Wind shear profile is determined by using the power law proposed by Hellmann in 1916, which is used to transfer the recorded data by an anemometer at a certain height for other desired heights (Al-Hinai et al., 2021):

The logarithmic law
This is another commonly used method to calculate wind profile Eq (6) reported by (Ayik et al., 2021):

Air density
Air density is known as one of the important parameters when calculating wind energy profile from a site, as it is directly proportional to power density. It depends on ambient air temperature and atmospheric pressure and may be considered using Eq (7) reported by (Ulazia et al., 2019):

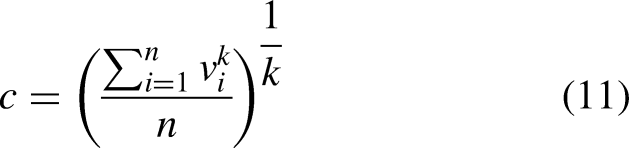
Weibull probability distribution function
The Weibull distribution is used to analyze wind energy production and potential. The alteration in wind speed is distinguished by two functions: (a) the cumulative distribution function and (b) the probability density function. The probability density function f(v) shows the proportion of probability that the wind blows at a described speed v and is described by the equation (8) (Liao et al., 2022):


Capacity factor
The capacity factor (Cf) is the most important factor, which represents the fraction of the operating time of a wind turbine at a selected location during the year (Hulio et al., 2017). It is shown in the Eq. (12) as:


Results and discussion
Frequency distribution and wind roses
The wind direction was noted at 57.8 m shown in Figure 2, along with annual wind speed frequency distribution at 20 m and 80 m in Figures 3, 4 and 5, which have been studied for the three coastal locations. At the PS site, the yearly wind speed frequency distribution in Figure 3, showed wind speeds higher than 4 m/s occur about 48% at 20 m meanwhile they come up with about 65% at 80 m, which is a great increase with an increase in the sensor height. Furthermore, wind direction at the PS site for two years behaved to be appearing from SW and WSW with about 53.9% shown in Figure 2(a), while the strongest winds also appeared from the same directions SW and WSW.

Comparing the two-year wind rose diagram for three cities of Baluchistan (a)Pasni (b) Jiwani (c) Ormara.
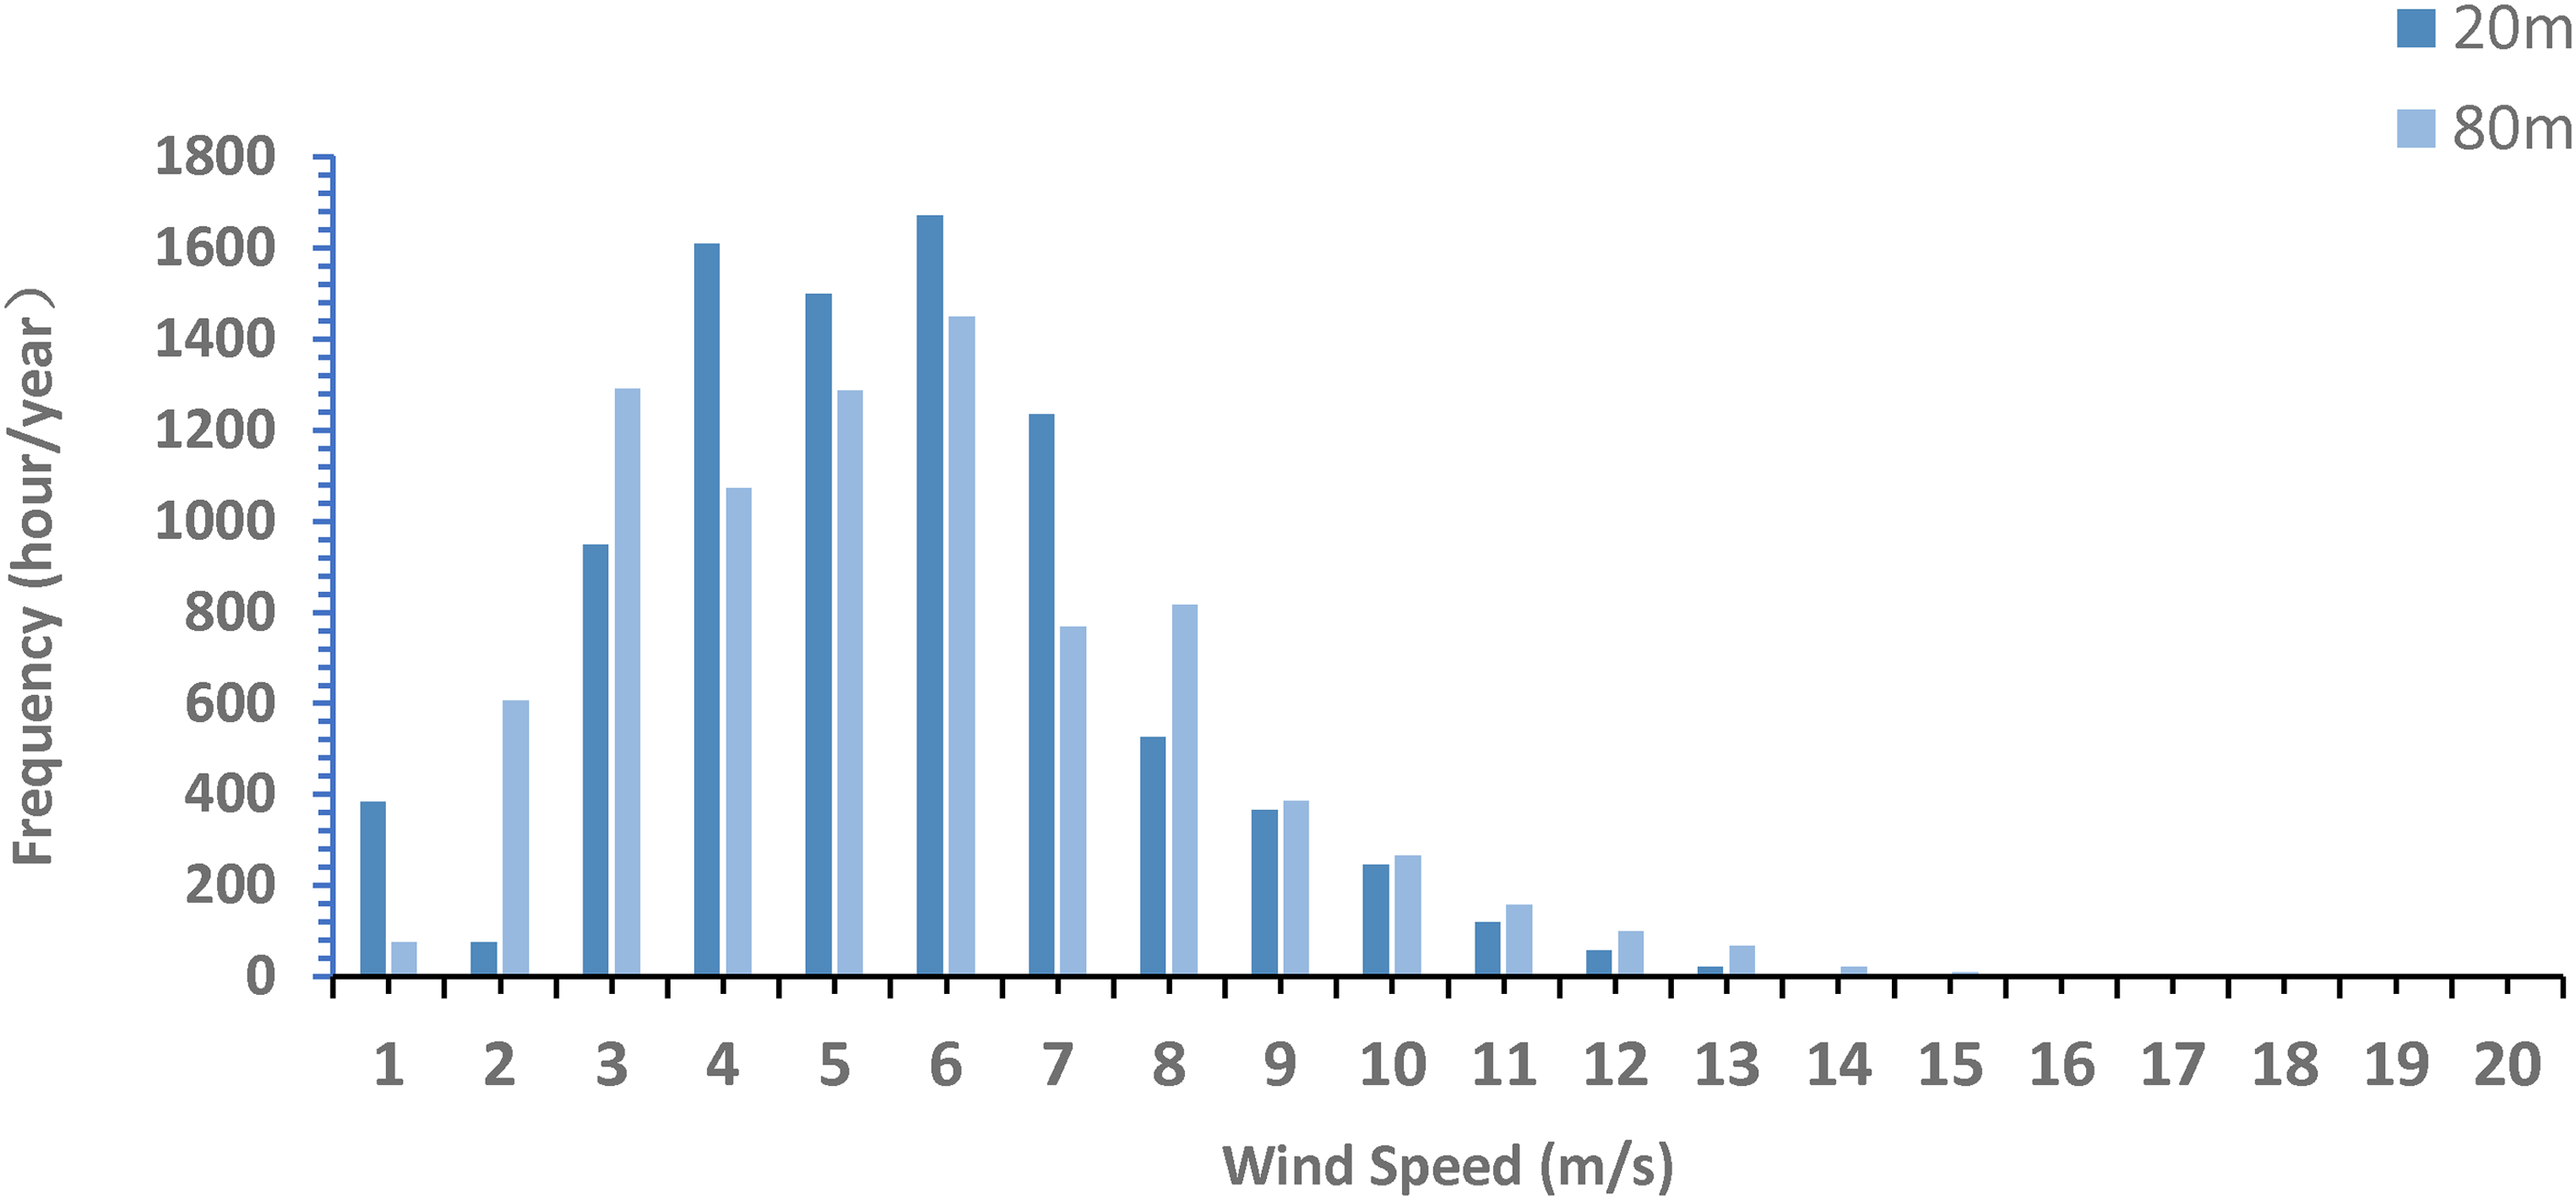
Annual wind speed frequency distribution collected for PS site at 20 m and 80 m.

Annual wind speed frequency distribution measured for JW site at 20 m and 80 m.
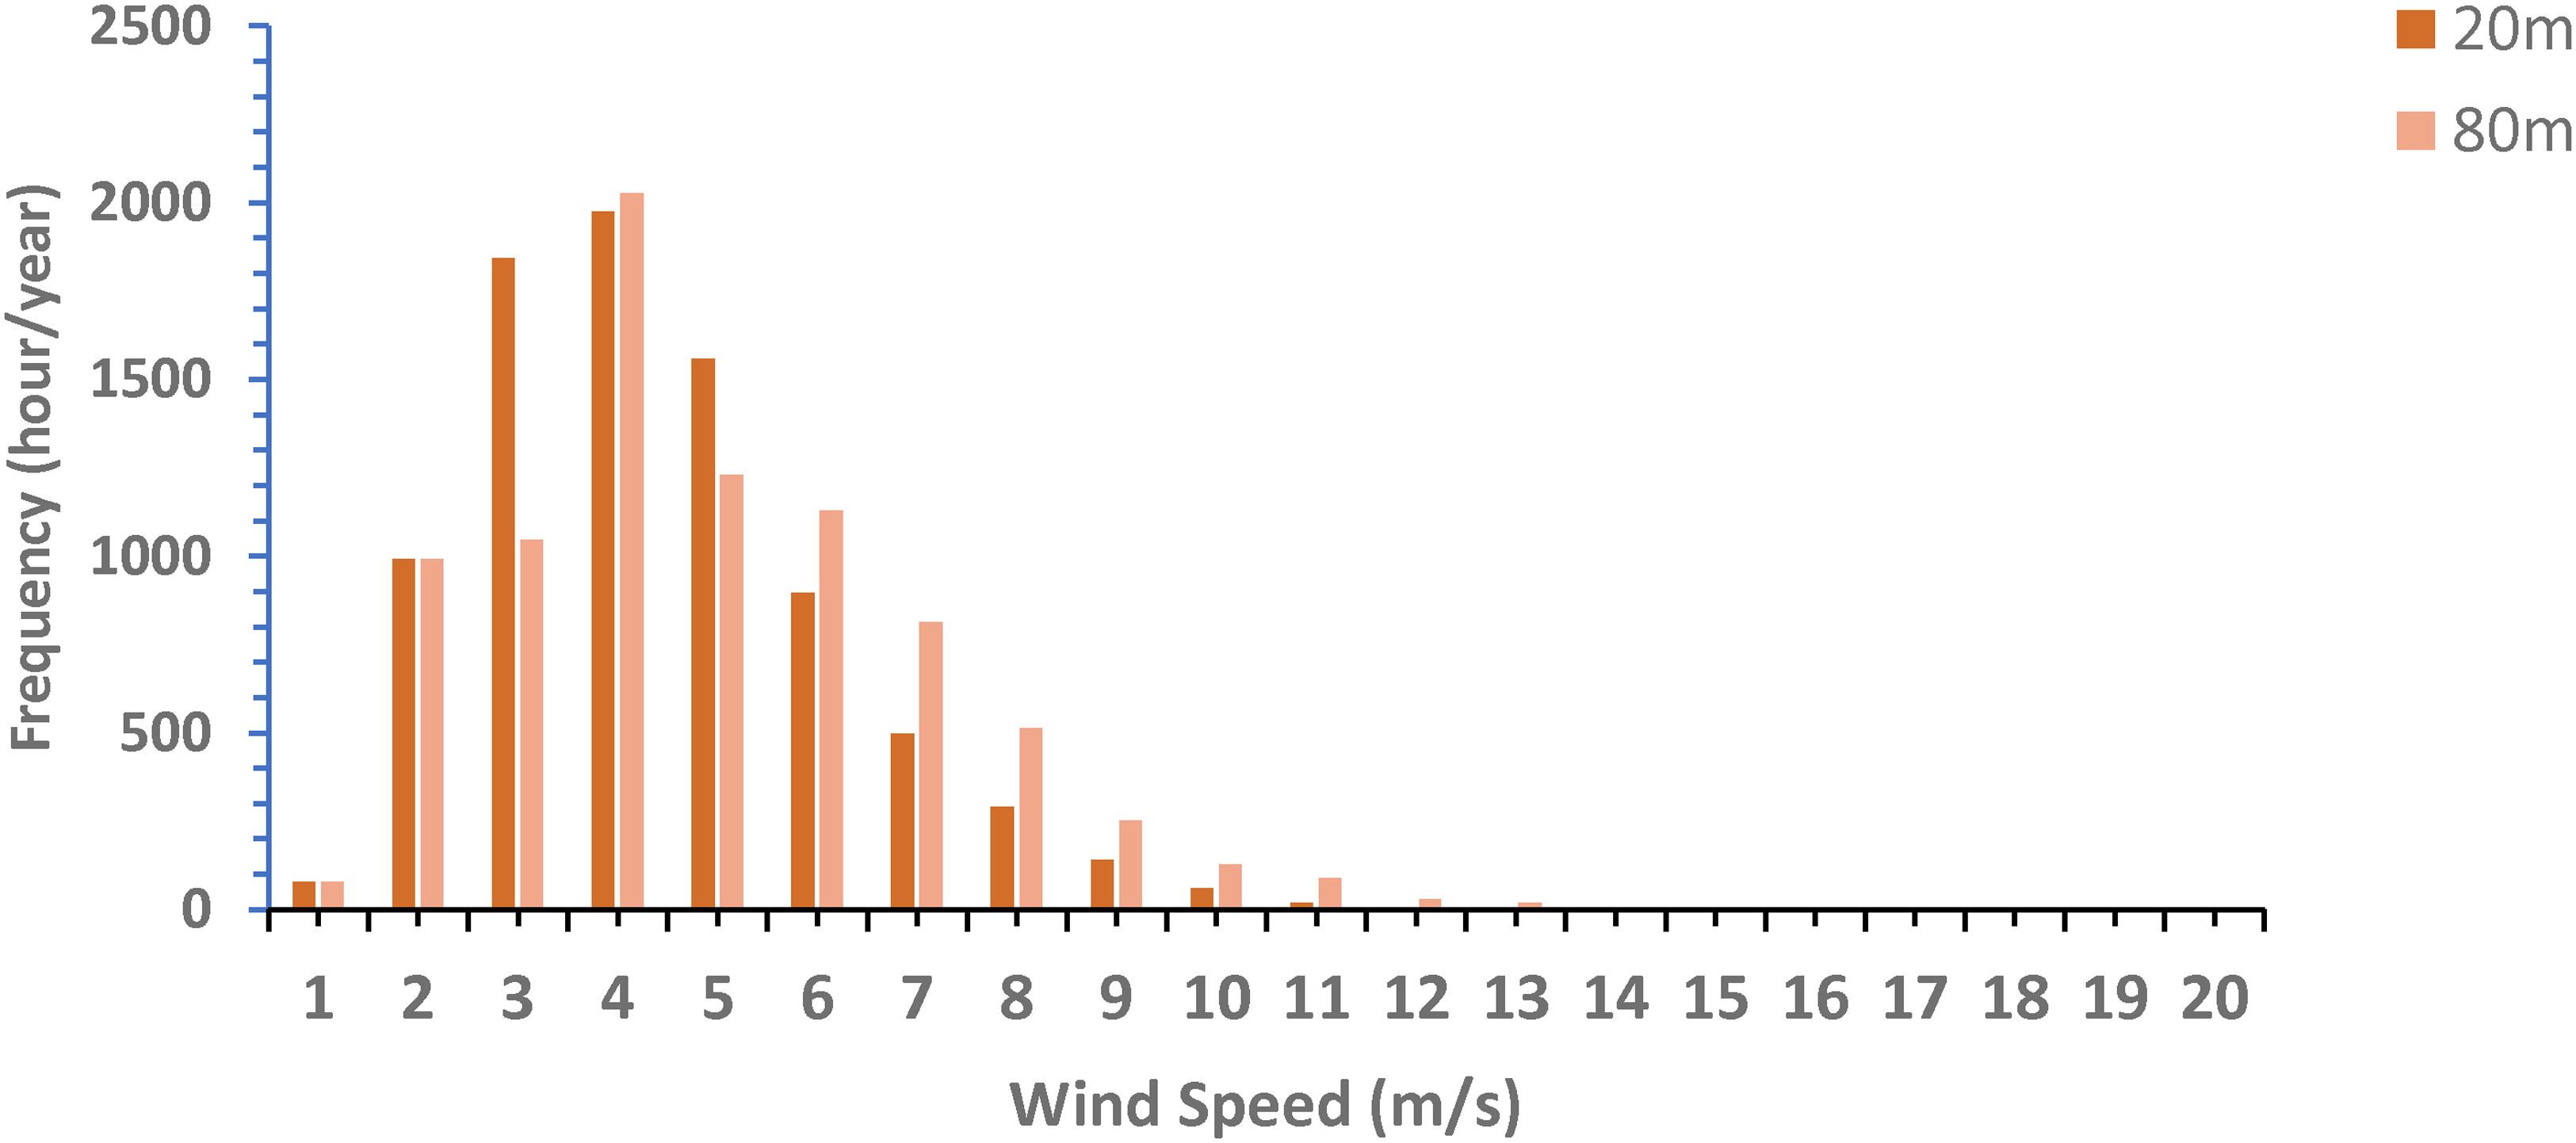
Annual wind speed frequency distribution collected for the OR site at 20 m and 80 m.
At the JW site, the annual wind speed frequency distribution shown in Figure 4, shows wind speed higher than 4 m/s occurred about 45% at 20 m while at 80 m, it was about 62% which was also a great increase with the increase in the sensor height. The wind direction at the JW site for the selected period behaved to be from WSW, SW, and SSW with 15–33% in Figure 2(b), while the strongest winds are also from SW and SSW respectively.
At the OR site, the yearly wind speed frequency distribution in Figure 5, shows wind speeds higher than 4 m/s occurred at about 39.5% at 20 m meanwhile at 80 m, they come up with about 48% which is a great increase with an increase of in the sensor height beside those two stations. Furthermore, wind direction at the OR site behaved to be similar with PS appearing from SW and WSW with a value of about 13–32% in Figure 2(c). The strongest winds seemed to be emerging from SW (Table 1).
Wind shear coefficient values of different terrains (Werapun et al., 2017).

Air density characteristics
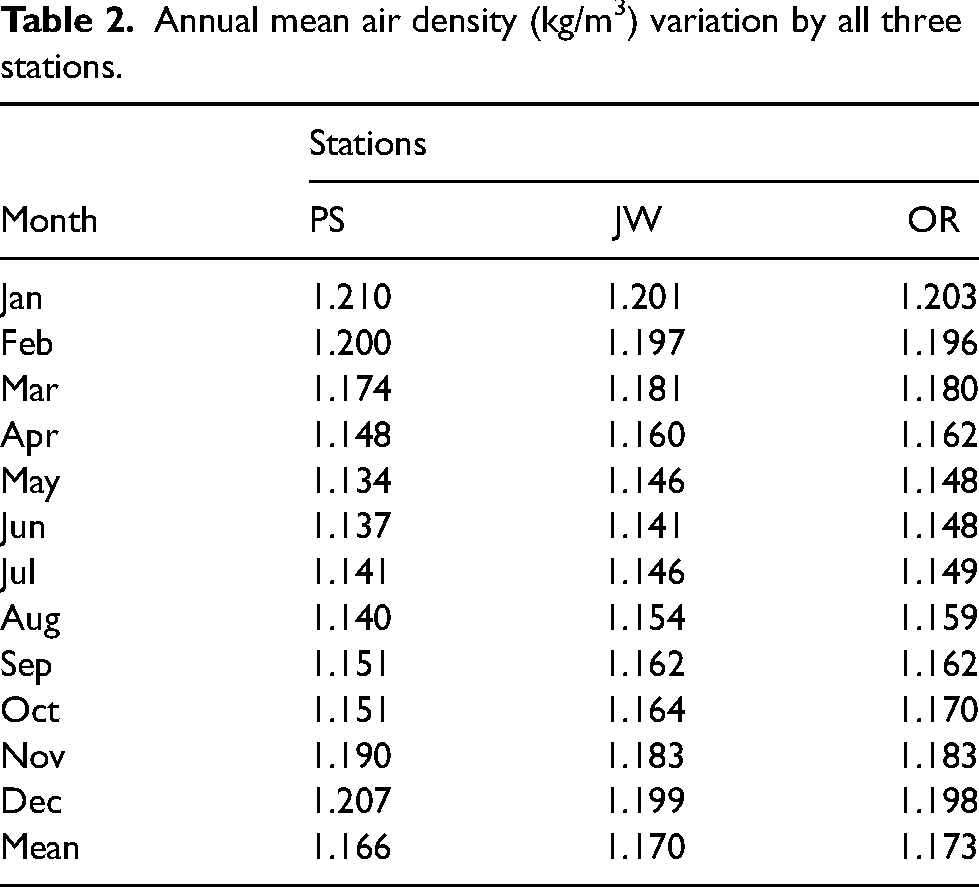
The mean monthly values appear to be higher during winter, and lower in the months of summer, however, the change is negligible. The mean density of the three stations is reported in Table 2. with the values 1.134–1.210 kg/m3 at PS, 1.141–1.201 kg/m3 at JW, while OR with a range from 1.148–1.203 kg/m3. The real value of air density of 1.225 kg/m3 was nearly reached in January and December by all three stations. This monthly density on the coast of Balochistan, Pakistan shows clear agreement with the past literature (St Martin et al., 2016).
Annual mean air density (kg/m3) variation by all three stations.
Wind shear characteristics:
The wind shear based on 10 min wind speed data which is measured at different heights from 20, 50, and 80 m AGL for three selected sites is calculated using Eq. 2. It is noted that generally height is ignored and wind shear is considered constant using a value from 0.1 up to 0.4 depending upon the terrain, however, it significantly varies with height. The Annual variation of wind shear Figure 6, generally shows the highest values in winter months (November- January) for all three stations where PS shows a winter range 0.102–0.1110 WSC, JW ranging 0.128 −0.119 and OR representing 0.063–0.075, while the lowest values of WSC occur in summer months (June-August) where for PS, the values range between 0.010–0.029, JW 0.028–0.016 and OR 0.015–0.003 respectively.

Annual changes of wind shear coefficient of the three sites PS, JW, OR.
This is considered due to higher air mixing above the ground level in the summertime while the ground experiences less air mixing in winter instead, as suggested by different authors (Okorie et al., 2017).
The daily WSC variation Figure 7, is significantly correlated with the daily heating/cooling cycle of the air above the ground level where higher values are experienced during the nighttime (00:00–06:00 h) while significantly decreasing after the sun starts heating the air near the ground. These values remain stable and low in the daytime and start to increase from about (16:00) onward, when the air above the ground level starts to cool down resulting gradual turn in stable conditions as suggested by literature (St Martin et al., 2016).

Daily variation of wind shear coefficient of the three sites PS, JW, OR.
Wind energy Yield estimation and comparison
The wind shear coefficient has a significant role in measuring wind speed at a given height as mentioned above. The output power from the wind turbines is proportional to the cube of wind speed. This clearly defines that a small error in wind speed leads to a significant change in expected output energy. While it is worth noticing that lower energy production has a direct impact on the revenue generated from a wind farm site. The inaccurate wind speed calculation affects the economic viability of the projects, including planning and financing. The effect of the wind shear coefficient on annual energy yield is compared in Table 3, 4 and, 5.
Wind resources and energy yield parameters for the PS site calculated at 80 m using 2MW rated power Vistas- V90.

Wind resources and energy yield parameters for the JW site calculated at 80 m using 1.5MW rated power GE15sle.

Wind resources, and energy yield parameters for the OR site calculated at 80 m using 1.5MW rated power GE15sle.
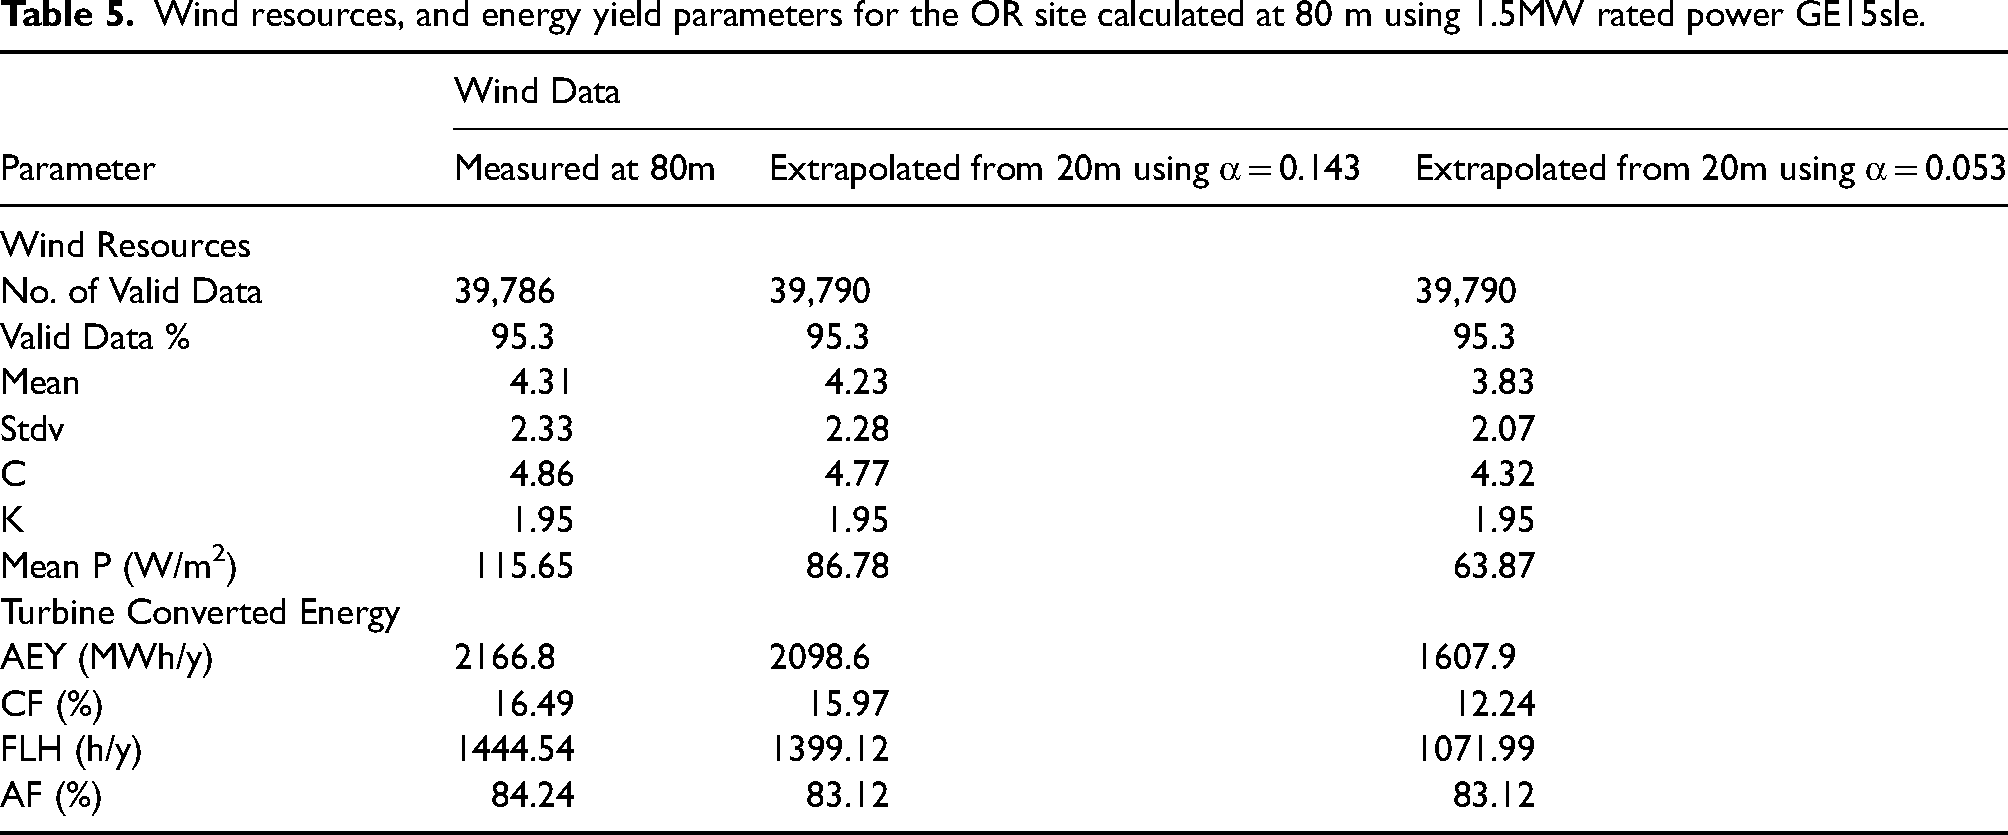
Most of the time, wind speed for a higher altitude is extrapolated from lower to obtain the required energy yield assessment using a specific constant value of wind shear coefficient for a site Table 1, however, a slight change in wind shear can affect the wind speed at a height greatly as discussed in literature (Kim et al., 2021). Based on 80 m data, wind resource analysis was carried out for three sites, PS, JW, and OR. The aim was to assign a suitable turbine for the sites and compare the different related functions using three composition options (i) measured data at 80 m, (ii) extrapolated from 20 m using α = 0.143 and (iii) extrapolated from 20 m data using site-specific mean WSC values. Wind resource analysis based on 80 m measured data, the PS site in Table 3, is classified as a nearly marginal location with mean values of v and power density (P), 5.33 m/s and 142.33 W/m2. Furthermore, site JW is shown to be a poor location with a mean value of wind speed of 4.96 m/s and power density of 115.65 W/m2 in Table 4. The third site OR also indicates to be a poor location with mean v 4.31 m/s and P is 117.49 W/m2 in Table 5.
Wind energy yield parameters were calculated at 80 m for the PS site using a single 2-MW wind power (Vistas-V90) turbine showing CF (24.8%) and AF (89.7%) in Table 3. Comparing 80 m measured data with the data extrapolated with α = 0.143, an underestimation of (10.4%) is detected in the mean v result with 21.5% for CF and AF 2.2%. Similarly, by using the overall mean value of WSC (0.076), an exceptional underestimation occurred with CF (81.9%) and AF (7.2%).
In Table 4, wind energy yield parameters were calculated at 80 m for the JW site using a single 1.5-MW, power (GE15sle) turbine provided a value CF (22.9%) and AF (89.2%). Compared to 80 m measured data with the data extrapolated with α = 0.143, an underestimation of (10.2%) is detected in the mean v result with 23.7% for CF and 3.4% for AF. Moreover, by using the overall mean value of WSC (0.094), a remarkable underestimation occurred with CF (43.1%) and AF (5.7%).
Wind energy parameters were calculated in Table 5, at 80 m for the OR site using a single 1.5-MW power (GE15sle) turbine showing CF (16.4%) and AF (84.2%). Comparing 80 m measured data with the data extrapolated with α= 0.143, an underestimation of (1.8%) is detected in the mean v result with 3.2% for CF and 1.3% for AF. Furthermore, by using the overall mean value of WSC (0.053), a similar underestimation occurred as in other sites with CF (34.7%) and AF (1.3%). These results showed that the site OR has the lowest values as compared to the other two sites correspondingly.
Conclusion
In this study, the wind shear coefficient and its impact on electrical energy generation were investigated in three coastal locations of Pakistan by assessing the scale and shape factors of the Weibull distribution function using the empirical method. The parameters are used to calculate the wind power density and annual energy yield using two years (2016–2018) wind speed data with ten-minute intervals to forecast the behavior of wind more precisely. Different models of wind turbines are proposed for electricity generation considering the opportunity of building wind farm projects at these locations by using RETScreen and power law. The wind shear coefficient was calculated using available and extrapolated measurements of wind speed at three different levels, 20 m, 50 m, and 80 m above ground level. The results of this study can be summarized as:
The value of wind shear varies with heights where higher values appear at lower heights, while lower values are found at higher altitudes. The diurnal WSC was highest in all three sites at nighttime 00:00, for PS 0.620–0.670, JW 0.641, and OR 0.186–0.556 while lower in mid-day 2:00, for PS 0.118, JW 0.006 and 0.016–0.097 for OR, which is certainly due to cooling and heating cycle of the air during 24 h of the day, which is shown in the WSC curve. Annual wind variation of WSC was higher in the winter season (November to January), up to 0.105 for PS, 0.122 for JW, and OR 0.063 while lower in summer (May to July) up to 0.010, 0.016, and 0.003 for PS, JW and OR sites respectively. PS site is a marginal location as the mean v is 5.33 m/s for the data measured at 80 m AGL with CF (24.8%) and while AF (89.7%) for a suitable 2MW wind power Vistas-V90, where the WSC α = 0.143 shows a significant effect extrapolated from 20 m, an underestimation of (10.4%) is detected in mean v result with 21.5% for CF and AF 2.2%. Similarly, by using the overall value of WSC α = 0.07, an exceptional underestimation occurred with CF (81.9%) and AF (7.2%). JW site is a poor location where a suitable 1.5MW wind power Vistas-V90 is used with 80 m measured data AGL giving a value of the mean v is 4.96 m/s with CF (22.9%) and AF (89.2%). The WSC α = 0.143 shows an underestimation of (10.2%) in mean v with 23.7% for CF and 3.4% for AF. Moreover, by using the overall mean site suggested value of WSC α = 0.09, a remarkable underestimation occurred with CF (43.1%) and AF (5.7%). OR site is also a poor location with data measured at 80 m AGL. The mean value of v is 4.31 m/s with CF (16.4%) while AF (84.2%) for a suitable 1.5-MW wind powerGE15sle turbine. The value of WSC α = 0.143 is Compared to 80 m measured data, an underestimation of (10.2%) is detected in mean v with 23.7% for CF and 3.4% for AF. Moreover, by using the overall mean value of WSC α = 0.05, a remarkable underestimation occurred with CF (43.1%) and AF (5.7%).
To conclude, this study confirms that there is a rapid change in wind shear coefficient value even with locations of the same type of terrain. The default value of 1/7 WSC should be carefully used to extrapolate wind speed values of higher altitudes from lower neglecting which, can cause a huge error in the estimation of wind power yield. This assessment provides a good potential for developing wind turbines for energy generation at the sites which can help the stakeholders in planning and financing new projects.
Footnotes
List of variables
Acknowledgment
We would like to extend our heartfelt appreciation to the Meteorological Department of Pakistan for their necessary support throughout this research endeavor. A special mention goes to Ms. Aleena Younus, Assistant Director, Meteorological Department of Pakistan, Quetta, and Mr Shafi Muhammad PhD Scholar at China University of Geosciences (Beijing) China, for their critical & scientific review, whose dedication and assistance in providing comprehensive meteorological data have been instrumental in the success of this study. Moreover, the authors are grateful for the generous support received from the School of New Energy at North China Electric Power University (Beijing, China), facilitated and awarded through the Chinese Scholarship Council in 2020. This additional backing has not only facilitated our research but has also helped international collaboration and knowledge exchange. The collective efforts and contributions of these organizations and individuals have significantly elevated the quality and depth of our work, enabling us to advance our understanding of meteorological phenomena.
Credit authorship contribution statement
Declaration of conflicting interests
The authors declared no potential conflicts of interest with respect to the research, authorship, and/or publication of this article.
Funding
The authors received no financial support for the research, authorship, and/or publication of this article.