
Abstract
The need for a more sustainable environment with reduced carbon emissions to preserve our climate necessitates increasing the renewable mix of total electric power generation. To achieve the goals set in the Sustainable Development Goals (SDGs) of the United Nations, various stakeholders including governments, investors, end-users, etc. need to duly play their part. However, there is still a need for a greater understanding of the systemic factors at local and global levels amongst the various stakeholders to better realize this objective. Some countries are already meeting their targets while others lag. This review article presents the key systemic factors influencing the success of renewable energy programs across national income categories. It discusses systems factors, national economies, energy capacities, and social effects, and examines the impact of policy instruments and targets on renewable energy deployment. The importance of national governments’ commitment to local targets is highlighted, along with the effects of policy development, planning, technologies, supply chains, etc.
Keywords
Introduction
Background
Renewable power is gaining traction with the increasing demand for cleaner energy as part of the Sustainable Development Goals (SDGs). Sustainability involves improving the economy, environment, and social well-being. The contributions of renewable energy to sustainability by increasing its percentage are being reinforced by policies at international, national, state, and county levels. The United Nation (UN's) SDG of “cleaner and more affordable energy” with an increased global percentage of renewables is a major target.
This focus on increasing the global renewable energy share has set new grounds for enabling policies, technologies, and investments. Currently, fossil fuels, which have environmental toxicity issues, generate a major percentage of total energy. Hertwich et al.'s (Hertwich et al., 2015) life-cycle assessment found even modern natural gas plants have higher particulate matter exposure than renewables, aligning with UN goals of increasing renewables to reduce environmental exposure.
Gielen et al. (REN21, 2024; Gielen et al., 2019) reviewed renewable energy's role in the global energy transformation, with solar and wind as the biggest success stories, accounting for 90% of all new renewable power up till 2024. However, current deployments are still far from achieving net zero emissions by 2050. While the effects of embracing renewables have increased in recent decades, more understanding of growth factors is needed, especially across economic categories. The UN (Ren21, 2022) reported renewable energy reached 17.7% of total consumption in 2023, only 1.6% higher than in 2010, insufficient for the 2030 “increasing renewable power mix” target. Hence, the need for this review to highlight key systemic growth factors across national income categories.
Relevance of this review article
For successful renewable power programs, more insights are needed on how developed technological systems and policy instruments influence renewable energy development. This review assumes all countries across income categories are willing to contribute to the global goal of “increasing renewables percentage”.
More agility from governments, investors, and end-users is required to achieve renewable targets for a sustainable environment, calling for a better understanding of necessary systemic factors and policy influences. Efforts at improving renewable energy have gained traction since the early 2000s; however, learning points remain to increase the pace across income categories.
Logadóttir et al. (Logadottir, 2019) published Iceland's sustainable energy success story, with almost 100% renewable generation since 2015, serving as a benchmark, though the model may not apply across all categories. Apergis and Danuletiu (Apergis and Danuletiu, 2014) investigated renewable effects for some OECD countries, but more understanding across income categories is needed. Barry et al. (Barry et al., 2011) identified thirteen factors to improve renewables in Africa, showing regional and economic categories play a role needing further study.
This review focuses on modern renewables, especially wind and solar PV expected to contribute over 90% of renewable power by 2050 due to global accessibility. It identifies growth factors contributing to their development and how knowledge from developed programs can benchmark less developed ones across income categories. Applying the review's highlights should help improve overall renewable power for a more sustainable environment.
Modern renewable energy
Energy is crucial for industrialization, playing a critical role in national security, economic prosperity, and environmental quality worldwide, thus the need for sustainability to achieve economic and environmental goals. The energy source's replenishment is important in determining availability and pricing for economic sustainability. The cleanliness of sources is also key to reducing greenhouse emissions for a sustainable environment.
Renewables are clean, distributed energies capable of mitigating the environmental downsides of fossil fuels that emit CO2, NOx, NO2, SO2, and CH4. Sharma et al. (Sharma et al., 2016) and Adeniran (Adeniran, 2014) described these emissions’ hazards which the wide adoption of renewables could curtail. Modern renewables include all technologies except traditional biomass, allowing managed off-grid generation and consumption. Their cleanliness and reduced transmission losses from proximity make them more environmentally friendly and efficient, with the option to feed excess power to the grid for larger-scale generation. Figure 1 illustrates the efficiency advantage of off-grid modern renewables versus traditional on-grid systems, with the three major sources modern renewables (solar, wind and geothermal) subsequently discussed.
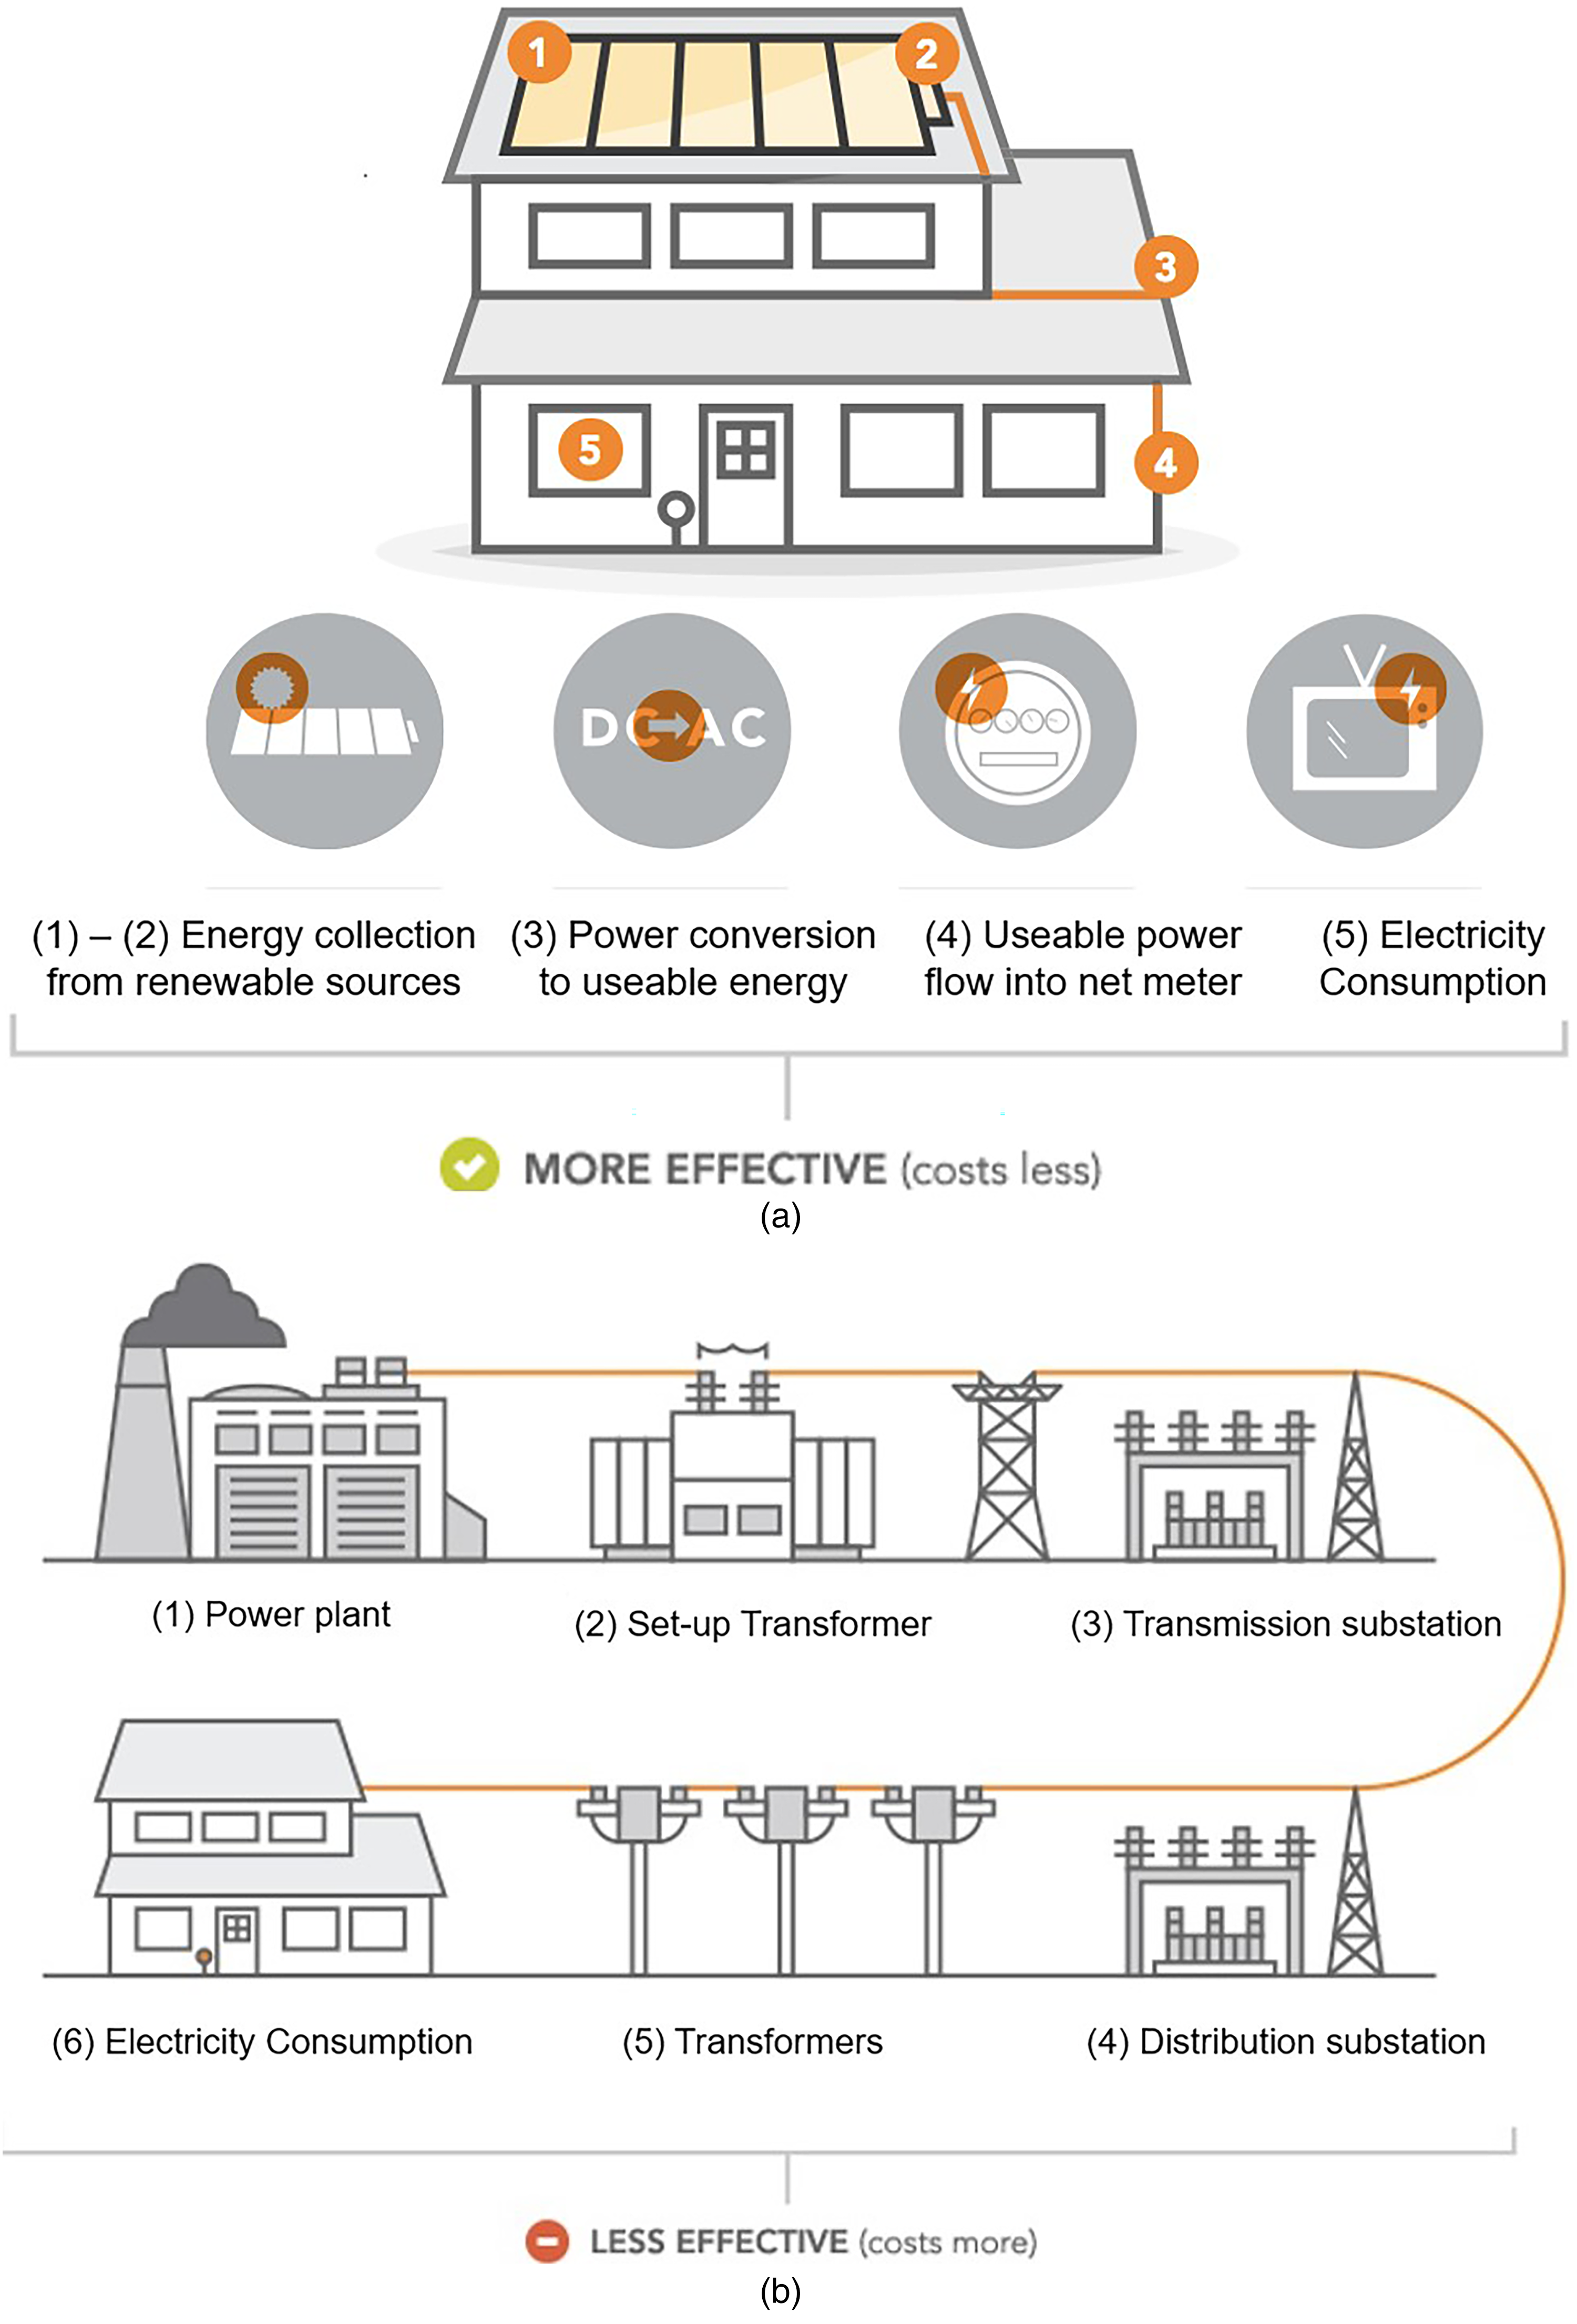
Off-grid renewable versus traditional on-grid distributed systems.
Solar power generation
Solar power continues to be the fastest-growing renewable source, with 2023 installed capacities almost doubling wind (Ren21, 2022). It is the cleanest and most reliable renewable, increasingly gaining popularity due to cost competitiveness. Reddy et al. (Reddy et al., 2013) discussed solar's attractiveness as a viable option for grid-connected and distributed electrical production.
The technology uses photovoltaic panels of silicon to transform sunlight into electricity. The PV cells connect to a circuit breaker via inverters that convert direct current (DC) to alternate current (AC) power. The inverter, production meter, and net meter control the system, consuming the generated energy in operating loads before feeding excess to the grid. In the case of excess power generation, the DC could be converted to 120/240 V AC and fed into utility distribution systems (Jaiswal et al., 2016).
Wind power generation
Wind power utilizes the strength of wind to generate electricity by spinning turbines. The turbines are used to collect the wind's kinetic energy in the form of airflow. The airflow drives the turbine, which is connected to a generator which converts the wind's kinetic energy into mechanical energy and subsequently into electrical energy.
The main components of the wind turbine include a blade or rotor and an enclosure called a nacelle, which contains a drive train atop a tall tower. The largest turbines as of year 2022 could produce 4.8–9.5 MW electricity, have a rotor diameter that may extend more than 162 meters (about 531 feet), and are attached to towers approaching 240 meters (787 feet) tall. The most common types produce up to 1.8 MW, much smaller and with blade lengths of approximately 40 meters that are attached to approximately 80 meters tall towers (DOE, 2022).
Geothermal power generation
Geothermal power, the next largest renewable source after solar PV and wind, generates electricity from steam produced by heat from hot water reservoirs miles below the Earth's surface. The steam rotates a turbine activating a generator to produce electricity. The heat is continuously replenished, providing consistent rather than intermittent power, resulting in a high load factor. It offers significantly more megawatts per unit of generation capacity compared to wind or solar but has limited geographical availability.
DiPippo's review (Dipippo, 2005) provided a comprehensive overview of geothermal power production, covering resource discovery and characterization, energy conversion systems, and design and economic considerations. The renewable source has substantial potential in specific locations to provide reliable, carbon-free baseload power. While not as globally scalable as wind and solar, geothermal can play an important role in the renewable energy mix for countries with suitable underground reservoirs. Technological advancements in exploration, drilling, and energy conversion could expand its deployment. Adding geothermal to renewable energy portfolios, where viable, could add to the diversity and reliability of sustainable power systems.
Renewable energy system factors
A functionally developed renewable energy systems environment is important to achieving renewable energy growth targets to driving smooth interactions of all necessary elements. Systems theory (Bertalanffy, 1969) characterizing assemblages of interdependent parts as in most systems environments also applies to the renewable energy ecosystem. The sustainability target operates in an open system environment, where different internal and external systemic factors outside the UN sustainable development goals affect the ability to meet targets across national income categories. Various factors exist, but the most pertinent ones such as government policies, market competition, technological advancements, supply chain, end users/ local population, etc. found to have the most determining effects are discussed. The factors were identified from a thorough review of the systemic factors that affect the adoption of new technologies geered towards promoting social causes, while also considering pricing influences from the current market trajectories (Aslani et al., 2014; Azhgaliyeva et al., 2018; Cardella et al., 2018; Ellabban et al., 2014; Elizondo Azuela and Barroso, 2012; Gonenc and Yurukova, 2014; Irandoust, 2016; Loock, 2012; Sawin, 2004). The identified factors, illustrated in Figure 2 are found to play direct or indirect roles in the success of renewable energy development.

Renewable energy systemic factors.
Government policies
The strength of government policies play huge impacts in the success of renewable energy programs (Carfora et al., 2018; Delmas and Montes-Sancho, 2011; Kitzing et al., 2012; Polzin et al., 2019; Sambo, 2009; Vasseur, 2016). Governments set the tone through standards, regulations, enabling environments, incentives, aids, etc. influencing participation levels. Economics plays a role in energy choices, so governments must balance economics and social responsibility in achieving renewable targets. The government's seriousness in promoting renewables influences the renewable mix in nations’ total electricity generation.
For example, China's effective policies and subsidies have been key to boosting its world-leading renewable energy capacity. Kennedy's research (Kennedy, 2013 ) found China had only 117 GW of hydroelectric capacity with almost no wind, solar, or biomass power in 2005 when it passed its renewable energy law. By 2012, thanks to its laws followed by regulations, amendments, and targets, the country built nearly 70 GW of wind, solar, and geothermal capacity, demonstrating the power of government commitment.
Market competition
Market competition is inevitable when different entities seek a market share of a demand (Loock, 2012). For renewable energy, other sources compete for electricity market share through pricing. Owebor et al. (Owebor et al., 2021) described how abundant fossil resources compete with modern renewable growth. Renewable energy's level of price competitiveness would be an important factor for its development in a market system.
The declining prices of solar and wind continue to make them more competitive with natural gas, but still less than coal, raising debate about coal's use over cleaner renewables in many parts of the world. Lazard's (Lazards, 2021) analysis puts the levelized cost of wind energy as low as 2–6 cents/kWh, depending on location, comparable to fossil generation ranging from 5–17 cents/kWh. Evolving technologies are expected to continue driving renewable competitiveness, spurring more investment in turn.
Technological advancements
Innovations to improve technologies are important for renewables to gain electricity market share (Aslani et al., 2014; Ellabban et al., 2014; Loock, 2012; Zhao, 2001). Aslani (Aslani et al., 2013, 2014) described insufficient technology from R&D to market in creating customer value as a major challenge to competitive renewable adoption, e.g., in exploration, conversion efficiencies, storage, transmission, etc. Besides the technoloJenngy itself, sufficient skills for construction, operations, and maintenance across economic and regional categories are also important to develop. However, recent innovations are continuously reducing the prices of solar and wind renewable energy, promoting cost competitiveness.
The ongoing technological progress and falling costs of wind turbines and solar PV modules have been well-documented in studies like Wiser et al. (Wiser et al., 2016) and Kavlak et al. (Kavlak et al., 2018). Improvements in materials, design, manufacturing, and economies of scale have steadily chipped away at levelized costs, positioning these technologies as cost-competitive with conventional generation in many contexts. Further R&D advancements in areas such as high-efficiency solar cells, floating offshore wind platforms, utility-scale storage, smart grid management, etc. can accelerate the transition to majority renewable power systems.
Supply chain
A supply chain is necessary for successful technology implementation. The renewable supply chain includes innovators, system integrators, original equipment manufacturers (OEMs), EPC companies, panel builders, O&M companies, etc. relating to human and material resource availability for renewable programs.
Wee et al. (Wee et al., 2012) noted developed strategies can help overcome renewable development barriers, and highly efficient operations coping with supply/demand uncertainty help develop the resource. Close supply chain collaboration produces steady innovation streams; however, this is limited in many regions due to the energy sources’ nascent development. OEMs’ need to secure market portfolios still limits technology disclosure, hindering the supply chain in turn.
Strengthening local supply chains is particularly important for renewable energy growth in developing economies. A case study of the Indian market was discussed in the review conducted by Nagesha et al. (Nagesha and Balachandra, 2006) identified local supply chain as a particularly important efficiency factor, and how setting appropriate prioritization can enhance it. component of Achieving nationally defined renewable goals often requires overcoming industrial policy challenges to nurture homegrown suppliers and manufacturers of wind turbines, solar panels, power generators, etc. Building local capabilities in production, assembly, construction, operations, and maintenance can decrease reliance on imports while creating green jobs. Enabling frameworks around skill development, knowledge spillovers, and industry coordination are keys to a robust domestic renewable energy supply chain.
Investors
Power generation is not solely the government's business; effective program implementation needs strong private-sector participation (Brennan et al., 2004; Gonenc and Yurukova, 2014). Brennan et al. (Brennan et al., 2004) reported that 80% of US power generation and 75% of distribution is through private partnerships. Investors’ support for renewables’ social cause and profitability influences their participation level. Profitability usually precedes social objectives, and sensing systems with supportive policies to achieve financial goals influence participation. Support often comes as government incentives, developed technologies, socially responsible environments, etc.
Renewable energy involves higher investment and lower operating costs than other sources, making projects riskier amid policy and regulatory uncertainty. Financial incentives and support systems can offset risks to attract investors. A study of 18 renewable investment programs by Ozcan et al. (Ozcan, 2018) found the primary incentive system as the most important support factor. The study also found profitability potential, conformance to portfolio strategies, political stability, investment security, local awareness and acceptance, technology, skilled labor, etc. as prominent reasons for renewable investment.
Vagliasindi (Vagliasindi, 2012) investigated factors determining private energy investment, finding government support through feed-in tariffs influences renewable power investment. He also found that economy-wide factors like corruption and political competition often emphasized as investment drivers, are important at the entry stage for energy market decisions. Investors also require technical and regulatory certainty about renewable-ready transmission resource availability to finance investments.
End users
End users’ interest in sustainability and the acceptance of renewables lends to their support for the power source option. Energy pricing plays a role, with decisions usually made at the intersection of social responsibility and cost. At the current state of development with high upfront costs, renewable energy prices still exceed some other sources such as coal. Like investors, end-users also likely require incentives for competitive acceptance of renewable energy. Customer price compensation at retail electricity rates through net metering boosts renewable adoption willingness. Corporate social responsibility and falling renewable prices also influence industrial and commercial renewable choices.
Researchers such as Stigka et al. (Stigka et al., 2014) have explored end-user psychology and energy choices, finding education, environmental values, social norms, and trust in institutions shape renewable energy attitudes and behaviors. Policies should go beyond economic self-interest and aim to shift cultural perspectives. Effective public engagement, tailored communication, and emphasis on local co-benefits are important.
Community renewable energy projects with local ownership stakes have been successful in building public support, as Bauwens et al. (Bauwens et al., 2016) discuss for several European countries. Helping residential and commercial customers become prosumers, both energy consumers and producers, through rooftop PV or small wind installations empowers them as energy citizens with a stronger interest in the renewable transition. Group purchasing schemes, on-bill financing, low-interest loans, and other supportive mechanisms can enable end-user investment in distributed renewables.
The local population's sustainability perspective determines their efforts to ensure renewable program success in their immediate locality. Kardooni et al. (Kardooni et al., 2016) emphasized using renewable policies to address public perception and awareness in Peninsular Malaysia. It is not enough that there are good policies in place, it is also very important how encompassing the policies are for all the stakeholders, which include the local population that will be the end users. Their inclusion and acceptance support program implementation and overall success.
Local population inclusion through ownership-providing programs also aids acceptance and local growth. Salm et al. (Salm et al., 2016) investigated the local population's influence on German renewable projects, finding citizens own almost half the renewable capacity, and “local patriots” are most willing to forgo returns on local projects. The local population's motives beyond just financial gains are important to reaching renewable goals.
Community engagement in siting decisions and benefit sharing are recurring success factors for local renewable project support, in both developed and emerging economies. Building trust through participatory processes, respectful dialogue, and responsiveness to community concerns is key. Devine-Wright et al.'s (Devine-Wright, 2005) review highlighted the importance of place attachment and distributive and procedural justice in shaping social acceptance of renewable deployment. Perceptions of fairness in both economic outcomes and decision-making processes influence local attitudes. Increasingly, community benefit agreements with local revenue sharing or infrastructure improvements are relevant to enhancing public support and maximizing local value creation from renewables.
Renewable energy capacities
Renewable energy capacities of countries across economic categories are influenced by developed systems and enabling government policies. As discussed, access to technologies, skills, supply chains, funding, etc. play crucial roles in influencing growth in leading renewable countries. Figure 3 shows some of these leading installed capacities as of 2023, with explanations provided for the contributing factors to their renewable energy development.

Leading countries in installed renewable energy capacity worldwide in 2023. Based on the Statistica Review (IRENA, 2023).
Solar PV and wind contribute the largest shares, driven by their natural abundance. Wind remains the top modern renewable power source while solar has been the fastest-growing in recent years. In 2023, China, the United States, Brazil, Germany, India, France, and Canada, which were part of the global top 9 renewable countries added the most wind capacity. Solar energy followed wind energy, with 8 of the top 10 solar energy generating countries – China, the United States, India, Japan, Germany, Brazil, Australia, Spain, and Italy also in the top 8 for overall renewable energy countries.
Wind's growth is encouraged by climate friendliness and onshore/offshore viability. Recent growth has been supported by incentives like tax credits and myriad federal and state policies, improving competitiveness and encouraging user acceptance. Lazard's (Lazards, 2021) analysis puts wind costs as low as 2–6 cents/kWh depending on location, comparable to fossil generation at 5–17 cents/kWh. Recent rapid growth shows high potential, with industry projections of 20% of total electricity by 2030.
Solar has also seen incremental growth, with capacities nearly quadrupling in the last decade. Solar accounted for over 50% of renewable additions from 2019–2021, and according to the IEA (Kavlak et al., 2018), is expected to be 60% of global renewable capacity increases in 2022, taking a total of over 300 GW, mostly driven by favorable government policies.
Renewable energy growth in leading countries relates to their economic growth. Economic growth drives energy demand and developing cheap energy sources enables further economic growth. The competitive prices of wind and solar power are fueling their rapid growth in these countries. Technologies, policies, and energy demand are key factors in renewable energy growth. These factors apply across regions, with Asia and the US leading, followed by Europe, due to their combinations of available technologies, effective policies, and market demand.
Economic, social and natural resources influences
To realize renewable energy targets set forth by the UN for global energy production, the effect of national economy, social, and natural endowment influences by income categories should be considered. Some case studies of these effects are examined to support their contributions.
Economic influences
The World Bank Atlas method (Bank, 2022) defines national income classifications based on GNI per capita. Table 1 provides a list of the World Bank economic categories for countries, with more details of the categorization and renewable energy targets provided in Appendix A–D.
National income classification (Bank, 2022).

Growth factors across national income categories are influenced by economic factors, which directly influence the level of developed systems, and the adoption of green energy like renewables. The higher the level of economic development, the more likely the stability of financial systems and access to capital, grid infrastructure, energy market structure, technological capabilities, human capital, etc., which facilitates renewable energy development.
Well-developed financial markets in high-income economies enable easier project financing, such as diverse financing options (commercial banks, green bonds, yield, etc.) and lower perceived risk that lead to better lending terms. Low-income countries, however, usually experience limited access to affordable long-term financing which likely impedes the development of renewable energy projects in such economies. According to the 2022 World Bank development indicators (Bank, 2022), high perceived risks lead to risk premiums of 5–15% on debt for renewable projects, and there was mostly limited capacity of local financial sectors to assess and finance renewable energy projects in low-income economies. There was also the lack of long-term local currency financing options available to renewable energy development in such economies. A solution to the deficit can be provided by intentionally strengthening local financial institutions’ capacity, developing risk mitigation instruments, promoting innovative financing mechanisms, etc. which can be enabled by governments in the local domain or through external intervention.
Grid infrastructure and energy market structure are other vital features that influence renewable energy development. High and upper-middle-income countries with robust grids and liberalized market structures are generally better positioned to facilitate the integration of renewable energy. A case study is the situation in China (an upper-middle-income economy) where the country's rapid renewable energy growth has been supported by massive grid expansion (Zhao et al., 2012). The country invested over $65 billion in ultra-high voltage (UHV) transmission lines between 2009 and 2015, which enabled large-scale wind and solar deployment in resource-rich western regions. Low and lower-middle-income economies often face weaker grids and monopolistic structures which pose challenges for renewable integration. This is experienced in countries like Nigeria (lower-middle-income) where the power sector faces significant infrastructure and market structure challenges. There are issues of unreliable grids with frequent blackouts and high transmission losses, and the results are that renewable energy development is hampered despite significant potential and only about 55% of the population has access to electricity.
In terms of technology and human resources, high-income countries are found to have more enabling environments welcoming strong domestic renewable energy industries, where skilled workforces can contribute to faster adoption and innovation. The situation is found usually different in lower-income economies, often reliant on imported technology and expertise, and limiting local industry development. An analysis of education and R&D by IRENA in 2020 (IRENA, 2020) found countries with higher education levels and R&D spending had faster renewable energy adoption rates irrespective of income categories. The situation in lower-income economies can be improved through local and external interventions, aimed at investing in technical and vocational education, promoting technology transfer and local manufacturing, encouraging R&D partnerships with universities and the private sector, etc.
Renewable energy policies, targets, and support
Policies provide effective tools to drive national renewable energy objectives. Its attributes such as legislation, treaties, investment incentives, conservation guidelines, taxation, etc., are implemented to facilitate renewable resource integration and growth at all levels. Countries with renewable energy policies and targets continue to increase across income national income categories, with success stories evident in China, Germany, Iceland, Turkey, India, Maldives, Morrocco, etc.
Different categorizations of renewable policies have been reported (Benitez, 2012; Elizondo Azuela and Barroso, 2012). Elizondo and Barroso (Elizondo Azuela and Barroso, 2012) applied performance of price instruments, quantity and procurement mechanisms, cost reduction/financial incentives, fiscal incentives, and other measures; while Benitez (Benitez, 2012) lists regulations and standards, quantity instruments, price instruments, procurement policies, and auctions. But still, the different categorizations all fall under (i) regulations and standards, (ii) fiscal incentives, and (iii) public financing.
Regulations and Standards, duly applied, directly or indirectly support renewable growth, from removing non-economic barriers to increasing demand to restricting some fossil generation. This may legislatively define what is permitted. Examples include feed-in tariffs, utility quotas, net metering, tradable certificates, etc. Fiscal Incentives (or tax incentives) are government subsidies encouraging sector growth. According to Kerr et al. (Kerr et al., 2017), the incentives make investments more desirable than otherwise. Examples include investment/production tax credits, capital subsidies/grants, VAT, production pay subsidies/rebates, production payments, etc. Public Financing promotes the application of public funds like taxes to grow renewable power. The funds finance public and private projects, policies, and programs and are usually applied by governments, export credit/aid agencies, development banks, international entities, etc. Examples include public investment, loans/grants, competitive bidding, etc.
Definite policies and targets are necessary for substantially increasing the global renewable percentage. Set targets express policymakers’ deployment commitments and increase renewables’ attractiveness relative to other sources. Each UN member is expected to have individual or regional targets toward the overall goal. Table 2 summarizes some leading countries’ targets, with more details in Appendices A-D by income category.
Policy instruments in some of the leading renewable energy installed capacity countries. Based on the Statistica Review (Statistica Review, 2021).

The high and upper-middle-income economies are found to be typically associated with strong and consistent renewable energy policies. China's effective policies and subsidies have been key to its world-leading renewable capacity (Kennedy, September / October 2013; Zhao, 2001). Kennedy (Kennedy, 2013) determined China to have just 117 GW of hydroelectric, with almost no wind, solar, or biomass in 2005 when it passed its renewable law. However, by 2012 has built nearly 70 GW of wind, solar, and geothermal due to attractive laws, regulations, amendments, and targets.
The United States follows China, with incentives offered at the national, state, and county levels to promote renewables. Next to the United States, the EU-28 countries lead, guarded by joint growth commitments. The 2009/28/EC directive establishes an overall renewable promotion policy, with a 20% target for 2020 and 27% for 2030, achieved by national targets and policies. Their renewable development levels also reflect OECD countries’ advanced efficiency policy frameworks. Germany provides an excellent case study where their Renewable Energy Sources Act (EEG), introduced in 2000 has provided a cornerstone for an Energiewende (energy transition) policy (Oschmann, 2010). The EEG established a feed-in tariff (FIT) system that guaranteed fixed payments for renewable electricity fed into the grid. According to Pegels & Lütkenhorst (Pegels and Lütkenhorst, 2014), the policy featured a long-term (20-year) guaranteed payment that provided investment security, differentiated tariffs (based on technology, size, and location), and regular adjustments to reflect technological progress and cost reductions. That helped result in a solar PV capacity growth from 76 MW in 2000 to over 36 GW by 2013, a wind capacity increase from 6 GW to 34 GW in the same period, and a renewables’ share increase in total electricity consumption from 6.2% in 2000 to 23.4% by 2013.
Policy inconsistencies and lack of long-term planning in low and middle-income economies on the other hand often hinder their renewable development. A case study is Kenya with huge potential for geothermal and wind energy, but hampered development. The country, a lower-middle-income country, has significant potential but is facing policy-related challenges. Kiplagat et al. (Kiplagat et al., 2011) discussed the inconsistencies in the country's feed-in-tariff policy which was introduced in 2008 and revised in 2010. The initial policy lacked clear guidelines and was perceived as too rigid, with the revision aimed at addressing the shortcomings failing to achieve its objectives. This only created other uncertainties, making geothermal development slower than planned for the 2000 MW target set for 2030. It also led to delays in the Lake Turkana Wind Power project (310 MW), resulting in more than a decade of completion from conception to commissioning. However, recent policy frameworks in the lower-income economies of sub-Saharan Africa, Latin America, and the Caribbean are adding to the pace of development, which is majorly due to public financing intervention (Ozoegwu and Akpan, 2021; Polzin et al., 2019; Shen et al., 2018).
Natural resource endowment
Natural resources endowment itself is not a sufficient determining factor for renewable energy development. It works hand-in-hand with economic factors that generally influence enabling policies that encourage renewable development. High-income economies are mostly able to overcome resource limitations through imports or alternative technologies, which may be unavailable in lower-income economies.
A case study is the situation of Iceland, a high-income economy that has leveraged its abundant geothermal resources. Shortall & Kharrazi (Shortall and Kharrazi, 2017) described how Geothermal provides about 25% of the country's electricity and 66% of primary energy use, which was enhanced by the long-term support of the government for R&D and exploration which has led to developed world-class expertise, which is now exported globally. The level of economic development afforded the level of government support from enabling policies which provided the opportunity to better harness the natural resource endowment.
Morocco, a lower-middle-income economy with a good level of enabling policies is capitalizing on its solar potential, leading to some major developments. Choukri et al. (Choukri et al., 2017) described how natural resource endowment and the Moroccan Solar Plan (MSP) enabled renewable energy development in the country. The launch in 2009 targeted a goal of reaching 42% of installed capacity, equivalent to 6000 MW from renewable energy by the year 2020 and the goal of reaching 52% of installed capacity from renewables by 2030. This led to the development of the Noor Ouarzazate Solar Complex, one of the world's largest concentrated solar power (CSP) plants, with which the country has since reached its 2020 renewable target and is on track to meet its 2030 target. However, Nigeria, another lower-middle-income economy with an abundance of renewable energy resources, but poor policies is not making much headway. The country is faced with hampered renewable development despite its abundant natural endowment, highlighting the importance of developed policies in addition to the natural resource endowments for successful development.
Concluding remarks
This review work has examined the systemic factors influencing the development of modern renewable energy across different national income categories. The analysis reveals several key insights and patterns crucial to understanding the global transition towards sustainable renewable energy systems.
The level of economic development significantly impacts a country's ability to implement and scale renewable energy technologies. High-income and upper-middle-income countries generally have more robust financial systems, better infrastructure, and greater technological capabilities, which facilitate faster adoption of renewable energy. However, some lower-income countries have made remarkable progress through targeted policies and international support. Effective policy instruments are crucial drivers of renewable energy growth across all income categories. Feed-in tariffs, renewable portfolio standards, tax incentives, and public financing have been particularly effective. Countries with consistent, long-term policy commitments tend to see the most substantial growth in renewable energy capacity. Ongoing innovations in solar PV, wind power, and energy storage technologies have dramatically reduced costs, making renewables increasingly competitive with fossil fuels. This trend has enabled broader adoption, particularly in middle and low-income countries where cost has been a significant barrier. While natural resource availability is important, it is not the sole determinant of renewable energy success. Countries with less favorable natural conditions have still achieved significant renewable energy penetration through innovative policies and technologies. Countries with liberalized energy markets and robust grid infrastructure are generally better positioned to integrate large amounts of renewable energy. However, some developing countries are leveraging renewable technologies to implement distributed energy systems, potentially leapfrogging traditional centralized grid models. Global initiatives and international financing mechanisms play crucial roles, especially for lower-income countries. Programs like the Green Climate Fund and bilateral development assistance have accelerated renewable energy deployment in many developing nations.
Recommendations
While there are common success factors, renewable energy strategies must be tailored to each country's specific economic, political, and social context. One-size-fits-all approaches are unlikely to succeed. National governments across income categories should strive for long-term policy stability to provide investors and developers with the confidence needed for large-scale renewable energy projects. Renewable energy development should be integrated with broader economic and social development goals, particularly in lower-income countries where energy access remains a challenge. Investing in local technical expertise and manufacturing capabilities is crucial for sustainable long-term growth in renewable energy sectors. Countries at all income levels should prioritize grid infrastructure upgrades to accommodate higher shares of variable renewable energy. Continued investment in R&D is essential to further reduce costs and improve the performance of renewable technologies, with a particular focus on energy storage and grid integration solutions. Policies should be designed to ensure that the benefits of renewable energy transitions are broadly shared, addressing potential job displacements in fossil fuel industries and energy access issues for marginalized communities.
In conclusion, the global transition to renewable energy is progressing at varying speeds across different national income categories. While challenges remain, particularly for lower-income countries, the overall trend is positive. Technological advancements, declining costs, and increasingly supportive policy environments are creating unprecedented opportunities for renewable energy development worldwide. By learning from successful models and adapting strategies to local contexts, countries at all income levels can accelerate their transition to sustainable, clean energy systems, contributing to global climate goals and fostering sustainable economic development.
Footnotes
Declaration of conflicting interests
The author declared no potential conflicts of interest with respect to the research, authorship, and/or publication of this article.
Funding
The author received no financial support for the research, authorship, and/or publication of this article.
Authors Biographies
Appendix A
Renewable energy policy and targets in the high-income economies. Based on (Ren21, 2022).

| RE Target | Regulatory | Fiscal Incentives | Public Financing | ||||||||||
|---|---|---|---|---|---|---|---|---|---|---|---|---|---|
| Feed-in-Tariffs | Electricity Utility Obligation/ RPS | Net Metering/ billing | Transport Obligation | Heat Obligation | Tradable REC | Tendering | Investment Tax Credit | Reduction in Sales, Energy, and other taxes | Energy Production payment | Public Investment, loans, grants, subsidies | |||
| Countries | Region | Total | 33 | 17 | 25 | 32 | 17 | 27 | 30 | 18 | 30 | 12 | 40 |
| Andorra | Europe & Central Asia | P | ● | ● | ● | ||||||||
| Austria | E, P | ● | ● | ● | ● | ● | ● | ● | |||||
| Belgium | E, P | ◖ | ◖ | ● | ● | ● | ● | ● | ● | ◖ | |||
| Cyprus | E, P | ● | ● | ● | ● | ● | |||||||
| Czech Rep. | E, P | ● | ● | ● | ● | ● | ● | ||||||
| Denmark | E, P | ● | ● | ● | ● | ● | ● | ● | ● | ||||
| Estonia | E, P | ● | ● | ● | ● | ||||||||
| Finland | E, P | ● | ● | ● | ● | ● | ● | ||||||
| France | E, P | ● | ● | ● | ● | ● | ● | ● | ● | ||||
| Germany | E, P | ● | ● | ● | ● | ● | ● | ● | ● | ||||
| Greece | E, P | ● | ● | ● | ● | ● | ● | ● | ● | ● | ● | ||
| Hungary | E, P | ● | ● | ● | ● | ● | ● | ||||||
| Iceland | E | ● | ● | ● | |||||||||
| Ireland | E, P | ● | ● | ◖ | ● | ● | |||||||
| Italy | E, P | ● | ● | ● | ● | ● | ● | ● | ● | ||||
| Latvia | E, P | ● | ● | ● | ● | ● | ● | ● | ● | ● | |||
| Liechtenstein | P | ● | |||||||||||
| Lithuania | E, P | ● | ● | ● | ● | ● | ● | ||||||
| Luxembourg | E, P | ● | ● | ● | |||||||||
| Netherland | E, P | ● | ● | ● | ● | ● | ● | ● | ● | ||||
| Norway | E | ● | ● | ● | ● | ● | ● | ||||||
| Poland | E, P | ● | ● | ● | ● | ● | ● | ● | |||||
| Portugal | E, P | ● | ● | ● | ● | ● | ● | ● | |||||
| Slovak Rep. | E, P | ● | ● | ● | ● | ● | |||||||
| Slovenia | E, P | ● | ● | ● | ● | ● | ● | ● | ● | ||||
| Spain | E, P | ● | ● | ● | ◯ | ● | ● | ● | |||||
| Sweden | E, P | ● | ● | ● | |||||||||
| Switzerland | E | ● | ● | ● | ● | ● | ● | ||||||
| United Kingdom | E, P | ● | ● | ● | ● | ◯ | ● | ● | ● | ||||
| Uruguay | E | ● | ● | ● | ● | ● | ● | ● | |||||
| Canada | North America | P | ◖ | ◖ | ◖ | ● | ⦇ | ● | ● | ● | |||
| United States | ◖ | ◖ | ◖ | ● | ◖ | ◖ | ⦇ | ● | ● | ● | |||
| Argentina | E, P | ● | ● | ● | ◯ | ● | ● | ● | ● | ||||
| Barbados | P | ● | ● | ● | |||||||||
| Chile | E, P | ● | ● | ● | ◯ | ● | ● | ● | ● | ||||
| Palau | E, P | ● | |||||||||||
| Trinidad and Tobago | P | ● | ● | ||||||||||
| Brunei | East Asia & Pacific | P | ● | ● | |||||||||
| Japan | E, P | ● | ● | ● | ● | ● | |||||||
| Korea Rep. | E, P | ● | ● | ● | ● | ● | ● | ● | ● | ● | |||
| Singapore | P | ● | ● | ● | ● | ||||||||
| Australia | P | ◖ | ● | ◖ | ◖ | ◖ | ● | ⦇ | ● | ||||
| New Zealand | P | ◖ | ● | ● | |||||||||
| Bahrain | Middle East & North Africa | P | ● | ● | |||||||||
| Israel | E, P | ● | ● | ● | ● | ● | ● | ● | |||||
| Kuwait | P | ● | |||||||||||
| Malta | E, P | ● | ● | ● | ● | ● | |||||||
| Oman | P | ◯ | |||||||||||
| Qatar | P | ● | |||||||||||
| Saudi Arabia | P | ● | ● | ||||||||||
| United Arab Emirates | E, P | ◖ | ◖ | ◖ | ◖ | ◖ | ◖ | ||||||
| Seychelles | Sub-Saharan Africa | P | ● | ● | ● | ● | |||||||
E represents primary energy targets, while P represents power targets, with the appending keys identifying renewable energy policies at the national and local levels.
● National.
◖ Existing sub-national policy or tender framework, but not national.
◯ National tender held in 2017.
⦇ Sub-national tender held in 2017.
Appendix B
Renewable energy policy and targets in upper middle-income economies. Based on (Ren21, 2022).

| RE Target | Regulatory | Fiscal Incentives | Public Financing | ||||||||||
|---|---|---|---|---|---|---|---|---|---|---|---|---|---|
| Feed-in- Tariffs | Electricity Utility Obligation/ RPS | Net Metering/ billing | Transport Obligation | Heat Obligation | Tradable REC | Tendering | Investment Tax Credit | Reduction in Sales, Energy, and other taxes | Energy Production payment | Public Investment, loans, grants, subsidies | |||
| Countries | Total | 22 | 8 | 11 | 22 | 4 | 3 | 21 | 10 | 24 | 6 | 28 | |
| Albania | Europe & Central Asia | E | ● | ● | ● | ● | ● | ● | ● | ● | ● | ● | |
| Azerbaijan | P | ● | |||||||||||
| Belarus | E | ● | ● | ● | ● | ||||||||
| Bosnia and Herzegovina | E | ● | ● | ||||||||||
| Bulgaria | E, P | ● | ● | ● | |||||||||
| Kazakhstan | P | ● | ● | ● | |||||||||
| Macedonia, FYR | E, P | ● | ● | ● | |||||||||
| Montenegro | E, P | ● | ● | ● | |||||||||
| Romania | E, P | ● | ● | ● | ● | ||||||||
| Russia | P | ● | ◯ | ● | |||||||||
| Serbia | E, P | ● | ● | ● | |||||||||
| Turkey | P | ● | ● | ◯ | ● | ||||||||
| Belize | Latin America & Caribbean | P | ● | ||||||||||
| Brazil | E, P | ● | ● | ◖ | ● | ● | ● | ● | |||||
| Colombia | P | ● | ● | ● | ● | ||||||||
| Costa Rica | P | ● | ● | ● | ● | ● | ● | ||||||
| Croatia | E, P | ● | ● | ● | |||||||||
| Dominican Rep. | P | ● | ● | ● | ● | ● | ● | ||||||
| Ecuador | P | ● | ● | ● | ● | ● | |||||||
| Fiji | E, P | ● | ● | ||||||||||
| Grenada | E, P | ● | ● | ||||||||||
| Guyana | E, P | ● | |||||||||||
| Jamaica | E, P | ● | ● | ● | ● | ● | |||||||
| Mexico | P | ● | ● | ◯ | ● | ● | |||||||
| Panama | E | ● | �� | ● | ● | ● | ● | ● | |||||
| Paraguay | P | ● | ● | ||||||||||
| Peru | P | ● | ● | ● | ● | ● | ● | ● | |||||
| Venezuela | P | ||||||||||||
| China | East Asia & Pacific | E, P | ● | ● | ◖ | ● | ● | ● | ● | ● | ● | ||
| Malaysia | P | ● | ● | ● | ◯ | ● | ● | ||||||
| Thailand | E, P | ● | ● | ● | ● | ● | |||||||
| Algeria | Middle East & North Africa | E, P | ● | ● | ● | ● | |||||||
| Iran | P | ● | ● | ● | ● | ||||||||
| Iraq | P | ● | |||||||||||
| Lebanon | E, P | ● | ● | ● | |||||||||
| Libya | E, P | ● | |||||||||||
| Malaysia | P | ● | ● | ● | ◯ | ● | ● | ||||||
| Botswana | Sub-Saharan Africa | P | ◯ | ● | ● | ||||||||
| Gabon | E, P | ||||||||||||
| Mauritius | P | ● | ● | ● | ● | ||||||||
| Namibia | P | ● | |||||||||||
| South Africa | P | ● | ● | ● | ● | ● | ● | ||||||
● National.
◖ Existing sub-national policy or tender framework, but not national.
◯ National tender held in 2017.
⦇ Sub-national tender held in 2017.
Appendix C
Renewable energy policy and targets in lower middle-income economies. Based on (Ren21, 2022).

| RE Target | Regulatory | Fiscal Incentives | Public Financing | ||||||||||
|---|---|---|---|---|---|---|---|---|---|---|---|---|---|
| Countries | Region | Feed-in-Tariffs | Electricity Utility Obligation/ RPS | Net Metering/ billing | Transport Obligation | Heat Obligation | Tradable REC | Tendering | Investment Tax Credit | Reduction in Sales, Energy, and other taxes | Energy Production payment | Public Investment, loans, grants, subsidies | |
| 44 | Total | 25 | 8 | 22 | 12 | 3 | 5 | 23 | 11 | 23 | 7 | 24 | |
| Armenia | Europe & Central `Asia | P | ● | ◯ | ● | ||||||||
| Kosovo | E | ● | |||||||||||
| Kyrgyz Rep. | P | ● | ● | ● | |||||||||
| Moldova | E, P | ● | ● | ● | ● | ● | |||||||
| Tajikistan | P | ● | ● | ● | |||||||||
| Ukraine | E, P | ● | ● | ● | ● | ● | |||||||
| Uzbekistan | E, P | ● | |||||||||||
| Bolivia | Latin America & Caribbean | E | ● | ● | ● | ◯ | ● | ● | ● | ||||
| Guatemala | E, P | ● | ● | ● | ● | ● | |||||||
| Honduras | P | ● | ● | ● | ● | ● | |||||||
| Nicaragua | P | ● | ● | ● | ● | ||||||||
| Philippines | P | ● | ● | ● | ● | ● | ● | ● | ● | ● | |||
| Mongolia | E, P | ● | ● | ● | |||||||||
| Vietnam | E, P | ● | ● | ● | ● | ● | ● | ● | ● | ||||
| Bangladesh | South Asia | E | ● | ● | ● | ● | ● | ● | |||||
| India | P | ◖ | ◖ | ● | ◖ | ● | ◯ | ● | ● | ● | ● | ||
| Indonesia | E, P | ● | ● | ● | ● | ● | ● | ● | |||||
| Pakistan | P | ● | ● | ● | ● | ● | ● | ||||||
| Sri Lanka | P | ● | ● | ● | ● | ◯ | ● | ● | ● | ||||
| Jordan | Middle East & North Africa | E, P | ● | ● | ● | ● | ● | ● | |||||
| Morocco | P | ● | ● | ● | |||||||||
| Syria | E | ● | ● | ● | ● | ||||||||
| Tunisia | P | ● | ● | ● | |||||||||
| Yemen | P | ● | ● | ● | |||||||||
| Egypt | E, P | ● | ● | ● | ● | ● | |||||||
| Angola | P | ● | ● | ||||||||||
| Cape Verde | P | ● | ● | ● | ● | ||||||||
| Cameroon | P | ◯ | ● | ||||||||||
| Cote d’Ivoire | E, P | ● | ● | ||||||||||
| Ghana | E, P | ● | ● | ● | ● | ● | ● | ● | |||||
| Kenya | P | ● | ● | ● | ● | ● | ● | ● | ● | ||||
| Lesotho | P | ● | ● | ● | ● | ● | |||||||
| Nigeria | P | ● | ● | ● | ● | ● | |||||||
| Sao Tome and Principe | P | ||||||||||||
| Sudan | P | ● | |||||||||||
| Zambia | P | ● | ◯ | ● | ● | ||||||||
● National.
◖ Existing sub-national policy or tender framework, but not national.
◯ National tender held in 2017.
⦇ Sub-national tender held in 2017.
Appendix D
Renewable energy policy and targets in low-income economies. Based on (Ren21, 2022).

| RE Target | Regulatory | Fiscal Incentives | Public Financing | ||||||||||
|---|---|---|---|---|---|---|---|---|---|---|---|---|---|
| Countries | Region | Feed-in-Tariffs | Electricity Utility Obligation/ RPS | Net Metering/ billing | Transport Obligation | Heat Obligation | Tradable REC | Tendering | Investment Tax Credit | Reduction in Sales, Energy, and other taxes | Energy Production payment | Public Investment, loans, grants, subsidies | |
| 26 | Total | 5 | 1 | 2 | 5 | 1 | 1 | 7 | 2 | 15 | 1 | 9 | |
| Haiti | Latin America Caribbean | P | ● | ||||||||||
| Nepal | E, P | ● | ● | ● | ● | ● | ● | ||||||
| Benin | Sub-Saharan Africa | E, P | |||||||||||
| Ethiopia | P | ● | ◯ | ||||||||||
| The Gambia | P | ● | |||||||||||
| Guinea | E, P | ● | |||||||||||
| Liberia | E, P | ● | ● | ||||||||||
| Madagascar | E, P | ◯ | ● | ||||||||||
| Malawi | E, P | ● | ● | ● | ● | ● | |||||||
| Mali | E, P | ● | ● | ||||||||||
| Mozambique | HC | ● | ● | ● | |||||||||
| Niger | E, P | ● | ● | ||||||||||
| Rwanda | P | ● | ● | ● | ● | ● | |||||||
| Senegal | P | ● | ● | ● | ◯ | ● | |||||||
| Tanzania | P | ● | ● | ● | ● | ● | |||||||
| Togo | E, P | ● | |||||||||||
| Uganda | P | ● | ● | ● | ● | ||||||||
| Zimbabwe | P | ● | ● | ● | |||||||||
● National.
◖ Existing sub-national policy or tender framework, but not national.
◯ National tender held in 2017.
⦇ Sub-national tender held in 2017.