
Abstract
This article describes an approach applying computational intelligence methods for the problem of forecasting solar photovoltaic power generation at country level. Precise forecast of power generation plays a vital role in designing a dependable photovoltaic power generation system. The computed predictions enable the implementation of efficient planning, management, and distribution strategies for the generated power, ultimately enhancing the performance and efficiency of the system. The study analyzes and compares artificial neural network approaches for a specific case study using real solar photovoltaic power generation data from Uruguay in the period 2018 to 2022. Several artificial neural network architectures are evaluated for forecasting. The main results indicate that the approach applying a combination of Encoder-Decoder and Long Short Term Memory artificial neural networks is the most effective method for the addressed forecasting problem. The approach yielded promising results, with an average mean error value of 0.09, improving over the other artificial neural network architectures. Even better results were obtained for sunny days. The generated forecasts hold significant value for its application in planning and scheduling processes, aiming to enhance the overall quality of service of the electricity grid.
Introduction
In the crucial fight against climate change, renewable energy sources such as wind and solar power have gained significant importance due to their contribution to reducing greenhouse gas emissions. However, the integration of renewable energy sources into the electricity grid faces challenges due to their variability, intermittency, and low predictability (Halamay and Brekken, 2010). To overcome these challenges, precise and reliable predictions of renewable energy generation are crucial. These predictions play a vital role in enabling effective integration into smart grid operations, optimizing energy management, and ensuring the stability and reliability of the electric grid (Worighi et al., 2019).
In the last twenty years, there have been notable advancements in the development of forecasting models for renewable energy generation. These models utilize various data sources, such as historical energy production data, weather forecasts, and other relevant useful information. Computational intelligence models play a crucial role for the accurate prediction of the output of renewable energy sources (Zhang et al., 2022b). The main benefits of precise predictions of renewable energy generation are substantial, including enhanced grid reliability, decreased energy costs, and improved integration of renewable energy. Specifically, accurate prediction of power output is crucial in the design of reliable photovoltaic power generation systems. This capability facilitates effective planning, management, and distribution of generated power, ensuring optimal performance and efficiency of the system (Dashti and Rouhandeh, 2023; Dudek et al., 2023; Wang et al., 2022).
This article focuses on the utilization of computational intelligence models, specifically Artificial Neural Networks (ANN), for predicting solar photovoltaic power generation. A specific real case study is addressed, to predict solar photovoltaic power generation in Uruguay, using real data.. The research is part of a collaboration between Universidad de la República, Uruguay and the National electricity company (Administración Nacional de Usinas y Trasmisiones Eléctricas, UTE) to explore the application of computational intelligence models and their integration into complex optimization and operational tools for the smart grid. The study incorporates various data sources, using actual data spanning the period from 2018 to 2022.
The addressed subject is very important for Uruguay. According to the Latin American Energy Organization (www.olade.org, September 2023), Uruguay has achieved remarkable advancements in its electricity grid transition towards renewable energy sources. Renewable electricity generation in the country is over 85% of the energy mix, making Uruguay the sixth-ranked nation globally in terms of renewable energy share. The use of effective forecasting tools for renewable energy generation enables the development and optimization of operational strategies, ensuring reliable and high-quality service within the framework of smart grid principles (Aguiar and Pérez, 2023).
Several ANN architectures are studied in the analysis, including Convolutional Neural Networks (CNN), Long Short Term Memory (LSTM), a combination of CNN and LSTM (CNN+LSTM), convolutional LSTM (ConvLSTM), and an hybrid combining Encoder–Decoder and LSTM (ED-LSTM). The different models are evaluated considering their accuracy to solve the problem. The experimental assessment of the computational intelligence techniques demonstrates its effectiveness in forecasting. The primary findings reveal that the hybrid ED-LSTM approach computed an average Root Mean Square Error (RMSE) metric of 0.09, competitive with results from the related literature and improving over the other artificial neural network architectures studied. The generated forecasts serve as valuable inputs for stochastic optimization models, enhancing the planning and scheduling processes and ultimately improving the quality of service that the electricity grid provides to citizens.
This article extends our previous conference article “Forecasting solar photovoltaic power generation: a real-world case study in Uruguay” (Sergio Nesmachnow and Risso, 2023), presented at VI Iberoamerican Congress on Smart Cities (ICSC-CITIES). New scientific contents include: i) an, in-depth description of the addressed problem and review of related works, ii) the study of five ANN architectures, following standard and hybrid approaches iii) an exhaustive experimental evaluation of each studied ANN architecture; and iv) the comparison of approaches and the determination of a new best ANN model for solar photovoltaic power generation forecasting, significantly improving the accuracy over the previous published approach.
The structure of the article is as follows. Next section provides an overview of the renewable energy generation forecasting problem, including a review of relevant literature. Special attention is given to the case study conducted in Uruguay. Then, the next section outlines the proposed approach and provides in-depth details of the implemented ANN models. The following section reports the experimental evaluation of the proposed approach for solar photovoltaic power generation forecasting. The obtained results are reported and discussed. The last section presents the research conclusions and outlines potential areas for future work.
Forecasting solar photovoltaic generation
This section describes the main characteristics of the forecasting problem at hand and reviews pertinent research works that are relevant to the studied topic.
Problem description
The forecasting of electricity generation is a crucial problem within the novel smart grid paradigm (Alsirhani et al., 2023; Kaur et al., 2022). Accurate forecasting allows reducing the impact of variability on important challenges associated with common strategies applied in smart grids (e.g., demand-side management and load shedding). A key challenge in current data-driven smart grid systems lies in efficiently managing forecasting while minimizing prediction errors, taking into account the inherent uncertainty of renewable energy sources. This is essential for overcoming obstacles and ensuring effective operation of the grid.
The focal point of the proposed study involves forecasting the time series data of solar photovoltaic power generation in Uruguay. The prediction is to be accomplished by utilizing actual data provided by the state-owned national electricity utility, UTE.
In Uruguay, UTE has been at the forefront of renewable energy forecasting efforts. UTE uses a combination of weather forecasting models, historical energy production data, and machine learning algorithms to predict renewable energy generation with high accuracy. The benefits of the forecasting efforts by UTE are numerous, including improved grid reliability, reduced energy costs, and increased renewable energy integration. In summary, accurate forecasting of renewable energy generation is essential for Uruguay to continue its transition towards a more sustainable and reliable energy system. The efforts of the country in this area, led by UTE, serve as a model for other countries seeking to integrate renewable energy sources into their electricity grids.
In the considered real-life problem, it is essential to calculate precise forecasts for each hour within a three-day horizon (72 hours) to guarantee a proper and accurate scheduling and allocation of available electricity generation resources to meet the demand. The forecasts are crucial for making informed decisions in the power system, regarding the optimal utilization of resources. The related scheduling and control problem concerns the operation of power plants, including determining the appropriate power output for each plant and dispatching the generated electricity to meet the load demands. This problem plays a vital role in ensuring the reliable and efficient functioning of the power system. By minimizing costs, enhancing grid reliability, and facilitating the integration of renewable energy sources, the scheduling and control problem contributes to the overall optimization of the power system.
Based on the selected forecasting horizon, the problem is classified as a long-term forecast, as defined by Ahmed et al. (2020). Some researchers have explored long-term forecasting over periods ranging from one month to one year, to capture seasonal variations and specific climate or generation patterns, but the common categorization typically considers forecasts beyond a 24-hour horizon as long-term (Ren et al., 2015). This kind of forecasting problem poses a greater level of difficulty compared to other forecasting problems for photovoltaic power generation, which has been often addressed successfully in previous studies.
The multi-hour forecasting problem presents greater complexity compared to short-term (up to six hours) and medium-term (six hours to a day) forecasting problems. As the forecasting horizon extends, the prediction error tends to increase. In other words, the accuracy of the forecast diminishes as the time horizon extends, making it more challenging to accurately predict electricity demand or other relevant factors for later hours within the forecast period.
In turn, the addressed problem is a multi-hour forecasting problem. In this case, the forecasting tool is required to predict a sequence of multiple values for the time series of solar photovoltaic power generation in Uruguay. The available data for making these predictions includes past observations of solar photovoltaic power generation collected by the Supervisory Control And Data Acquisition (SCADA) system of UTE, as well as estimations provided by the global service provider Meteologica (www.meteologica.com/, December 2023) based in Spain. These estimations are computed using numerical weather prediction models.
Multi-hour forecasting presents greater complexity compared to forecasting problems with shorter horizons, e.g., short-term (commonly, from one to six hours) and medium-term (from six to twenty-four hours). As the forecasting horizon extends, the prediction error tends to increase. It means that the accuracy of the forecast diminishes as the time horizon extends, making it more challenging to accurately predict electricity demand or other relevant factors for later hours within the considered forecast period.
Related work
Numerous academic articles have delved into the addressed subject, highlighting the significance of renewable energy forecasting in the realm of energy management, especially under the smart grid paradigm. Accurate predictive tools for renewable power help utilities to better manage energy portfolios and reduce the cost of energy generation.
In the context of solar photovoltaic power forecasting, a recent publication by Iheanetu (2022) has examined various methodologies, including ANNs, metaheuristics, fuzzy logic, and hybrid models applied to solve the problem. The review studied different approaches, the use of data analytic techniques, and summarized the main metrics to evaluate the prediction quality of software-based approaches. The majority of the studies reviewed in the publication primarily concentrated on short-term solar power forecasting. According to the review by Iheanetu (2022), the methods studied in this article fall into the categories of indirect forecasting (i.e., including external information such as weather in the model), medium/long-term horizon forecasting, and regional forecasting (i.e., at country level).
Ding et al. (2011) applied ANN and a similarity method to predict the power output of a photovoltaic system for the following day. The similar day selection method considered forecasted information to take into account different weather conditions. The evaluation was performed for a 15 kW array photovoltaic system located in Oregon, USA. Publicly available historical and forecasted weather data were considered in the study. A minimum value of the forecasting error (Mean Absolute Percentage Error, MAPE) of 10.1% was obtained for sunny days and the error increased significantly (a minimum of 18.9%) on rainy days. Zhu et al. (2015) applied a combination of ANN and wavelet decomposition for the prediction of solar power generated by photovoltaic plants. The proposed model used a solar irradiance model and meteorological variables. The hybrid method works as follows. First, the wavelet decomposition technique is applied to decompose the output power of the photovoltaic plant to separated useful information from noise. Then, one ANNs is applied to build a model for each of the components of the output power. Last, the ANN outputs are reconstructed to get the predicted output power for the plant. The method was evaluated for a single case study. The hybrid model was able to improve over baseline results computed using only the ANN. RMSE values ranged from 7.2% (for clear days) to 16-19% (cloudy and rainy days), improving 2% and 3% over the baseline results.
El hendouzi et al. (2020) applied different ANN models for very short-term solar power forecasting for small photovoltaic installations.(2 KWp, 3 KWp, and 60 KWp) in Morocco. The computed RMSE values for a set of small case studies were in the range of 8%–11%, when applying a nonlinear autoregressive ANN with exogenous inputs.
Zhang et al. (2018) studied ANN models, namely a multilayer perceptron (MLP), a CNN, and a LSTM, for predicting the short-term power generation of a single photovoltaic panel, under clear, partially cloudy, and overcast conditions. The comparative analysis for a single case study in Kyoto, Japan, showed that MLP improved 7% the RMSE metric over a standard persistence method. The CNN improved 12% and the LSTM improved 21% over the baseline. Partially cloudy days were the most difficult to forecast, yielding RMSE values between 203.5 W–321.8 W, RMSE reduced to 76.5 W–183.9 W for overcast days and to 15.3 W–36.8 W for clear days.
Some studies have highlighted the importance of renewable energy forecasting in Uruguay, especially considering that the country has gained worldwide recognition for its significant achievements in the utilization of renewable energy sources. The application of computational intelligence methods for forecasting solar power generation is recent. Specific analysis have been performed for case studies in Uruguay and nearby regions.
Theocharides et al. (2019) applied ANNs for forecasting photovoltaic generation up to one hour ahead with a granularity of ten minutes, considering different input data for a single photovoltaic power plant. The models were trained and validated using data from a period of two years for a 50 MW photovoltaic power plant in Salto, Uruguay. The best results were obtained by a method using AC power, elevation, and azimuth angles, with normalized RMSE between 7.6% (for 10 minutes ahead forecasting) and 14.2% (for 60 minutes ahead forecasting).
Fraccanabbia et al. (2020) proposed a forecasting model for photovoltaic power generation, using base and meta learning techniques methods and the stacked ensemble approach. The evaluation was performed over a database collected in a photovoltaic plant in Artigas, Uruguay. The best results were computed by an hybrid combining Correlation Matrix and Language Model for MAPE, R
Regarding the application of the forecasting results, our research group has developed research related to relevant management and control problems that benefit from an accurate and reliable predictions of the available solar photovoltaic power generation. Results are useful to fit short-term renewable energy bands, to be used in planning and scheduling by considering the intrinsic randomness of renewable energy sources (Risso and Guerberoff, 2021). In Uruguay, knowing in advance the availability of renewable energy is crucial to promote its utilization in both residential customers (Nesmachnow et al., 2021; Chavat et al., 2022; Porteiro et al., 2023) and large electricity consumers, such as automated and smart buildings (Nesmachnow et al., 2021; Porteiro et al., 2021; Rossit et al., 2022), industrial facilities (Porteiro et al., 2020), and datacenters (Muraña and Nesmachnow, 2021), among others.
ANN models for solar photovoltaic power generation forecasting
This section describes the overall strategy applied for forecasting and the details of the ANN architectures considered in the study.
Overall strategy of the predictive approach
Predictive models based on neural networks were developed, employing different architectures to capture and model different characteristics of the input time series. The overall approach was applied to forecast of solar photovoltaic power generation, with specific modifications in the implementation for each studied model.
The developed predictive approach follows a multi-step strategy, aligned with the research goals. The multi-step prediction horizon considered for the approach is 72 hours, which aligns with the defined objectives of the related planning problem for the smart grid.
The related literature has offered various strategies to address multi-step ahead forecasting, as discussed by Alkhayat and Mehmood (2021). The two most commonly used approaches are recursive and direct forecasting. In the recursive approach, the first predicted value serves as the input for the subsequent step, potentially leading to error accumulation. Conversely, the direct approach encompasses two different implementations: creating separate models for each forecasting step or constructing a single model capable of accepting multiple inputs and generating multiple prediction outputs. The latter approach, which is named as the sequence-to-sequence method, offers the advantage of reduced computational time. In the proposed model for predicting solar photovoltaic power generation using ANN, the direct approach is employed, utilizing multiple inputs and generating multiple outputs.
The predictive model adopts a multivariate approach, incorporating the time series of a configurable number of past solar photovoltaic power generation observations as inputs during the learning process. Furthermore, the set of numerical estimations already available at the step in which the prediction is to be made is included as a covariate in the learning process. The input data is carefully processed and formatted to align with the expected input format of each ANN and with the specification of the training model utilized in the development.
Five ANN architectures were analyzed: LSTM, CNN, CNN+LSTM, ConvLSTM, and ED-LSTM. These models were selected as they have been successfully applied for the prediction of renewable energy generation in related works (Ding et al., 2011; Iheanetu, 2022; Theocharides et al., 2019; Zhang et al., 2018).
The ANNs were implemented in Tensorflow, using the Keras framework (https://keras.io/, December 2023). The specific features of each studied ANN architectures are presented in the following subsections.
LSTM architecture
The LSTM architecture was studied considering that it is suitable and versatile for forecasting time series. The architecture utilized in this study bears resemblance to those employed in the literature for similar problems (Ahmed et al., 2020; Luo et al., 2021; Ren et al., 2015).
A Sequential model is employed in the proposed LSTM, which is constructed as a straightforward stack of layers. Each layer is specifically designed to have a single input tensor and a single output tensor.
The input layer is structured as a tensor with dimensions of 1
Table 1 describes the architecture of the developed LSTM neural network, in the format reported by the function model.summary() of Keras.
Definition of the LSTM neural network.
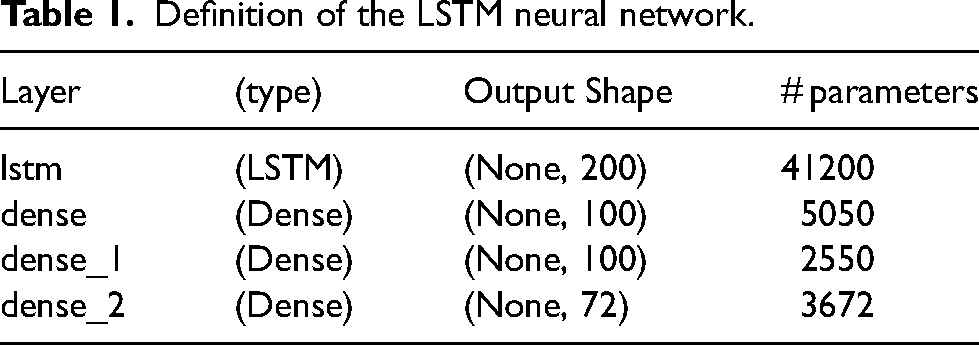
Figure 1 presents the architecture of the proposed LSTM neural network model. The proposed model has 54424 parameters, all of them trainable.
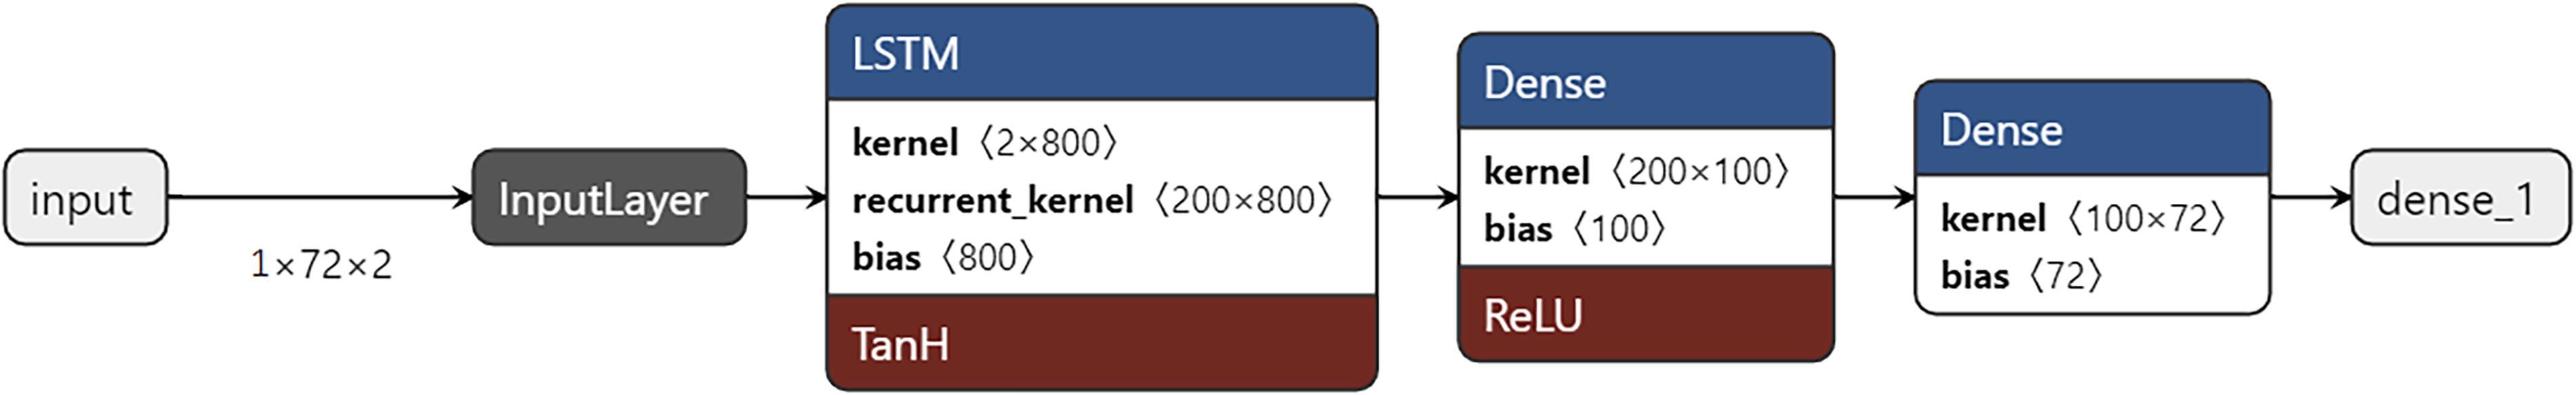
Architecture of the applied LSTM neural network model.
CNN architecture
The CNN architecture was studied considering its suitability for time series forecasting, due to their ability to capture local patterns and extract meaningful features from sequential data (Wibawa et al., 2022). The convolutional filters scan and detect local patterns in the input data, e.g., recurring patterns and variations within the time series. CNNs are inherently translation invariant and can recognize patterns regardless of their location within the input data. The hierarchical layer structure provide different levels of abstraction, allowing a CNNs to learn complex representations by combining low-level features into higher-level representations. Finally, CNNs are highly scalable and can handle large datasets efficiently, to model multivariate time series.
The abilities of CNN are useful for time series forecasting, as they allow capturing temporal dependencies and variations in the data, for both short-term and long-term scale. CNNs are also able to identify similar patterns occurring at different time steps, which is useful for predicting future values.
The input layer has dimension 1
Table 2 describes the architecture of the developed CNN neural network in the format of model.summary() of Keras. Figure 2 graphically presents the architecture. The proposed model has 4684 parameters, all of them trainable.

Architecture of the applied CNN neural network model.
Definition of the CNN neural network.

CNN+LSTM architecture
This hybrid model combines characteristics of CNN and LSTM architectures. Relevant characteristics of the hybrid model include hierarchical feature extraction, the capability of handling multivariate time series, dimensionality reduction, scalability and generalization.
Overall, combining CNNs and LSTMs in time series forecasting leverages the strengths of both architectures, enabling the model to capture spatial dependencies, temporal dependencies, and multivariate interactions, thereby enhancing the accuracy and effectiveness of the forecasting task.
A variant of the CNN architecture is used first. After the input layer, two one-dimensional convolutional layers are included. Then, the MaxPooling1D layer is applied, followed by a Flatten layer. Then, a RepeatVector layer is used to replicate the sequence across new dimensions, to feed the LSTM layer. After that, two TimeDistributed wrappers are used to apply Dense layers to every time step of a sequence independently. TimeDistributed guarantees that the Dense layer operates on each step of the sequence individually, rather than treating the sequence as a single entity. The final TimeDistributed layer produces an output for each time step, resulting in a sequence of predicted outputs.
Table 3 describes the architecture of the developed CNN+LSTM neural network in the format of model.summary() of Keras. Figure 3 graphically presents the architecture. The proposed model has 707 913 parameters, all of them trainable.

Architecture of the applied CNN+LSTM neural network model.
Definition of the CNN+LSTM Neural Network.

ED-LSTM architecture
The Encoder-Decoder LSTM model has been specifically developed for forecasting variable length output sequences, and applied for diverse forecasting problems (de Paulo et al., 2023; Zhang et al., 2022a,c).
The ED-LSTM model was designed for sequence-to-sequence modeling, for ANN taking a sequence of input data and generating a corresponding sequence of predictions. The encoder examines the input sequence, transforms it into a fixed-length vector, which captures the most relevant features for understanding of the sequence. This feature extraction mechanism enables the model to capture important patterns and trends in the time series data. Usually, the encoder is implemented as a standard LSTM model, but alternative encoder models (Stacked, Bidirectional, CNN) have also been employed. The fixed-length output from the encoder is replicated, with each repetition corresponding to a specific time step in the desired output sequence. This replicated sequence is then fed into an LSTM decoder model. The model is responsible for generating an output value for each time step in the output sequence, which can subsequently be interpreted by a single output model. The LSTM layers are effective in capturing long-term dependencies in time series data. The ED-LSTM ANN is capable of handling variable-length input and output sequences. This flexibility is beneficial in time series forecasting since the length of the input sequence (the historical data window) and the output sequence (the future predictions) can vary depending on the specific forecasting task.
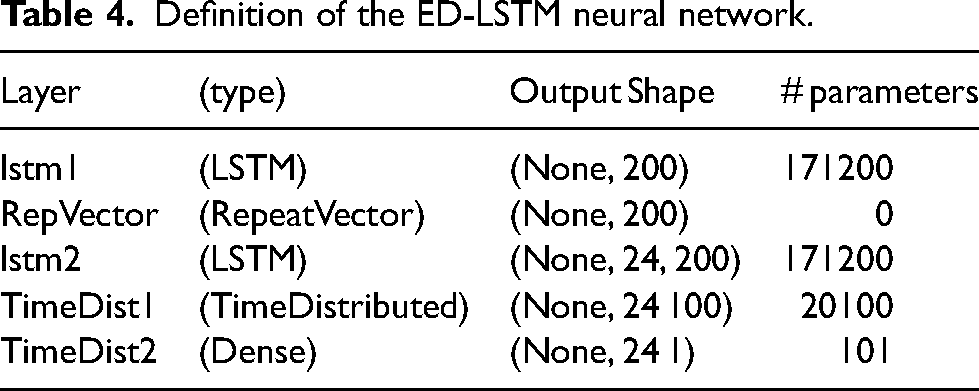
Table 4 describes the architecture of the developed ED-LSTM ANN in the format of model.summary() of Keras. Figure 4 graphically presents the architecture. The model has 512 201 parameters, all of them trainable.

Architecture of the applied ED-LSTM neural network model.
Definition of the ED-LSTM neural network.
ConvLSTM architecture
The ConvLSTM architecture is an extension of the CNN+LSTM approach in which the convolutions for reading the input sequence data are applied within the LSTM for each time step (Shi et al., 2015).
In contrast to the LSTM model, which directly processes the input data to calculate the internal state and state transitions, and unlike the CNN-LSTM model that interprets the output of CNN models, the ConvLSTM model integrates the convolutions into the LSTM units, enabling seamless integration and end-to-end training.
The ConvLSTM network is like CNN+LSTM, but two-dimensional convolutions are applied. The ConvLSTM2D class of the Keras library implements the ConvLSTM model for 2D data. It is similar to LSTM layers, but the input and the applied recurrent transformations are both convolutional. For its use in one-dimensional multivariate time series forecasting, the input data must be transformed into the expected shape of ConvLSTM2D: a tensor with the structure [samples, timesteps, rows, cols, channels]). Each time step of data is represented as an image with dimensions (rows
Table 5 describes the architecture of the developed ConvLSTM neural network, in the format of the model.summary() function of Keras. Figure 5 graphically presents the architecture. The model has 752 393 parameters, all of them trainable.

Architecture of the applied ConvLSTM neural network model.
Definition of the ConvLSTM neural network.

Approaches for training and validation of the proposed ANNs
For the training of the proposed ANN models, a sliding window scheme is applied. Applying the sliding window technique expands the dimension of the training dataset. This augmentation scheme becomes necessary because the conventional approach of splitting the input dataset into 80% for training and 20% for validation would result in a small dataset consisting of disjoint 24-hour training blocks. By implementing the sliding window scheme, it becomes possible to significantly increase the number of training blocks from the original blocks present in the input data.
The criterion used in the optimization applied to train the neural network is the minimization of the RMSE in each period to be predicted. The RMSE is used as the loss function of the neural network since it provides a robust estimator of the prediction quality in the training dataset and is preferable to an absolute metric, such as Mean Absolute Error (MAE), since that RMSE penalizes forecast errors more heavily.
To assess the performance of the ANN-based predictors, a walk-forward procedure (Kohzadi et al., 1996) is employed. This procedure assumes that the data for the previous predicted period is available for making predictions in the subsequent period. The evaluation procedure allows for the specification of the number of previous observations to be used in the prediction, serving as a parameter in the evaluation process. During the evaluation of errors in the validation dataset, both the global RMSE value and the single RMSE value for each predicted hour are calculated. This approach aims to determine the quality of predictions as the time horizon extends. By evaluating the RMSE at each hour, a more detailed understanding of the prediction performance across different time periods is achieved.
For training, the Adam optimizer (an implementation of the Stochastic Gradient Descent algorithm), was used. The process followed a batch training scheme, where a batch size of 24 training blocks was propagated through the neural network. This approach enables more efficient training by processing multiple training blocks simultaneously.
For the forecasting approaches applying LSTM, the input data must be preprocessed before training to align with the expected structure of the LSTM network. Similarly, the validation dataset needs to be prepared for evaluating the trained model. A LSTM network receives a three-component tensor as input: [samples, timesteps, features]. A sample represents a vector of previous observations, and the timestep denotes the number of observations to predict (72 values in this case). The features vector includes data related to additional features (covariates) considered during training. To adapt the data to the LSTM input format, the available data tensor is resized and expanded. The applied transformation takes a list of previous observations (history) and the number of time steps considered to define those previous observations (n_input) and returns the data in the format expected by the LSTM neural network after employing the sliding window technique.
The input data, initially of dimensions #training
Experimental evaluation: Training and forecasting results
This section describes the experimental evaluation of the proposed ANN models for the solar photovoltaic power generation forecasting problem.
Development and execution platform
The studied ANN-based forecasting models were implemented in Python, using the Tensorflow and Keras libraries. The computations were performed on the high-performance computing infrastructure of the National Supercomputing Center (Cluster-UY) (Nesmachnow and Iturriaga, 2019).
To train the proposed ANNs, the parallel implementation offered by Tensorflow was employed, utilizing Tesla P100 graphics processing units with 12 GB RAM. These GPUs were accessible on Cluster-UY nodes, HPE DL380 Gen10 servers with Intel Xeon-Gold 6138 processors at 2.00 GHz.
Data sources
Two main sources of data were applied in the research: solar photovoltaic power generation data and estimations.
Solar photovoltaic power generation data
The Supervisory Control And Data Acquisition (SCADA) of UTE collects information from solar photovoltaic power generation in the country. In Uruguay, the solar photovoltaic power generation constitutes 14% of the total non-controllable renewable power generation capacity, amounting to 242 MW (average in 2018–2022). Data measurements are collected at hourly intervals.
The historical data used encompasses the complete dataset of solar photovoltaic power generation from January 1
The data utilized in this study was extracted from the raw SCADA logs. However, prior to analysis, a significant data cleansing process was undertaken to address missing or erroneous values. This involved imputing, completing, and correcting the data with the assistance of additional information obtained from the National Administration of the Electricity Market (ADME). Figure 6 displays a subset of the training dataset, showcasing the records after the cleansing and preprocessing steps have been applied.
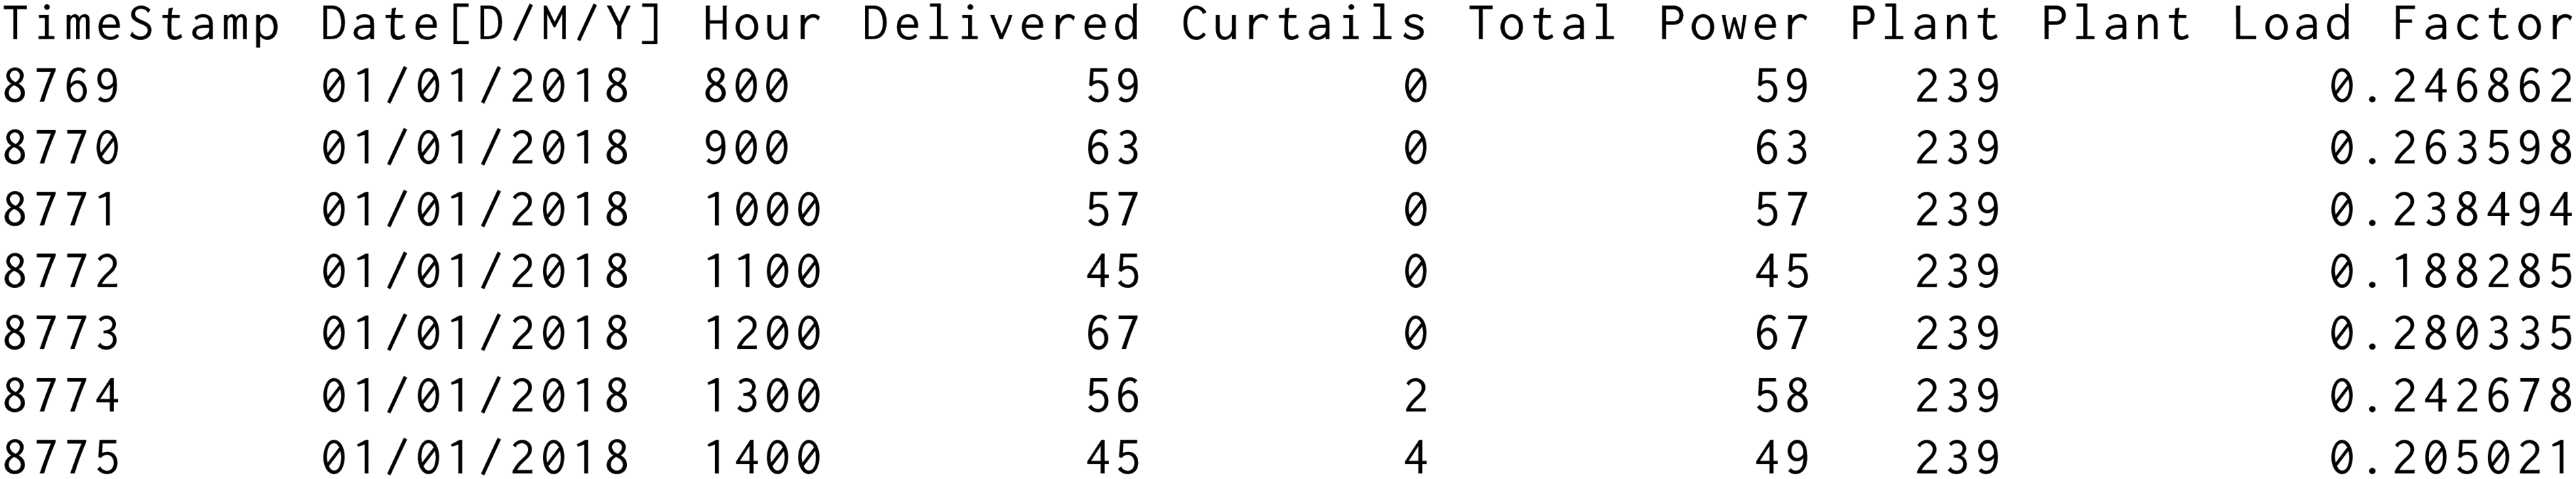
Sample records of the solar photovoltaic power generation dataset.
Samples of the historical data for solar photovoltaic power generation (specifically, the Plant Load Factor values) obtained from UTE are showcased in Figure 7.

Samples of solar photovoltaic power generation data from UTE (Plant Load Factor values).
Numerical estimations
An additional data source consists of estimations offered by Meteologica, a prominent global service provider based in Spain. These estimations are computed using numerical weather prediction models and can be accessed through their website at www.meteologica.com/ (December 2023).
The numerical estimations are considered as a covariant in the multivariate forecasting approach. During the learning process, the set of estimations available at the time of making predictions (three days ahead) are fed to the corresponding ANN as a covariate.
Experimental results: Training stage
The training procedure of the studied ANN utilized the normalized values of the Plant Load Factor field, which range between 0 and 1. This normalization helps prevent training issues that may arise from extremely high values. By training with the Plant Load Factor values, the need for an input normalization layer in the studied ANNs was eliminated. Additionally, this approach enhances the adaptability of the developed predictors to potential changes in the total energy output from the solar farms in the future.
By using the sliding window scheme over the provided solar photovoltaic power generation data, a total of 40 752 training blocks were obtained from the original 566 blocks in the input file. The training process consisted of 100 epochs, although notable results in terms of RMSE for each predicted period were achieved by all the studied ANNs after just 50 epochs. These results indicate a high level of accuracy in the predictions made on the validation set. The training process took about 10 minutes to execute on a standard server in Cluster-UY, equipped with a Tesla P100 GPU.
Table 6 reports the MAE values computed in training experiments for the studied ANN-based forecasting models.
MAE values computed in training experiments for the studied ANN models.

The evaluation on the training set resulted in accurate results, with median MAE values ranging from 0.052 (worst, CNN) to 0.016 (best, ED-LSTM). ED-LSTM was the best method overall, with an accuracy (MAE) from 0.010 (for the first predicted peak of generation, at hour 12) to 0.116 (for the last predicted peak of generation, at hour 60).
Figure 8 illustrates two representative graphs showcasing the progression of the loss function (RMSE) during the training experiments conducted on the solar generation dataset using the CNN and the ED-LSTM neural network approaches. The graphics show the faster training of ED-LSTM, confirming that the approach including an Encoder-Decoder module is able to better capture the main features of the input data.

Evolution of the values of the loss function (RMSE) during the training of two representative neural network approaches over the solar generation dataset.
Experimental results: Validation stage
The validation stage was performed over the last year of solar photovoltaic power generation, which was not used in training, to avoid bias. Four main aspects were evaluated: (i) the forecasting capabilities of the proposed ANN-based models when not using the numerical estimations as covariate; (ii) the improvement in accuracy when using the numerical estimations as covariate; (iii) the forecasting accuracy for different weather conditions (sunny, partly cloudy, and cloudy days); and (iv) the forecasting accuracy when considering a 24-hours period, as needed to build scenarios for stochastic optimization methods for planning and scheduling of the smart grid.
Forecasting without using numerical estimations as covariate
Table 7 reports the MAE values computed in validation experiments for the studied ANN-based forecasting models when not using the numerical estimations as covariate.
MAE values computed in validation experiments for the studied ANN models, without using the numerical estimations as covariate.

Results in Table 7 show that the proposed models demonstrated a reasonable capability of capturing the intrinsic variation of the time series of solar photovoltaic power generation. The ED-LSTM computed the best results, with a median MAE value of 0.142, improving 0.062 over the results computed by the CNN and 0.056 over the standard LSTM model. However, large MAE values were obtained for the third peak of generation (hour 60), over 0.21 for all ANN architectures. These results are not accurate enough for the main goal of the research and for the practical application of the studied models in smart grid planning and scheduling.
Forecasting using numerical estimations as covariate
Table 8 reports the MAE values computed in validation experiments for the studied ANN-based forecasting models when including the numerical estimations as covariate.
MAE values computed in validation experiments for the studied ANN models.

Results in Table 8 demonstrates that when including the numerical estimations as covariate, the evaluation on the validation set yielded accurate forecasting results. MAE results ranged from median values of 0.165 (for the worst model, CNN) to 0.09 (for the best model, ED-LSTM). As obtained in the training dataset, ED-LSTM was the best method overall, with an accuracy (MAE) from 0.049 (for the first predicted peak of generation, at hour 12) to 0.164 (for the last predicted peak of generation, at hour 60).
Significant improvements were achieved by including the numerical estimations. In median, the improvements were from 0.039 (19.1%) for the CNN to 0.052 (36.6%) for the ED-LSTM model. The improvement were more notorious for predictions in hour 12, up to 0.055 (52.9%) for ED-LSTM than for hours 36 and 60, for which improvements between 0.045 (14.4%) and 0.047 (27.8%) were obtained. These results demonstrate the usefulness of using the numerical estimations as covariate in the forecasting process.
The computed results are in line with those published in the related literature for similar forecasting problems. The MAE value of 0.164 obtained using the ED-LSTM model is a very good overall result for a forecasting of 60 hours in the future. In turn, the median MAE of 0.090 denotes a high accuracy in the prediction for a series that often has a highly variability.
To provide an objective evaluation of the obtained results, an analysis was conducted on the disparities between the actual values of solar generation and the predictions made by the applied ANN forecasting models. Table 9 presents the differences between the median values of the predictions and the actual values for each hour in the validation experiments for ED-LSTM, the best model among the studied.
Median of the differences between the prediction and the real value of solar generation (

Values reported in Table 9 show that the real forecasting error was below 0.09 in all cases. The worst error value was 0.0863 for hour 38. The model was significantly robust, since the forecasting errors did not increase significantly when predicting three days in the future.
Figure 9 presents the boxplots that summarize the information of the distributions of results (difference between the real value of solar photovoltaic generation and the forecasted value) in the validation experiments using the LSTM-based predictor. Each boxplot summarizes the information from the 381 predictions made, one for each hour in the validation experiments.
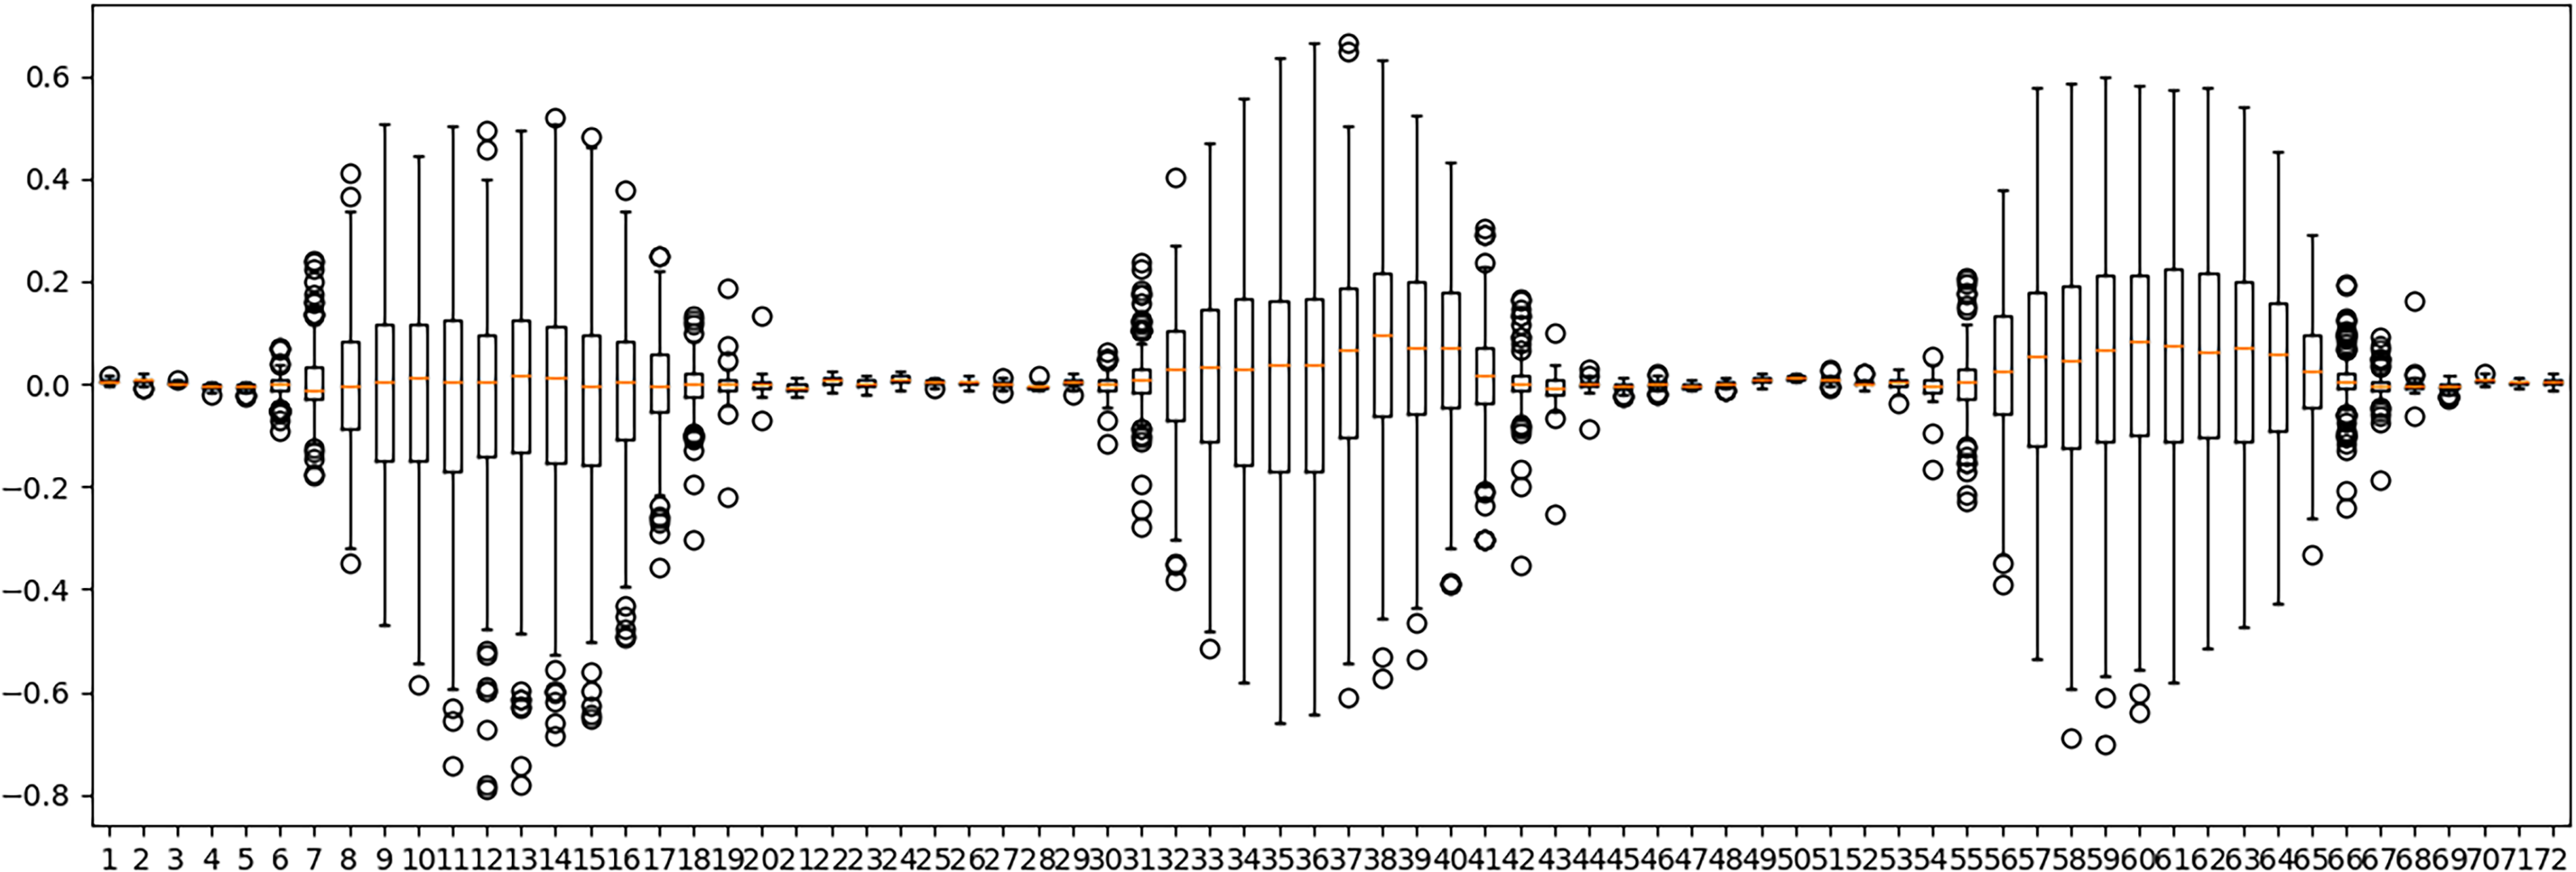
Boxplots summarizing the information of the distributions of the differences between the real value and the prediction of the LSTM neural network for each hour, in the validation experiments for the photovoltaic solar power generation dataset.
In turn, Figure 10 presents the boxplots reporting the distribution of the difference between real and forecasted values of solar photovoltaic generation in the validation experiments using the ED-LSTM-based predictor, for the 72 hours in the forecasting horizon.
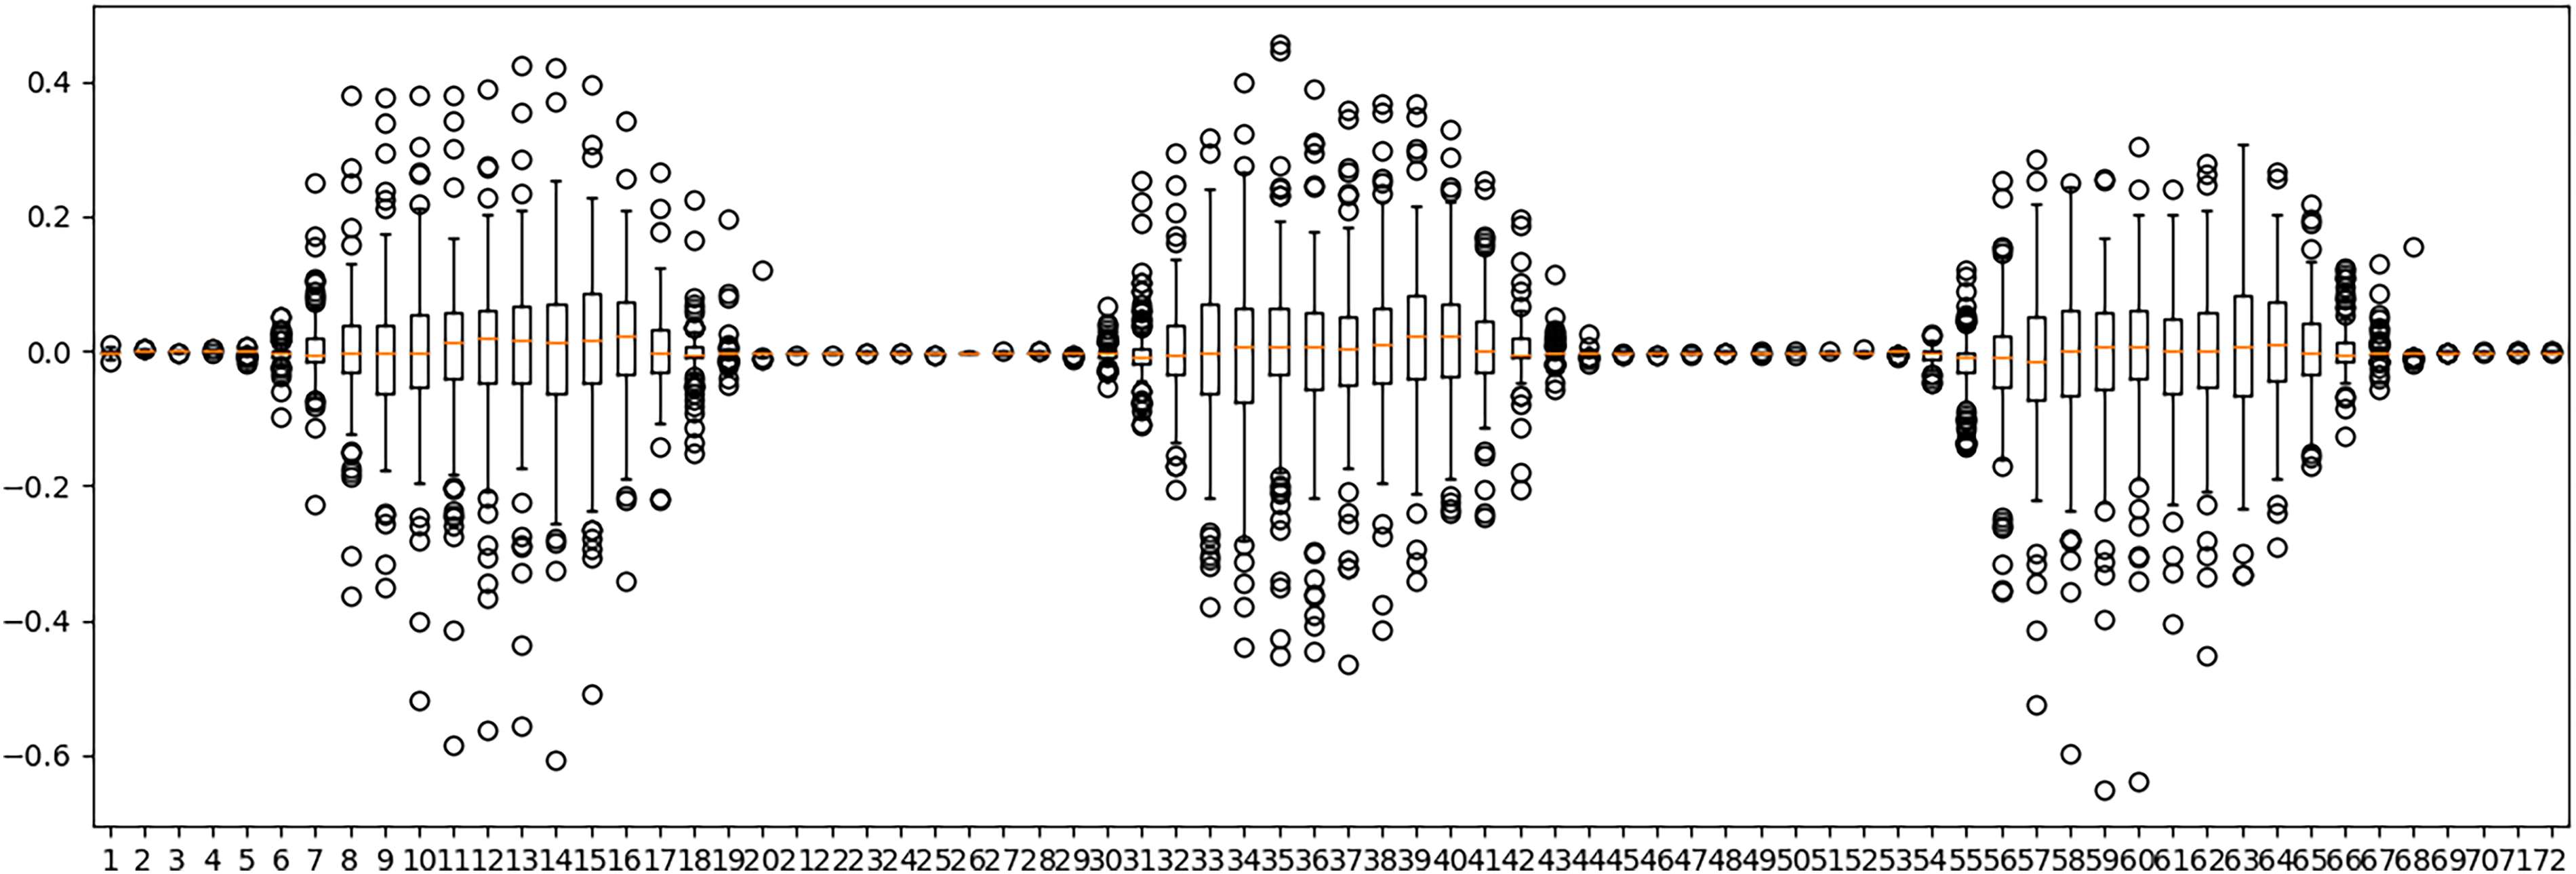
Boxplots summarizing the information of the distributions of the differences between the real value and the prediction of the ED-LSTM neural network for each hour, in the validation experiments for the photovoltaic solar power generation dataset.
The comparison of the boxplot results reported in Figures 9 and 10 clearly demonstrate the usefulness of including an encoder-decoder approach iin the LSTM model to better capture the main features of the input data. The dispersion values, evaluated by the interquartile range (i.e., the boxplot heights) significantly decrease from 0.2–0.3 to less that 0.1 in most cases.
Figure 10 also shows that the distribution of solar photovoltaic generation data has a large number of outliers, mainly due to unpredictable phenomena, such as unexpected cloudiness or surreptitious weather changes, which makes the problem at hand very hard to solve.
The boxplots in Figure 11 present a detailed view of the discrepancies between the real and predicted solar photovoltaic power generation for the first 24 hours of a sunny day in Summer, characterized for high generation values. The high prediction accuracy is better observed in the boxplots corresponding to the hours with the highest generation values (from 11:00 to 15:00 hours).

Boxplots describing the information of the distributions of the differences between the real value and the prediction of the ED-LSTM neural network for a sunny day. Values are reported for each hour considered in the validation experiments for the photovoltaic solar power generation dataset.
Figure 12 presents a comparison of the real (blue values) versus predicted (orange values) solar photovoltaic generation data using the forecasting approaches that apply CNN, LSTM, ConvLSTM, and ED-LSTM.
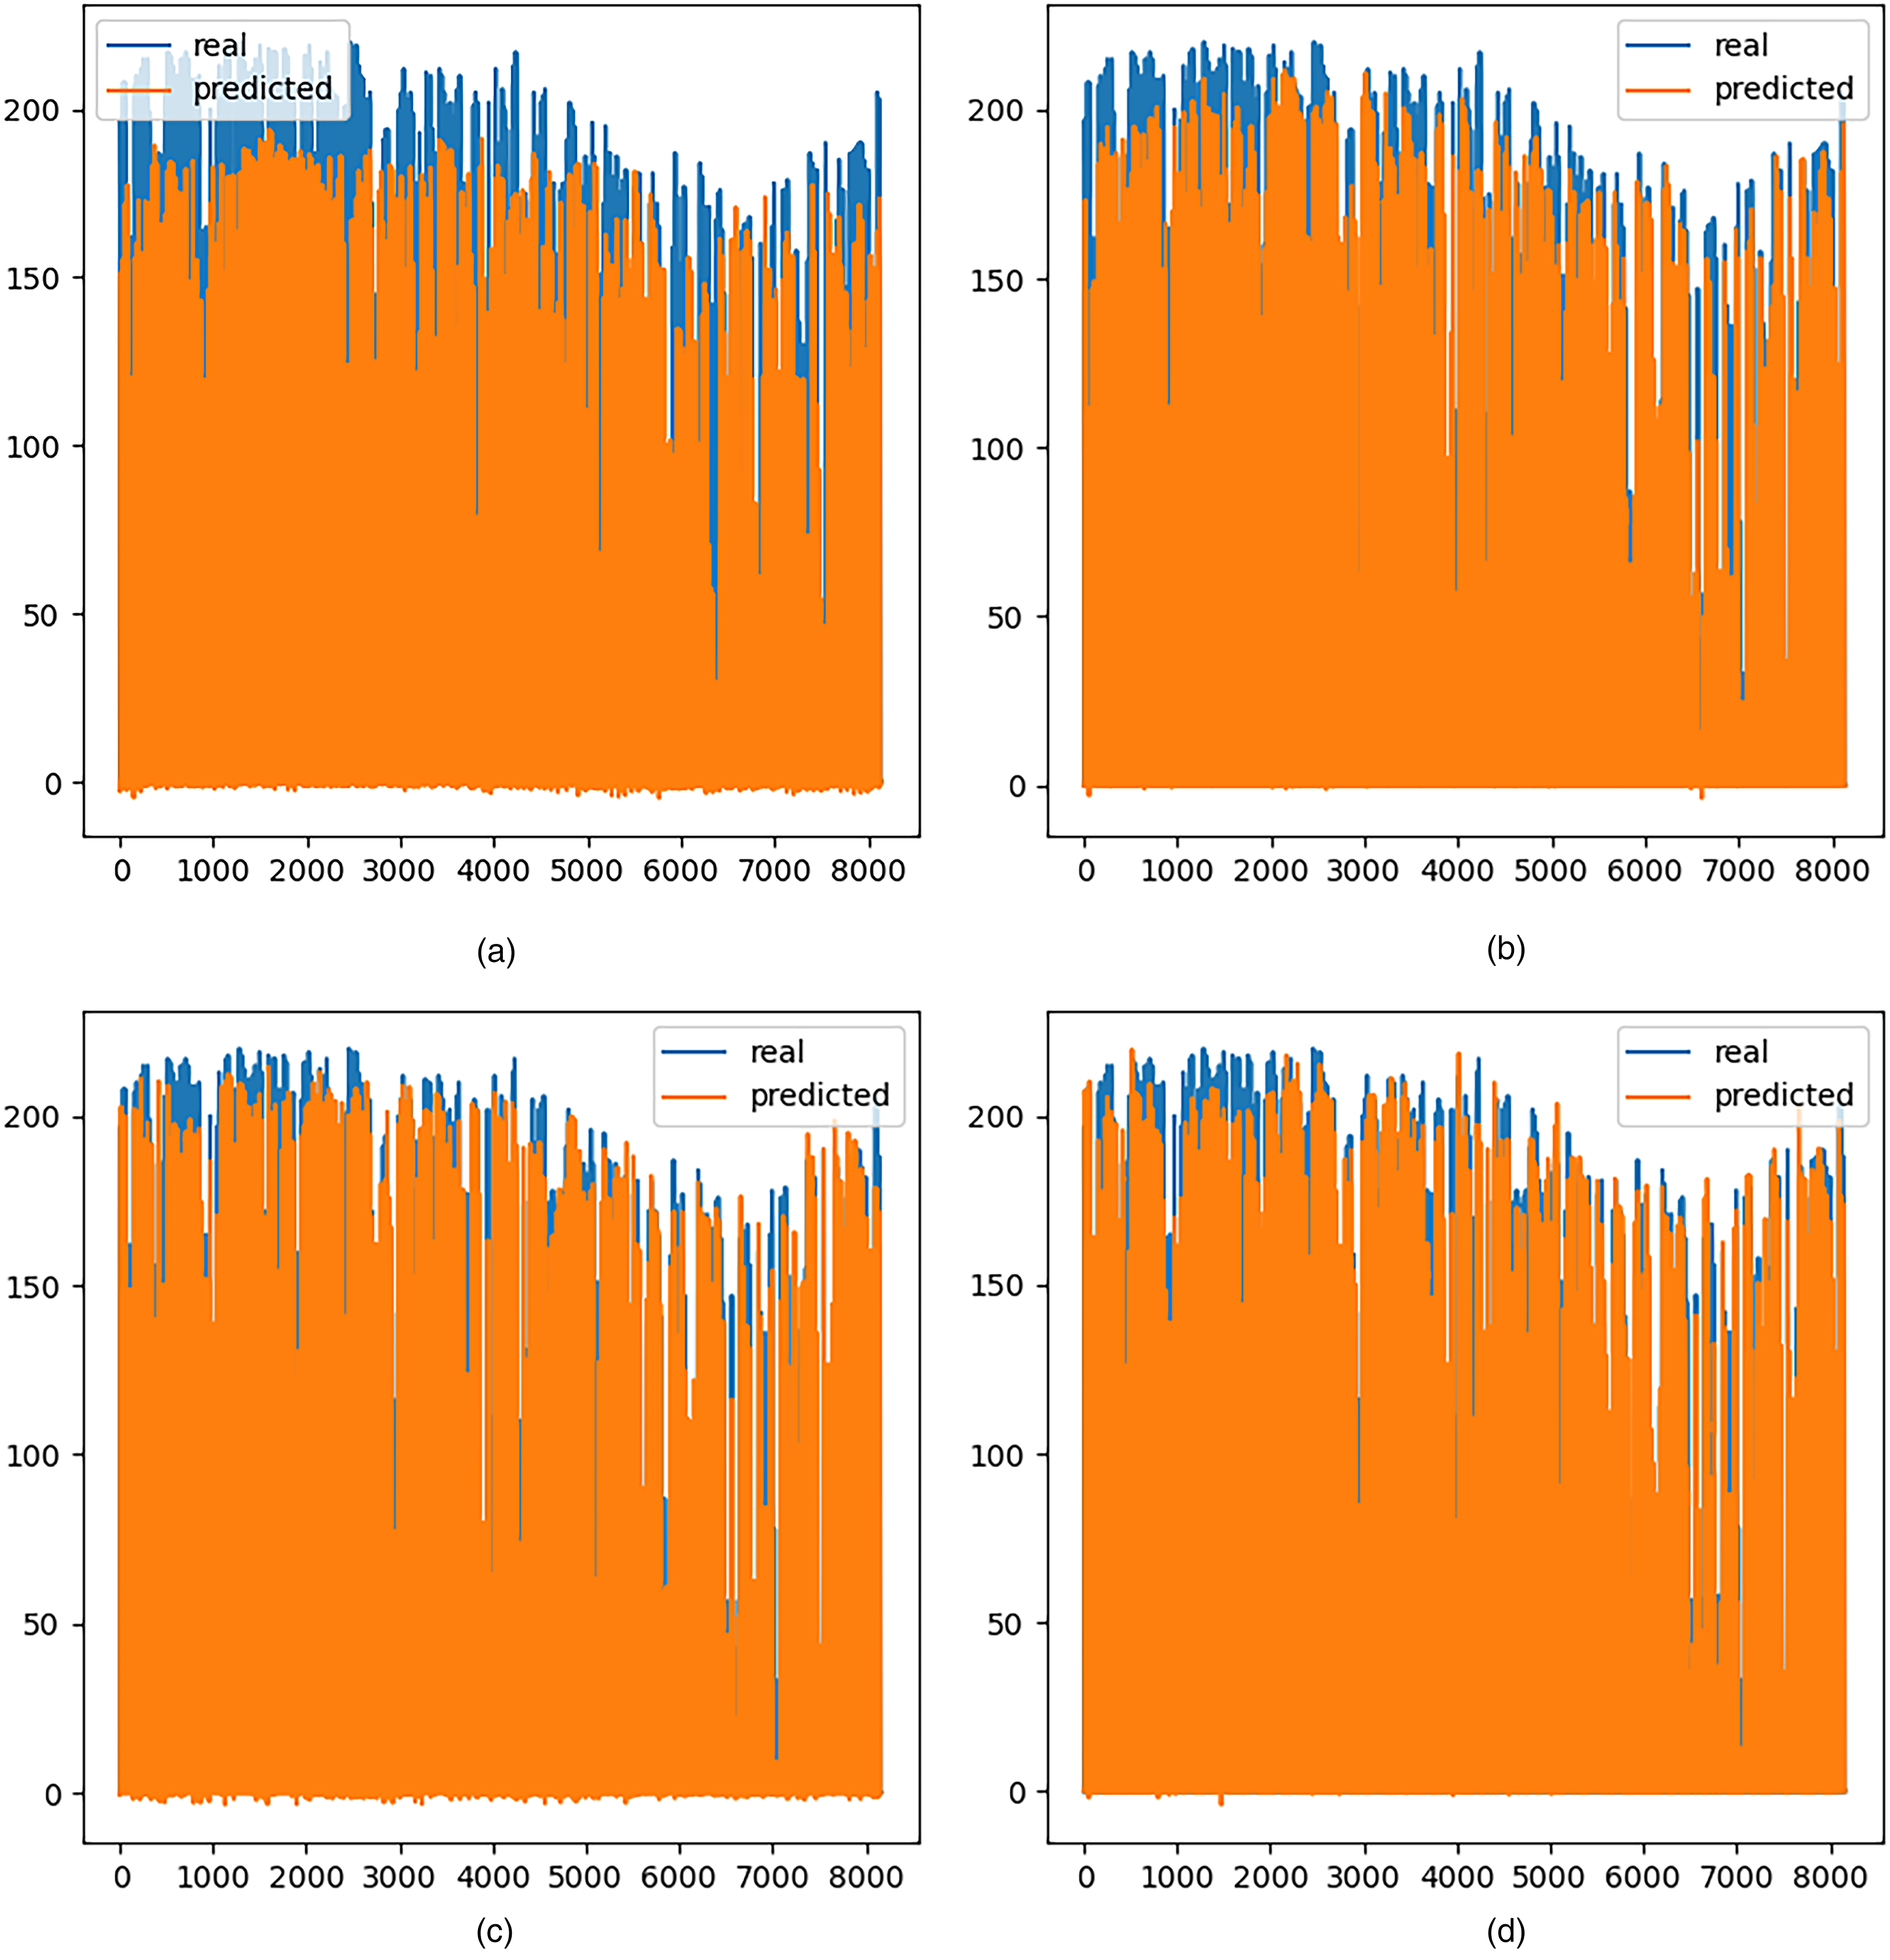
Computed forecasts (orange curve) and actual values (blue curve) in the validation experiments for the solar photovoltaic power generation dataset, using CNN, LSTM, ConvLSTM, and ED-LSTM approaches.
The comparison of results presented in Figure 12 indicate that both the ConvLSTM and ED-LSTM approaches were able to compute accurate time series of solar photovoltaic power generation. The predicted values were significantly closer to the real values than the ones computed by the standard CNN and the LSTM approaches. The figures also show that, in general, the studied ANN-based forecasting models tend to underestimate the real solar photovoltaic power generation.
Forecasting accuracy for different weather conditions
Table 10 reports the MAE values computed in validation experiments for the studied ANN-based forecasting models using the numerical estimations as covariate, for days with different weather conditions: sunny, partly cloudy, and cloudy days.
Median mae values computed in validation experiments for the studied ANN models for days with different weather conditions.

Results in Table 10 indicate that the studied ANN models were able to generate significant better predictions on sunny days, corresponding to larger solar photovoltaic power generation values. Even the less accurate model among the studied (CNN) improved 41.2% the predictions with respect to the median. The ED-LSTM model improved 53.3%, and the overage improvement for sunny days was 48.1%. Regarding partly cloudy days, the CNN downgrades 10.3% with respect to the median, whereas ED-LSTM model improved 3.3%. The overall result was a negligible degradation of 1.6%. Finally, cloudy days were the most difficult to forecast, with degradation values between 41.2% (CNN) and 55.6% (ED-LSTM) with respect to the median, with an average degradation of 49.6%. Overall, LSTM and CNN+LSTM computed medium-quality results, between those computed by the CNN model (worst) and ConvLSTM and ED-LSTM, the best models among the studied.
Sample predictions
Figure 13 presents two selected instances of solar generation predictions generated by employing the ED-LSTM neural network. In turn, Figure 14 illustrate two selected instances of solar generation predictions generated by employing the ED-LSTM neural network. Figures show that the ED-LSTM model is able to better modeling the dynamics of the time series, significantly reducing the errors of the standard LSTM model, e.g., in the central and right zones of the forecasting interval in Figure 13. The ED-LSTM model takes advantage of the encoder-decoder mechanism to properly adapt the output even for unexpected reductions or increase in the solar photovoltaic generation values. Results demonstrate the exceptional predictive performance of the hybrid ED-LSTM neural network approach, effectively capturing the temporal patterns of the time series data while exhibiting minimal disparities from the actual solar generation values.

Examples of forecasts (orange curve) and actual values (blue curve) in the validation experiments for the photovoltaic solar power generation dataset, using the LSTM approach.

Example (1) of forecasts (orange curve) and actual values (blue curve) in the validation experiments for the photovoltaic solar power generation dataset, using the ED-LSTM approach.
Forecasting accuracy within a 24-hours period
A direct practical application of the forecasted results is for the generation of scenarios in a model of short-term renewable energy bands. These scenarios are useful in stochastic optimization models to assist in planning and scheduling, considering the inherent unpredictability of renewable energy sources (Risso and Guerberoff, 2021).
In the context of an energy band model, predictions for solar generation were provided in blocks of size 72 (for the next 72 hours in the future), but made and updated every 24 hours. The ED-LSTM model, the best performing among the ANN-based approaches studied, was evaluated to that end. The errors of the predictions made every 24 hours followed the trend of the previously reported general errors for ED-LSTM, with mean values of MAE in the order of 0.10 in the validation dataset and 0.017 in the training set.
The obtained results are accurate to provide an stochastic optimization methods reasonable accurate values to design possible operations scenarios, to be adjusted properly using exact and heuristic planning and scheduling strategies.
Overall discussion
The overall analysis of the experimental evaluation results allows concluding that the proposed ANN approaches are suitable for solving the solar photovoltaic power generation in the considered case study.
The most simple ANN architectures (CNN and pure LSTM) yielded rather high error values. However, when using more sophisticated models that take advantage of the main features of different ANN architectures in a synergistic fashion, results were very promising for a realistic case study. ED-LSTM computed the best results, suggesting that the incorporation of an Encoder-Decoder helps the LSTM model to properly identify the main features and patterns in the input data. Results under 0.10 for the MAE metric indicate that the studied methods are accurate and reliable. The overall outcomes are aligned with results of recent proposals in the related literature.
In addition, results also demonstrated that including the predictions obtained using numerical estimations as covariate in the learning process were useful to improve the precision accuracy. This fact encourages the research group to further expand the applied model by considering relevant additional information to be included as covariant in the proposed multivariate approach.
The computed error values are low enough to guarantee the applicability of the forecasting methods and results in the planning of the smart electricity grid.
Conclusions and future work
This article presented a study of computational intelligence methods, namely ANN approaches, for the problem of forecasting country-level solar photovoltaic power generation. The considered case study involved the real time series of solar photovoltaic power generation in Uruguay in the period from 2018 to 2022. Specific techniques were applied for data preprocessing and data augmentation for training, and several ANN architectures were evaluated for forecasting.
Five different ANN-based forecasting approaches were studied, considering CNN, LSTM, CNN+LSTM, ConvLSTM, and ED-LSTM architectures. The main results of the study indicates that the ED-LSTM approach computed the best result, significantly outperforming the other studied models. The training model including numerical estimations as covariate allowed to improve the MAE results of all models by 5% in average. The statistical analysis confirmed that the computed result are robust, acknowledged by the small boxplots that evaluate the distributions of the differences between predicted and the real solar photovoltaic power generation values. Results also showed that the forecasting accuracy depends on the weather conditions, significantly downgrading for cloudy days.
Overall, the ED-LSTM approach was able to compute encouraging prediction outcomes, showcasing an average MAE value of 0.09, outperforming the performance of the other ANN architectures. Particularly impressive results (average MAE of 0.042) were achieved for sunny days. The generated forecasts hold substantial importance for their potential implementation in planning and scheduling procedures, with the ultimate goal of enhancing the overall service quality of the electricity grid.
The main lines for future work are related to analyze other ANN architectures and sophisticated mechanisms to improve the prediction accuracy both in the medium/long-term and in those days with low values of solar photovoltaic power generation, where the studied ANN-based predictors computed low quality results. Another promising line for future work is studying the applicability of the best models for creating scenarios in stochastic models of short-term and medium-term renewable power generation bands, to develop powerful data-driven methods to help decision making and operation (planning and scheduling) of the electric grid.
Footnotes
Acknowledgements
The research reported in this article was developed as part of a joint project between UTE and Universidad de la República, Uruguay.
Declaration of conflicting interests
The authors declared no potential conflicts of interest with respect to the research, authorship, and/or publication of this article.
Funding
The author(s) disclosed receipt of the following financial support for the research, authorship, and/or publication of this article.