
Abstract
This study explored high school students’ understanding of rate of change in physical and functional situations involving two covarying quantities, and the nature of difficulties the students exhibited as they reasoned, represented, and made connections between various representations of rate of change in two covarying situations. Ninety-nine students from Grades 9–12 enrolled in Algebra I through AP-Calculus courses in a public high school in the United States, took part in the study. The participants completed a researcher-developed Diagnostic Test on Rate of Change (DTRC) that assessed their understanding of various representations of rate of change involving two covarying quantities in physical and functional situations. A follow-up semi-structured interview was conducted with 16 of the participants to gain more insights into the students’ conceptual understanding and nature of difficulties they have with the topic. Overall, the results indicated that the participants’ understanding of rate of change was weak, did not vary significantly across grade levels, and did not build consistently in a manner that could enable them to develop a solid mathematical structure of functions by the end of Precalculus. Implications of the results for instruction and limitations of the study are provided.
Introduction
Rate of change is an important concept in school mathematics for understanding major topics such as functions and calculus (Confrey & Smith, 1995; Moore & Thompson, 2015). Rate of change also forms a constant part of our daily activities – e.g., whether we are walking or running, or modeling and predicting phenomena in various contexts, we constantly make use of rate of change (National Council of Teachers of Mathematics [NCTM, 2000, 2014]). In line with this recognition, many mathematics education researchers and reform documents (e.g., Ärlebäck et al., 2013; Castillo-Garsow, 2012; Confrey & Smith, 1994; NCTM, 2000, 2014) have called for ideas of rate of change to receive more explicit attention in school mathematics to help students build robust understanding in topics such as function and calculus (Thompson & Carlson, 2017). Several of these reports also noted that it is possible to present the ideas of rate of change in contexts appropriate for students of all ages and grade levels (Castillo-Garsow, 2012; Confrey & Smith, 1994; Herbert & Pierce, 2008, 2011, 2012; Kaput & Roschelle, 1998; NCTM, 2000, 2014). This position has led to the development of several reform curricula in K-12 mathematics to support students’ learning of rate of change.
In spite of these and many efforts, research reports continue to point to many difficulties students encounter when working with rate of change situations (e.g., Ärlebäck & Doerr, 2018; Castillo-Garsow, 2010, 2012; Johnson, 2012, 2015a, 2015b; Mkhatshwa & Doerr, 2018; Teuscher & Reys, 2012). For example, several studies that explored calculus students’ understanding of rate of change (Carlson et al., 2002; Gravemeijer & Doorman, 1999; Herbert, 2013; Orton, 1983) documented students’ difficulties with calculation of a rate of change from a graph (Orton, 1983), difficulty interpreting the rate of change in non-linear functional situations and reasoning with negative rates (Ärlebäck & Doerr, 2018; Feudel, 2017; Mkhatshwa & Doerr, 2018; Teuscher & Reys, 2010, 2012), as well as difficulty making connections among rate of change, slope, and difference quotient (Byerley & Thompson, 2017; Herbert & Pierce, 2008; Teuscher & Reys, 2010, 2012; Zandieh, 2000).
Similar findings were observed with high school students and teachers who have under-developed notion of rate of change as a multiplicative comparison between changes in two quantitative values (Carlson et al., 2002; Johnson, 2012, 2015a, 2015b; Kertil et al., 2019; Yu, 2019). Often, these students described rates of change in additive fashion instead of multiplicative comparison of changes in two quantities. Findings from other studies indicate that while secondary school students are comfortable working with rates of change in motion contexts, transferring that understanding to non-motion contexts is problematic for them (e.g., Herbert & Pierce, 2011; Ibrahim & Rebello, 2012; Wilhelm & Confrey, 2003). Some of these studies have shown that students’ difficulties with rate of change may be related to their poor grasp of covariational reasoning (e.g., Carlson et al., 2002; Castillo-Garsow et al., 2013; Herbert & Pierce, 2011, 2012; Johnson, 2012, 2015a, 2015b; Kertil et al., 2019; Stalvey & Vidakovic, 2015; Thompson & Carlson, 2017). However, only a few studies have explored students’ understanding of rate of change involving two covarying quantities, and how this understanding evolves across grade levels (Herbert & Pierce, 2012).
The purpose of this study, therefore, is to explore the nature of high school students’ understanding of rate of change, and the difficulties the students exhibit as they reason, represent, and make connections between the various representations of rate of change in physical and functional situations involving two covarying quantities. A related goal of the study is to determine if students’ understandings of rate of change build consistently in a manner that could lead them to develop a robust mathematical structure of functions by the end of Precalculus – keeping in mind that the students in the upper grades will have more mature mathematical thought processes than those in the lower grades. The study is, thus, guided by the following research questions:
What is the nature of grades 9–12 students’ understanding of rate of change involving two covarying quantities? How does students’ understanding of rate of change involving two covarying quantities vary or build across grade levels? What are the common errors and misconceptions associated with students’ understanding of rate of change involving two covarying quantities?
Literature review
While there are different conceptions of the rate of change, mathematicians generally refer to rate of change as the change in one quantity relative to the change in another quantity (i.e., a functional relationship between two variables—one called the independent variable and the other referred to as the dependent variable). For this study, we define rate of change situations as a ratio that compares the change in the dependent variable to the amount of change in the independent variable. This concept has been studied in various ways, at various grade levels, and in various topics—e.g., as a ratio (Confrey & Smith, 1994; Johnson, 2015a, 2015b; Thompson & Thompson, 1996), as covariation (Carlson et al., 2002; Stalvey & Vidakovic, 2015; Thompson & Carlson, 2017), as limit and function (Ärlebäck & Doerr, 2018; Johnson, 2012; Mkhatshwa & Doerr, 2018), and in modeling contexts (Ärlebäck et al., 2013; Doerr & O’Neil, 2011). All of these studies have the aim of understanding students’ conceptions and misconceptions, and to make this concept accessible to students at all grade levels (Confrey & Smith, 1994; NCTM, 2000, 2014).
Confrey and Smith (1994, 1995) provided some of the earliest insights into children's conceptions of rate of change in the elementary grades. Their work was built on the idea of two approaches to introducing functions in mathematics: a correspondence approach and a covariational approach. According to Confrey and Smith (1994, 1995), the correspondence approach occurs when students are introduced to functions as a one-to-one relationship with the vertical line test. The covariational approach, on the other hand, is built up through students examining and creating tables where the x-value (independent variable) determines the y-value (the dependent variable). The authors identified three common methods students use to solve these types of problems: additive rate of change, multiplicative rate of change, and “proportional new to old” rate of change (Confrey & Smith, 1994, p. 141). Through these initial conceptions of rate of change with elementary school children, Confrey and Smith (1994, 1995) recommended instructional focus on multiplicative approach as the basis for growth in understanding rate of change.
Following the work of Confrey and Smith (1994, 1995), several other researchers wrote extensively on additive and multiplicative constructs of rate of change (Byerley et al., 2012; Byerley et al., 2016; Castillo-Garsow, 2012; Coe, 2007; Rasmussen & Marrongelle, 2006; Thompson, 1994b). The additive rate of change, which usually provides the initial understanding of the concept, is interpreted as the ratio between differences in succeeding values of independent and dependent variables. This conception involves focusing on the difference between the quantities rather than the relationship between the variables involved in the situation. The multiplicative rate of change, on the other hand, refers to the quantification of the relationship between two quantities’ values as they vary together (Carlson et al., 2002; Confrey & Smith, 1994, 1995; Yu, 2024). It involves students employing the concepts of ratios and proportions and focusing on the relationship between the changing quantities (Thompson & Carlson, 2017; Yu, 2024).
Various research reports (e.g., Byerley et al., 2016; Coe, 2007; Thompson, 1994b) observed that many students have a well-developed additive scheme for rate of change. Although this way of thinking works for them in many situations involving rates of change (Byerley et al., 2016), it presents challenges for them when there are slight variations in the context of the problem. For instance, Castillo-Garsow (2012) found that, while the additive reasoning scheme of rate of change allowed students to determine the amount of money added to a bank account for whole number values for the number of years, when faced with the same problems involving fractional amounts of change in the input quantity's value, this method of reasoning fell short in helping them determine the amount to add to the bank account. Byerley and Thompson (2017) found that teachers who reasoned additively about rate of change thought of slope as a marker of slantiness for a graph and often confused a rate of change with an amount of change. Another aspect of working with rate of change where the additive reasoning is inappropriately used by students is when dealing with problems involving instantaneous rate of change and derivatives—each of which requires students to think multiplicatively to provide correct response.
All the above studies point to the fact that, while the additive scheme of rate of change is useful in some situations, it can sometimes lead to misconceptions and students’ difficulties in many other instances. In some cases, students may need both additive and multiplicative approaches in solving rate of change situations, i.e., they must make additive comparisons to determine the change in quantities and then multiplicatively compare those changes in order to solve the situation.
A more comprehensive understanding of rate of change has also been linked to students’ ability to reason covariationally (Johnson, 2012, 2015a, 2015b; Kertil et al., 2019; Thompson & Carlson, 2017; Yu, 2024). In this study, we define covariational reasoning as the mental process that involves coordinating the values of two (or more) changing quantities and understanding how their changes relate to each other. Thompson and Carlson (2017) noted that “for students to conceptualize rates of change requires that they reason covariationally” (p. 441), in addition to some other ideas such as ratio, quotient, accumulation, and proportionality. They, however, made a distinction between covariational reasoning and rate of change; stating that whereas covariational reasoning refers to how an individual coordinates changes in two quantities’ values, a rate of change refers to a quantification of the multiplicative relationship between two quantities’ values as they vary together. According to Thompson (1994b), understanding a rate of change, therefore, involves imagining two quantities covarying such that the change in one quantity is proportional to the change in the other quantity. Thus, when students are confronted with situations involving rate of change, the level of covariational reasoning they exercise largely determines their ability to understand how the situation develops and, hence, to solve it correctly.
Some studies have, therefore, attributed students’ difficulties with the rate of change to their weak concept of covariational reasoning (e.g., Carlson et al., 2002; Castillo-Garsow et al., 2013; Herbert & Pierce, 2011, 2012; Stalvey & Vidakovic, 2015; Thompson & Carlson, 2017). These reports suggest the need for further research that focuses on describing and developing students’ covariational reasoning abilities in the context of rate of change (e.g., Ärlebäck et al., 2013; Paoletti & Moore, 2018; Thompson et al., 2017; Thompson & Carlson, 2017). This conceptualization can be achieved by exploring rate of change within covariational situations. To contribute to this line of research, our study explored high school students’ understanding of rate of change involving two covarying quantities, the nature of students’ difficulties when working with rate of change within these contexts, and how students’ development of this concept evolves across different grade levels.
Methods
Participants and context of the study
Ninety-nine students from Grades 9–12 enrolled in Algebra I, Algebra II, Geometry, Precalculus, AP-Calculus, and Dual Credit-College Algebra courses in a public high school in the United States participated in the study. Thus, a convenience sample of all the students in this public high school enrolled in the above-mentioned courses whose teachers and parents signed a consent form for them to be included, participated in the study. The final group of participants consisted of nineteen students from Grade 9, nineteen students from Grade 10, fifteen students from Grade 11, and forty-six students from Grade 12. About 59% of them came from economically disadvantaged families with 67% of them identified as at-risk students. Table 1 provides information on the distribution of the participants by grade level and the mathematics courses they were taking at the time of the study.
Student distribution by grade and mathematics Course.
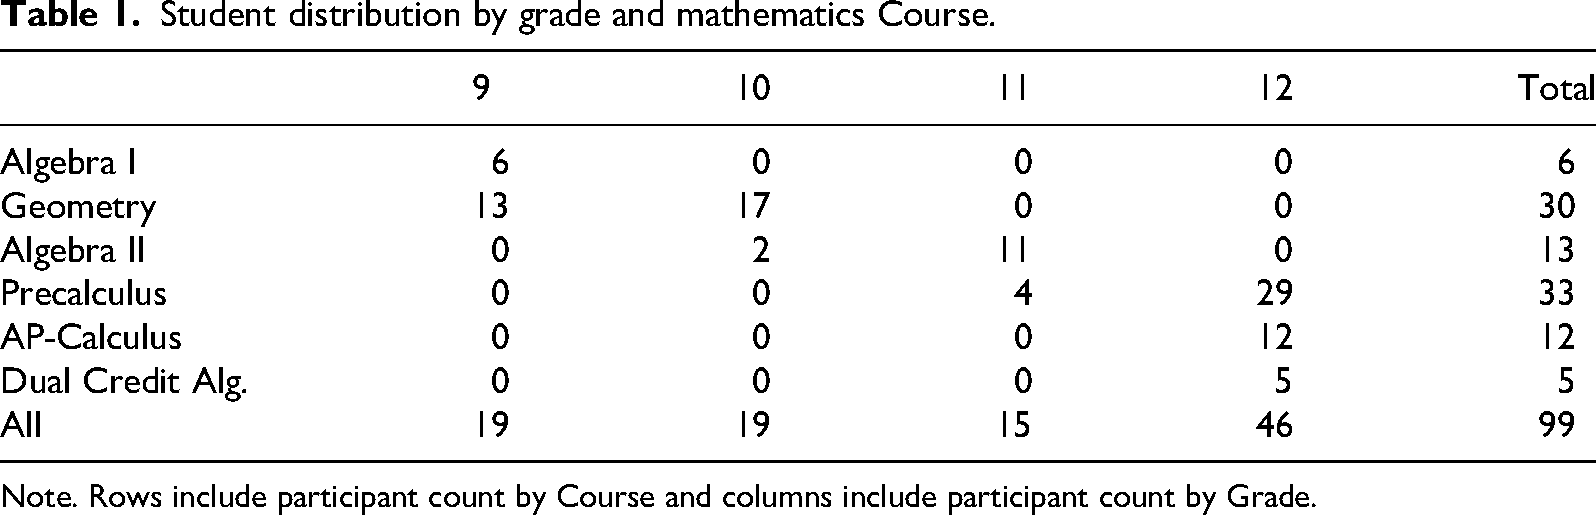
Student distribution by grade and mathematics Course.
Note. Rows include participant count by Course and columns include participant count by Grade.
Participants from different grade levels were included in the study to allow the researchers to examine how students’ understanding of rate of change evolves across grade levels (grades 9–12), and if students at different grade levels exhibit different difficulties with the concept of rate of change.
Diagnostic test on rate of change
All the participants completed a researcher-developed Diagnostic Test on Rate of Change (DTRC) that assessed their understanding of various representations of rate of change situations related to slope, geometric ratio, algebraic ratio, measure of steepness, and unit and average rates within various real-world contexts. There were 13 items on the DTRC, consisting of six multiple-choice and seven short response questions. These tasks were either adapted from the school district-adopted textbooks, released items from state mathematics assessment, released items from Partnership for Assessment of Readiness for College and Careers (PARCC), or written by the researchers. The development of the DTRC was guided by literature review that characterized students’ conceptions and difficulties with rate of change, ratio, slope, and covariational reasoning (Coe, 2007; Thompson, 1994a, 1994b; Zaslavsky et al., 2002), also taking into account the mathematical development and expectations of grades 9–12 students. We followed common instrument construction guidelines such as making many revisions to the items based on feedback received from three experts in mathematics education who reviewed the items to ensure that they were appropriate for measuring students’ understanding of rate of change. We also pilot tested the instrument with 20 students from grades 9–12 in the same school during the semester prior to its use in our study. Those students were excluded from the actual study. Figure 1 shows a sample of items on the DTRC. A complete list of all the 13 items is found in Appendix A.
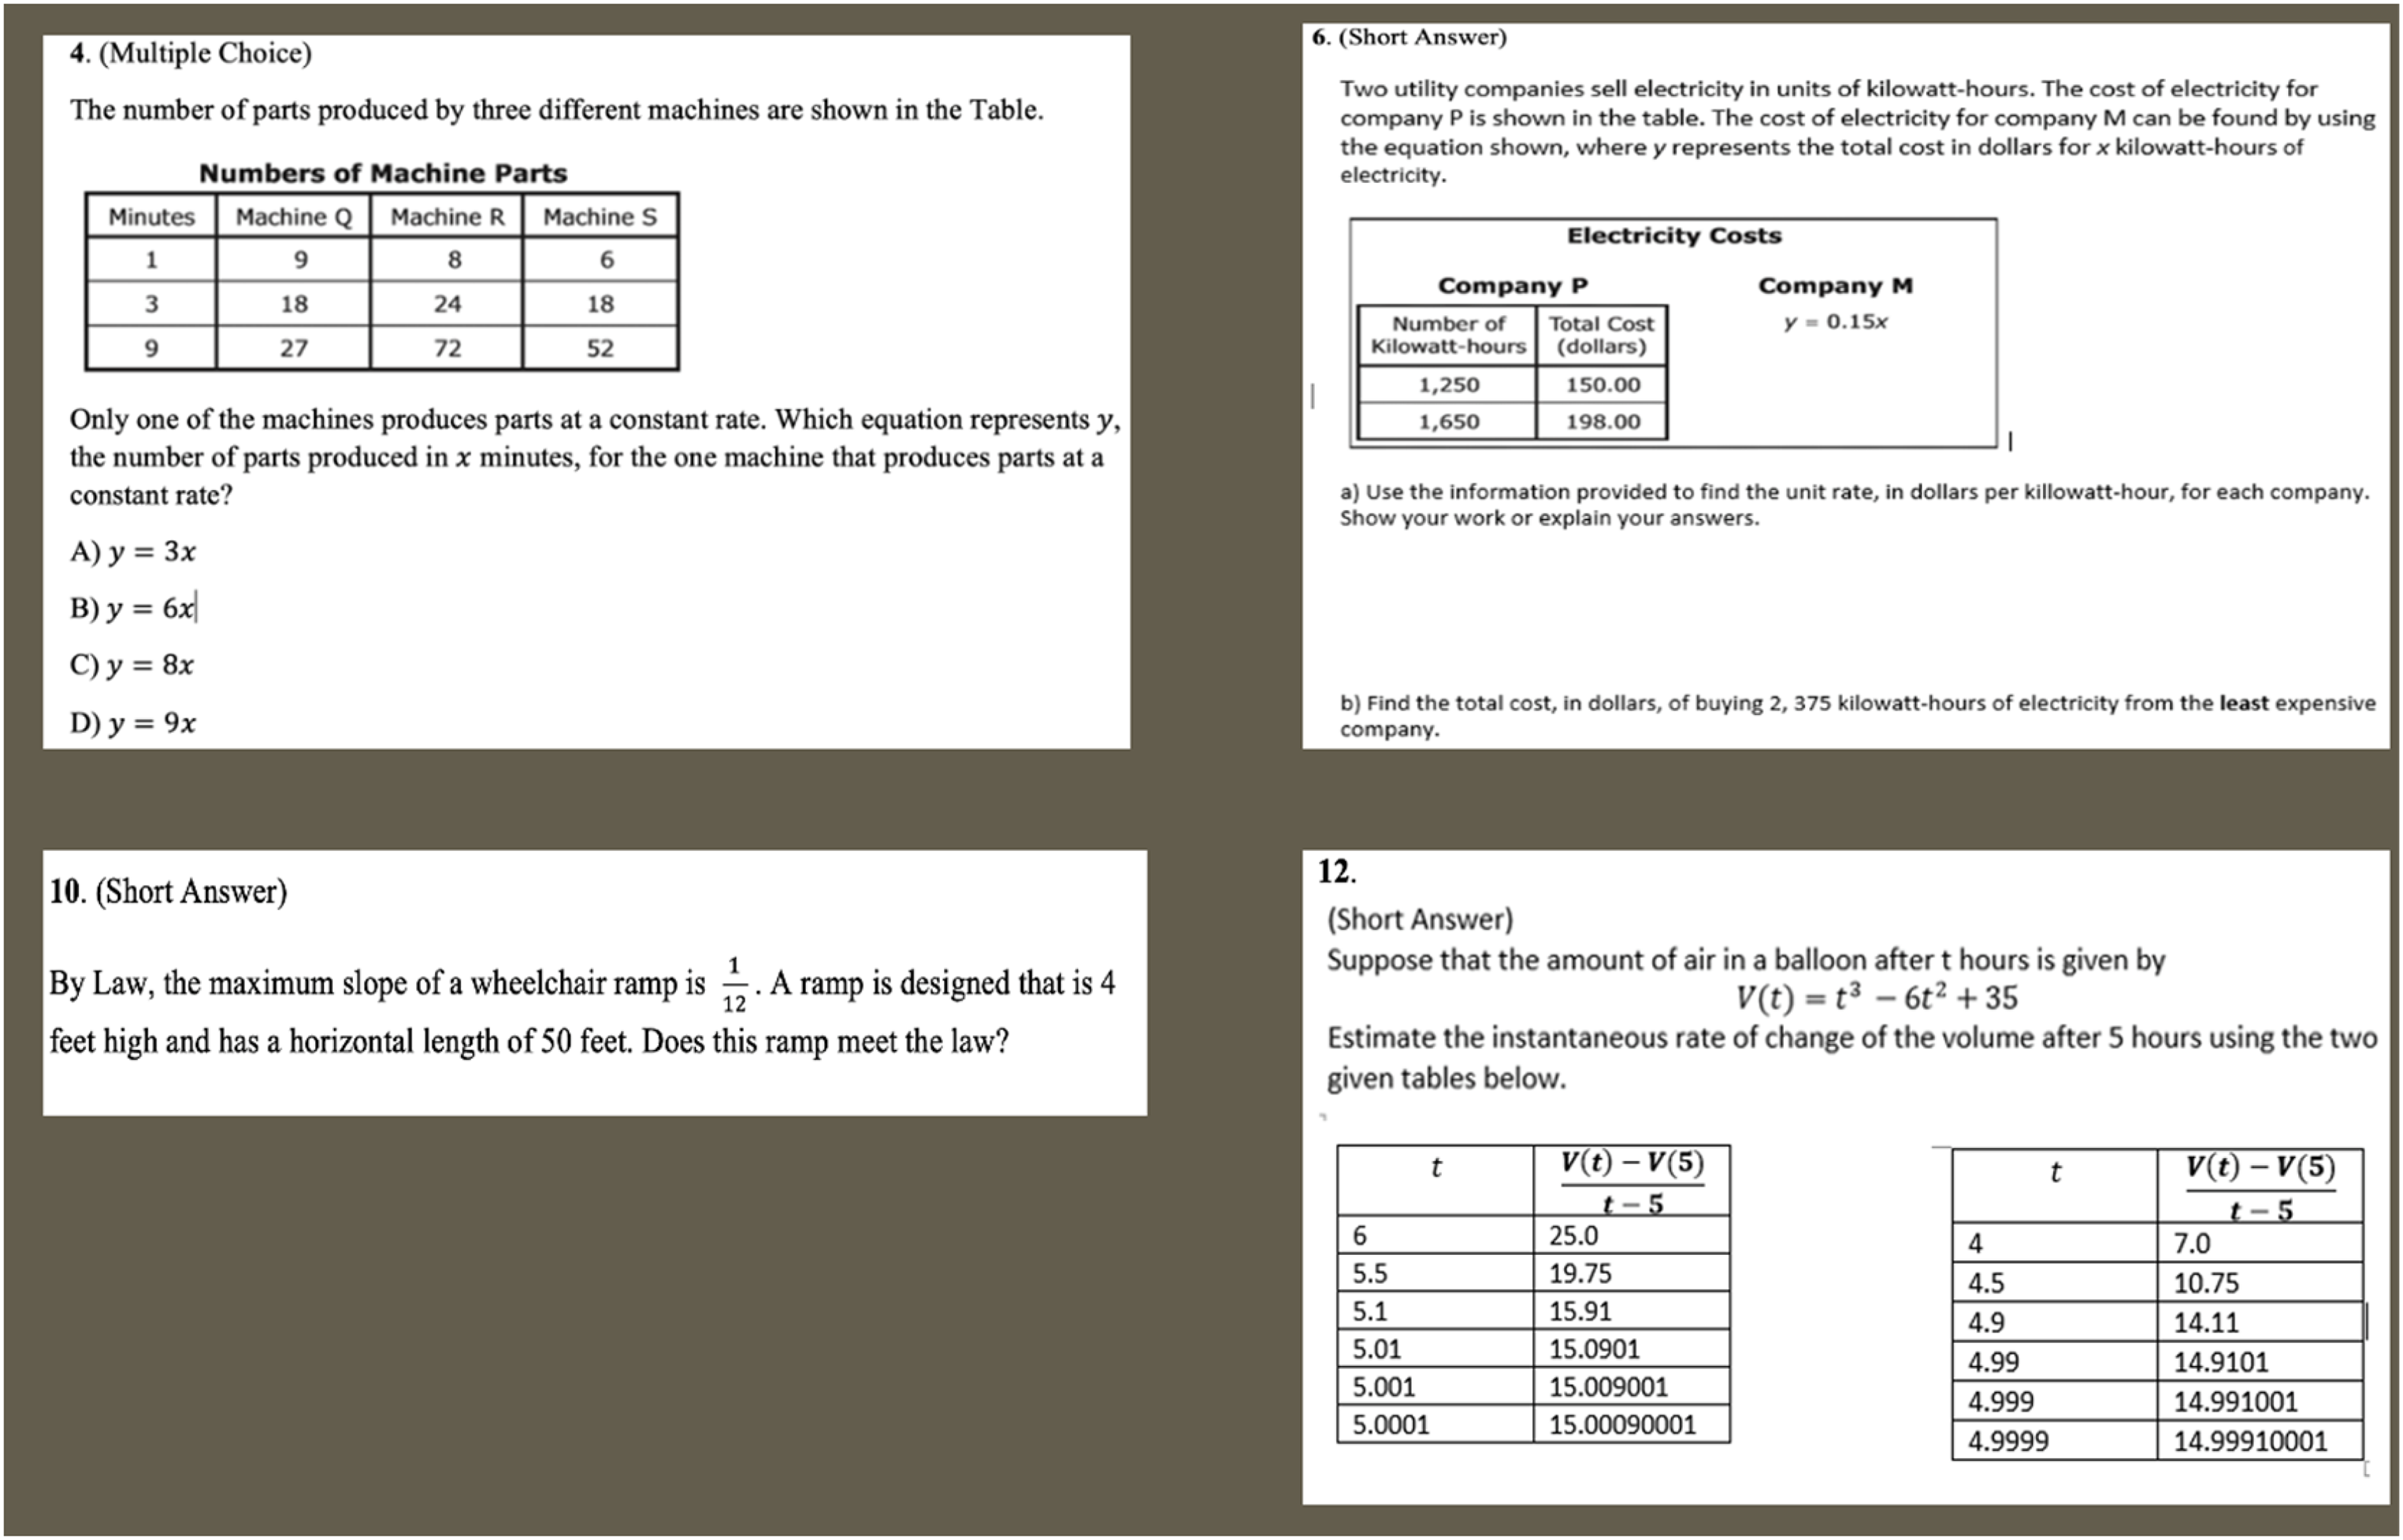
Sample of items on the DTRC.
We scored the participants’ performance on the DTRC using a rubric created by the research team. A preliminary score of 0, 1, or 2 was awarded for each solution presented by the participants to each problem they attempted. A score of “0” indicated that the student showed no understanding, a score of “1” indicated partial understanding, and a score of “2” indicated clear understanding. The minimum total score possible each participant could achieve across all 13 items on the DTRC was 0—if they did not answer any of the 13 questions, or if they answered all the 13 questions incorrectly. Similarly, the maximum (highest) score a participant could achieve on the DTRC was twenty-six points—if they answered all the 13 items on the DTRC correctly.
3.2.2 Interview protocal
To gain more insight into participants’ conceptual knowledge, difficulties, and common errors with the concepts of rate of change, interviews were conducted with 16 participants. These 16 participants included 4 students from each grade level (grades 9–12) based on their performance on the DTRC assessment. Specifically, for each grade level, at least one student was interviewed who demonstrated no understanding (0), partial understanding (1), or clear understanding (2) on some of the items on the DTRC, respectively. The semi-structured think-aloud interview required students to describe their solutions to some or all of the items on the DTRC that they attempted (or explain why they did not attempt a particular item). During the interview, students were asked questions such as:
In problem 6, you were asked to find the unit rate. Why do we need to know the unit rate in this context? How did you solve this problem? Is finding slope in one problem similar to finding constant rate in another problem? For example, in problems 4 & 5. What do you think? In problem 10, what do you think is the meaning of maximum slope of a wheelchair ramp? How did you solve this problem? What difficulty did you encounter with this problem? In problems 2 and 11, you are asked to find average rate of change for a given interval. How did you solve this problem? What did you do first? What did you do next? What was difficult for you in this problem? In problem 12, you were asked to find the instantaneous rate of change of the volume after 5 h. How did you solve this problem? What was difficult for you in this problem? In problem 8 you are asked to match four given tables of values with four function types. How did you know which table matches what function?
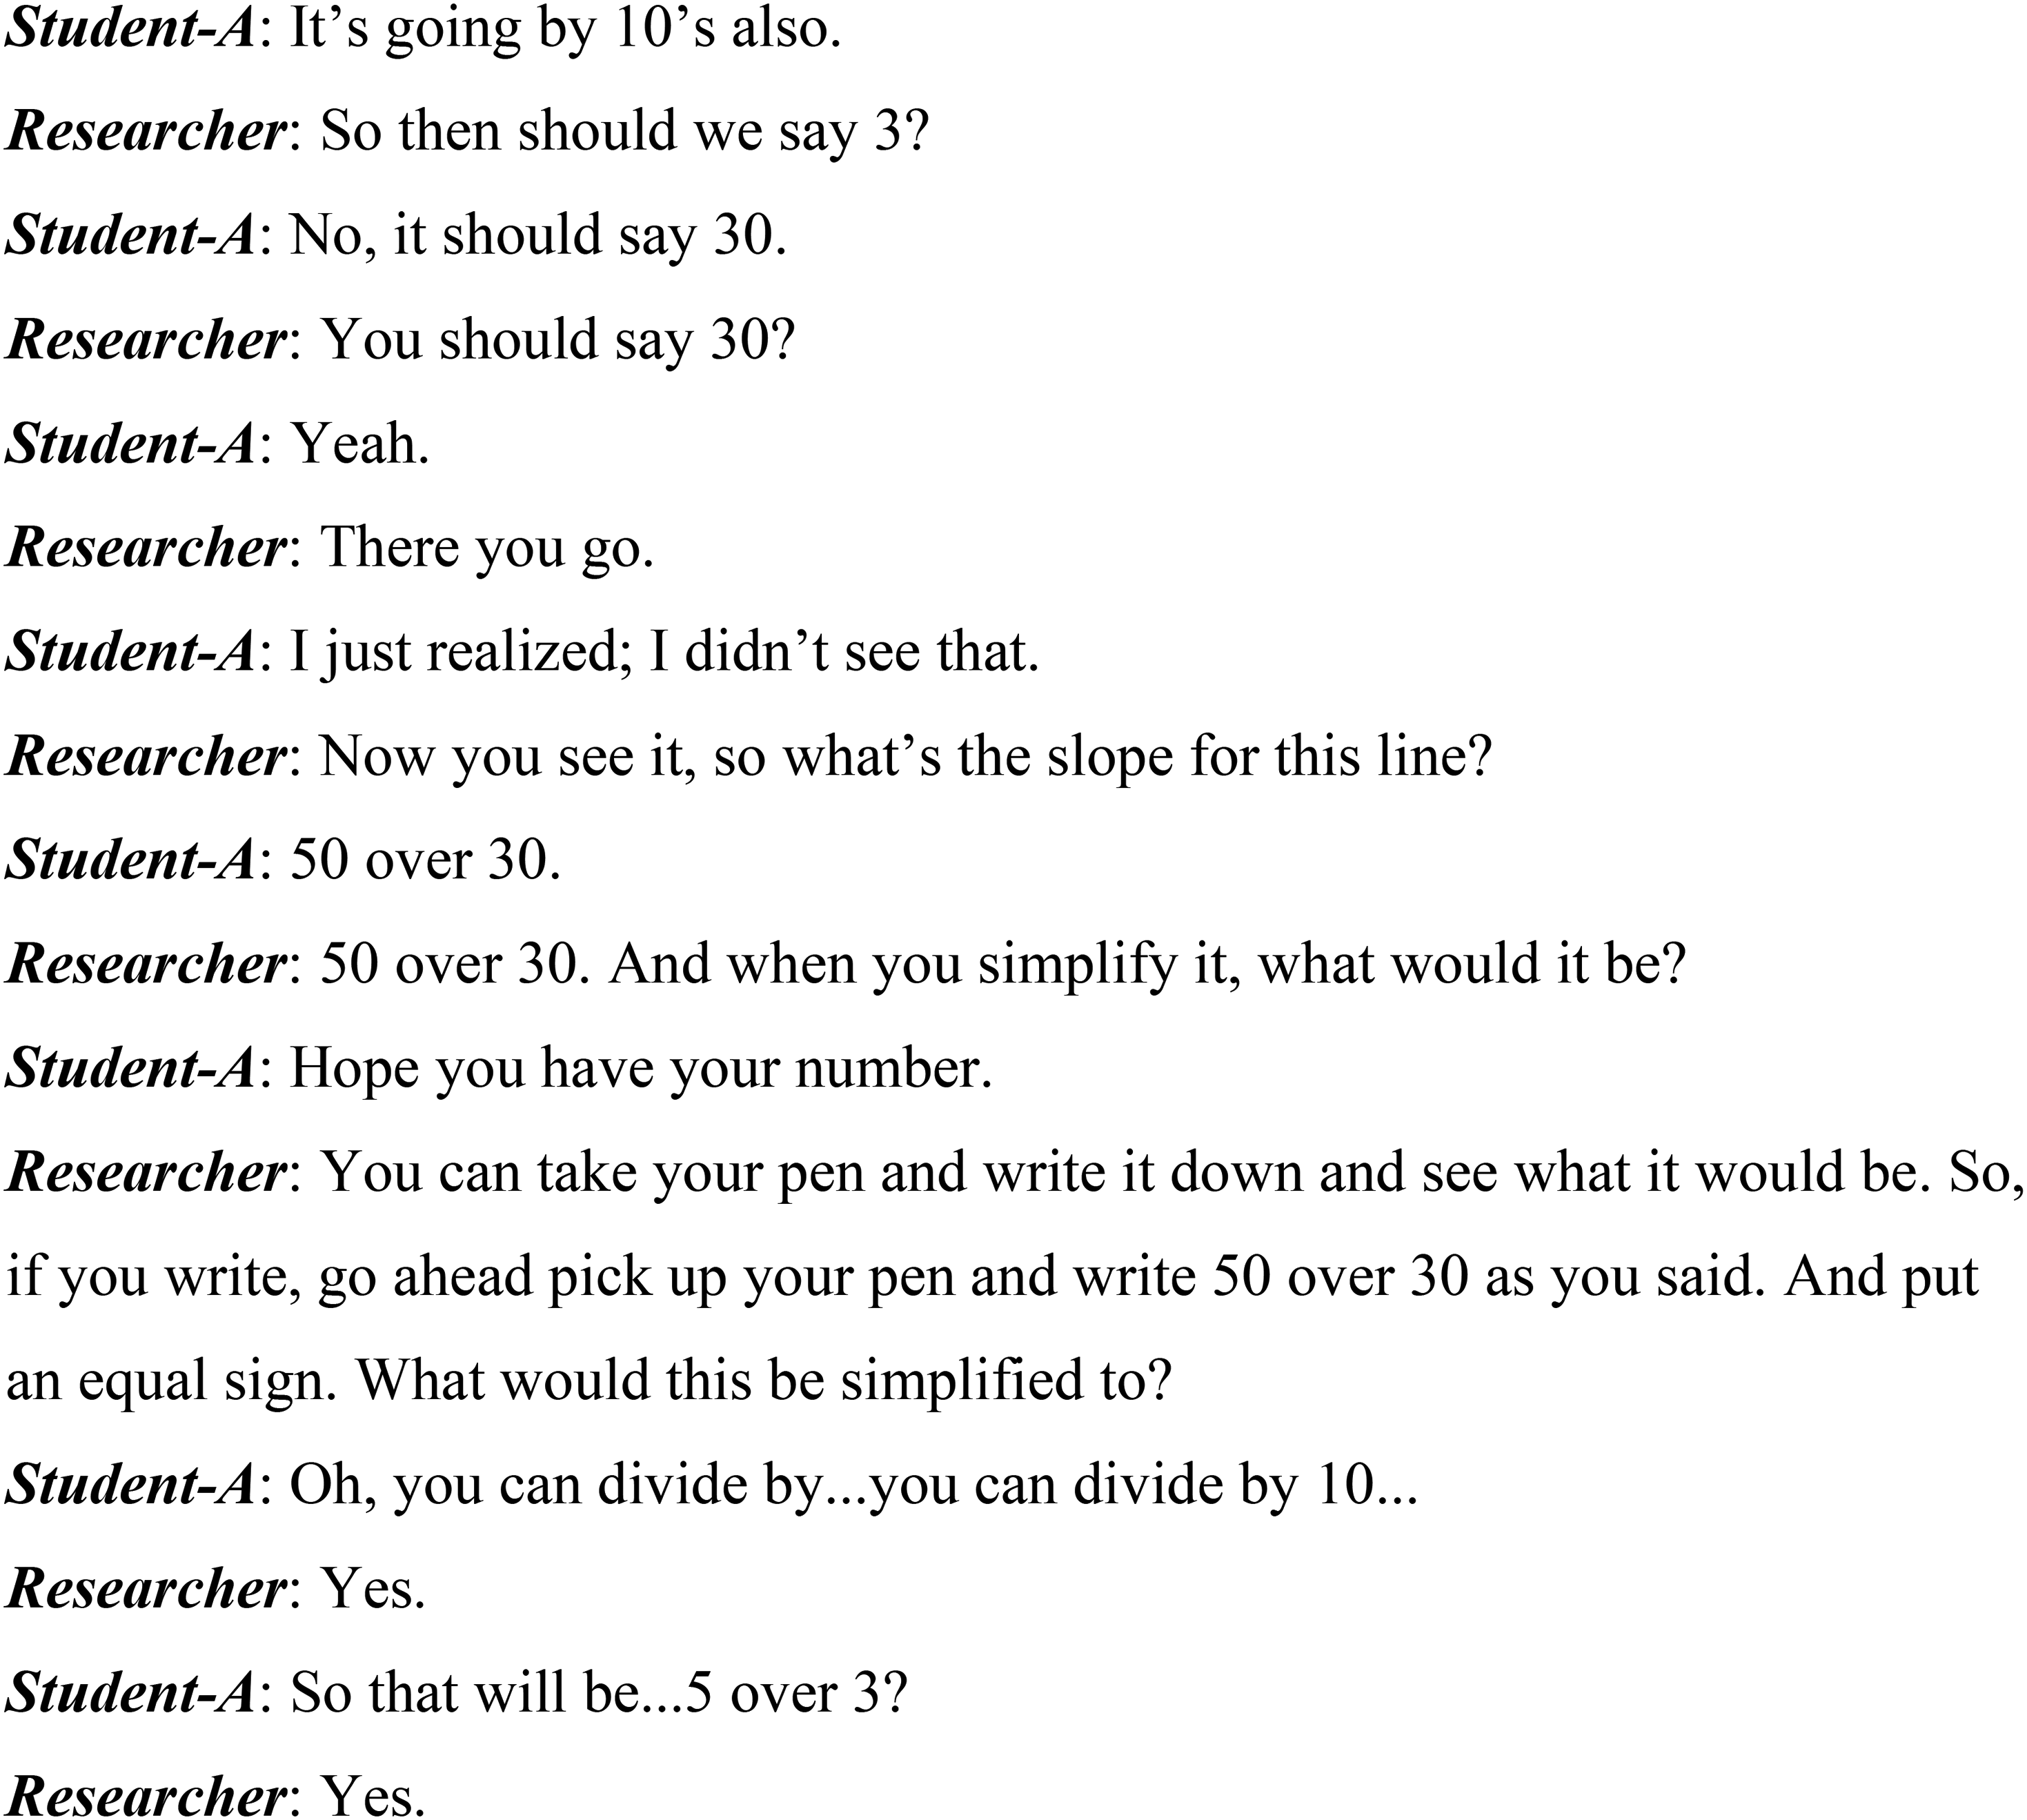
Figure 2 to 7 present samples of students’ responses to items 1, 2, and 10 on the DTRC, and the accompanying interview transcript of the participants for each item.
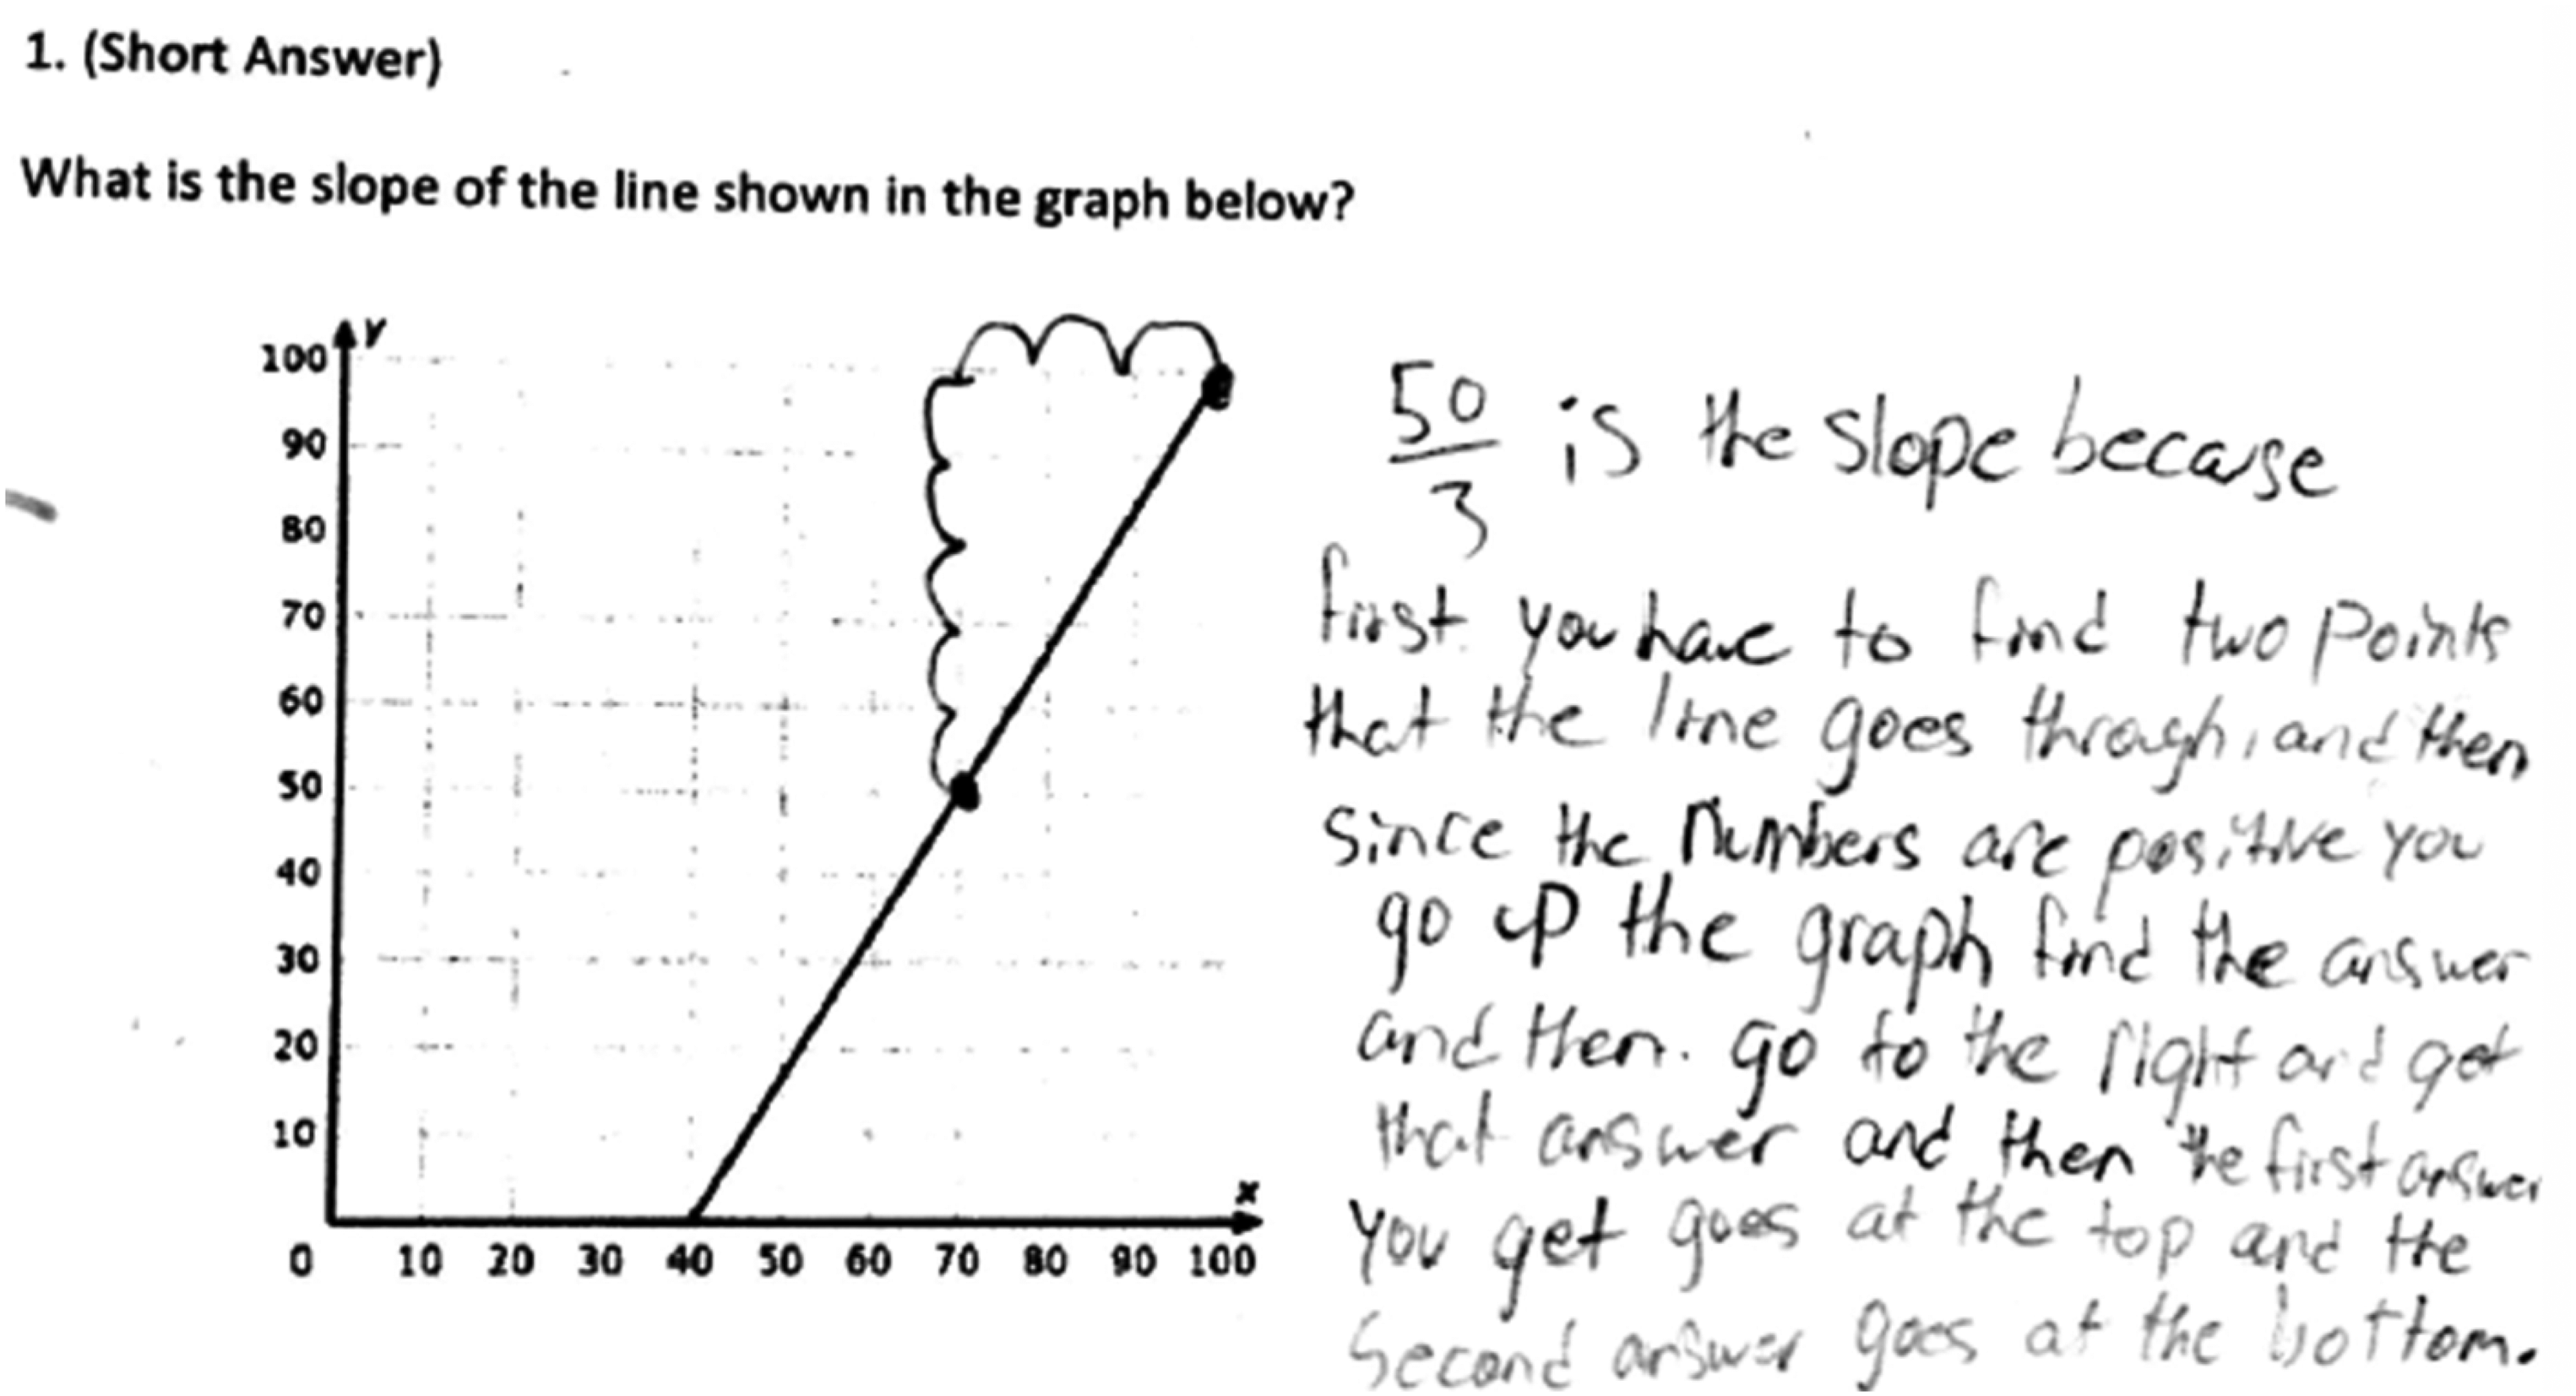
Student-A work on item 1 on the DTRC.
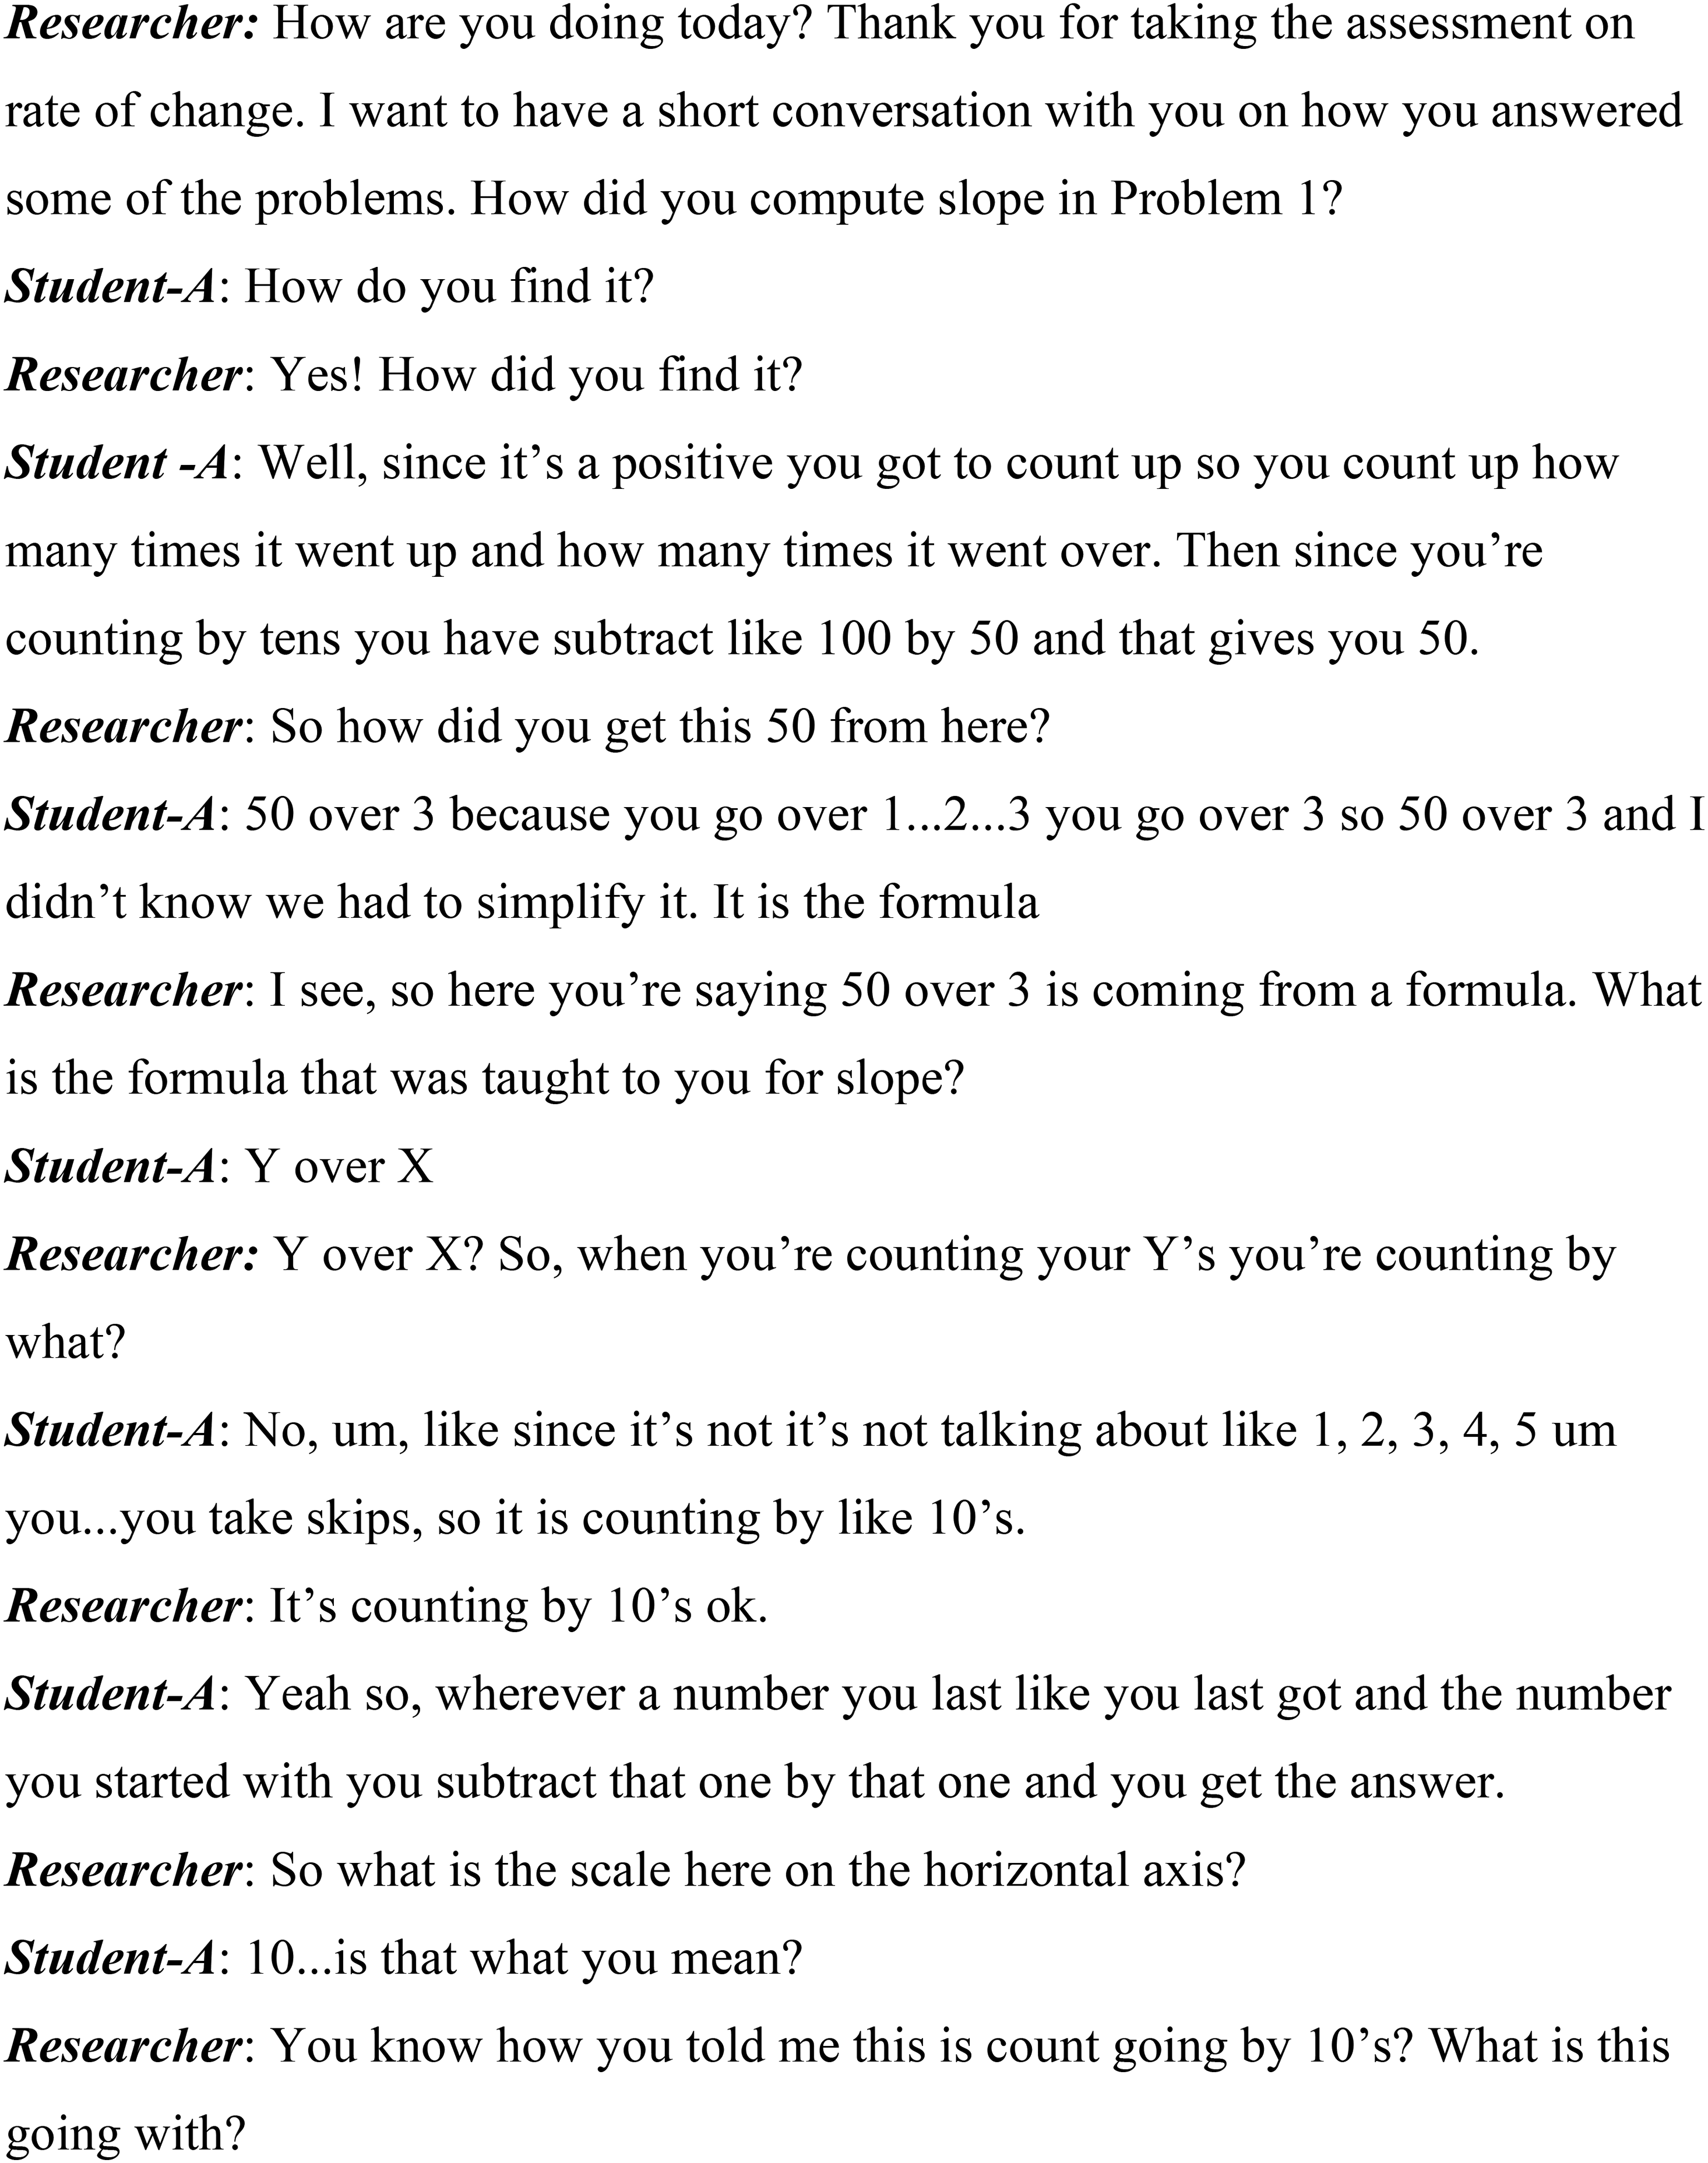
Interview transcript of student-A for item 1 on the DTRC.
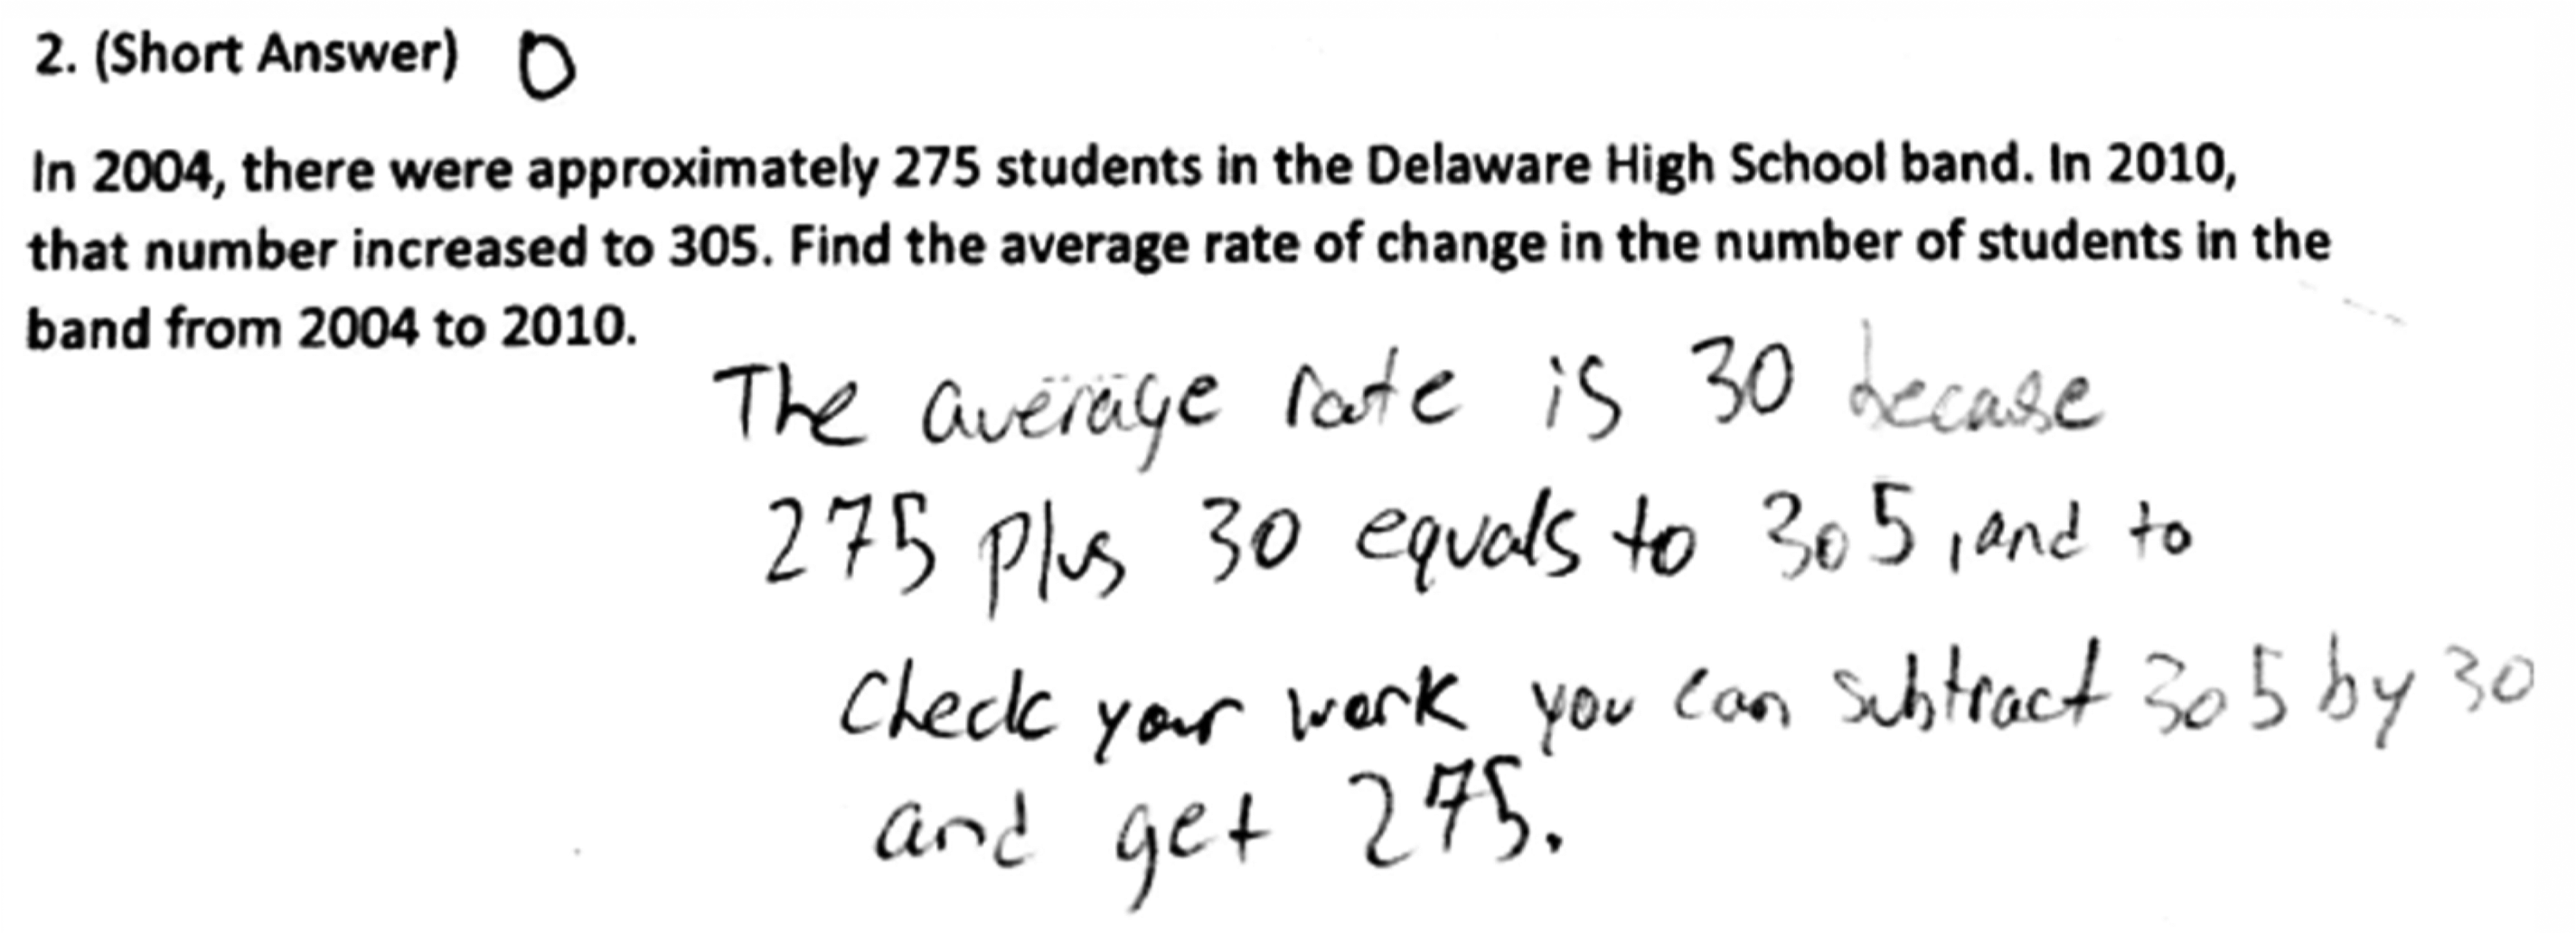
Student-D work on item 2 on the DTRC.
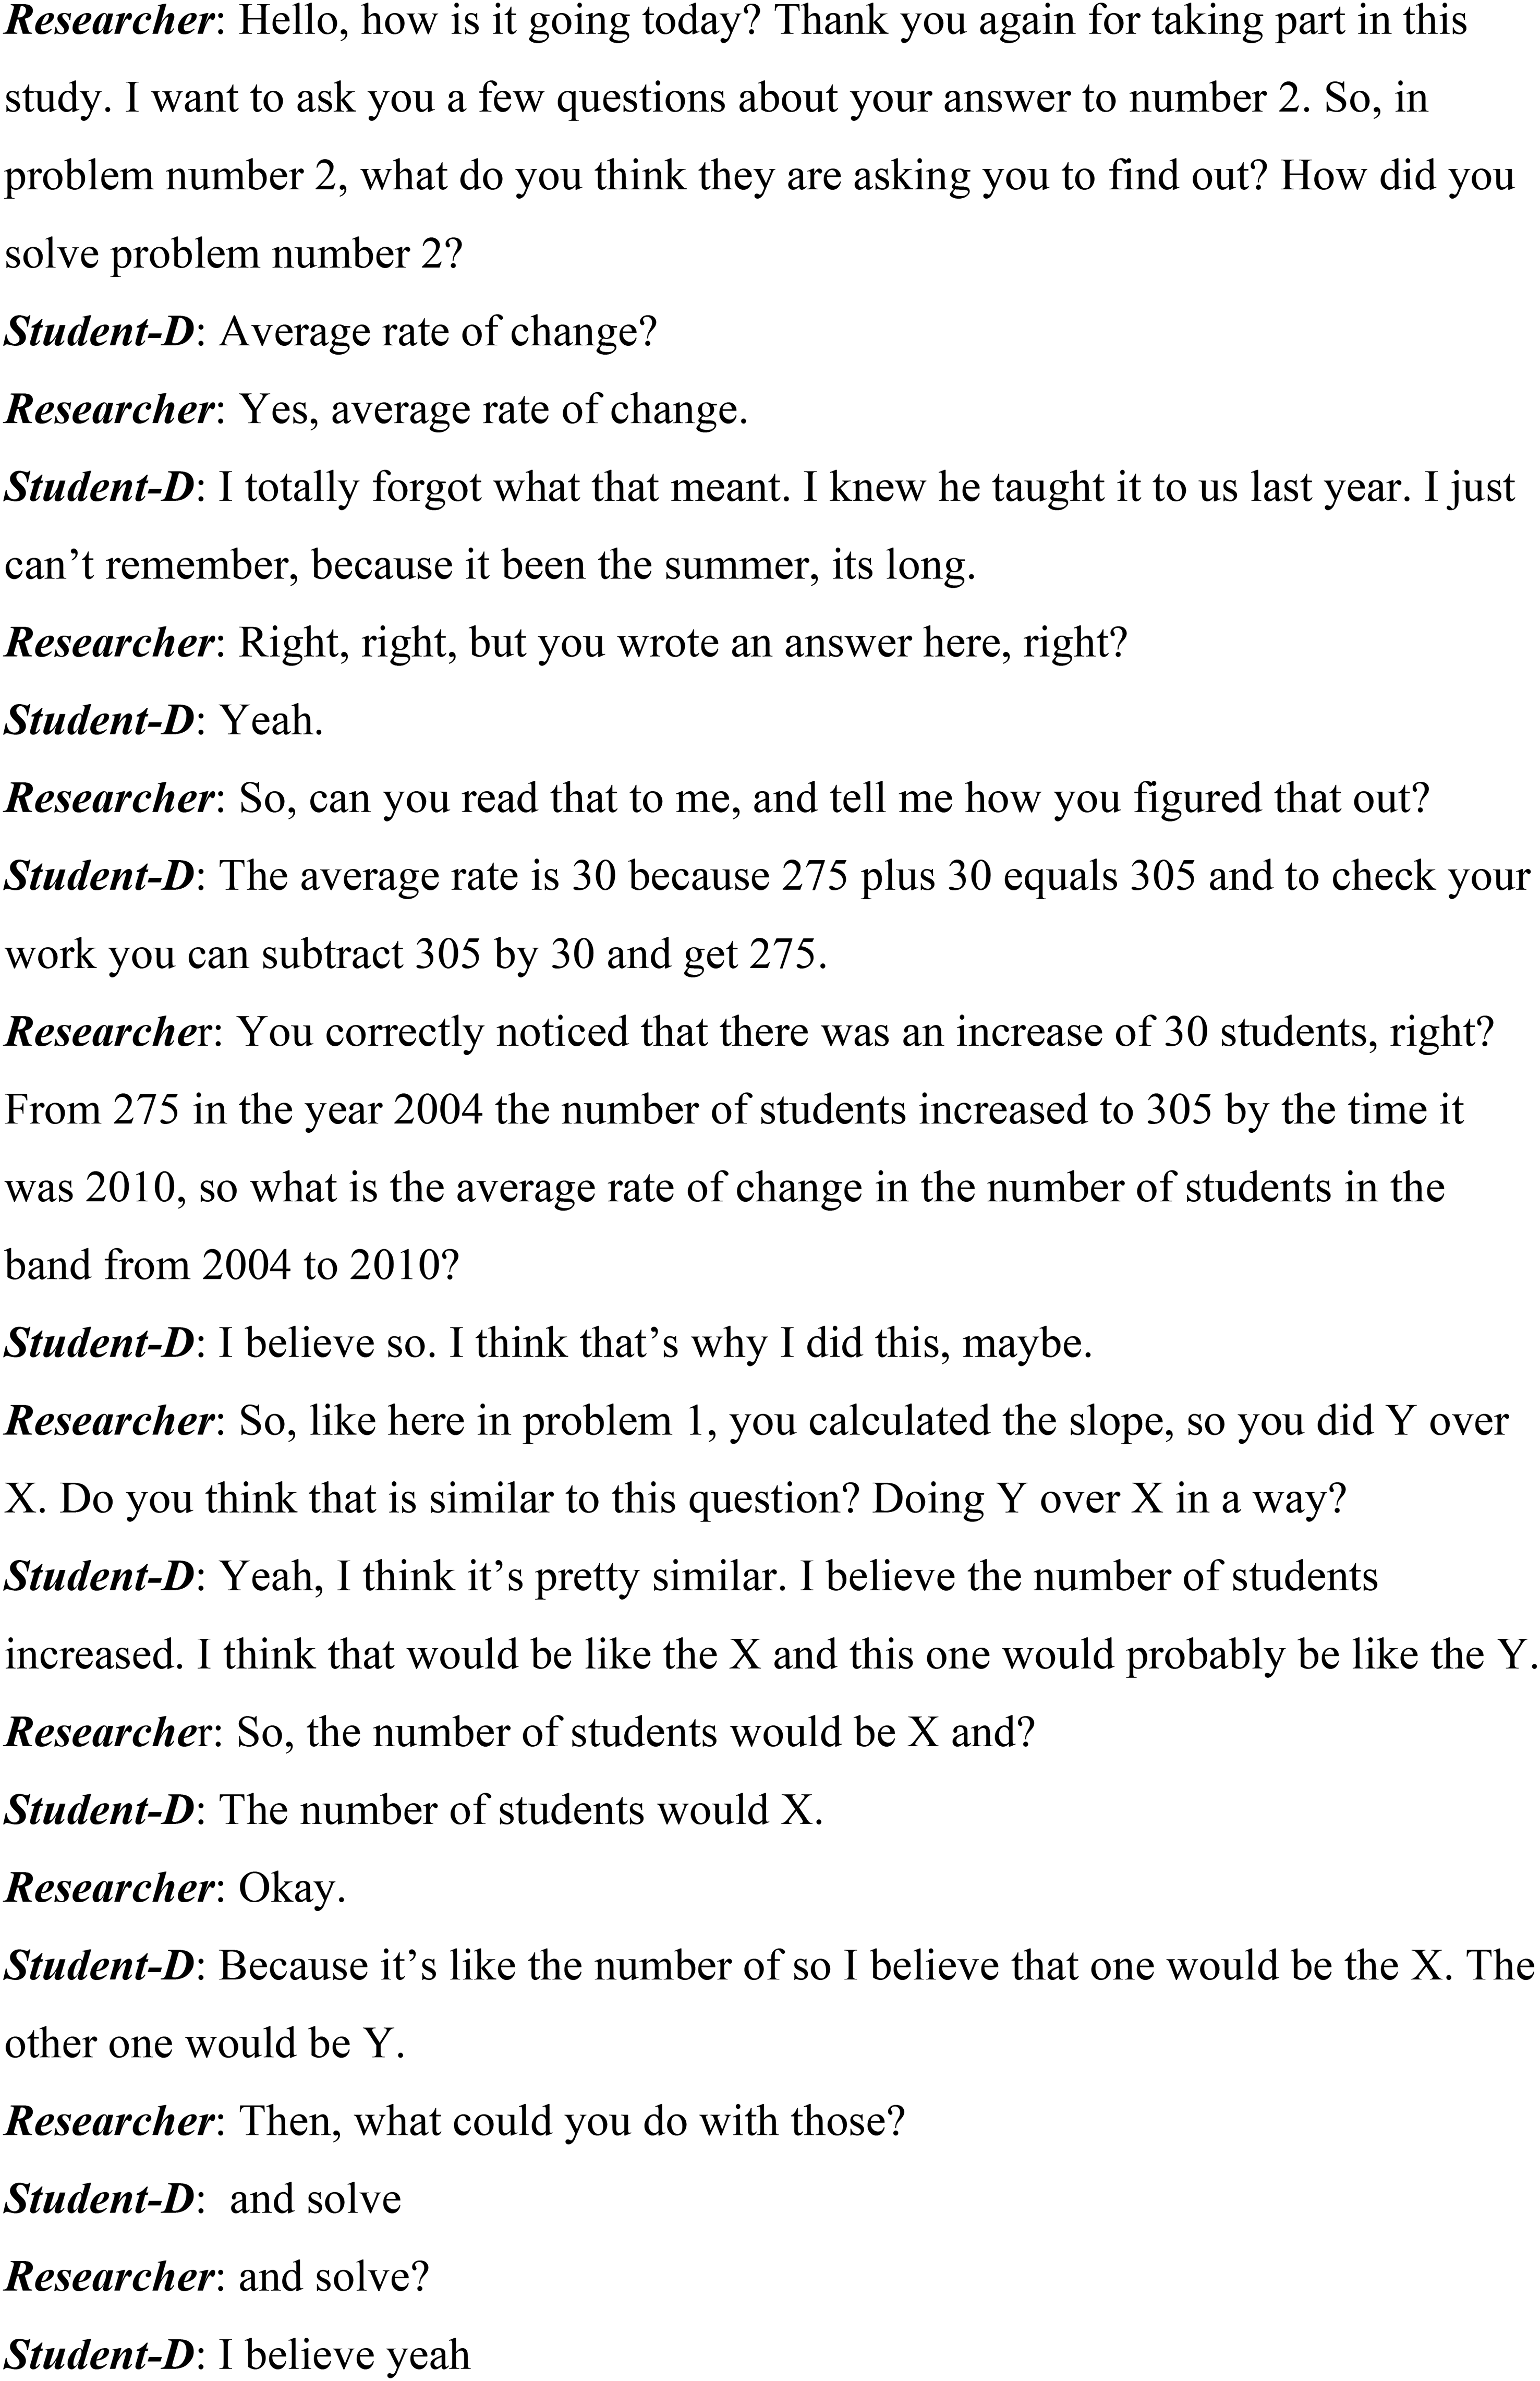
Interview transcript of student-D for item 2 on the DTRC.
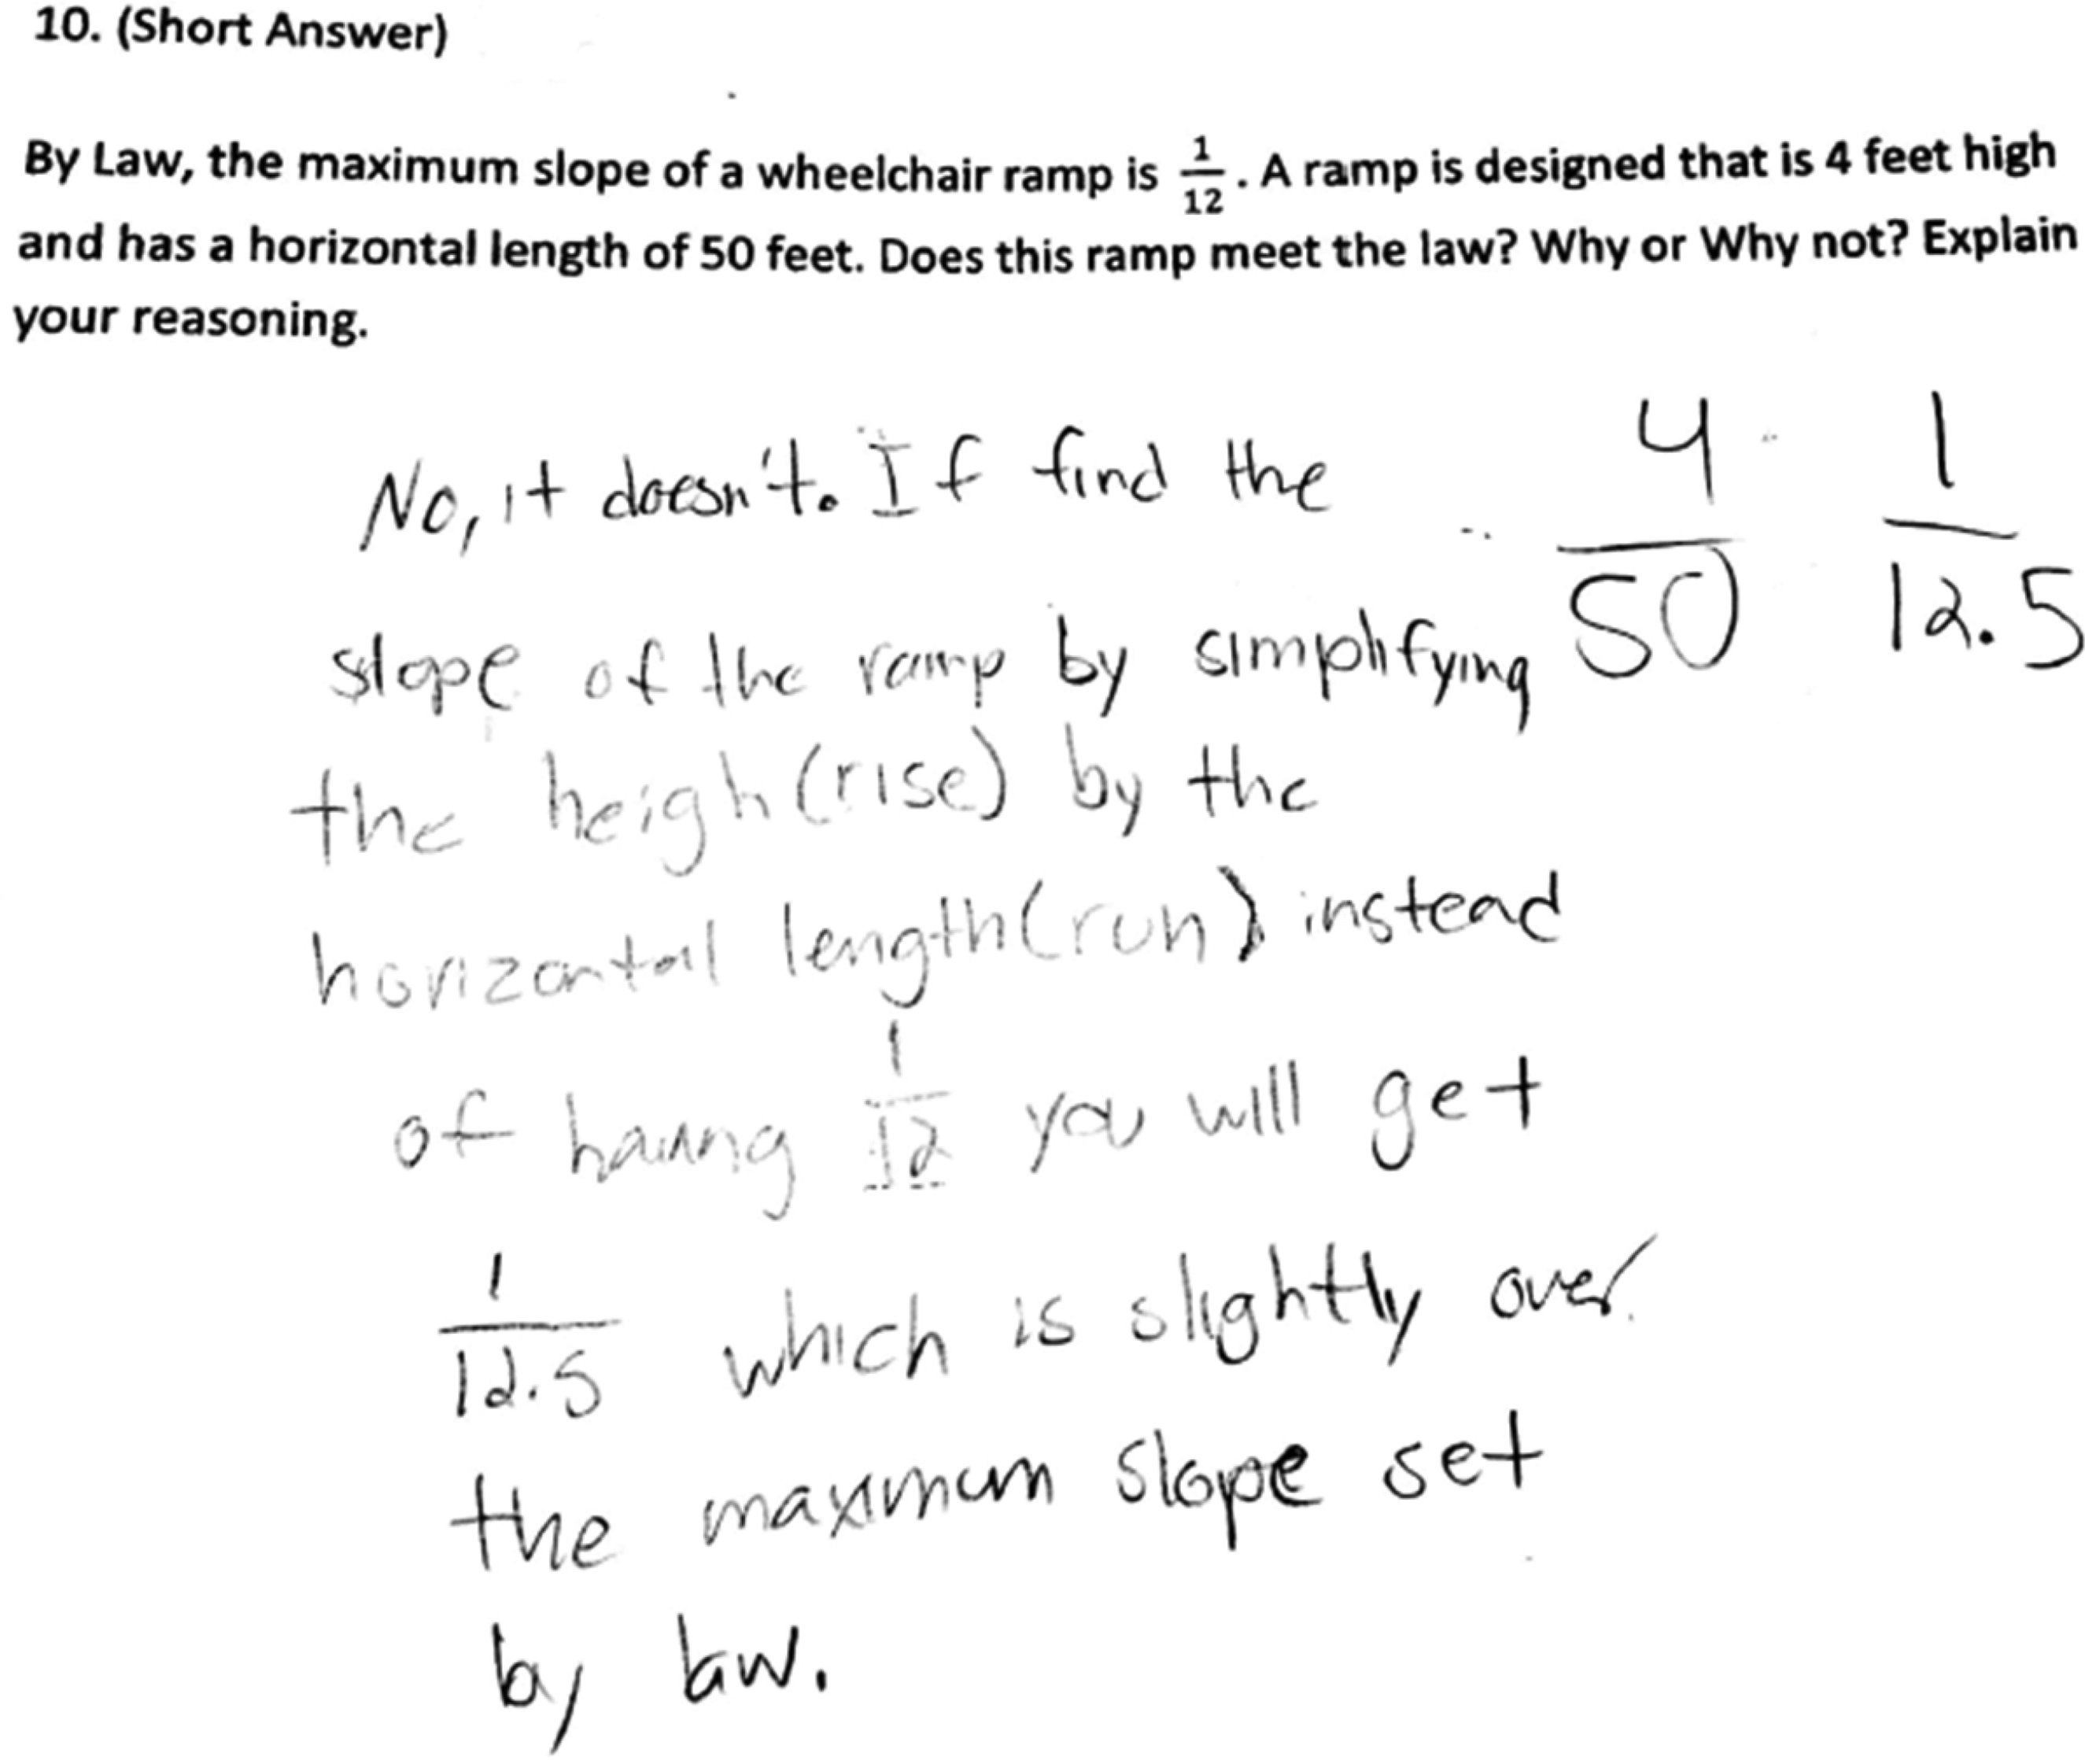
Student-G work on item 10 on the DTRC.
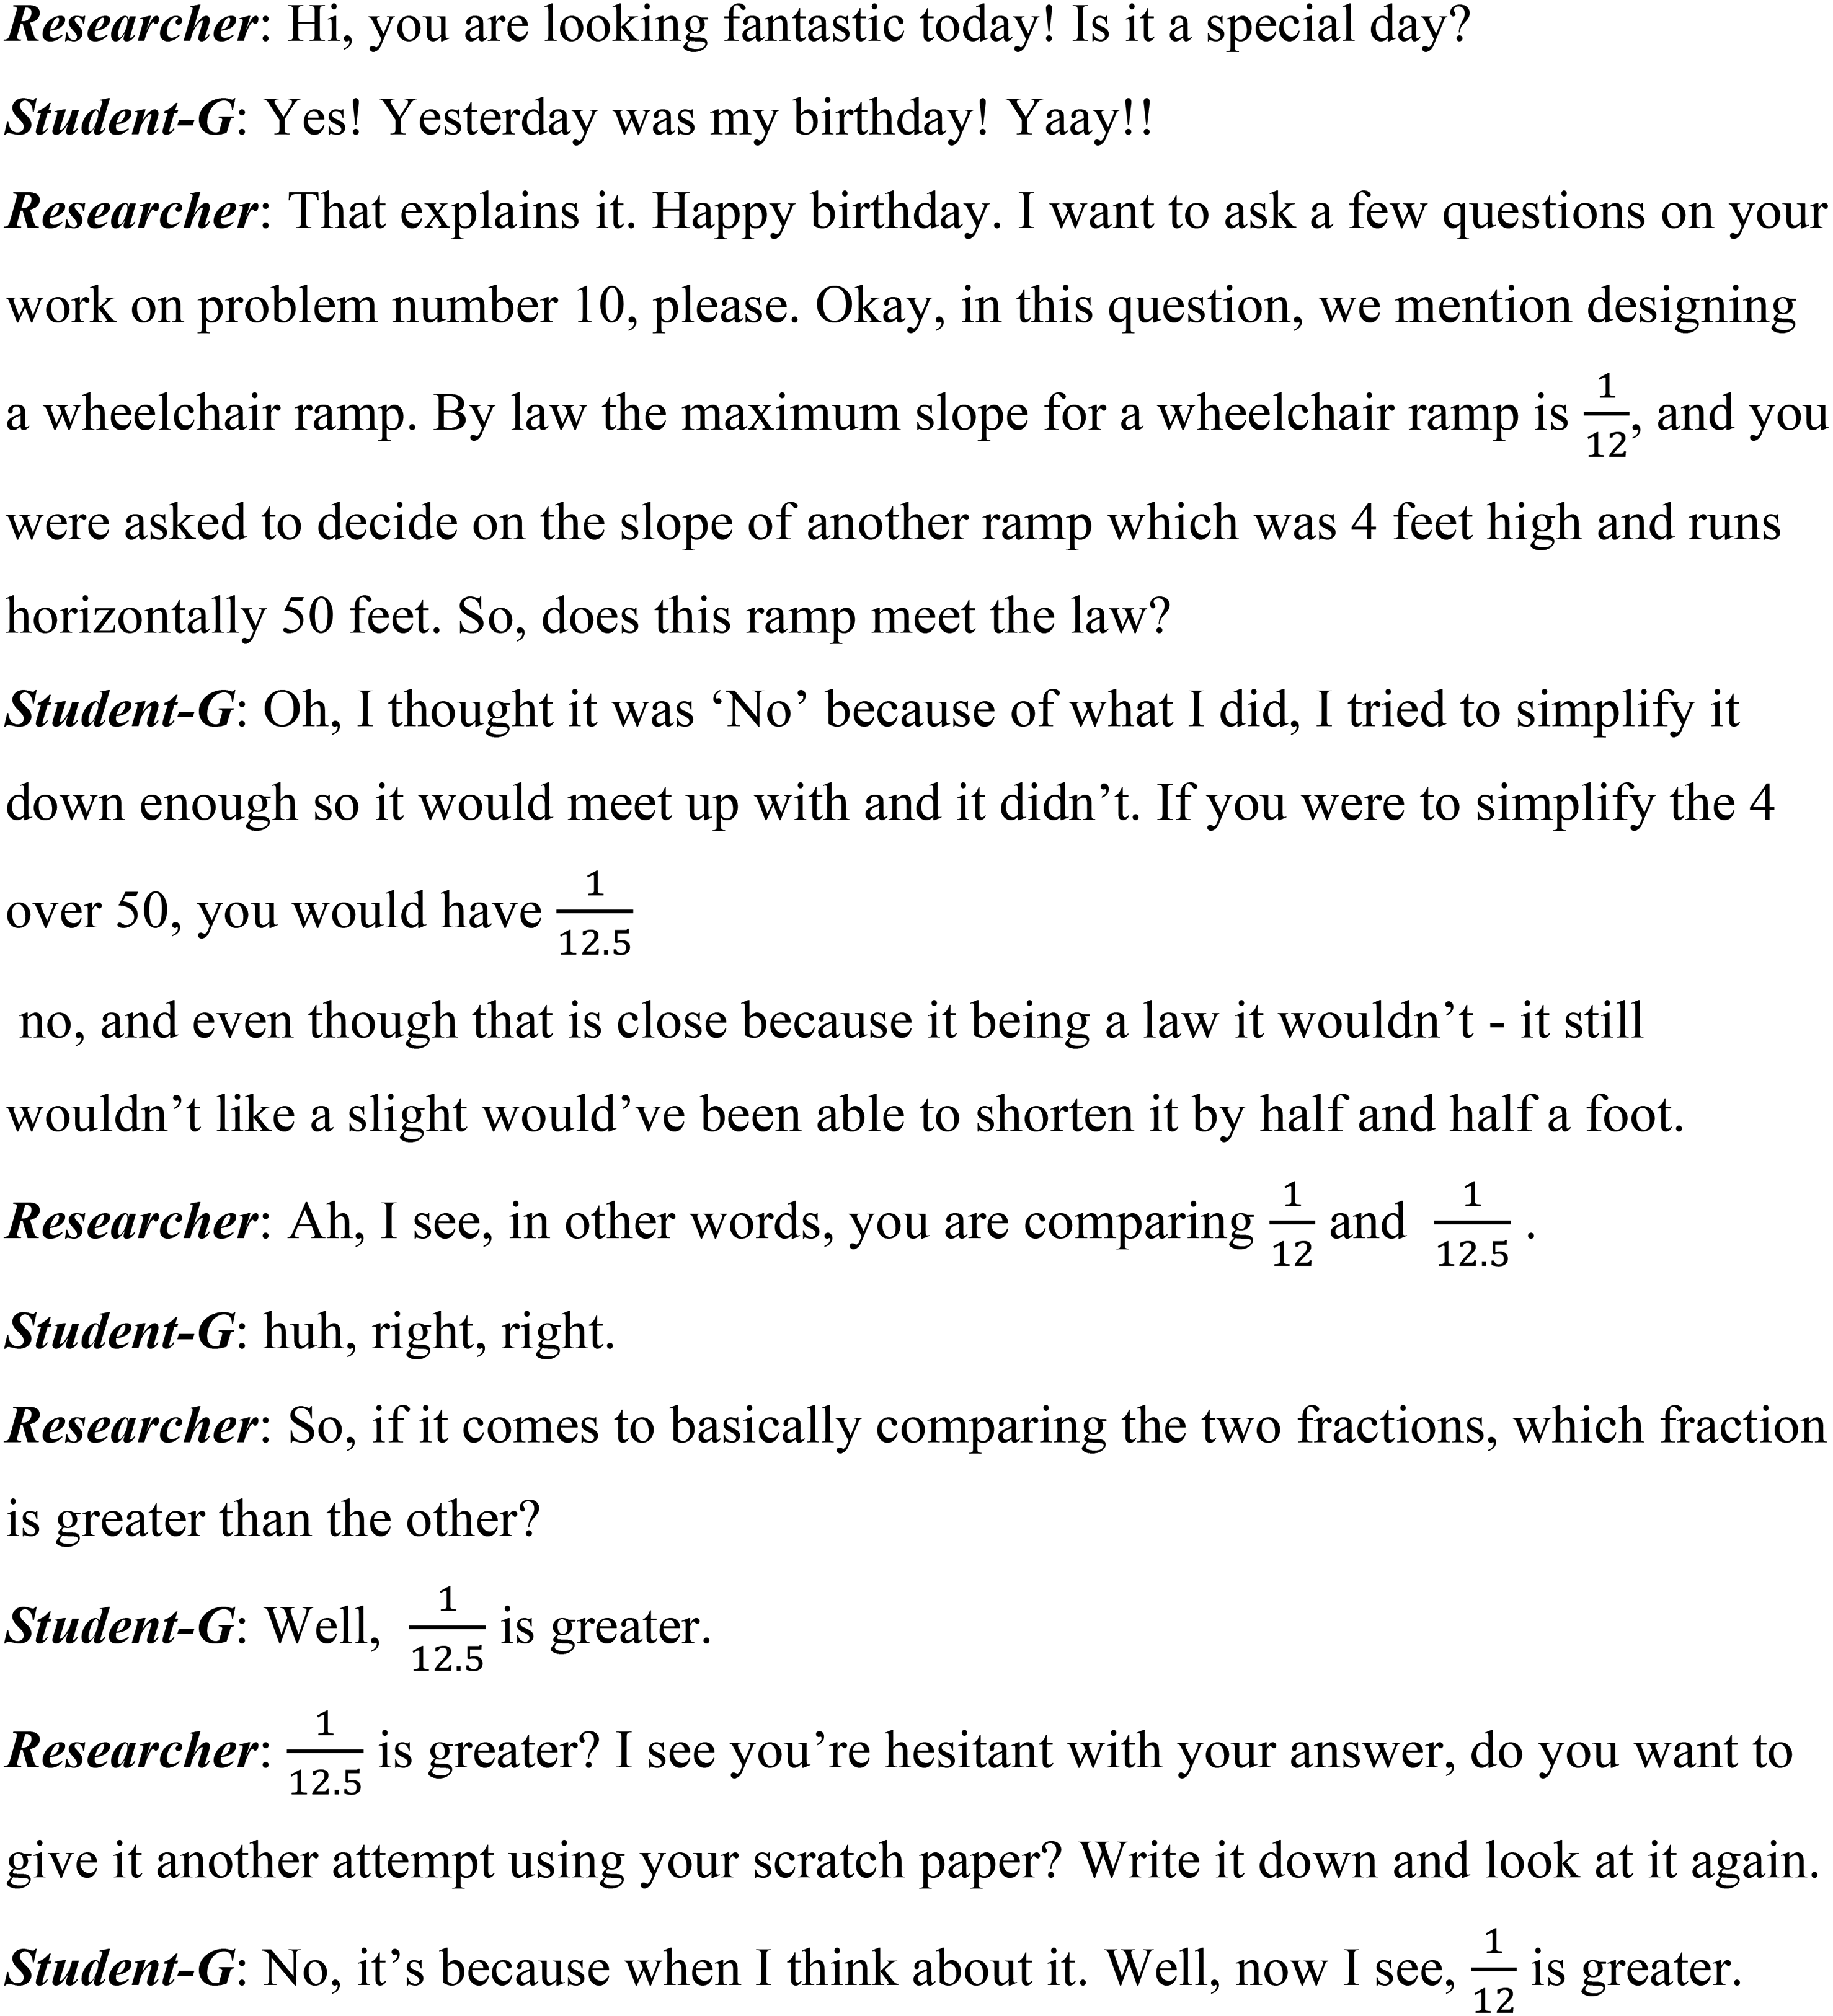
Interview transcript of Student-G for item 10 on the DTRC.
Diagnostic test on rate of change
The data from the DTRC were scored on the scale of 0–26, and analyzed using descriptive statistics - means, standard deviations, quartiles, and interquartile ranges to describe the general performance of the participants, as well as determine if there were differential performance on the DTRC by grade level. To determine if there were significant differences in the mean scores by grade levels, a One-way ANOVA (including Games Howell Pairwise Comparison and a Simultaneous Test for Difference of Means) was conducted.
Written responses and interview data
Students’ written responses to the Short Response items on the DTRC and the interview data were coded for the different strategies used by the students to answer the questions, and the difficulties/misconceptions they demonstrated in answering those questions. Various letter codes were used to identify and classify students’ solution strategies (whether correct or incorrect), understanding, misconceptions, and difficulties on each of the questions. Qualitative constant comparison technique (Creswell, 2013; Merriam, 2009; Miles et al., 2014) was then used to analyze these codes to develop categories and themes related to similarities and differences in participants solution processes, common difficulties, and misconceptions from their work and interview responses. Merriam (2009) defines constant comparative technique as a method that involves comparing one segment of data with another to determine similarities and differences. Miles et al. (2014) state that as new data are constantly compared with previous data, new topological dimensions, as well as new relationships, may be discovered. These dimensions become categories and are given names, with an overriding objective to locate patterns in the data and arrange them in relationship to each other. This method was used to examine the data from the written responses and the interview data.
Results of the study
This study explored high school students’ understanding of rate of change in physical and functional situations involving two covarying quantities, and the nature of difficulties the students exhibit as they reason, represent, and make connections between various representations of rate of change in two covarying situations. The participants’ understanding was measured using DTRC instrument consisting of 13 items on rate of change concepts and was scored on a scale of 0–26. The findings are presented in the succeeding pages:
What is the nature of students’ understanding of rate of change
The general performance for the entire group of students was poor (irrespective of grade level). The mean score for all the 99 participants was 7.92 (or approximatetely 30%), with a standard deviation of 4.33. Four students received a total score of 0 on the assessment. Two of these students did not answer any of the 13 items on the DTRC. The other two students who also received 0 answered every single question incorrectly. The highest score obtained on the DTRC was 20 points out of 26 points (approximately 77%). This score was achieved by only one student in Grade 12 who was enrolled in AP-Calculus. Figure 8 presents a boxplot of the distribution of total scores on the DTRC from all the participants in the study. The distribution is right skewed with a median score of 5 and an inter-quartile range of 6. The middle 50% of the scores ranged from 3 to 9. About 80% of the participants scored lower than 10 points (below 40%) on the DTRC. From the boxplot, there appear to be two outlier scores (19—scored by a student in grade 9, and 20—scored by a student in grade 12).
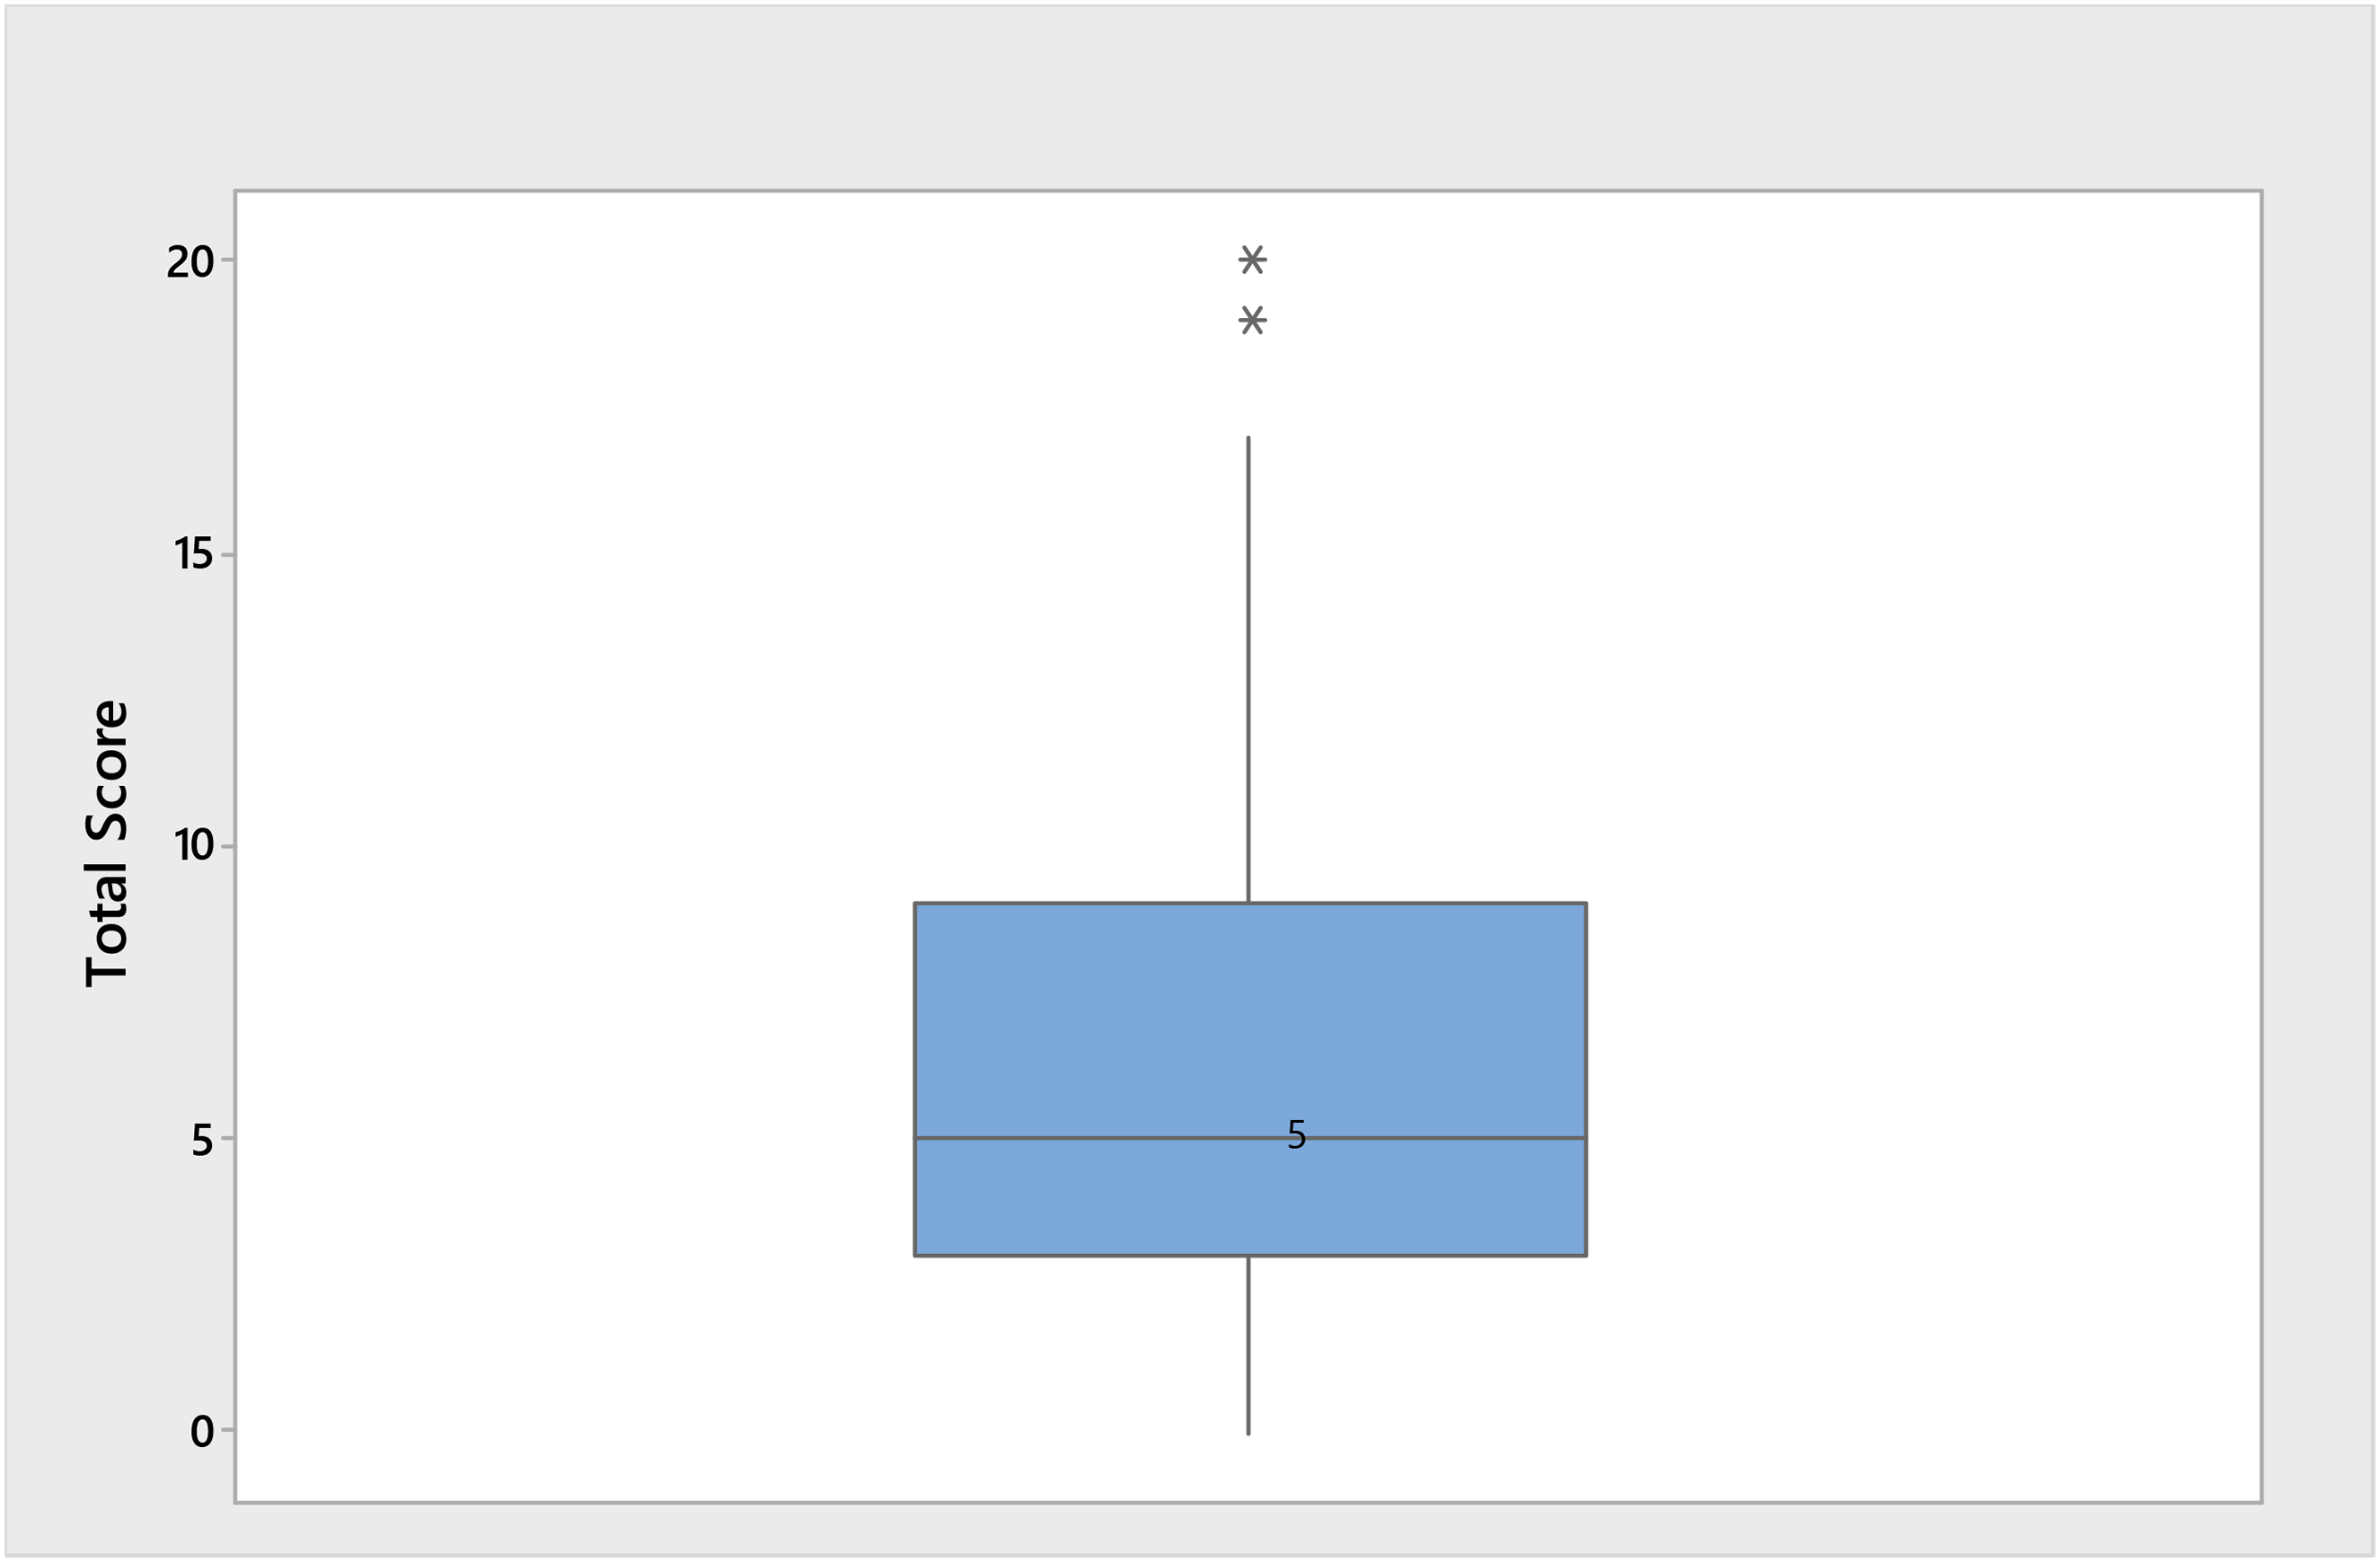
Boxplot distribution of total scores on the DTRC.
Figure 9 presents the general performance on each of the 13 items on the DTRC. As can be seen in the figure, with the exception of item 3, performance on all other items was poor across all the 13 items for the entire group. More specifically, item 3 was the only item on the DTRC that had more students scoring clear understanding “2” than no understanding “0”. In 7 out of the 13 items, more than 50% of the participants scored “0”, with some of the items having over 90% of the participants scoring 0 (e.g., items 12 & 13). In Figure 9, the red bars represent “0” or no understanding, the yellow bars represent “1” or partial understanding, and the green bars represent “2” or clear understanding.
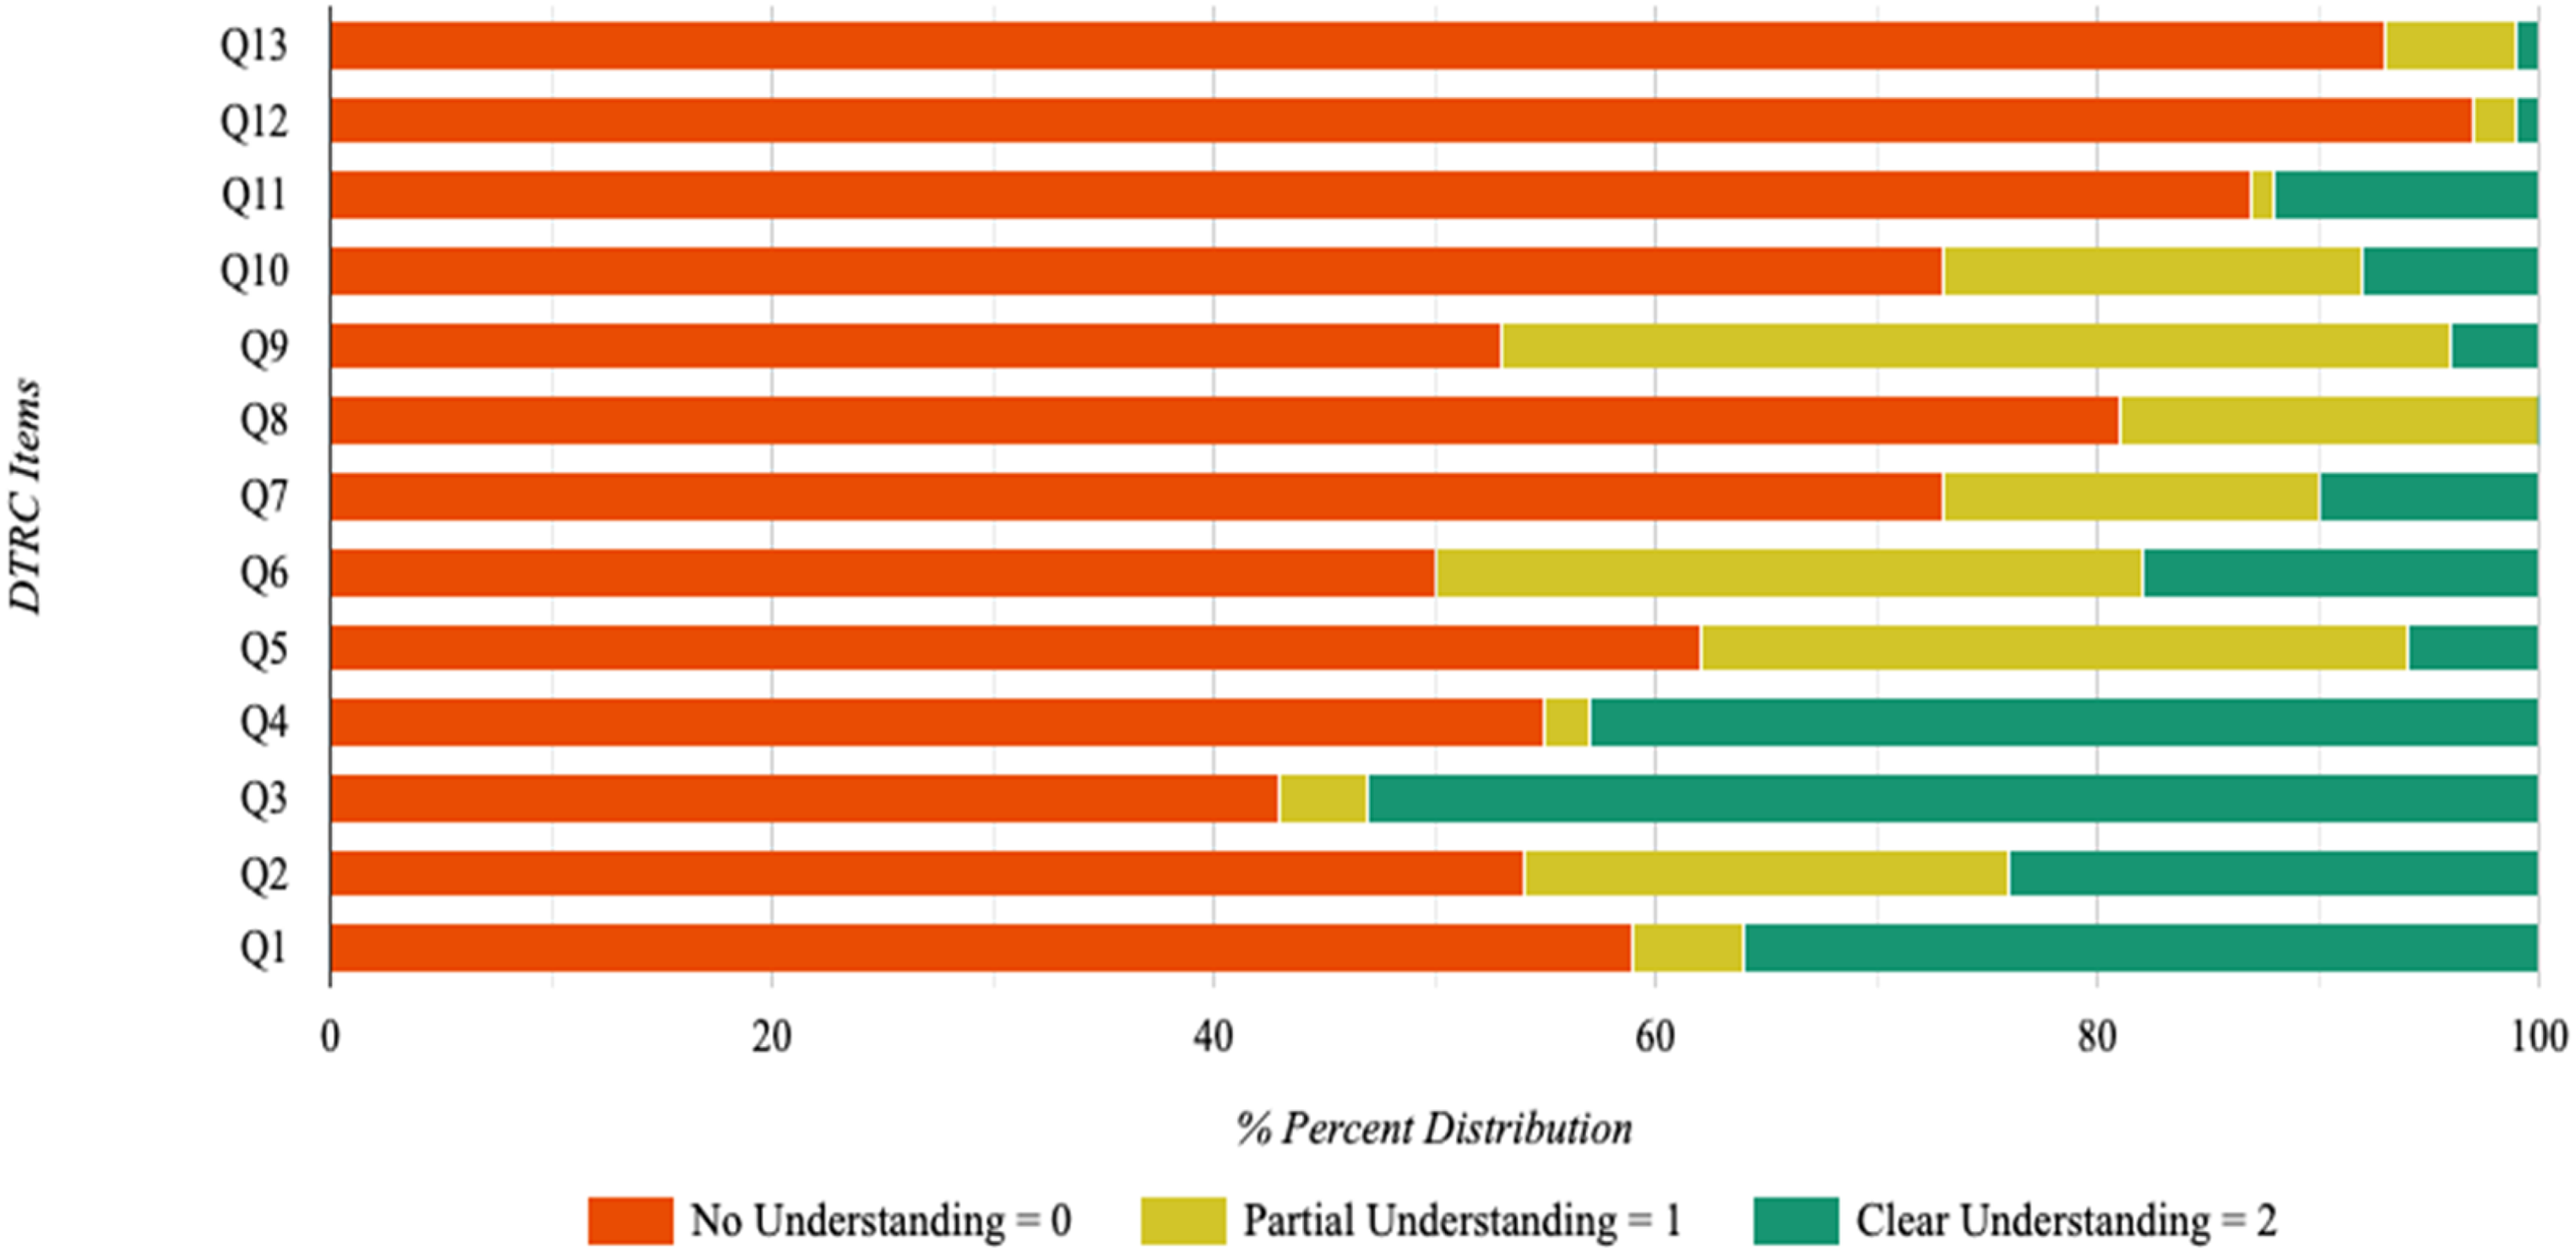
Performance on each item on the DTRC by the entire students.
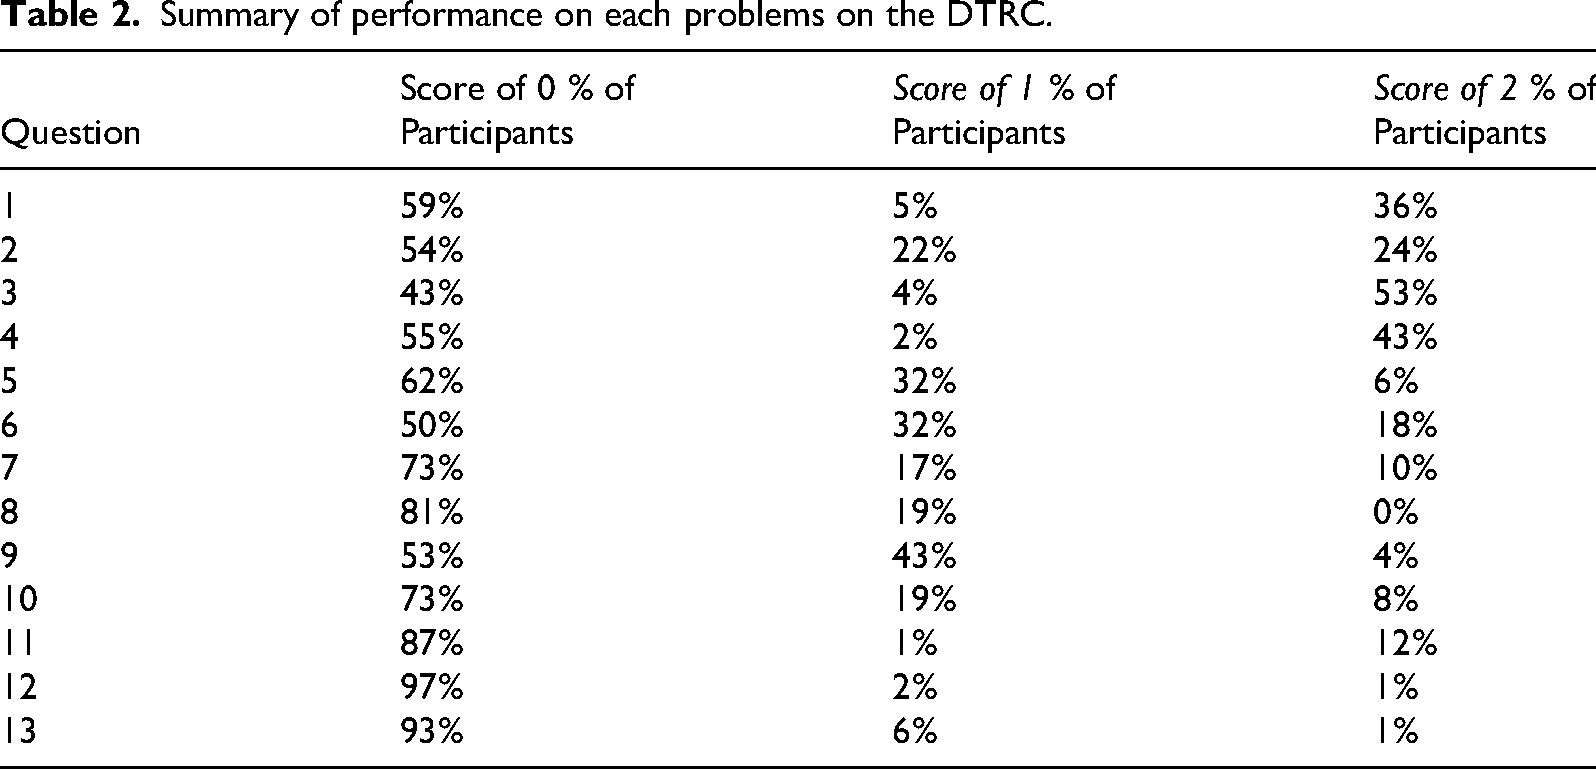
Analyses of performance on each item by score categories revealed that the proportion of students achieving clear understanding (a score of 2) was highest for items 3 and 4, followed by items 1, 2 and 6. The proportion of students achieving partial understanding (a score of 1) was highest for item 9, followed by items 5 and 6. Items 7, 8, 10, 11, 12, and 13 were the most challenging and most missed by the participants on the DTRC. Table 2 shows the summary of the actual percentages of the participants who scored 0, 1, or 2 on each of the 13 items on the DTRC.
Summary of performance on each problems on the DTRC.
Based on the results from these analyses, it can be reported that the nature of these students’ understanding of rate of change involving two covarying quantities was weak in general, particularly on items that require students to determine average rate of change (e.g., item 11), instantaneous rate of change (e.g., item 12), matching table values with function types (e.g., item 8), and on those items that require them to write equations to model rate of change situations involving two covarying quantities (e.g., item 13).
The parallel boxplots in Figure 10 present a comparative distribution of the total scores across all 13 items on the DTRC by grade level. As can be seen from the display, the mean performance of grades 9, 10, and 11 students appears similar, but is slightly lower than the mean performance of grade 12 students.
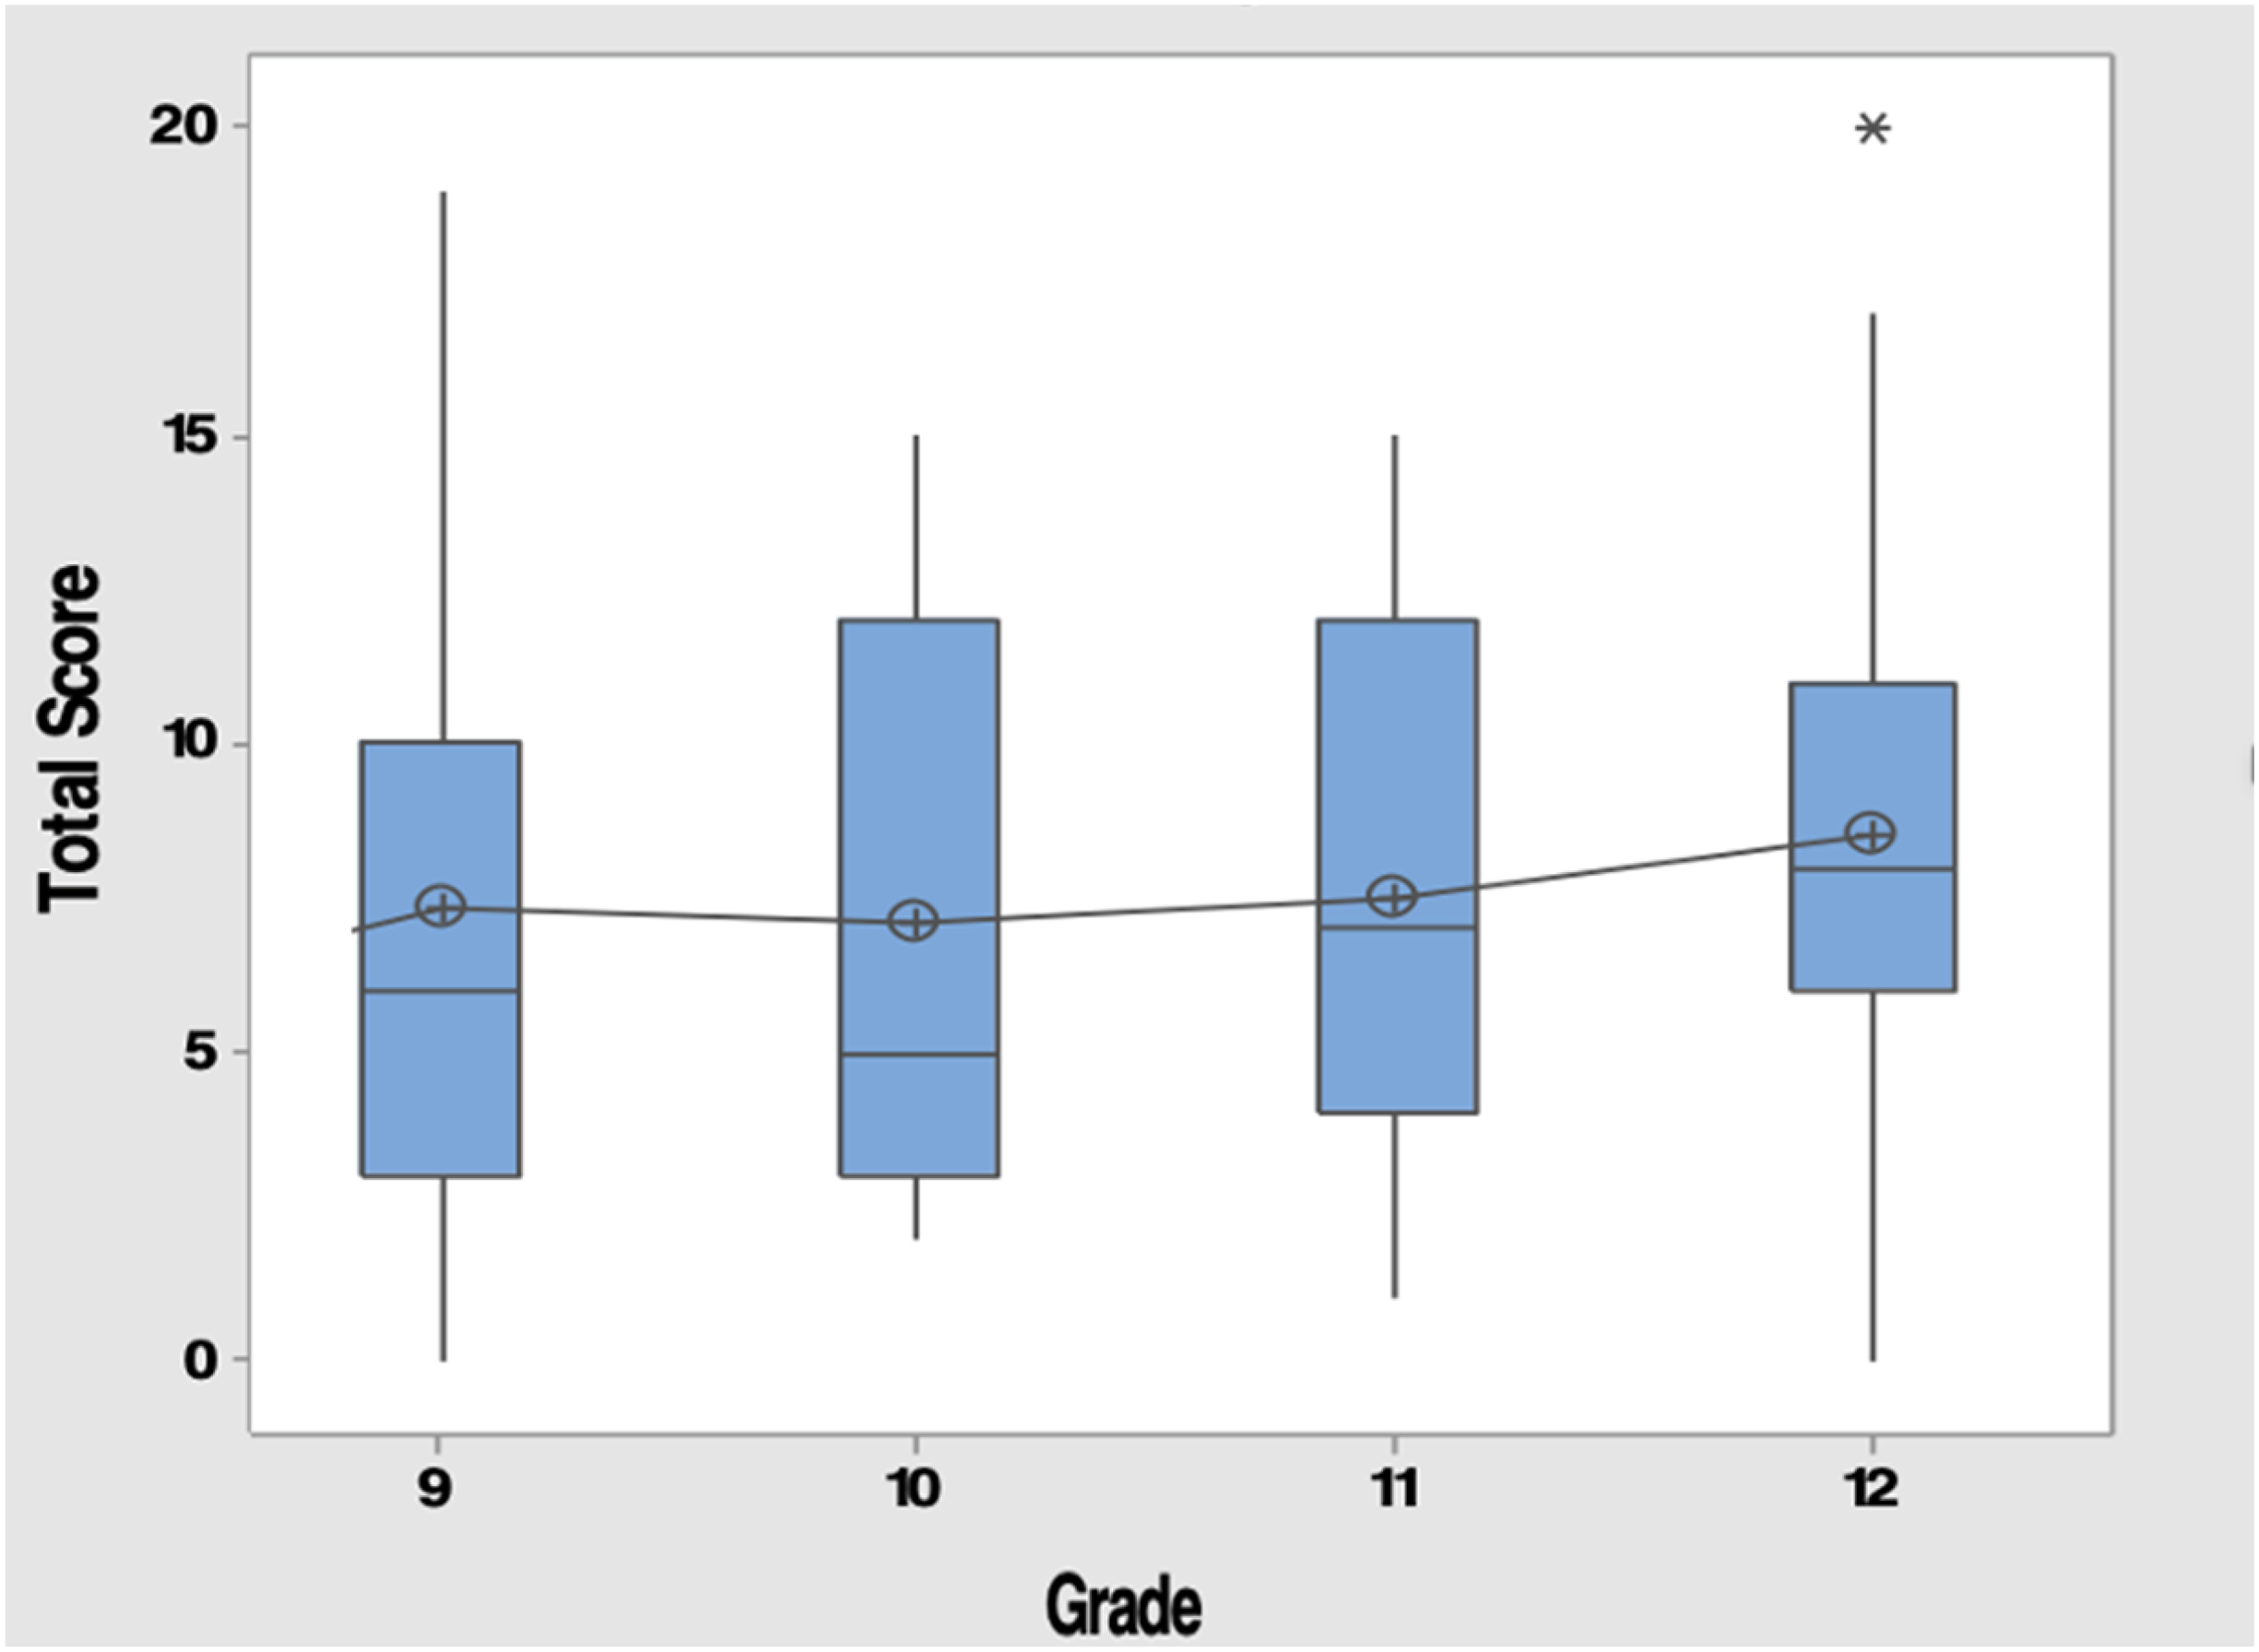
Comparative distribution of the score on the DTRC by grade.
Table 3 presents the sample sizes (N), means (M), standard deviations (SD), minimum (Min.), and maximum (Max.) scores on the DTRC by grade level. The lowest score on the assessment “0” came from students in grades 9 and 12. No students in grades 10 and 11 scored 0 on the assessment. The highest score on the assessment was 20 and was obtained by a student in grade 12.
Mean and standard deviation of participants’ score on the DTRC.
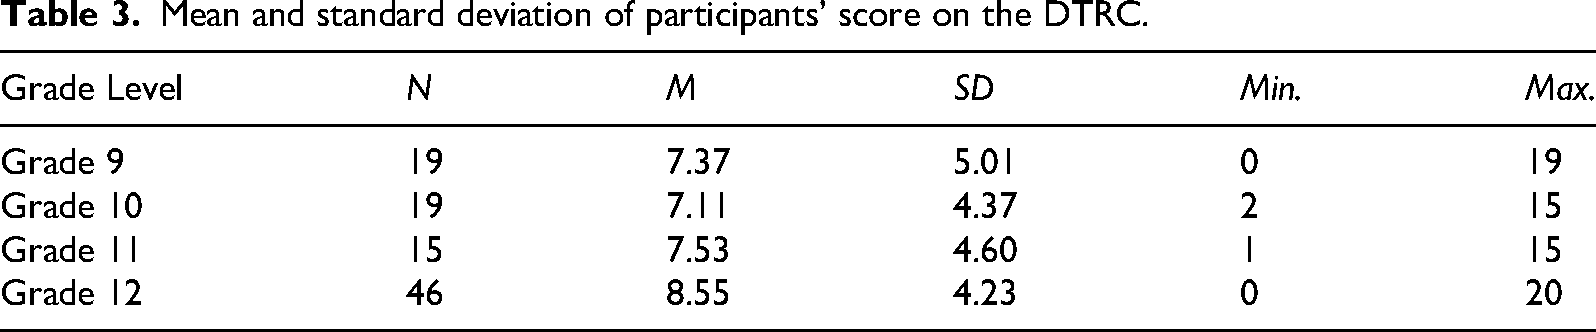
A cursory examination of the data in the table revealed that Grade 10 students have the lowest mean score, while Grade 12 students have the highest mean score on DTRC. To determine if the observed differences in performance by the different grade levels were statistically significant, a One-way ANOVA (including Games Howell Pairwise Comparison and a Simultaneous Test for Difference of Means) was conducted. The analyses showed no significant difference among the performance of the participants by grades (F(3, 95) = 2.94, p = 0.073), indicating that the students’ performance on the DTRC did not vary significantly across grades 9, 10, 11, and 12. When analyzed item by item, there were a few items (e.g., items 1, 5, 6 and 8) where grade 12 students demonstrated superior understanding compared to grades 9, 10, and 11 students. However, this might be largely due to their increased exposure to those concepts by virtue of completing more advanced mathematics courses, and consequently, having more mature mathematical thought processes than those in the lower grade levels. For example, item 8 requires students to connect relationships in table of values to linear functions, exponential functions, quadratic functions, and direct variations. While none of the participants in the entire group demonstrated clear understanding on this question, the few who demonstrated partial understanding (scored 1) were all from grade 12. This might be due to their exposure to these concepts in their AP-Calculus and Dual Credit Algebra courses, unlike students from the lower grade levels (i.e., Grades 9, 10, and 11) who had not yet been introduced to these concepts.
Student difficulties and misconceptions with rate of change were identified from their work on the DTRC assessment, and from the interview transcripts. The data revealed that students had difficulty computing unit rates in contextual problems, particularly when using multiple representations within one problem (e.g., item 6). One of the prominent errors seen in students’ work was the reverse rate error. Some of the participants did not pay attention to the order of units in the rate required in a relationship (Muzangwa & Chifamba, 2010). To find unit rates from graphs, for example, the participants either were not able to select appropriate points to confirm the rate of change or made errors in reading the scale (Zaslavsky et al., 2002). Additionally, the participants had difficulty when information was presented in a tabular form and they were asked to identify a constant rate relationship from more than one pair of variables (e.g., item 4), or as a graph and they were asked to find the average rate of change (e.g., item #11). Most of the students could not estimate average rate of change from the graph of a non-linear function, especially when the scales were not homogenous on both axes. The majority of them understood average rate as the computation process of arithmetic average.
Several students did not understand the ratio aspect of slope as a quotient of change in y over change in x, were unable to identify slope as a coefficient of the independent variable in slope-intercept form of the equation or could not relate to slope in real-world application as a measure of steepness to be computed as a ratio of the dependent variable to the independent variable. Students had difficulty matching data tables to the function types in the absence of a graphing calculator. In fact, on item 8 on the DTRC, no student got a score of 2. Similarly, on item #13, which required students to compute unit rate from a contextual problem and then use it to write an equation that models the situation, only one student answered it correctly. Three other students who computed the unit rate correctly from the data were not able to use their computed rate per square foot to write an equation that models the data.
Overall, there was no significant variation in performance across grade levels. This was unexpected, as we anticipated that the upper classmen (i.e., grades 11 and 12) would perform better than those from the lower grade levels (i.e., grades 9 and 10) by virtue of having completed more courses that involve the ideas of rate of change (i.e., Precalculus, AP-Calculus, and Dual Credit-College Algebra) than their junior peers. When examined closely by grade level, the data revealed that the same misconceptions and difficulties were observed at each grade level. For example, students written solutions and the interview data suggest that the majority of the students from all grade levels struggled with the covariational relationships involved in most of the questions.
Summary and discussion of the results
This study explored high school students’ understanding of rate of change in physical and functional situations involving two covarying quantities, the nature of students’ conceptions and difficulties with rate of change, and how students’ understandings of this concept evolve across grade levels. In general, the results of the study showed that the students' understanding of rate of change was weak. Specific students’ difficulties identified include students’ inability to compute unit rate in contextual problems, difficulty identifying rate of change when information is presented graphically, problems calculating/estimating average rate of change from graphs of non-linear functions (especially, when the scales were not homogeneous on both axes), difficulties identifying constant rate relationships from more than one pair of variables, and challenges matching data tables to function types. Additional students’ struggles were observed in their inability to identify slope from an equation or estimate instantaneous rate of change from table of values of average rate of change. Most significantly, in solving many of the tasks in this study, while students recognized that the two quantities values in the problems have changed, they could not conceive of this change as varying together simultaneously, or in a covariational manner.
Prior studies have documented several difficulties students have with rate of change, including students’ inability to perform basic calculation of a rate of change from a graph (Gravemeijer & Doorman, 1999; Herbert, 2013; Orton, 1983), difficulty interpreting the rate of change in non-linear functional situations, and inability to transfer their understanding of rates of change from motion contexts to non-motion contexts (e.g., Herbert & Pierce, 2008, 2011; Ibrahim & Rebello, 2012), and difficulty making connections among the rate of change, slope, and difference quotient (Byerley & Thompson, 2017; Herbert & Pierce, 2008; Teuscher & Reys, 2012), among others. The difficulties and misconceptions identified in the current study were similar to those reported in many of the aforementioned reports.
Generally, our findings suggest that the majority of the students in this study have not yet developed the conception of rate of change as a multiplicative comparison between changes in two quantities’ values (Carlson et al., 2002; Confrey & Smith, 1994, 1995; Yu, 2024), or at best, these students were operating at the initial stages of understanding covariational reasoning as it relates to rate of change (Johnson, 2012, 2015a, 2015b; Kertil et al., 2019; Thompson & Carlson, 2017; Yu, 2024). In most of the problems, the students computed rate of change by additively comparing the changes in the output variable with respect to equal increments in the input variable (Byerley et al., 2012; Rasmussen & Marrongelle, 2006) - with several accompanying errors, even in employing this conception of rate of change. As pointed out by Castillo-Garsow (2010) and Thompson and Carlson (2017), this “chunky” way of engaging with rate of change situations is not robust enough to help students build a mature meaning of rate of change because it excludes the more advanced aspects such as the ratio-based approach or the covariational reasoning notions of rate of change needed for understading many concepts in functions and calculus (Johnson, 2012; Thompson & Carlson, 2017).
When examined across grade levels, our results revealed that the nature of students' understanding of rate of change involving two covarying quantities did not vary across grade levels, nor did it build positively in a manner that could lead them to develop a robust facility with rate of change by the end of Precalculus. Students’ difficulties with rate of change concepts persisted across grade levels with no consistent pattern or trend of progression from one grade level to the next. On a few of the items on the assessment (e.g., items 1, 5, 6 and 8), students from grade 12 outperformed students from grades 9, 10 and 11. However, this may be due to their increased exposure to the concepts by virtue of completing more advanced mathematics courses than those students in the lower grade levels. Thus, based on the performance data, participants who had successfully completed Algebra II and were enrolled in Precalculus at the time of the study (as well as those who had completed Precalculus and were enrolled in AP- Calculus) in Grades 11 and 12 do not seem to be on track to meet the NCTM's (2000) recommendation that students develop the ability to analyze patterns of change in various contexts as well as represent changes in quantities and situations involving covariational reasoning, mathematically.
Conclusions, implications, and limitations
In all, the results of our study indicated that this group of grades 9–12 students’ understanding of rates of change in physical and functional situations involving two covarying quantities was weak, given the individual and mean scores of the participants on the DTRC (e.g., the mean score of 7.92 points out of 26 points, which is approximately 30%). The students had difficulties determining average rate of change, instantaneous rate of change, matching table values with function types, and writing equations that model rate of change situations involving two covarying quantities. Additionally, the participants’ performance did not vary significantly across grade levels.
Although some of our results confirmed findings from prior studies regarding students’ understanding and difficulties with rate of change, two distinguishing features of our study were (a) its examination of how students’ understanding of rate of change involving two covarying quantities evolves across grade levels, and, consequently, (b) whether this understanding leads students to develop a robust mathematical structure of functions by the end of Precalculus. Overall, the results of this study were not positive in these respects—that is, students at different grade levels exhibited the same level of difficulty with the concept of rate of change. In other words, students’ difficulties persisted across grade levels with no consistent pattern or trend of progression from one grade level to the other. Moreover, the main culprit was their struggle with the covariational relationships in most of the questions.
These results also suggest that the students’ understanding of this concept did not build consistently in a manner that could lead them to develop a solid mathematical structure of functions by the end of Precalculus. This could be due to the fact that the students in this study did not have ample opportunities in their classrooms to explore the kind of items that were on the DTRC, which focused mainly on covariational reasoning aspects of rate of change. An important implication of this study, therefore, is for teachers to carefully select instructional tasks for their teaching that allow students to explore rates of change involving two covarying quantities within meaningful real-world contexts. This instructional intervention will provide the necessary experience for students to develop covariational reasoning and to have a more robust understanding of rate of change, and other topics such as functions, calculus, and applications of mathematics to real-world situations in general.
A limitation of this study is that the student demographics in this study are not representative of the majority of the students in public high schools across the United States. Consequently, the results may only be considered in light of the demographic characteristics of the population in the study (i.e., 44% of the students were in advanced mathematics courses and about 56% of the students were at their grade level). For the reasons mentioned above, the findings cannot be generalized beyond this population of students and the educational context within which the study was framed. For future studies on this topic, we recommend using the DTRC instrument (or a similar instrument) and procedures with a greater cross-section of students that accounts for more variability in participant's intellectual and socio-economic status to obtain more comprehensive results that will allow for generalization. A longitudinal study involving students and teachers could provide some across-the-board information on how students’ understanding of rate of change develops over time and on teachers’ perceptions of their students’ difficulties with rate of change.
Footnotes
Informed Consent
All the participating teachers in this study were provided with informed consent documentation and they signed it prior to their involvement in the study. Consents were also obtained from the parents of the participating students since these students were minors, and thus, not capable of giving consents by themselves.
Contributorship
Pragati Bannerjee identified the research problem, conducted the initial literature review, designed the data collection tool, collected and analyzed the original data, and wrote the initial draft of the manuscript with guidance from James Dogbey and Faye Bruun. James Dogbey and Faye Bruun contributed further to the writing and revisions of the manuscript. All three authors read, revised, and approved the final manuscript.
Funding
The authors received no financial support for the research, authorship, and/or publication of this article.
Declaration of Conflicting Interests
The authors declared no potential conflicts of interest with respect to the research, authorship, and/or publication of this article.