
Abstract
The present comparative analysis study conducted an examination of 46 U.S. and 30 South Korean elementary preservice teachers (PSTs), assessing their overall performances and comparing problem-solving strategies across 11 fraction multiplication and division problems. The tasks spanned across three domains: posing story problems, solving word problems, and illustrating visual models. This study’s purpose is to relay common misconceptions held by elementary PSTs regarding fraction multiplication and division between the U.S. and South Korea. The overall performance results indicated that South Korean PSTs demonstrated higher proficiency in all three areas (i.e., posing story problems, solving word problems, and illustrating visual models). However, both groups of U.S. and South Korean PSTs encountered the most difficulty in representing visual models. Strategy analysis highlighted that the application of properties of multiplication and clearer representation of the unit were key factors contributing to the success of South Korean PSTs. Such results contribute to the growing literature supporting the importance of elementary PSTs’ influence on students to develop necessary foundational skills in mathematics. The study also discusses implications for teacher educators based on these findings.
Keywords
Introduction
Cross national comparative studies in the teaching and learning of mathematics provide unique opportunities to gain insights into students’ mathematical thinking and how to improve them (Cai, 2000). This study examined U.S. and South Korean elementary preservice teachers’ (PSTs) understanding and problem-solving strategies in the context of multiplication and division of fractions. South Korea is among the best East Asian countries to demonstrate a profound grasp of fractions when compared to counterparts in the United States (Mullis et al., 2012), hence, why South Korea was chosen for this comparative analysis study. Mullis et al. (2012) also reported that students from Hong Kong, Singapore, Korea, and Taiwan outperformed their American counterparts, which was exemplified by Trends in International Mathematics and Science Study data from 2011. Additionally, through a comparative study between Chinese and U.S. teachers, Ma (1999) indicated that Chinese elementary teachers demonstrated deeper understanding of division of fractions. Similarly, Lo and Luo (2012) noted that Taiwanese elementary PSTs exhibit a deeper comprehension of fraction division compared to their American counterparts. However, there has been a dearth of research relating to comparative studies between South Korea and the U.S., particularly concerning fraction understanding. This study aims to offer insight into supporting PSTs in enhancing their comprehension of fraction division and multiplication concepts.
The focus on fraction multiplication and division stems from extensive research studies highlighting elementary teachers’ limited knowledge of fractions (Ball, 1990; Ma, 1999; Park et al., 2013). These deficiencies persist among both preservice and in-service teachers (Ma, 1999). Within the spectrum of fraction concepts, fraction multiplication and division were identified as the least understood topic in elementary school mathematics (Izsák, 2008; Tirosh, 2000). Regarding this topic, a great deal of research continuously highlights the deficiency in conceptual understanding among PSTs. One notable area of struggle is the challenge in connecting the correct application of fraction operations to fraction word problems (Graeber et al., 1989; Ma, 1999; Seaman & Szydlik, 2007; Tirosh, 2000). Such studies indicated that when asked to write an equation based on word problems involving multiplication or division of fractions, PSTs tended to introduce incorrect operations, which highlights the difficulty of linking the two aspects. Another research strand investigated PSTs’ conceptual knowledge of fraction multiplication and division in terms of its multiple representations (i.e., pictorial illustration, graphical representation using an area model, linear models, part–whole model, etc.) and identified a common struggle between PSTs relating to difficulty when visually representing the fractions, particularly in the context of fraction multiplication or division (Adu-Gyamfi et al., 2019; Izsák, 2008; Lee et al., 2012; Lee & Lee, 2021; Luo et al., 2011; Son & Lee, 2016). Despite the abundance of related studies, a series of questions persists, demanding researchers’ attention. For instance, how PSTs’ conceptual understanding fraction multiplication and division compare to their counterparts in mathematically high-performing countries like Korea? What do successful strategies relating to fraction multiplication and division look like in the two countries? Do PSTs in both countries encounter similar challenges when confronted with fraction multiplication or division problems?
The present study examines the similarities and differences in problem-solving strategies and mathematical thinking between PSTs from the U.S. and South Korea. Additionally, the study aims to identify the contributing factors to successful performances of fraction multiplication and division problems as to better support PSTs in their conceptual understanding. The present study poses the research questions as follows:
How did PSTs from the U.S. and South Korea perform on solving fraction multiplication and division problems in problems relating to posing story problems, solving word problems, and illustrating visual models? What strategies/concepts did the U.S. and South Korean PSTs use when solving fraction multiplication and division problems and how do these strategies compare to each other?
Literature review
Literature review
To gain a comprehensive understanding of PSTs’ knowledge in this domain, three contexts were implemented for both fraction multiplication and division regarding PSTs’ difficulties: posing problems, solving real-world application problems, and conceptual understanding with visual representations. PSTs’ difficulties with fraction multiplication and division related to problem posing, problem-solving, and using representations have resulted in limited opportunities for students to master fraction-related content (Son & Lee, 2016). The rationale for these contexts is threefold: (1) posing story problems plays a pivotal role in establishing connections between real-life situations and operations with fractions (Adu-Gyamfi et al., 2019); (2) solving real-world fraction problems is crucial, as it helps build a strong foundation for understanding fractions and imparts meaning to the division of fractions for students (Kent et al., 2015); (3) establishing connections among stories and diagrams in problems involving fractions is important, as symbolization helps students make sense of fraction operations (Cengiz & Rathouz, 2011). Additionally, the essential role of real-world contexts and visual representations in teaching fractions is outlined in policy documents by the National Council of Teachers of Mathematics (NCTM, 2014) and the Common Core State Standards Initiatives (National Governors Association Center for Best Practices & Council of Chief State School Officers, 2010). This literature review also aims to highlight common misconceptions held by PSTs in the context of problem posing in fraction multiplication and division, problem-solving of fraction multiplication and division, and conceptual understanding related to visual representation in fraction multiplication and division.
PSTs’ difficulties with problem posing in fraction multiplication and division: Posing story problems
Although Jong and Magruder (2014) found that creating fraction multiplication and division story problems enhances conceptual understanding for both students and educators, Kalder (2007) noted that many PSTs struggle to develop such problems, particularly for concepts like dividing 3 ¾ by ½. Similarly, Jong and Magruder (2014) found that PSTs struggled to write appropriate problem-posing equations; this inadequacy hinders their ability to facilitate the learning of challenging mathematics topics. Furthermore, Kang (2022) noted that when PSTs demonstrate a greater understanding of problem-posing in fraction multiplication and division, misconceptions among students and teachers are reduced. Cengiz and Rathouz (2011) explained that many PSTs do not grasp that multiplying by a unit fraction (i.e., ½) is equivalent to dividing by its whole-number reciprocal (i.e., 2), suggesting that these difficulties hinder effective teaching and learning in fractions.
Strategies for problem posing in fraction multiplication and division: Posing story problems
In order to address the common misconceptions and difficulties regarding PSTs and problem posing in fraction multiplication and division, Kang (2022) suggested that PSTs practice with fraction story problems that include various numbers and building fractional number sense. Similarly, Yao et al. (2021) advocated for PSTs to gain a greater conceptual understanding of problem-posing in fraction multiplication and division to teach students the proper methods for solving fractional equations more accurately. Taber (2006) found that creating story problems related to familiar movies or children's books, like Alice's Adventures in Wonderland, provides an opportunity to help students better understand the multiplication of fractions by connecting with their background knowledge. Both Kalder (2007) and Newton (2008) demonstrated that creating story problems allows teachers and students more opportunities to elaborate on their work and find multiple ways of solving the same problem. Working on fraction multiplication and division problems in different ways (i.e., via story problems) allows the understanding of fractions to evolve and addresses the National Council of Teachers of Mathematics (NCTM, 2000) Principles and Standards, which state that students in grades 3–5 should “develop an understanding of fractions as parts of unit wholes, as parts of a collection, as locations on number lines, and as divisions of whole numbers” (p. 148). Furthermore, Alexander and Ambrose (2010) noted that prompting students to independently author original story problems for expressions or equations allows teachers to assess their students’ levels of mathematical understanding. Utilizing story problems lays a foundation for elementary students to fulfill the prerequisites needed to work with fractions in their later academic careers.
PSTs’ difficulties with problem-solving of fraction multiplication and division: Solving word problems
Jong and Magruder (2014, p. 372) noted, “it is also critical that teachers expose students to a wide variety of contexts that are appropriate for division, reaching beyond food—especially beyond cookies—to help students make more connections and think flexibly.” If preservice and licensed teachers are unable to model connections and flexible thinking when problem-solving fraction multiplication and division, student understanding is hindered. Jong and Magruder (2014) argued that for students to develop a deeper conceptual understanding, there must be more opportunities for real-world application problems as well. Similarly, Son and Lee (2016) suggested that the computation of real-world application problems is necessary to address PSTs’ misconceptions regarding problem-solving with fraction multiplication and division. In their 2016 study, Son and Lee discovered that PSTs struggled to correctly answer computational-based fraction multiplication and division problems, attributing this largely to PSTs’ limited understanding of what it means to multiply or divide a fraction. Adu-Gyamfi et al. (2019) and Kang (2022) both acknowledged that for PSTs to solve fraction multiplication and division problems accurately and later teach students to do the same, there must be a foundation of conceptual understanding, not just computational competency. Furthermore, Han et al. (2011) acknowledged “how well textbooks reflect real application situations is closely related to how students are able to connect learning to their lives” (p. 130). PSTs tend to struggle with understanding what a procedure (i.e., multiplication or division) means when applied to a fraction and why the procedure would be used.
Strategies for problem-solving in fraction multiplication and division: Solving word problems
The different conceptualizations and strategies of fraction division (i.e., equal grouping and equal sharing) have been explored in multiple research studies (Ball, 1990; Lee, 2017; Lo & Luo, 2012; Ma, 1999; Van de Walle et al., 2019) and provide examples of how teachers and students can solve real-world application problems. For example, Van de Walle et al. (2019) posed the scenario of dividing and measuring bags of rocks by asking how many times 2 goes into the fraction ⅔. Creating real-world application scenarios, such as the one provided by Van de Walle et al. (2019), allows students to understand unit and unitizing, which is essential for building a conceptual understanding of both fraction division and multiplication (Lee, 2017; Lo & Luo, 2012). Furthermore, when discussing fraction multiplication, Bezuk and Armstrong (1992) noted that students who can construct a sense of meaning for the multiplication of fractions can more easily understand operations specifically related to rational numbers, whole numbers, and number sense. Bezuk and Armstrong (1992) also indicated that “[real-world problem contexts] promote meaning for the operations on rational numbers rather than the application of rote procedures… Real-world problem situations help build meaning for these ideas” (p. 729). Likewise, Khairunnisak et al. (2012) found that students who only understand the rules for multiplying fractions without comprehending the real-world context behind the mathematical equation are less likely to interpret such equations as a basis for problem-solving. Regardless of whether the equation involves fraction division or multiplication, real-world application problems have been found to deepen both PSTs’ and students’ conceptual understanding, number sense, and number operations.
PSTs’ difficulties with conceptual understanding of fraction multiplication and division: Utilizing visual representations
Lee and Lee (2021) conveyed that PSTs have demonstrated difficulty with visually representing fraction multiplication and division problems. In fact, as many as 11% of PSTs in a study conducted by Son and Lee (2016) failed to provide a correct visual representation for these problems. Additionally, according to Sahin et al. (2020), PSTs’ and licensed teachers’ limited ability to visually represent fractions creates barriers for students learning to understand the concept of fractions. The visual representation of fractions is critical for students, as it provides opportunities to develop a strong understanding of fractions in relation to operations (Cengiz & Rathouz, 2011). Although the Common Core State Standards Initiative (National Governors Association Center for Best Practices & Council of Chief State School Officers, 2010) recognizes the importance of visual representations in aiding students’ understanding of fractions, PSTs’ difficulties in providing accurate and meaningful representations restrict their ability to teach effectively. Lee (2017) indicated that the inability to visually represent fractions prevents students from internalizing and communicating their understanding of the operations and meaning behind fraction multiplication and division.
Strategies for conceptual understanding in fraction multiplication and division: Utilizing visual representations
Research by Cengiz and Rathouz (2011) indicates that visual representations of fractions, such as pie charts and number lines, support comprehension of abstract concepts. Lee (2017) suggested that PSTs should be exposed to various representations of fractions, such as number lines, area models, and set models, to help them understand how to convey these representations effectively to students. Cengiz and Rathouz (2011) emphasized that teacher preparation programs should focus on how PSTs can utilize visual representations in their teaching. By doing so, PSTs will be better equipped to facilitate students’ understanding of fraction multiplication and division operations and the relationships among these operations.
Multiplication of fraction strategies
One of the fundamental components to solving fraction problems is understanding the part–whole relationship, whereas a whole is partitioned into equal parts (m) and each part is encoded as 1 ÷ m; if there are several parts (n) it is represented as n ÷ m or n slices of 1 ÷ m. Students can find this out through repeated addition. For instance, ¾ can be calculated as 3 groups of ¼ (i.e., ¼ + ¼ + ¼). This model representing fraction multiplication can be expanded from repeated addition to include a fractional part of a whole (Son & Lee, 2016). While linking the concept of repeated addition serves as one of the strategies for whole number multiplication of fraction numbers (i.e., 3 × ½), it becomes inappropriate when dealing with fraction × fraction numbers. Van de Walle et al. (2019) explained that students can solve ⅔ × ⅕ using an area model, where ⅔ represents the base of a rectangle and ⅕ represents the height of the rectangle; hence, the overlapping part represents the area of a rectangle. To illustrate the area model, students cut the whole into fifths and shade ⅕ to represent the height of one whole. Then, to find ⅔ of ⅕, students draw three horizontal lines all the way across the square and shade two of them. In this approach, the whole rectangle is divided into equal-sized partitions (i.e., 15 equal-sized boxes) and the double-shaded parts illustrate ⅔ of ⅕. An area model serves as a powerful visual representation for establishing a connection between the standard algorithm of multiplication of fractions and the concept of area. Part–whole relationships, repeated addition, utilizing the referent unit, and the area model of rectangles are all important strategies for successfully solving the multiplication of fractions using a visual representation.
Division of fraction strategies
Many research studies introduce two concepts as strategies for the division of fractions, which include the measurement approach (i.e., fractions as quotients) and the partitive approach (i.e., fractions as equal shares). The different conceptualizations of fraction division have been explored in multiple research studies (Ball, 1990; Lee, 2017; Lo & Luo, 2012; Ma, 1999; Van de Walle et al., 2019). An example of the measurement approach is demonstrated with ¾ ÷ ½ which can be interpreted as determining how many groups of ½ go into ¾ (Van de Walle et al., 2019). As discussed in the section on fraction multiplication, understanding unit and unitizing is essential to build a conceptual understanding of fraction division (Lee, 2017; Lo & Luo, 2012). For example, students need to conceptualize ⅔ as a unit to measure 2 kg of rocks and iterate the unit to measure out how many groups of ⅔ are in the total of 2 kg. However, this approach becomes challenging when the total number is smaller than the unit (i.e., ⅔ ÷ 2, ½ ÷ ¾) as it becomes difficult to conceptualize how many times 2 goes into ⅔. In such cases, students may need to explore different conceptual approaches, and partitive division is one of the ways to address these challenges.
When a division equation such as 10 ÷ 2 is interpreted as a sharing context, meaning that 10 objects are equally distributed among two people, this type of division concept is known as partitive division. Research has shown that the sharing concept is more intuitive than the measurement concept when understanding division (Van de Walle et al., 2019). This is because students often have experiences sharing objects with family or friends and can draw on these experiences to apply the concept to mathematics. The example of ⅔ ÷ 2 can be solved using the partitive concept of division. In this scenario, students can imagine that ⅔ of a pizza is left to be shared between two friends, allowing them to solve for how much of the whole pizza each person will have. This approach tends to be easier for students to grasp compared to thinking about how many times 2 fits into ⅔.
However, the partitive approach may limit conceptual understanding, particularly when the divisor is not a whole number but a fraction, such as in 2 ÷ ⅔. It becomes difficult to envision the context when, for example, 2 kg of rocks are shared among ⅔ of a person (Lo & Luo, 2012). To offer a thorough understanding of both methods, researchers have utilized a combination of measurement approaches (i.e., 4 ÷ ⅕) and partitive approaches (i.e., ⅕ ÷ 4) in their tasks. This approach is taken because fraction division is better understood in connection with whole number division (Son & Crespo, 2009), and both the measurement and partitive approaches are essential components of whole number division.
Summary
In summary, this study aims to examine PSTs’ performance in the multiplication and division of fractions and to compare strategies and outcomes between the U.S. and South Korea. The study will compare strategies related to fraction multiplication and division across three different domains: creating a story problem, solving word problems, and illustrating visual models. By identifying common patterns of difficulties or successful strategies demonstrated by both groups, this study hopes to provide practical implications that will help PSTs build a conceptual understanding of fractions, enabling them to teach these concepts meaningfully to their future students.
Methodology
Participants
Two groups of elementary PSTs participated in this study. The first group consisted of 46 PSTs enrolled in the elementary teacher preparation program at a mid-sized university in the western United States. The second group of participants consists of 30 PSTs from a teacher preparation university in South Korea. Both of groups were selected based on convenient sampling. For the U.S. PSTs, the data were collected during the students’ participation in a mathematics methods course, in which one of the researchers served as the instructor of the course. For Korean participants, data were collected while the 30 Korean PSTs visited the researchers’ university for a short-term practicum at a local elementary school in the U.S. The researcher was interested to observe how these Korean PSTS, who came from a country known for their high mathematical achievement, would solve the same tasks.
The similarities of these groups are that all participants are enrolled in teacher education programs with an emphasis on elementary education, and they have experience of practicum at local schools for observations and limited levels of instruction. However, the observation period and the mathematics courses they have taken were different between the two groups. The U.S. PSTs’ institution required them to take three mathematics related courses (e.g., Mathematics for Elementary Teachers I, II, and one elective) prior to the method course and they participated two days a week practicum for 16 weeks before taking this methods course. U.S. PSTs were mostly seniors, meaning they are in their fourth year in college. In contrast, the Korean PSTs’ practicum periods vary from four weeks to ten weeks depending on the years in the program. Fifty percent of Korean PSTs are seniors, and the rest are juniors or younger. According to the Korean PSTs’ university program, they are required to take two mathematics courses (e.g., Foundations of Modern Mathematics and one elective) as part of the elementary education curriculum. Unfortunately, the participants’ backgrounds such as their highest math courses in high school or prior learning experience with fractions, were not collected during data collection process. As a result, more detailed information about the participants is not available in this study.
All PSTs were invited to participate in the study to enable a comparison between the strategies of U.S. PSTs and strategies of Korean PSTs. In accordance with Instructional Review Board (IRB) guidelines, the purpose study's purpose, data collection procedures, and participant expectations were explained, and the consent forms were obtained prior to participation. Eleven fraction multiplication and division tasks were given to the U.S. participants with paper and pencils during the researchers’ mathematics method course, and their responses were collected. For Korean participants, the identical tasks were provided in both English and Korean and the Korean PSTs provided their responses in Korean. One of the researchers is a native Korean speaker, so the researcher translated the results into English. During these tasks, both groups of participants were required to work individually, without the use of calculators, but they were allowed to ask questions for clarification. There was no time restriction, and the data were collected anonymously.
Conceptual framework of the tasks
In this study, levels of cognitive demand of mathematical tasks (Stein et al., 2009) were used as a conceptual framework. The study of Stein et al. (2009) examined mathematical tasks in terms of their cognitive demands, in which cognitive demands were defined as the “level of thinking required of students in order to successfully engage with and solve the tasks” (p. 1). In the context of different representations of fractional quantities, Stein et al. (2009) described the characteristics of mathematical tasks with four levels of cognitive demand and reported that each of these ways requires a different level of cognitive demands on students. The first two are considered as lower-level demands and they are memorization and procedures without connections to understanding meaning or concepts. Typically, the tasks with lower-level demands focus on the memorization of algorithms or procedures and do not require students to make connections to the concepts of the tasks. Meanwhile, the higher-level demands are classified as procedures with connections to understanding, meaning or concept and doing mathematics. These tasks require students to build connections to underlying concepts and meaning and to solve the problem using more than just traditional algorithms. Such problem solving in higher-level demands can include pictorial representations of the processes and the exploration of mathematical relationships. The various levels of cognitive demand could be related to PSTs’ problem-solving strategies in terms of fraction division and multiplication concepts.
Measures
To engage various levels of cognitive demand, the focus of problems extended beyond basic computational competency. The 11 problems were categorized into three levels: (1) four tasks that asked PSTs to pose a story problem from a given fraction equation, (2) three tasks that asked PSTs to solve fraction story problems using more than one strategy, and (3) four tasks that required PSTs to find the answer of a fraction equation using a visual model.
Part I: Problem posing (higher-level cognitive demands)
Using your own words, create word problems with the following fractional numbers:
Q1. 3 ×
Posing a story problem was included as a measure in the present study, as Adu-Gyamfi et al. (2019) indicated the ability to formulate one's own story problem serves as an indicator of PSTs’ conceptual understanding of multiplication and division of fraction in real-life situations. Posing problems are higher-level demands as procedures with connections for the following reasons (Stein et al., 2009):
The task requires conceptual understanding of fraction multiplication or division to create their own stories aligned with the concepts. It has real-world context. The conventional algorithm is not applicable.
Part II: Working on the tasks (lower-level cognitive demands)
Solve the following problems and show your work. Q5. March and Jada share 5 yards of ribbon equally. How much ribbon will each get? Q6. It takes half a yard of ribbon to make a bow. How many bows can be made with 5 yards of ribbon? Q7. Paula has 9 pounds of candy bags. If she uses ½ of what she has for Halloween, how many pounds will she have used?
The tasks in this category asked the participants to solve the fraction word problems and show the processes of how they solved the problems. To emphasize problem-solving strategies and minimize the risk of miscalculations, the researchers designed straightforward word problems with whole numbers and easy fraction numbers such as ½. The working on the tasks category can be classified as a lower level of cognitive demand, since it prompts PSTs to solve problems using any strategy, including algorithms and formulas (Stein et al., 2009).
The task requires the use of well-established procedures for finding the answer. It does not require an explanation for the answer. It requires cognitive effort (i.e., PSTs need to think about what the problem actions mean as they work through the problem). It has the real-world context.
Part III: Visual representations (higher-level cognitive demands)
Multiply or divide the following fractions. Draw a model to explain your thinking.
Q8.
In part III, PSTs were asked to solve the given fraction equations and to demonstrate visual models to justify their answers. Part III was employed to investigate PSTs’ deeper conceptual understanding around fraction multiplication and division because of the relationships between the visual representations and the conceptual understanding. Creating visual representation is higher-level demands as doing mathematics according to Stein et al. (2009) because:
There is no predictable pathway suggested by the task. It requires PSTs to explore and understand the nature of relationships between the algorithms and the visual representations. It requires complex thinking. It uses a diagram.
The previous studies, such as those by Izsák (2008) and Lee (2017), have highlighted that many PSTs encountered difficulties in creating diagram that align with algorithmic solutions, suggesting a limited conceptual knowledge of fraction multiplication and division. Conversely, the ability of PSTs to generate visual models to support their answers and algorithmic processes can be viewed as indicative of conceptual understanding. As per Stein et al. (2009), representing visual models necessitates conceptual understanding as it requires PSTs to discern the meaning of multiplication and division in various contexts without a prescribed pathway suggested by the task itself. Through these tasks, the researchers aimed to investigate whether PSTs could substantiate algorithm procedures with appropriate visual representations and demonstrate conceptual understanding. In Question (Q) 8 (Q: 8), the researchers utilized the expression
The fractional numbers in this survey were selected based on 5th grade Common Core State Standards of the United States (National Governors Association Center for Best Practices & Council of Chief State School Officers, 2010), as PSTs should know these concepts first, prior to instructing their students (Iskenderoglu, 2018). For instance, number and operation of fraction standards (5.NF.B.3) requires solving word problems involving division of whole numbers, which leads to answers in the form of fractions (Q5: 5 ÷ 2), multiplying a fraction by a whole number (Q1: 3 ×
Analysis
PSTs’ responses to the 11 tasks were analyzed using a dual-level coding approach. Initially, all 11 tasks underwent coding based on the presence of either correct or incorrect answers. Subsequently, the strategies were coded as well. In terms of correct or incorrect answers, conceptual accuracy was the most important criterion. Below is a detailed description of how the tasks in each part were analyzed. Table 1 summarizes how tasks in Part I were analyzed and coded.
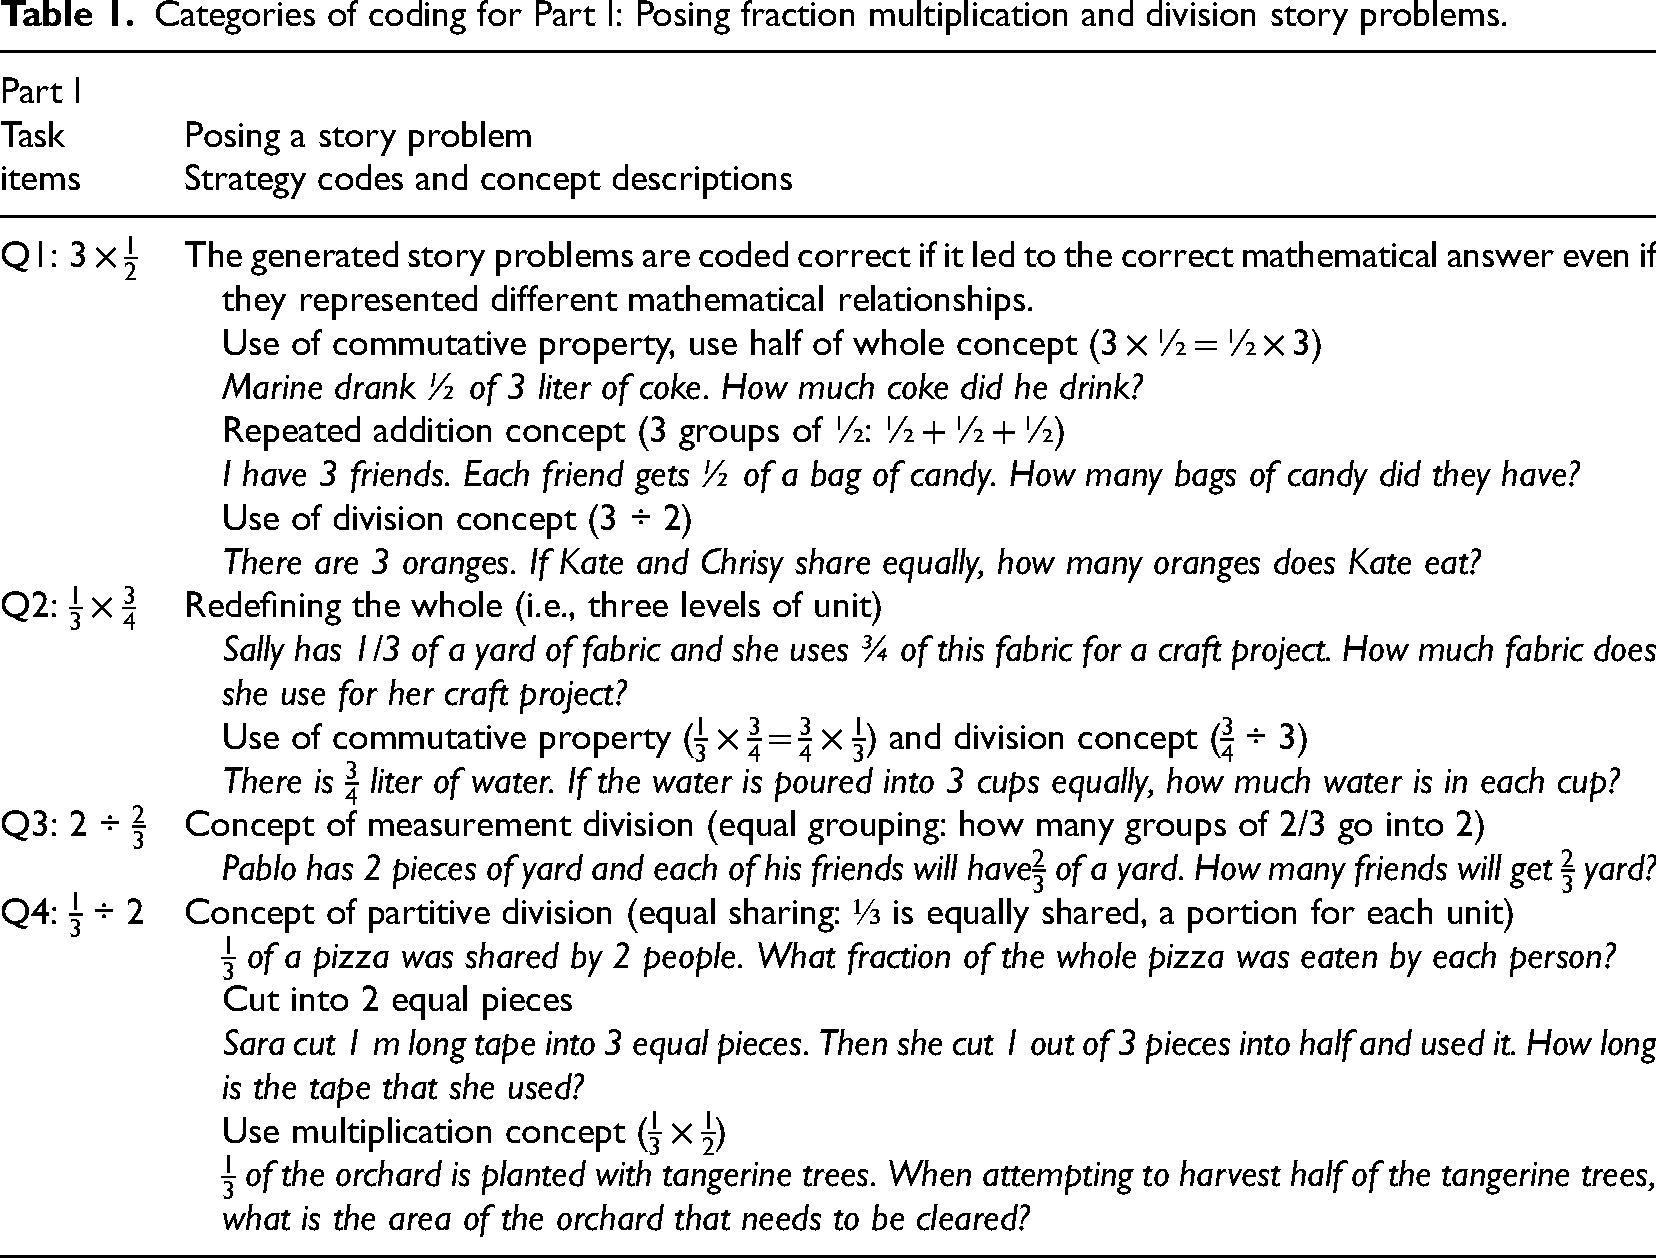
Categories of coding for Part I: Posing fraction multiplication and division story problems.
Categories of coding for Part I: Posing fraction multiplication and division story problems.
The four tasks in Part I involved creating story problems for given fraction multiplication and division equations. Firstly, all the written problems were reviewed to ensure they accurately reflected the concepts of fraction multiplication or division, leading to mathematically correct solution of the given equations. For example, when analyzing the written problems for 3 × ½, the story problem was coded as correct if it led to the correct mathematical answer of 1½. If the written problem represents the correct mathematical answers (1½) but represented a different mathematics relationship (e.g., using 3 × ½, ½ + ½ + ½, or 3 ÷ 2) it was still coded as correct, as the primary criterion was generating word problems that produced mathematically accurate answers. If the written problem did not potentially lead to the correct mathematical answer, the written problems were coded as incorrect. Since this type of task is classified as involving higher-level cognitive demands (Stein et al., 2009), it was important to analyze the embedded concepts in the problems. Among the correctly written story problems, we aimed to identify different conceptual approaches to interpret 3 × ½ and code each strategy. For instance, with the equation of 3 × ½, PSTs might employ the concept of repeated addition, conceptualizing the problem as 3 groups of ½ and posing the problem as requiring ½ + ½ + ½. Alternatively, PSTs might apply the commutative property of multiplication and interpret 3 × ½ as ½ × 3 to develop their problems and PSTs may envision the context as ½ groups of 3 whole(s). Another viable strategy involves employing the division concept for a multiplication problem, viewing 3 × ½ as equivalent to 3 ÷ 2 because they yield the same mathematical result. Since the major focus was on whether the provided story problems could be solved to yield the correct answer, we coded the story problems that represented ½ × 3 or 3 ÷ 2 as correct, even though their mathematical equations are not the same as 3 × ½. An equivalent analysis was applied to ⅓ × ¼, and three major themes had emerged, such as the use of referent unit, commutative properties (⅓ × ¼ = ¼ × ⅓) and the division concept (⅓ ÷ 4).
With the division story problems in Part I, a similar data analysis process was applied. For both equations (2 ÷
The written problems providing an incorrect mathematical answer were categorized as incorrect. For instance, when PSTs were supposed to pose a problem that corresponded with 3 × ½, but the posed problem represented the expression with ½ ÷ 3, then the problem was coded as incorrect because the mathematical answer is not accurate. In the strategy analysis, the process incorporated both newly developed codes by the researcher and the codes aligned with current literature, including the common error codes previously identified by Morano and Riccomini (2020). To develop the new codes, the strategies underwent multiple reviews between two researchers to identify the concepts employed in solving multiplication or division problems, responses.
Part II (Q:5, Q:6, and Q:7) required PSTs to tackle story problems involving the multiplication and division of fractions, in which they were asked to provide solutions through drawings or equations. This type of task was categorized as lower-level cognitive demand (Stein et al., 2009) not only because PSTs could solve the problems using formula without further explanations but also multiple strategies beyond the algorithm were optional, not mandatory. Initially, the responses were simply coded as correct or incorrect based on the provided mathematical solution. Later, the strategy types were categorized as algorithm-based and non-algorithm based, then analyzed to determine if the provided strategies were mathematically correct. Several codes were assigned for the correct answers, such as, correct answer with algorithm only, correct answer with both algorithm and diagram, correct answer with no work shown, and correct algorithm but incorrect diagram or vice versa and so on. When the responses showed the correct answers but one of the strategies was not accurate (e.g., either incorrect algorithm or incorrect diagram), the response was coded as “correct” because the focus of Part II was to simply find the solution of the problem, and the connection with the concept was less emphasized in these tasks. Examples of correct or incorrect strategies are illustrated in the results section.
The objective of the tasks in Part III (Q8–Q11) was to assess whether PSTs could accurately depict visual models for given problems. Like the tasks in Part I, Part III was categorized as higher-level cognitive demands because using visual model involves a conceptual understanding of fraction operations (Morano & Riccomini, 2020). Therefore, the emphasis was placed on the accuracy and fidelity of the visual models in reflecting the conceptual understanding of the problem. The data were categorized as either correct visual models or incorrect visual models. Even if the answers were correct and the algorithms were accurate, responses were coded as incorrect if the accompanying visual representation was conceptually inaccurate. Among the correct visual models for operations, several strategy themes were identified after careful review by researchers. Examples of fraction multiplication include using area model, a part of the part (three levels of unit) and community property. Additional themes with examples are illustrated in the results.
Overall, the researchers scrutinized the types of concepts PSTs employed when formulating, solving, and visually representing problems, categorizing them with strategy codes. To ensure coding validity, a dual approach involving solo and team coding (Saldaña, 2016) was implemented. In this process the researchers independently analyzed the responses initially. Then, multiple discussions were conducted to reconcile coding differences, leading to an intercoder agreement (Saldaña, 2016) of 90%. This process was iterated for Parts I, II, and III.
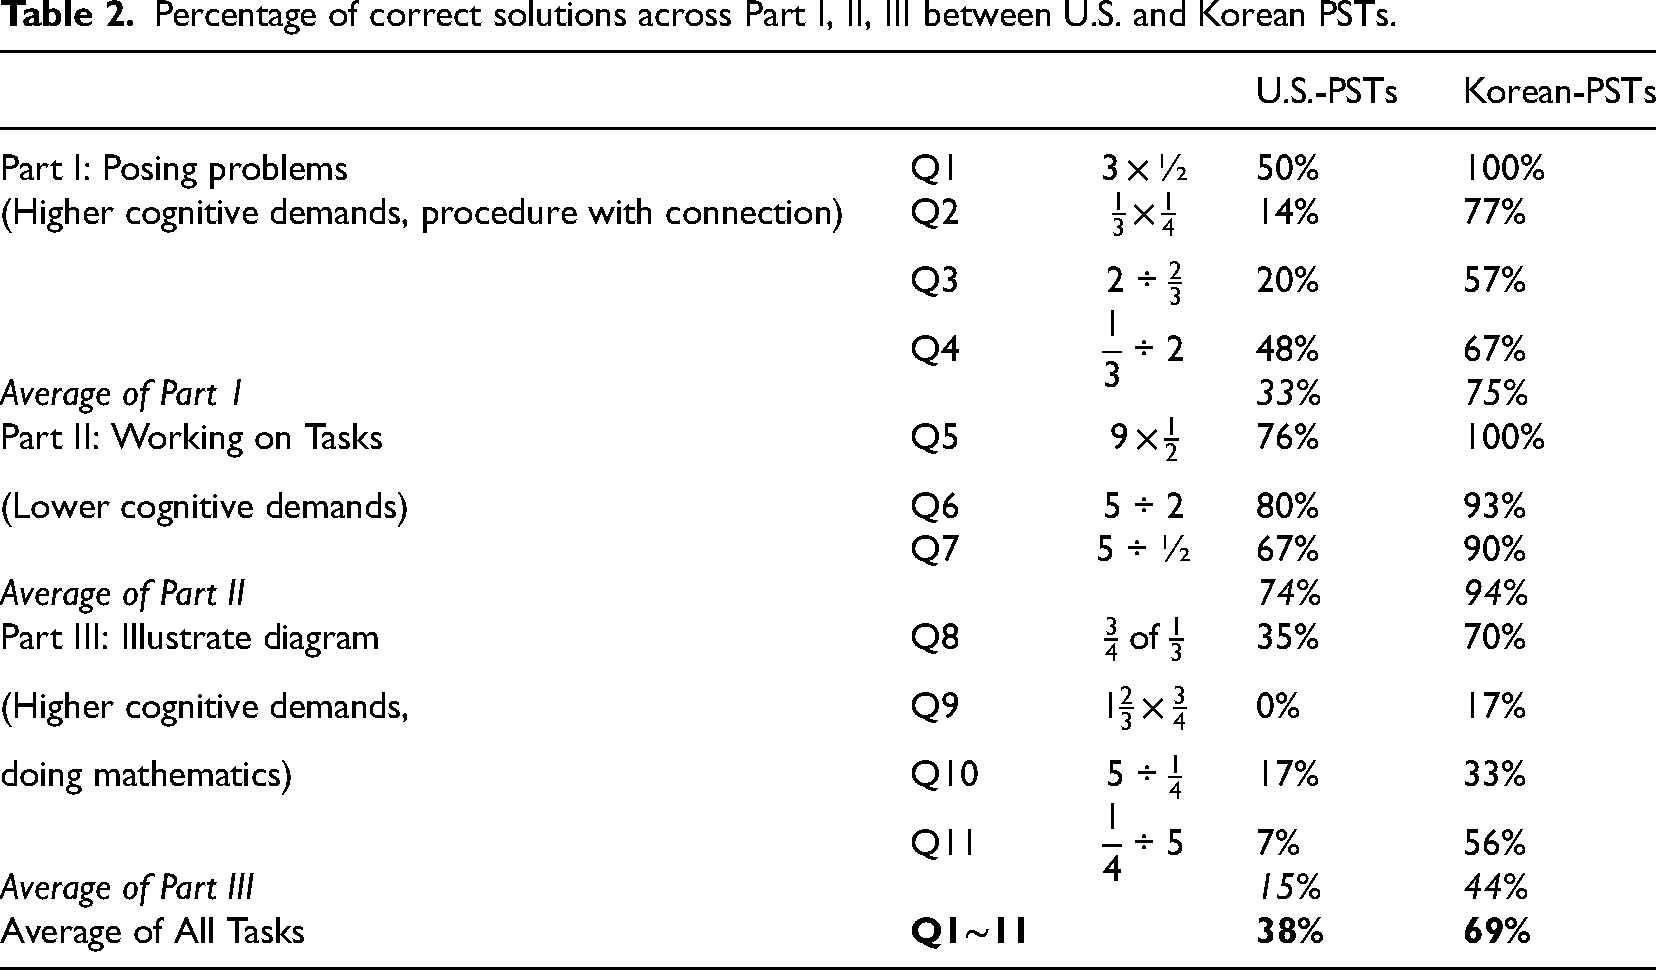
Table 2 summarizes the overall performance of across tasks for the two groups. Further detailed explanations of each component are elaborated upon in the subsequent sections.
Percentage of correct solutions across Part I, II, III between U.S. and Korean PSTs.
Percentage of correct solutions across Part I, II, III between U.S. and Korean PSTs.
Regarding the general performances of both groups, Korean PSTs demonstrated superior proficiency in tasks related to fraction multiplication and division across all three contexts. However, a closer examination by task type revealed consistent outcomes. Regardless of the percentage of correct answers, both groups of PSTs excelled the most in solving word problems. The next successful task was creating a story problem, followed by illustrating diagrams. To gain a better understanding of the successful outcomes, the following section represents a detailed analysis of strategies employed in each context.
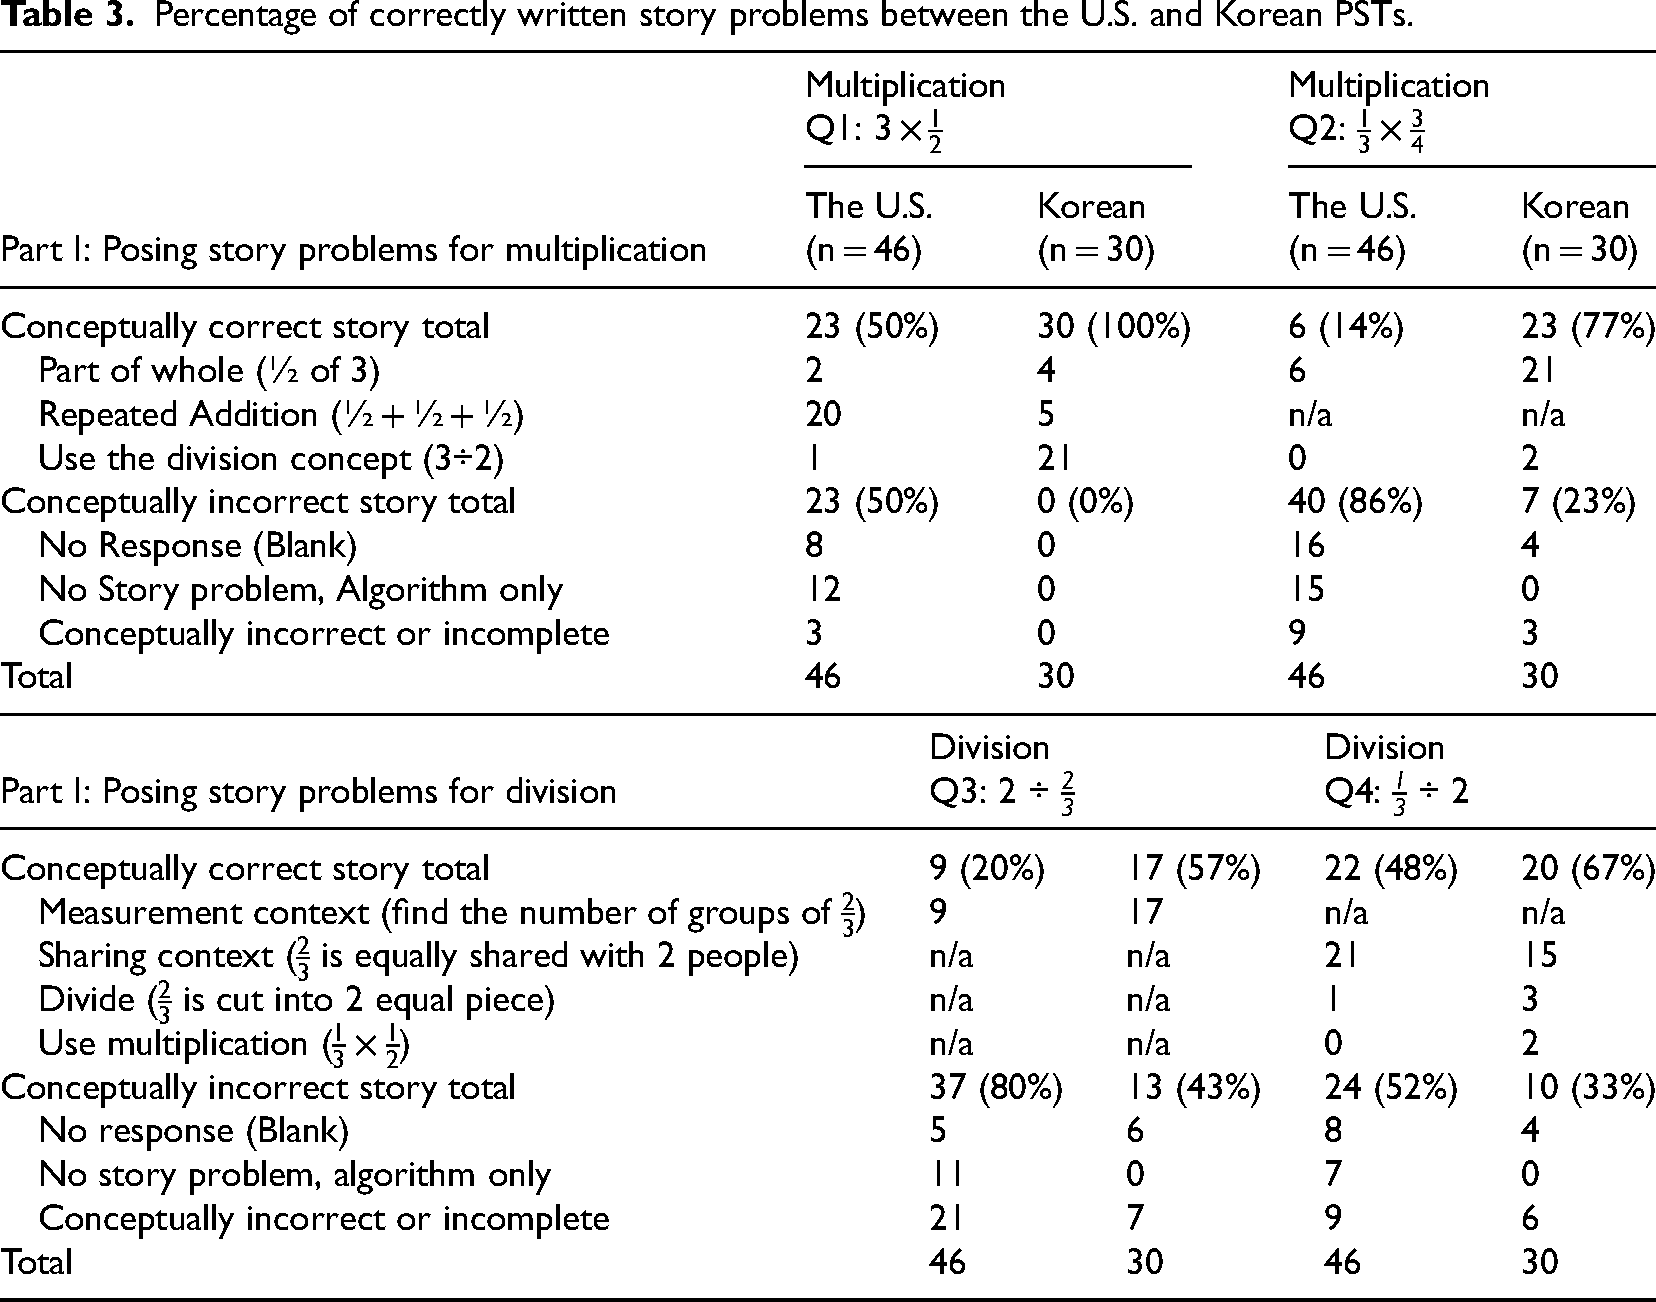
To address the two research questions, the findings are reported based on three parts chronologically (Part I: creating a story problem, Part II: solving word problems, Part III: illustrating a visual model). The percentages of correct solutions between the U.S. and Korea are reported first, followed by a detailed strategy description. Table 1 demonstrates PTSs’ overall performance for Part I, creating a story problem for fraction multiplication and division.
Regarding overall performance, Korean PSTs outperformed their U.S. counterparts in both multiplication and division problems, indicating greater success in creating story problems for both operations. However, the percentage of correct story problems varied between the two groups. Both the U.S. and Korean PSTs were most successful with creating a story problem for 3 × ½ (Q:1). The next successful task for the U.S. was for the partitive division problem (Q:4,
For Q:2 (
Another error pattern observed in this problem was PSTs misunderstanding the three levels of unit, as seen by the examples below: ⅓ × ¾: The phone display is only showing ⅓ of the screen. If he only sees ¾ of the ads on his phone, how much of the ⅓ of this phone can actually be seen? (U.S.-PST 37) ⅓ × ¾: ⅓ of the boys in the class, and ¾ of the girls are wearing red shirts, what fraction of the class is wearing a red shirt? (U.S.-PST 39)
The response of U.S.-PST 37 did not clearly specify what “his phone” meant in the context (whether it referred to the whole screen or ⅓ of the screen). Similarly, U.S.-PST 39 used two separate wholes (representing the number of boys and number of girls). In both cases, the written problems did not clearly represent the unit of each fractional number and what each number referred to in terms of the whole and the referent unit of the fraction.
In the case of division, both groups of PSTs demonstrated greater proficiency in developing story problems with the partitive division concept (i.e., sharing context, Q:4, ⅓ ÷ 2) than with the measurement context. The strategy employed for measurement division (Q:3, 2 ÷ ⅔) was consistent, which involved finding the number of groups. Meanwhile, the most frequently used strategy for partitive division was to employ the concept of the sharing context. However, a few Korean PSTs utilized the multiplication concept (⅓ ÷ 2 as ⅓ × ½) to create a division problem, which is a strategy not observed among U.S. PSTs. Korean PST 1 (K-PST 1) demonstrated a correct example of this division strategy by writing “
PSTs’ performances for solving fraction multiplication and division word problems
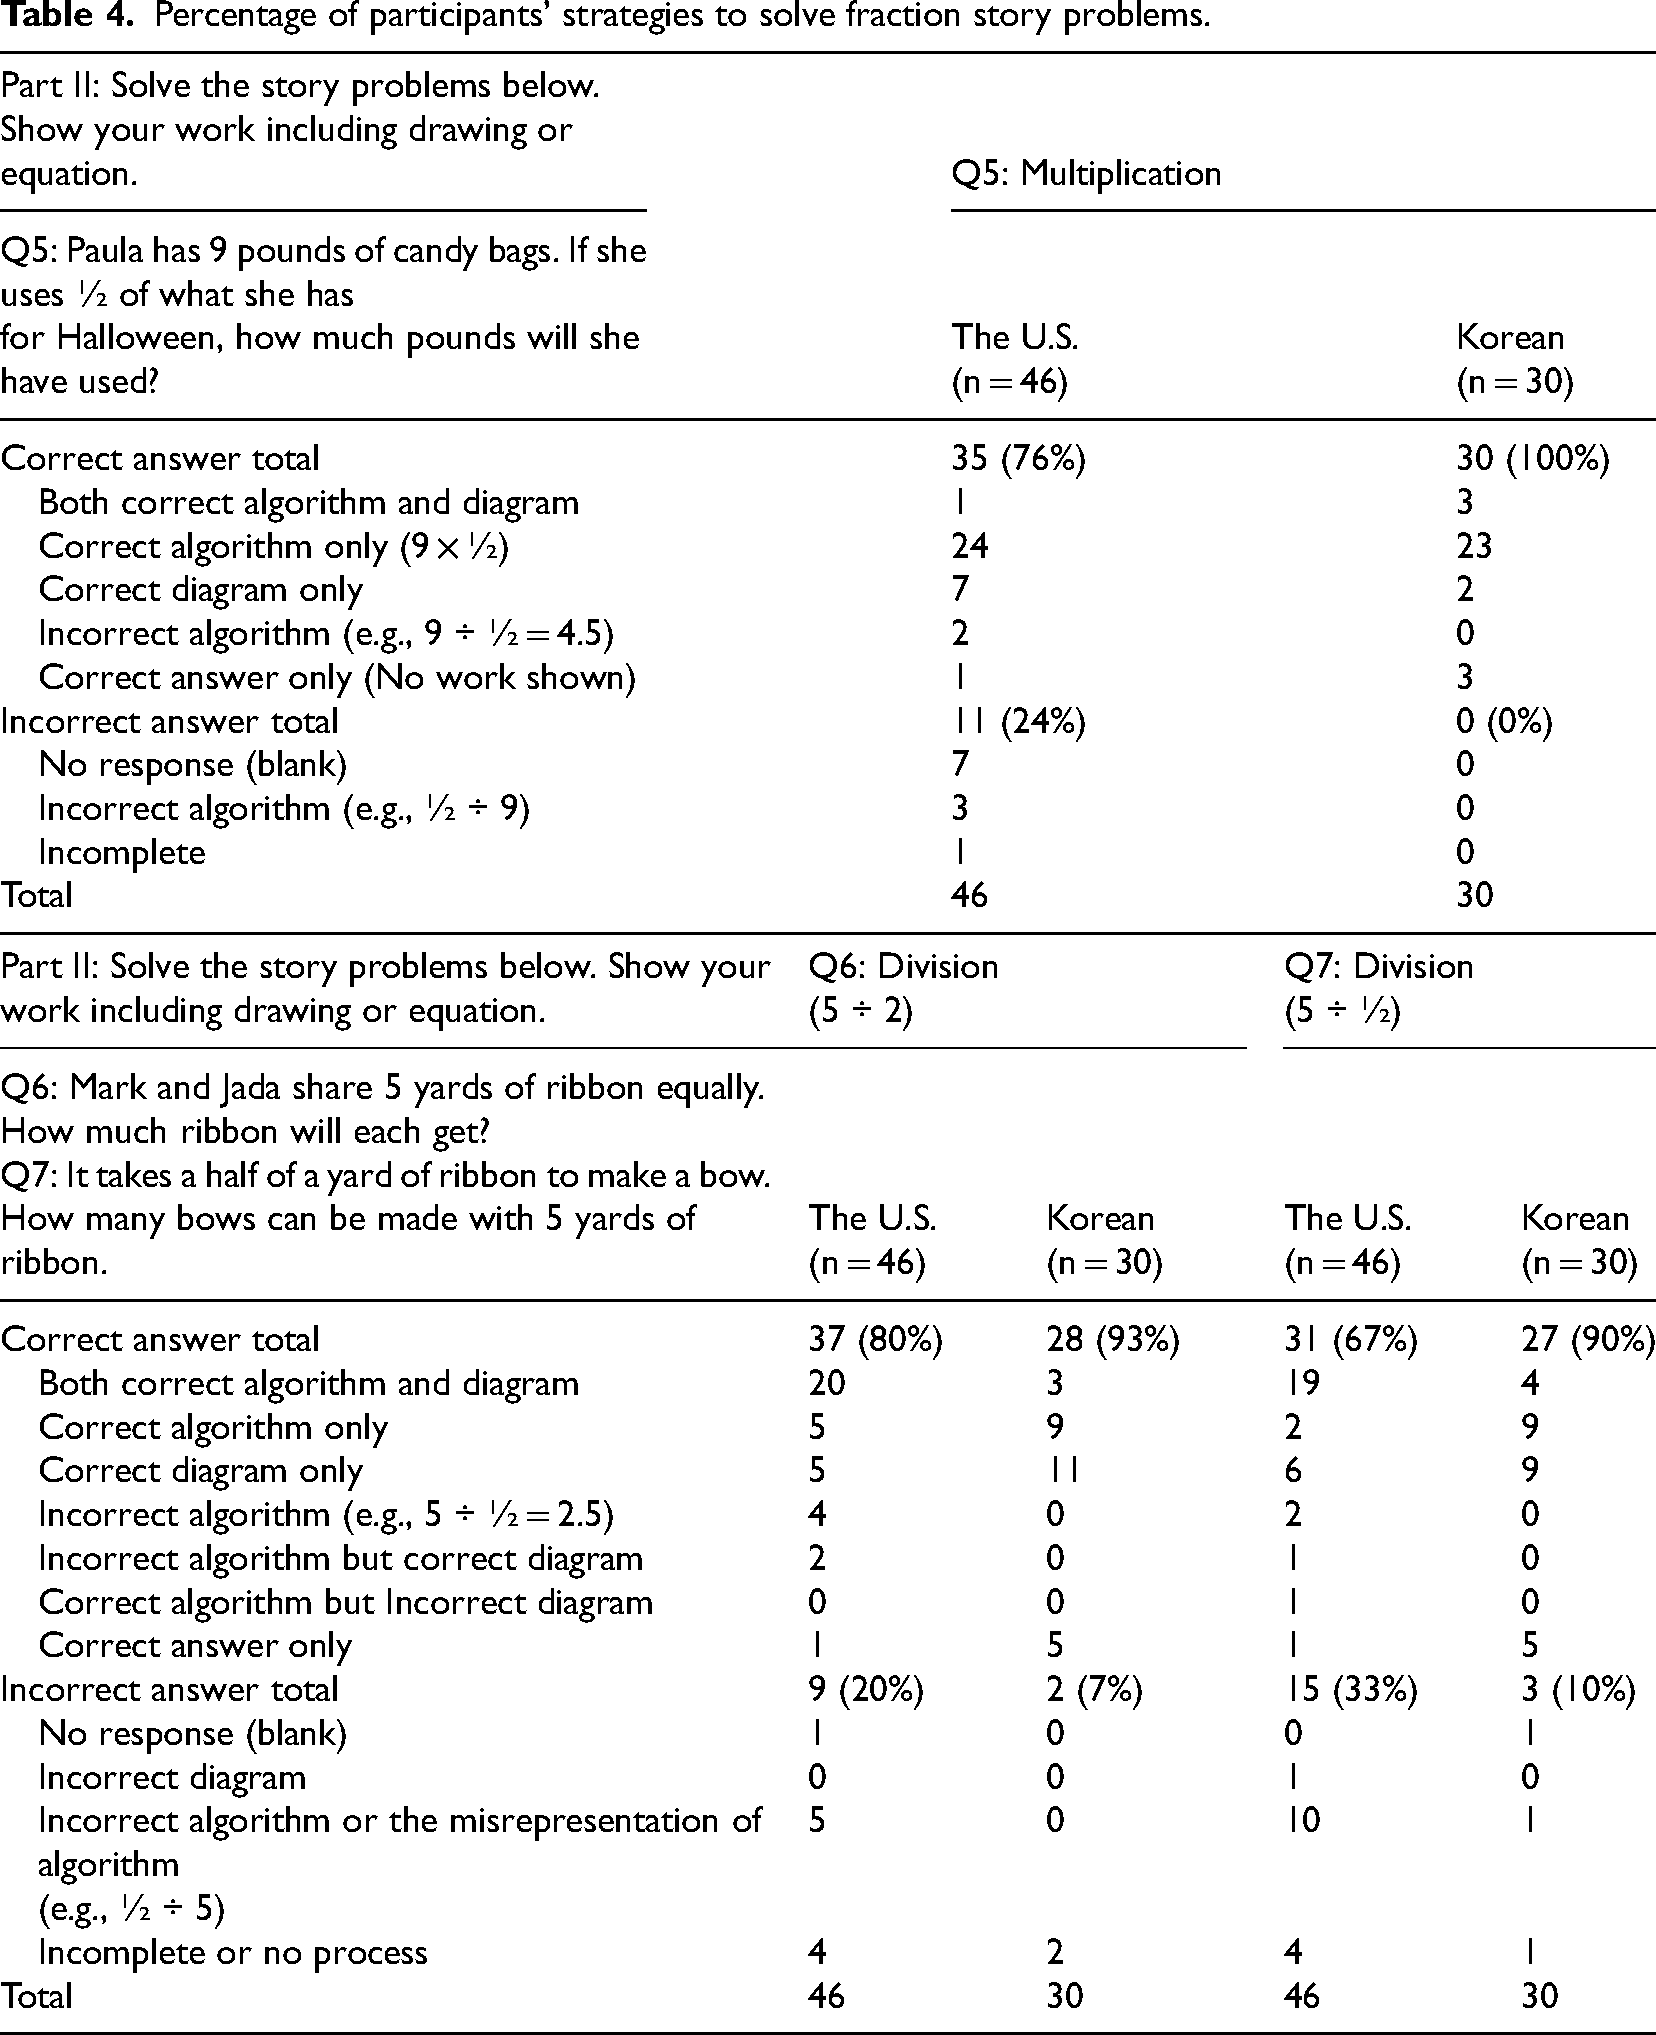
The analysis of Part II indicated that both groups of PSTs demonstrated the highest level of computational competency when solving fraction multiplication and division word problems. The average correct answer rate across all three tasks in Part II for Korean PSTs was 94% accuracy, while the U.S. PSTs demonstrated 74% accuracy. Korean PSTs were particularly successful with Q:5 (9 × ½), in which the PSTs demonstrated 100% accuracy, followed by Q:6 (5 ÷ 2) and Q:7 (5 ÷ ½). On the other hand, U.S. PSTs were most successful with Q:6, Q:5 and Q7. The findings highlighted that both groups of PSTs were least successful with fraction division problems within a measurement context when finding how many groups of ½ fit into the total number of 5 (Q:7, 5 ÷ ½).
Among the correct answers, the frequent use of algorithms was observed as a common strategy for both groups. Notably, a few U.S. PSTs achieved correct answers with incorrect algorithms for both fraction multiplication and division, while no algorithmic errors were observed from the Korean PSTs. The strategy analysis becomes more interesting when examining the different percentages of using both algorithms and diagrams between multiplication and division. As shown in Table 3, for the multiplication problem, a limited number of PSTs used algorithm simultaneously with a diagram (see Figures 1 and 2 for examples). However, the percentage of using both strategies increased significantly for the U.S. PSTs when it came to division problems. In other words, among the correct strategies, only 3% of PSTs incorporated both algorithms and diagrams for multiplication strategies. However, the percentage increased to 54% for Q:6 (5 ÷ 2) and 61% for Q:7 (5 ÷ ½) in the case of division. This substantial increase did not occur for the Korean group of PSTs, as the algorithm remained the dominant strategy for both operations.
Visual representation of
Visual representation of
Percentage of correctly written story problems between the U.S. and Korean PSTs.
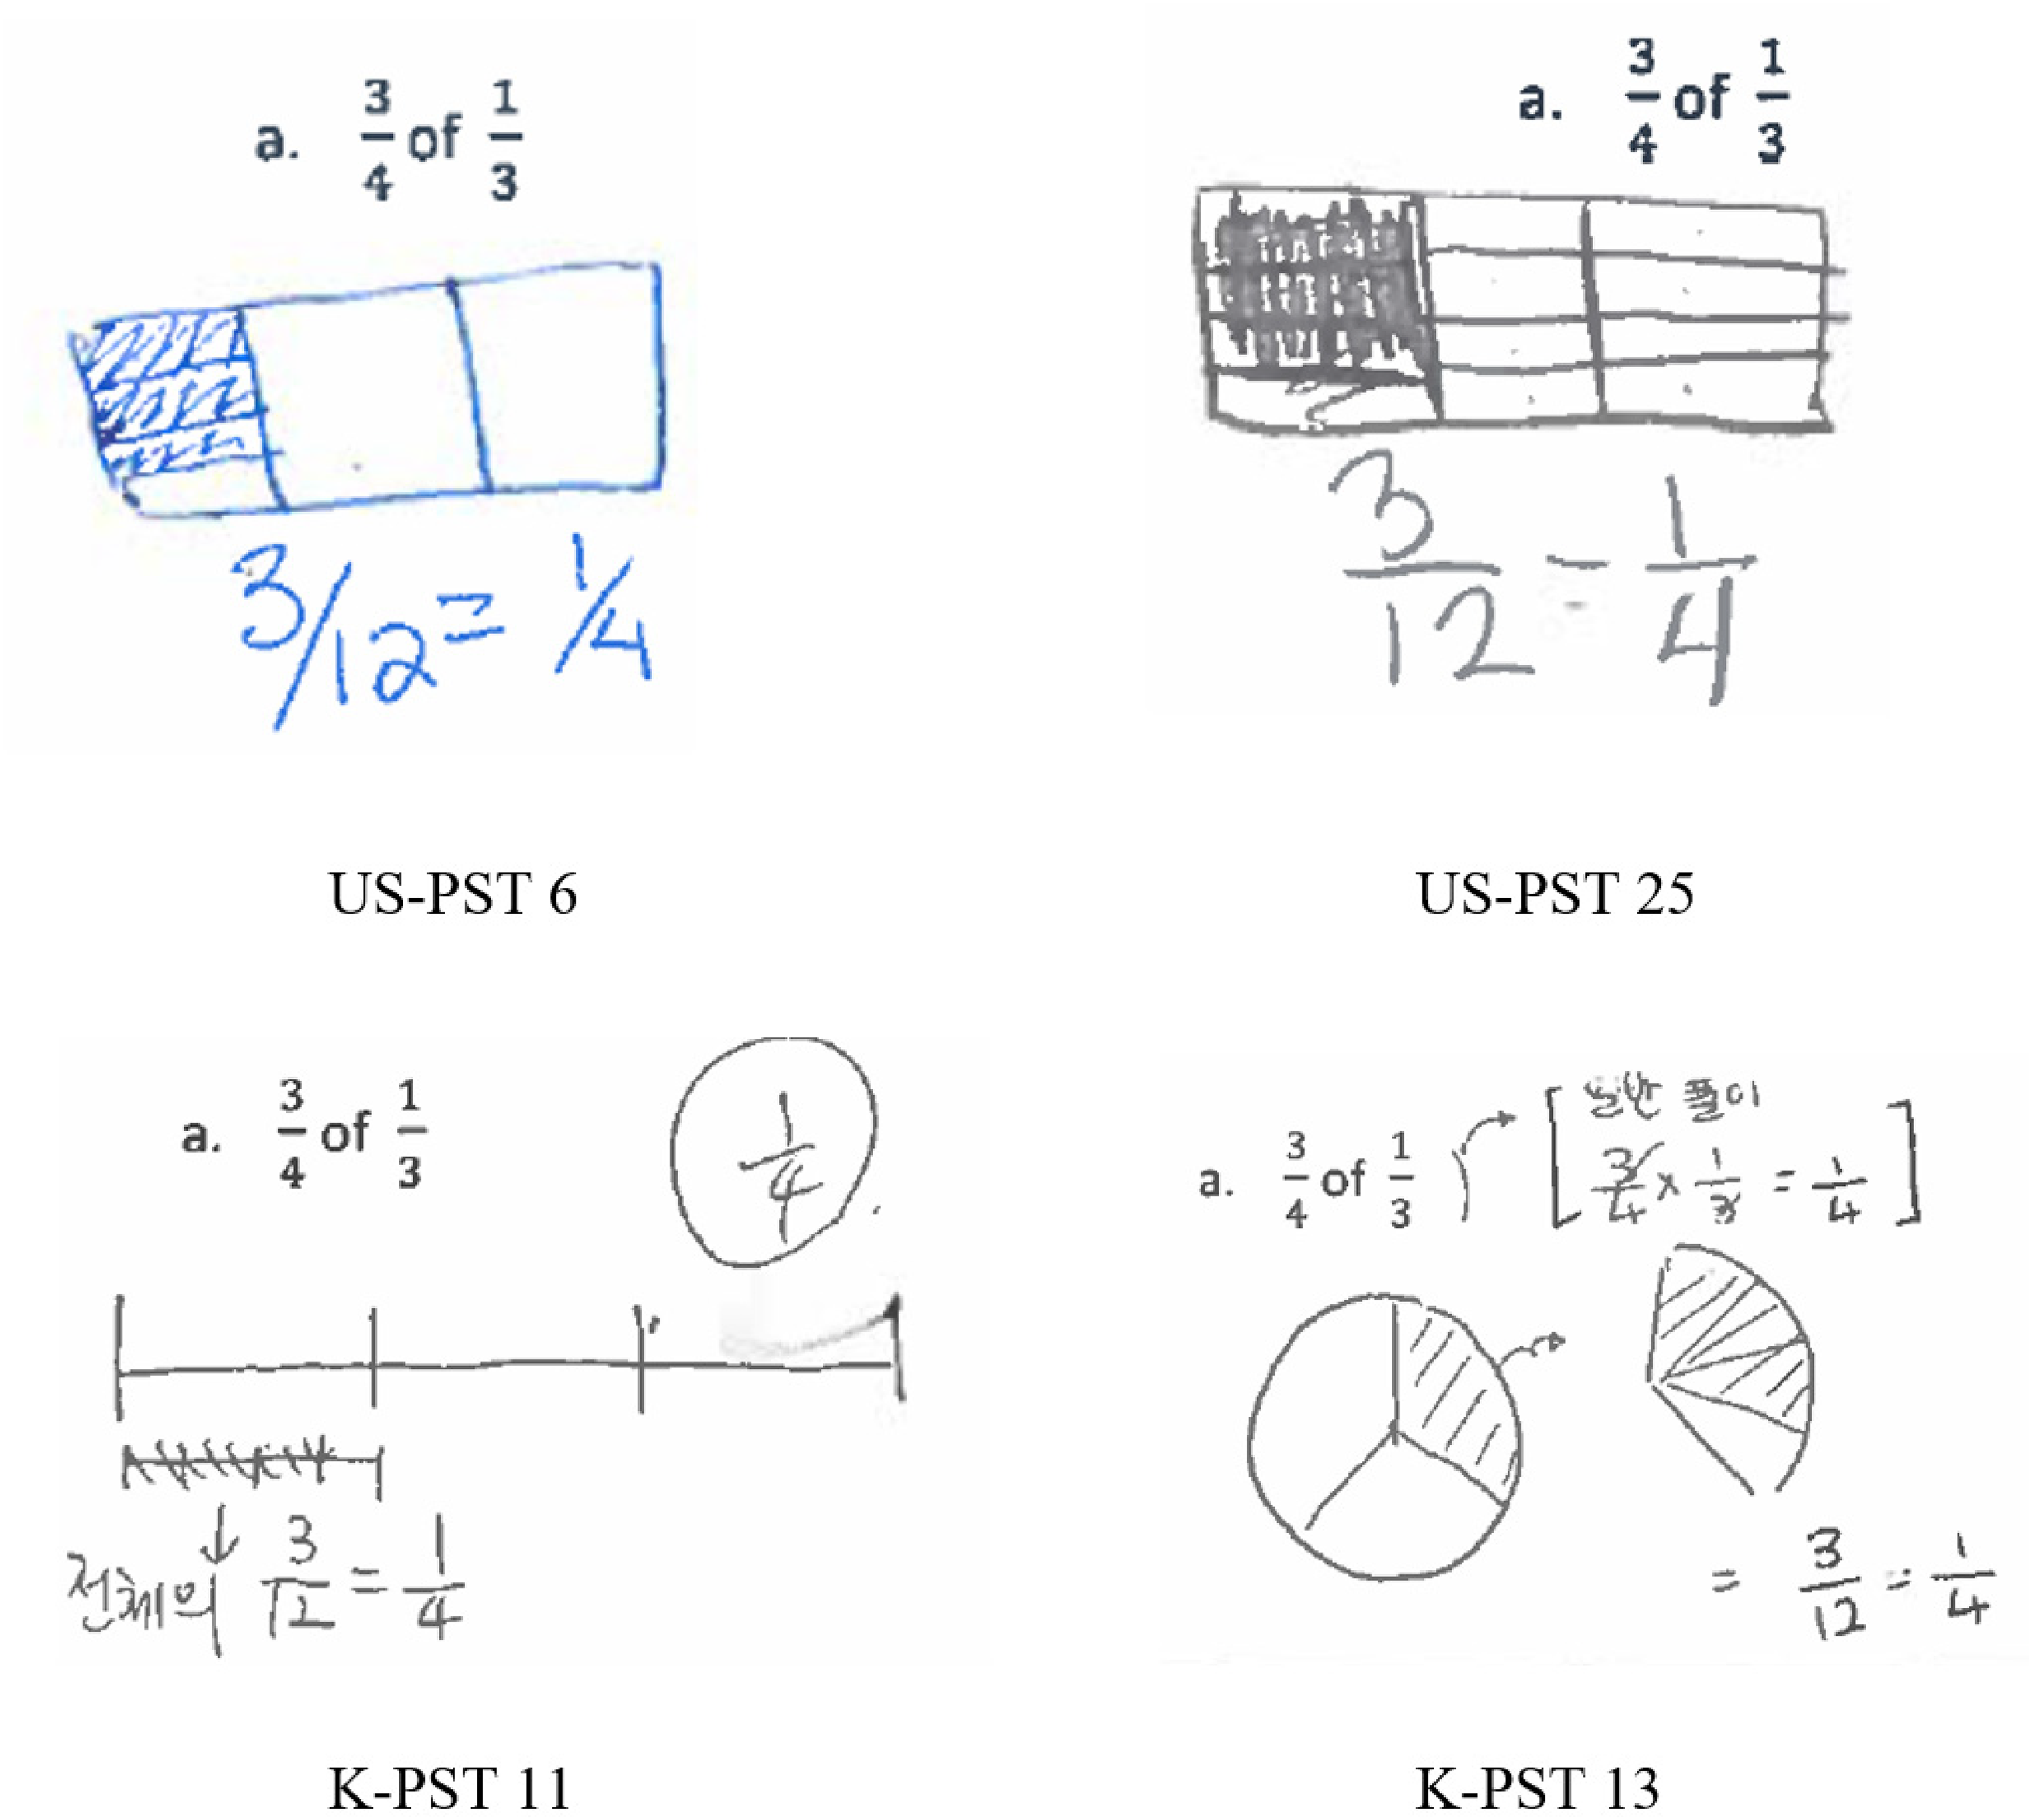
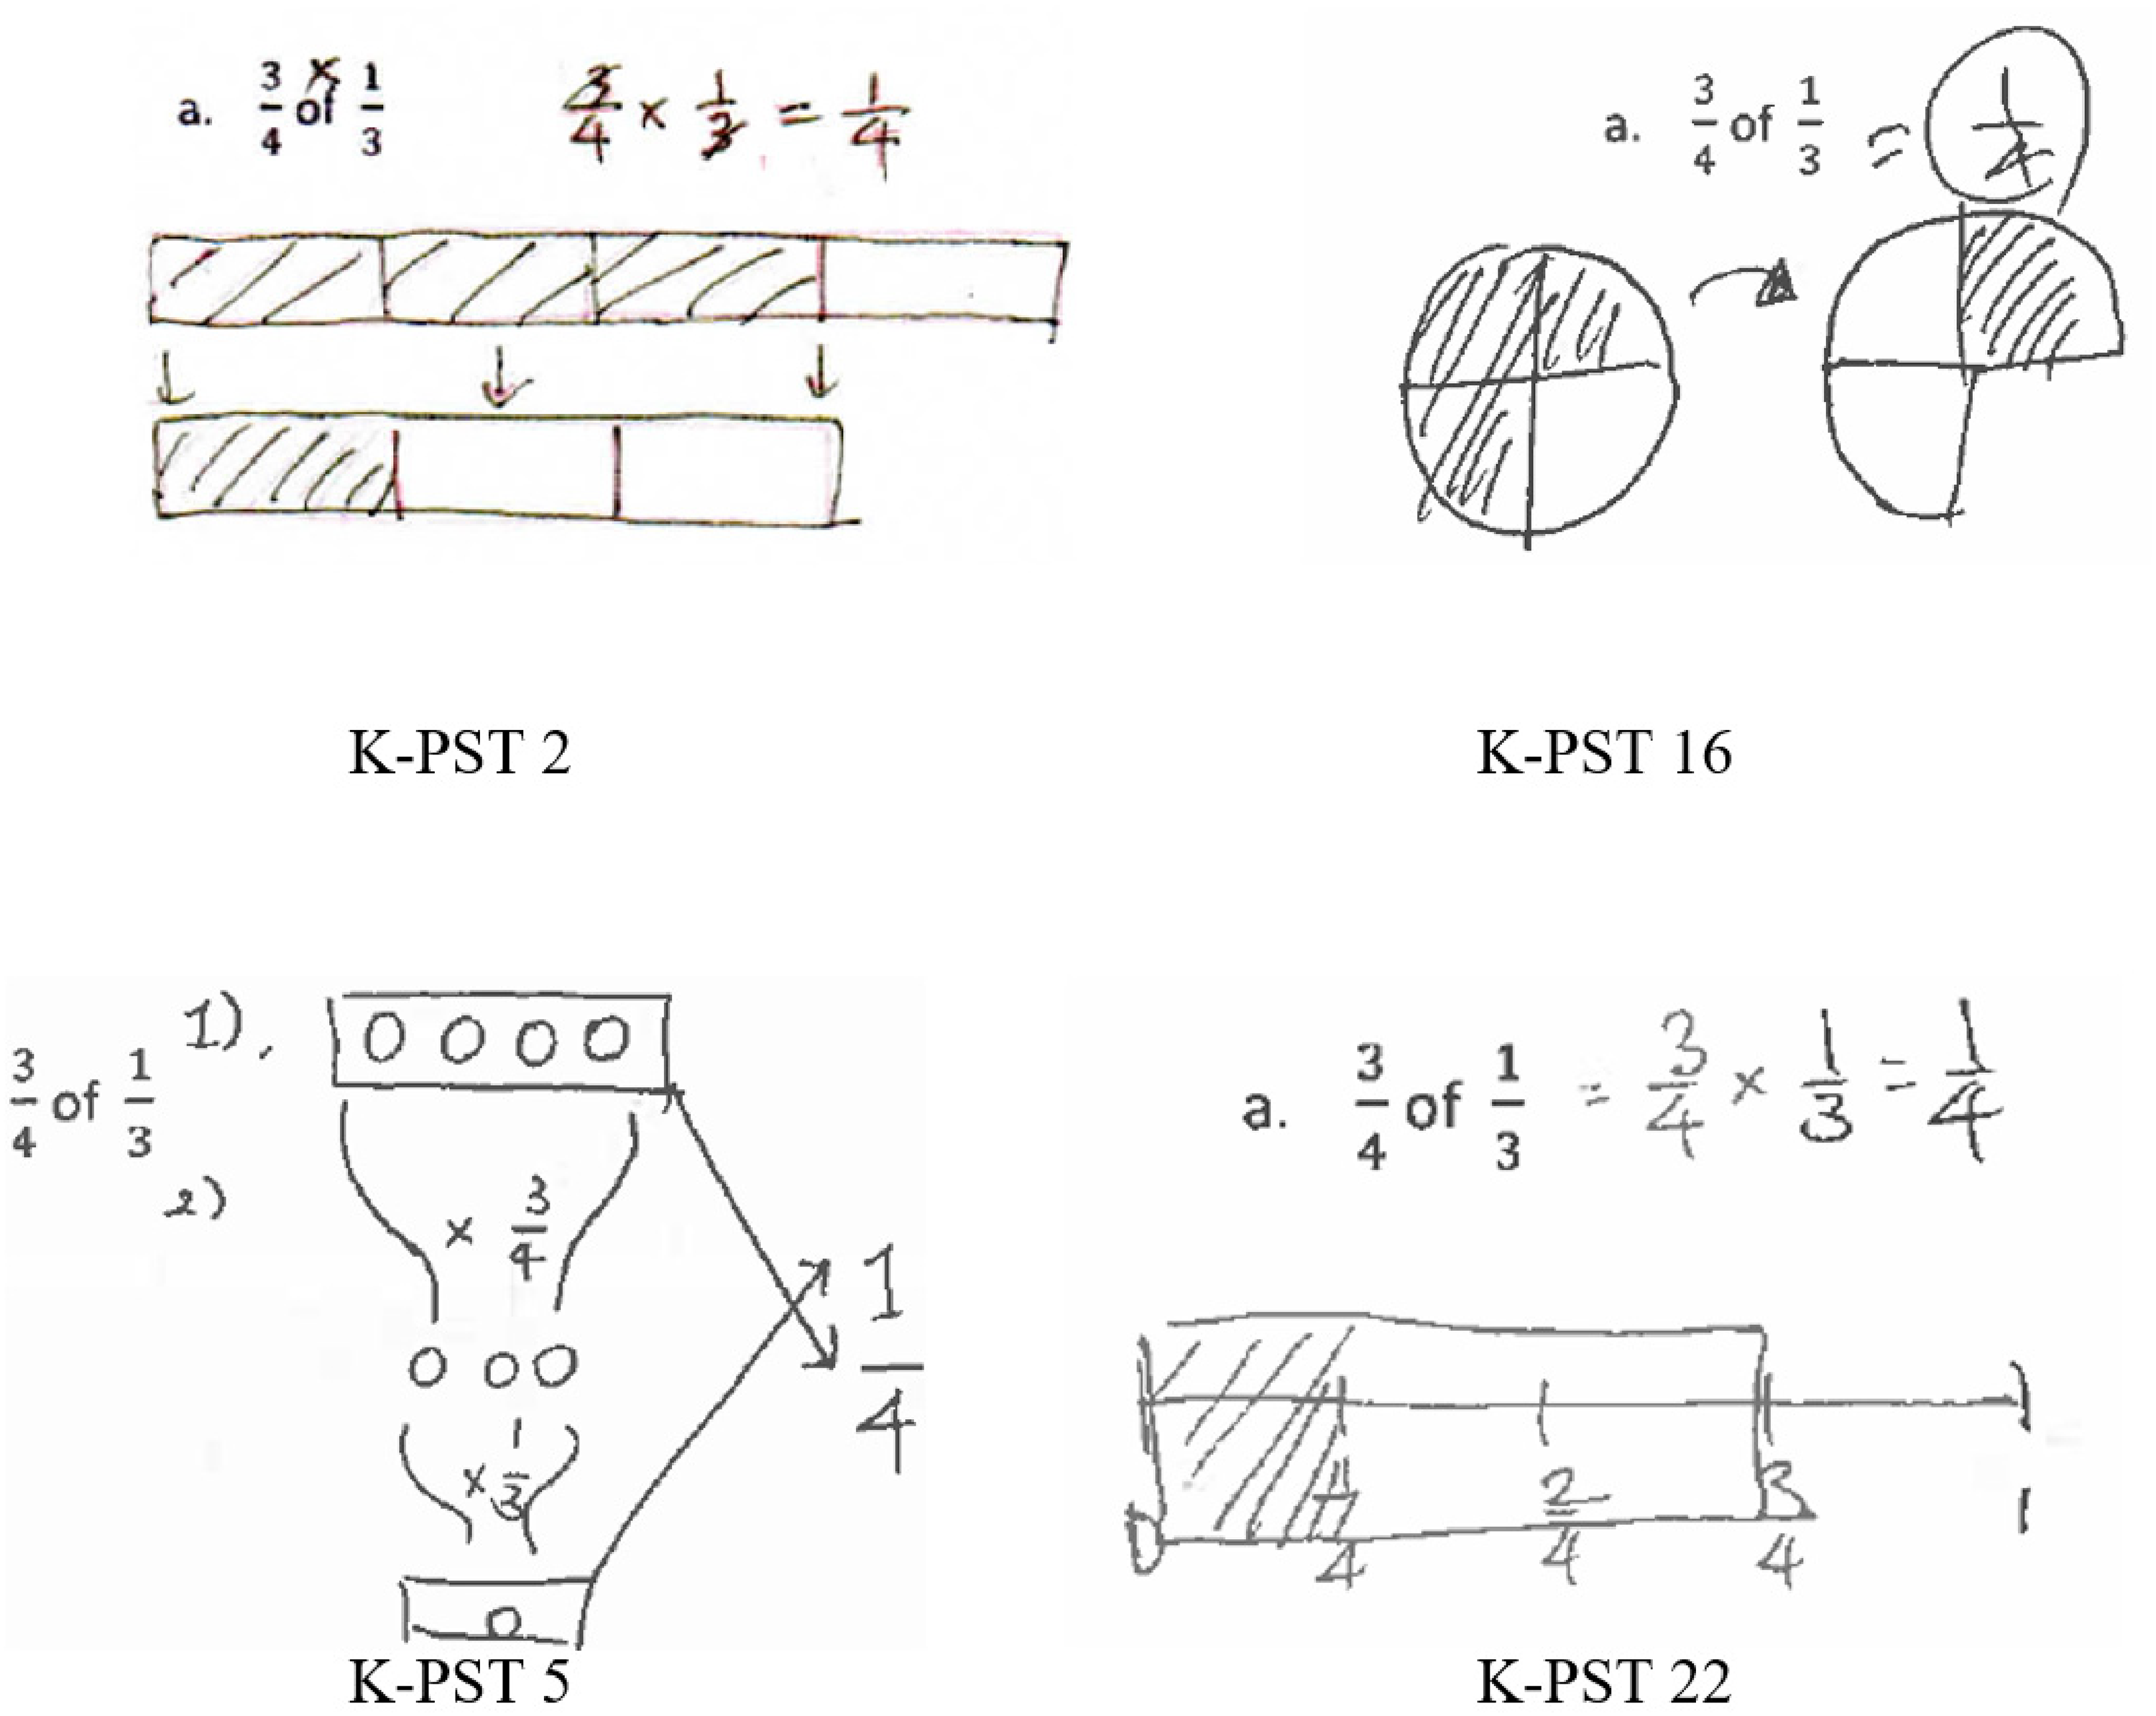
In terms of overall visual representation performance, among four tasks, both groups of PSTs exhibited a shared high proficiency in fraction-by-fraction multiplication tasks (Q:8,
Percentage of participants’ strategies to solve fraction story problems.
Percentage of participants’ strategies to solve fraction story problems.
When examining accurate multiplication strategies, both groups of PSTs employed an area model and utilized the referent unit. However, a distinct observation within the Korean group when compared to the U.S. group was the application of commutative property in multiplication. Commutative property indicates that the order of numbers makes no difference in the multiplication equation (a × b = b × a). Among the 21 successful strategies identified, 14 of them involved the application of commutative property, which aided in finding solutions for problems such as
Successful visual models of 1
As depicted in Figure 2, when representing
These examples illustrate that the approach began with the consideration of three-fourths. PSTs started from three-fourths, then identified three equal parts within the context of three-fourths. Consequently, selecting one out of these three equal parts represented the concept of
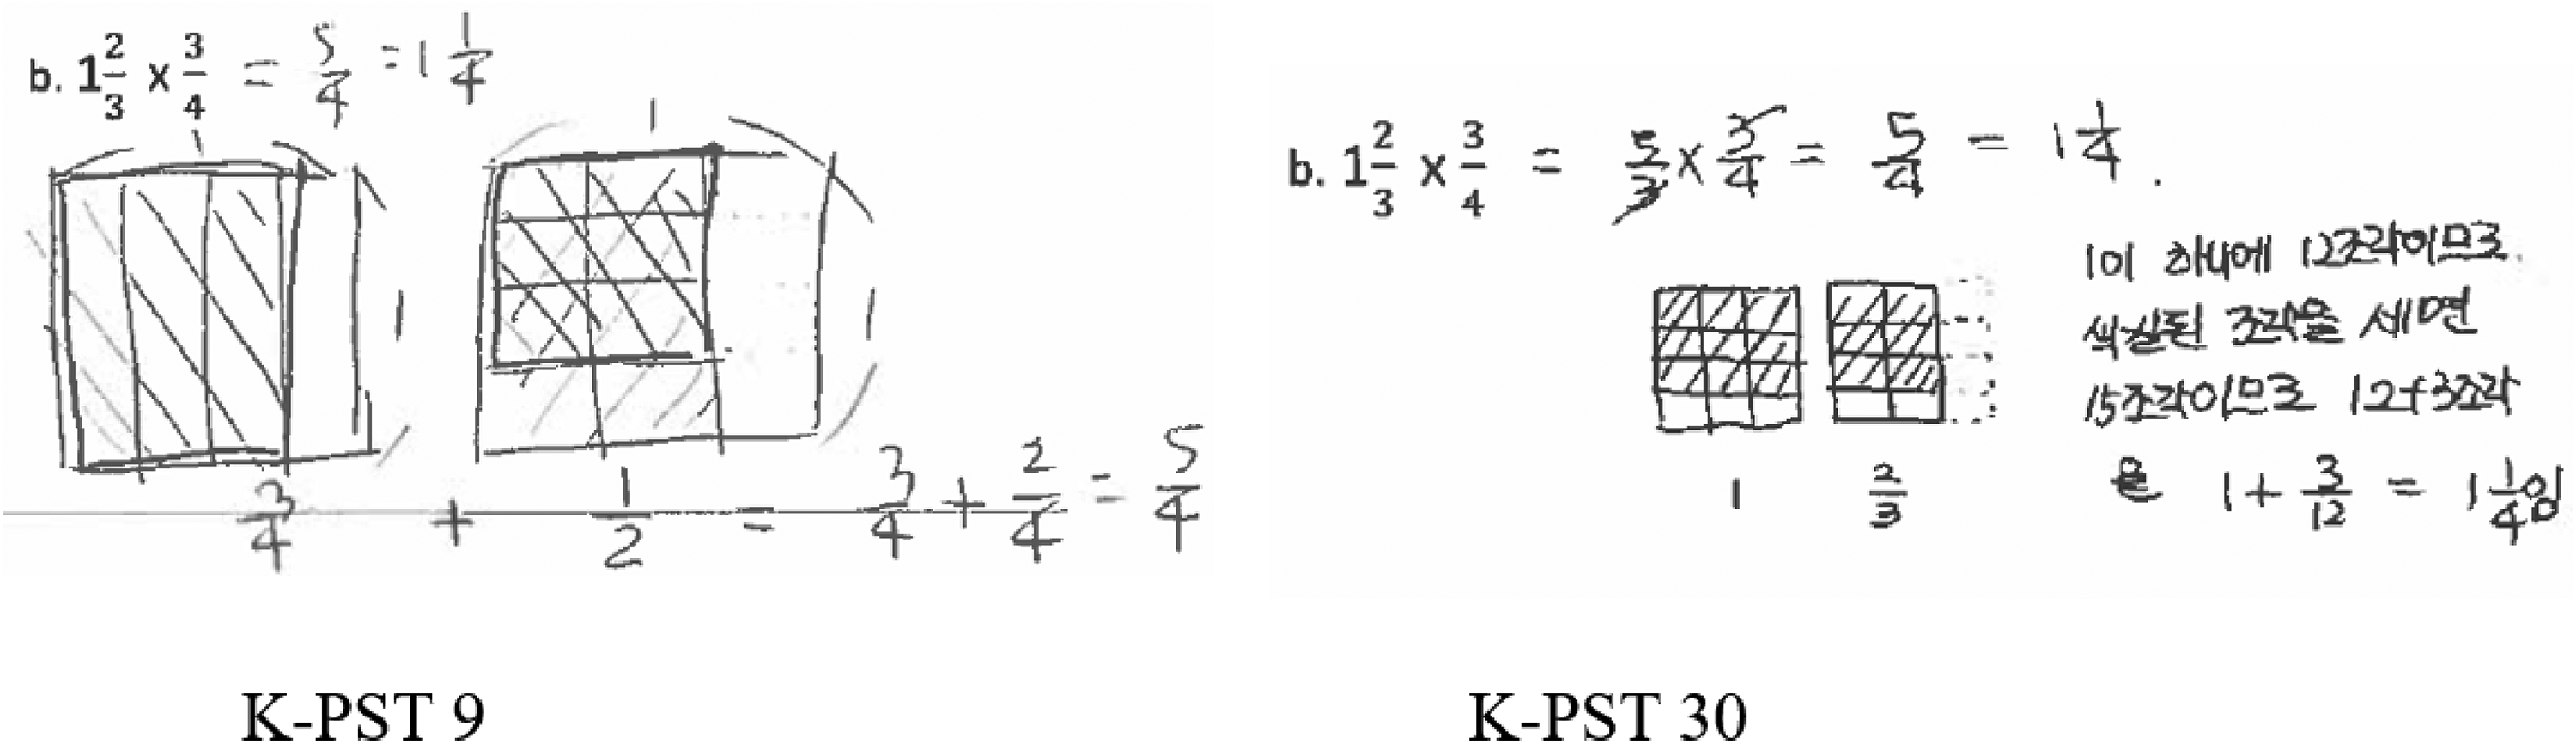
The effectiveness of using the multiplication property became evident once again in the strategies adopted by Korean PSTs when solving Q:9, 1
The example from K-PST 9 in Figure 3 showcased that the first rectangle symbolized 1 ×
Turning to the division aspect (Q:10 & Q:11), a notable finding emerged, indicating that Korean PSTs demonstrated a greater proficiency in the partitive division model than the measurement model, while their U.S. counterparts excelled with the measurement concept of division rather than the sharing context (refer to Table 5). The percentage of accurate diagrams for Q:10 (5 ÷
Percentage of correctly represented diagram between the U.S. and Korean PSTs.
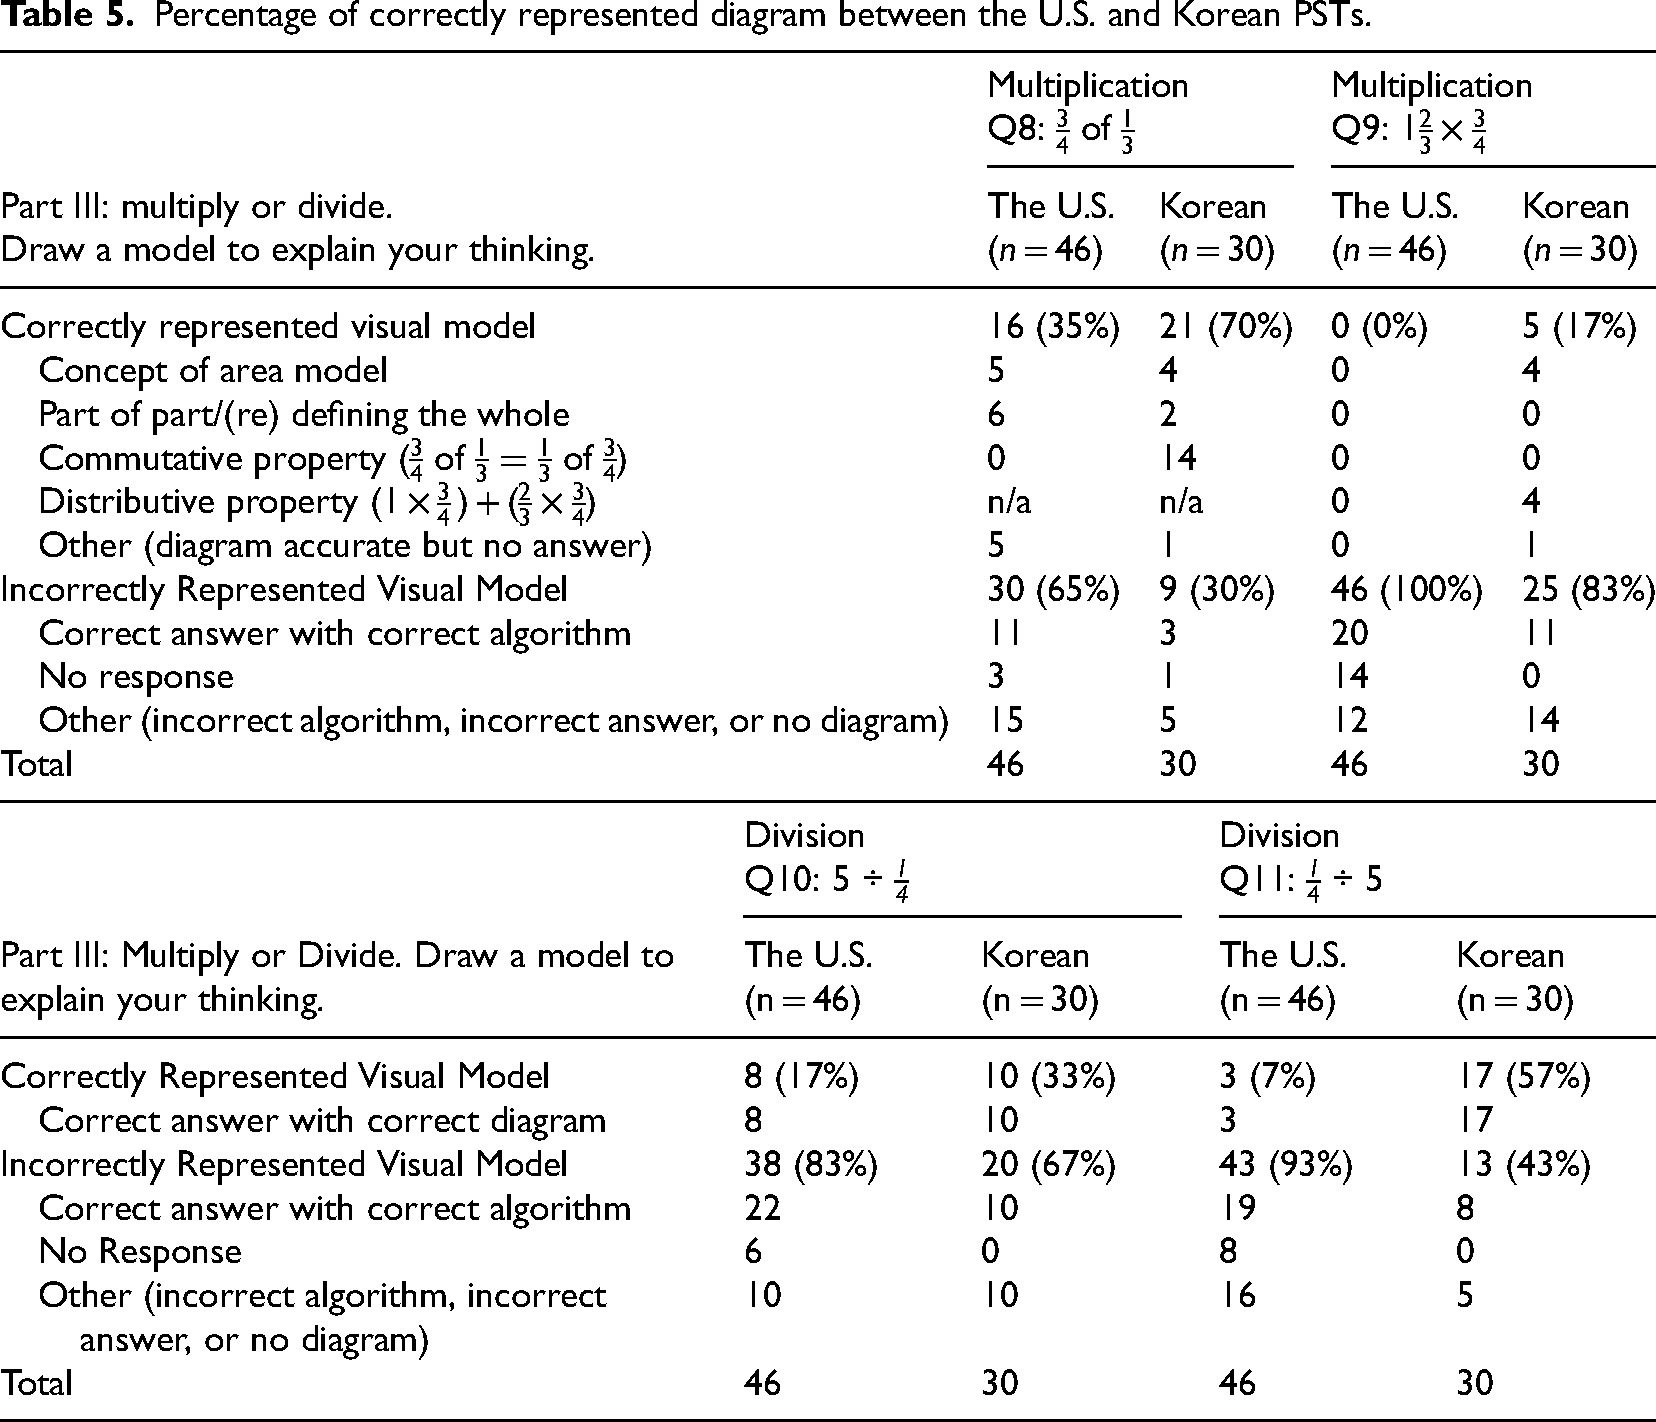
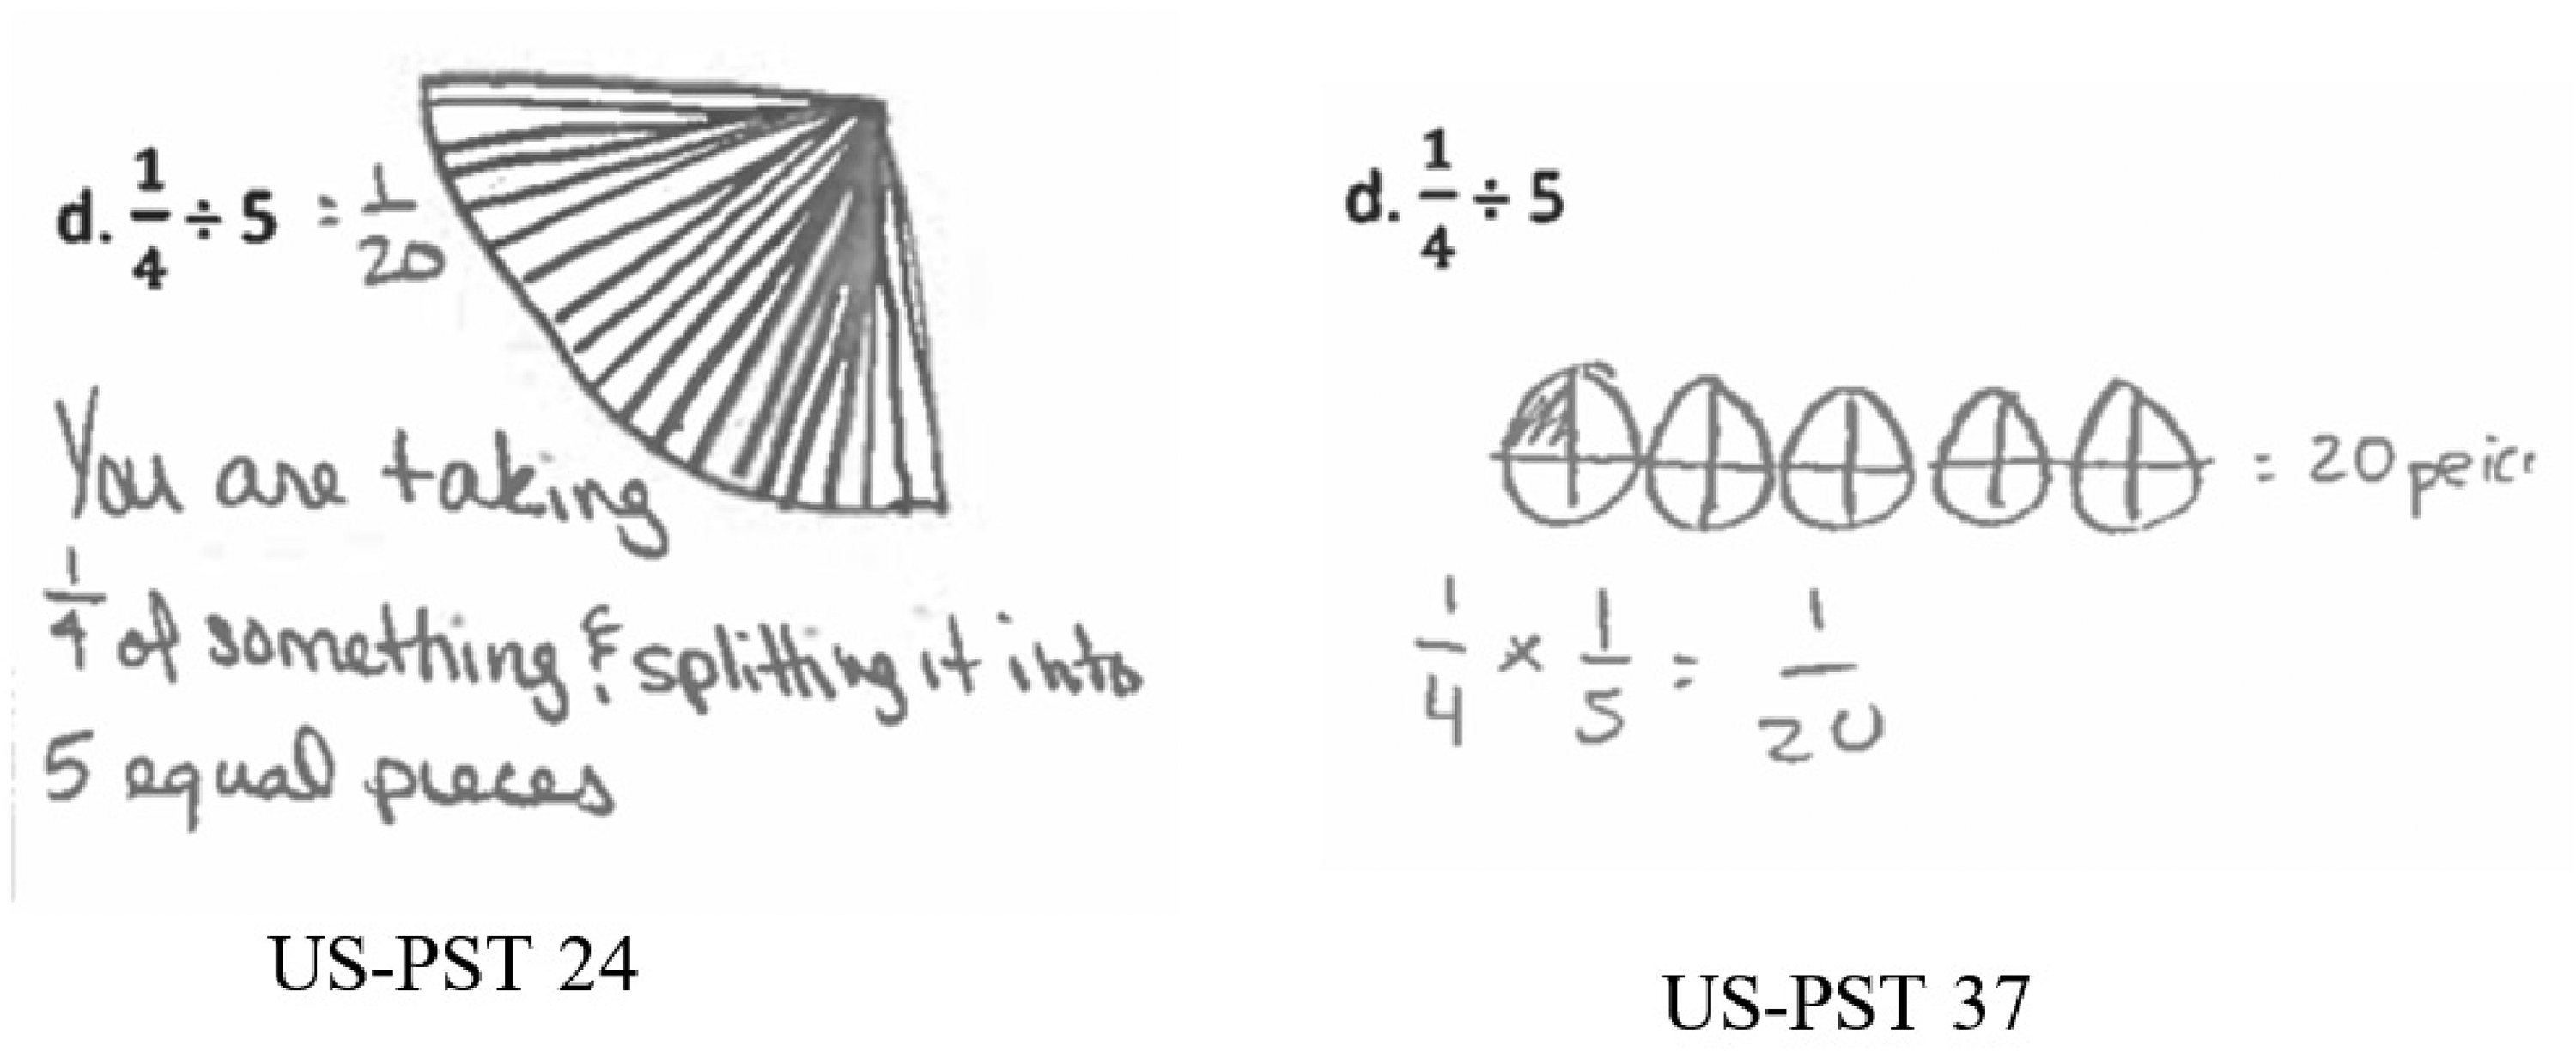
A more significant disparity between the two groups was observed in the percentage of correct visual models for the task of Q:11 (
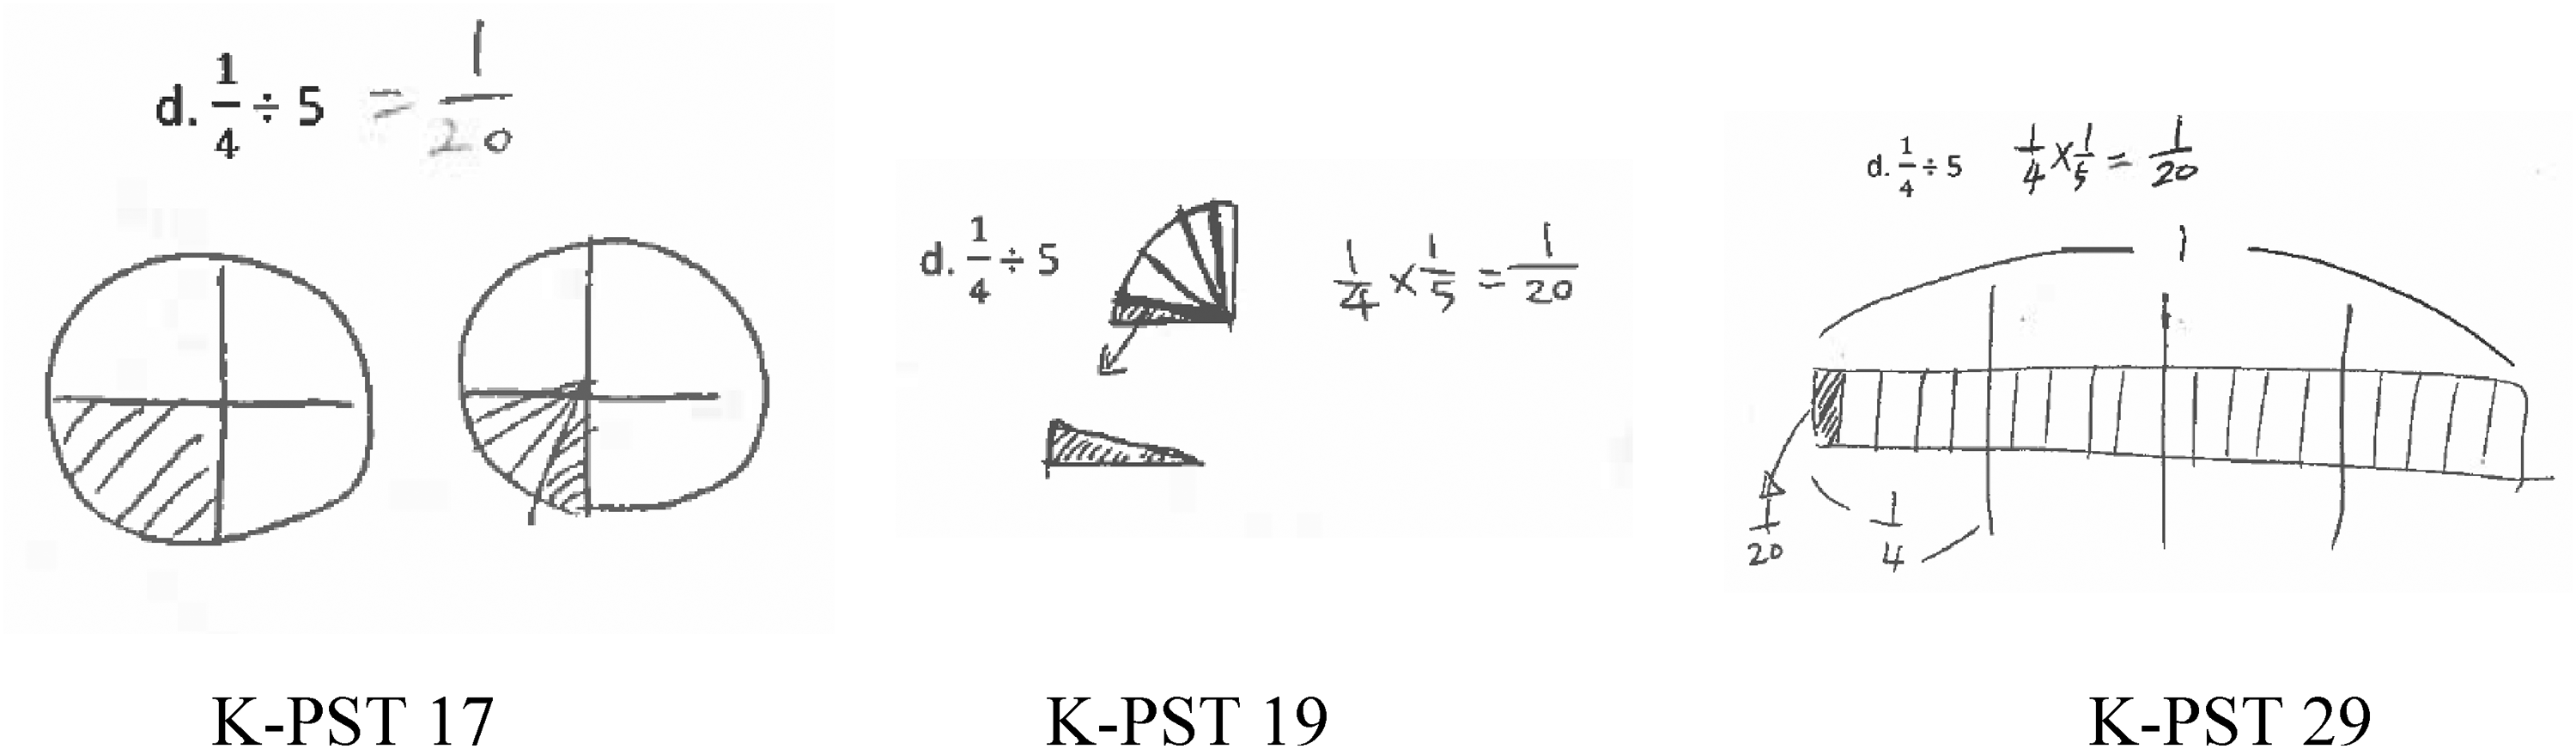
Successful examples of accurate visual model for
When contrasting these accurate visual representations with incorrect depictions that yield the correct answer through algorithms, the significance of accurately representing one whole becomes more apparent. Figure 5 serves as an example, illustrating a correct answer paired with an inaccurate diagram.
Examples of inaccurate visual model paired with accurate answer from the U.S.-PSTs.
When looking at the example of U.S.-PST 24, the verbal explanation appeared reasonable, but the visual representation did not distinctly convey the concept of ¼ in relation to one whole. The circular sector presented in the diagram lacked clarity regarding whether it represented the entire one whole or specifically ¼. If U.S.-PST 24 intended to portray the circular sector as one whole, the diagram could be deemed accurate because it was divided into 20 equal parts, despite the unclear representation of ¼ in the picture. However, if one interprets the presented circular sector as ¼ (a shape commonly used to represent ¼ of a whole circle), the diagram becomes inaccurate because ¼ should be divided into five parts, not 20. Consequently, this diagram was coded as incorrect due to its ambiguous representation of the whole (1) in the fractional context. Similarly, the diagram of U.S.-PST 37 deemed incorrect as well, as the depiction of the whole (1) in a fractional context lacked clarity as well. It remained ambiguous whether the shaded portion represented ¼ of a single circle (meaning one whole), or ¼ of 5 circles. When the fractional part is defined in relation to one whole, the shaded area in this example becomes unclear because the whole was not defined in the picture. Thus, it was also coded as an incorrect visual representation.
The present study aims to conduct a comprehensive comparative analysis of the fraction multiplication and division strategies employed by elementary PSTs in the United States and South Korea.
(Research Question 1) In terms of overall performance, Korean PSTs outperformed their counterparts in tasks involving fraction multiplication and division across all three domains of varying levels of cognitive demand (Stein et al., 2009). Despite the superior performance of Korean PSTs in these tasks, a detailed analysis of each task component reveals similarities. PSTs from both countries excelled in tasks with lower cognitive demands, such as working on the tasks, while facing greater challenges with tasks requiring higher cognitive levels, particularly in creating visual representations. For instance, solving fraction problems to determine correct answers was primarily classified as procedural knowledge, lacking connection to the meaning of multiplication and division (Stein et al., 2009), with Korean PSTs demonstrating stronger proficiency (94% correct answers) compared to their U.S. counterparts (74% correct answers). However, their proficiency decreased significantly with tasks of higher cognitive demand, such as creating visual representations, with only 44% of Korean PSTs and 15% of U.S. PSTs answering correctly. Notably, although Korean PSTs demonstrated a high accuracy rate of 94% in solving problems, only 44% were able to represent conceptual understanding with correct visuals. This finding is aligned with the previous research findings, addressing that the division of fractions remains the most challenging aspect, particularly in accurately representing diagrams (e.g., Lee et al., 2012; Lee & Lee, 2019; Luo et al., 2011; Son & Lee, 2016).This finding faced by high-performing Korean PSTs in illustrating diagrams highlights a crucial point: procedural competency alone does not guarantee a deep conceptual understanding of the meaning of fraction operations or an insight into the underlying rationale of the algorithm. One plausible explanation could be the limited exposure of PSTs to utilizing visual illustrations beyond algorithmic procedures. Such limitations in experience may be attributed to deficiencies in the college curriculum or the textbooks used to prepare future educators. Consequently, it becomes imperative for future research to investigate the alignment between PST training curricula and the content requirements essential for fostering comprehensive conceptual understanding.
(Research Question 2) The strategy analysis revealed that two groups of PSTs demonstrate different conceptual interpretations for the same equation. For instance, for posing problems of 3 × ½, the most commonly utilized concept by U.S. PSTs was repeated addition (3 groups of ½), with 87% of their correct story problems reflecting this concept. In contrast, only 17% of the Korean PSTs’ correct story problems were based on repeated addition concept. For the Korean PSTs, the predominant concept used in this task was the division (3 ÷ 2) to create a story problem for 3 × ½. Seventy percent of Korean PSTs’ accurate story problems interpreted a multiplication equation as division concept to develop the story problem. The equations of 3 × ½ and 3 ÷ 2 yield the same mathematical answers but the context of the problems is not the same. The former represents three groups of one-half, while the latter means three whole(s) divided into two equal parts. The prevalent use of the repeated addition concept for U.S.-PSTs may be linked to the language used to interpret the equation. In English, when reading multiplication equations 5 × 2 is often read as five groups of two, meaning 2 + 2 + 2 + 2 + 2 and 3 × ½ is read as “3 groups of ½”, and naturally prompting a computational approach that involves adding ½ three times. However, Koreans may interpret 3 × ½ simply as 3 times ½ without necessarily associating it with the concept of three groups of ½ likely due to their mathematics textbook. In the Korean textbook (Korean Ministry of Education and Human Resources Development, 2015), the multiplication of fraction and whole number is addressed in the second semester of grade 5, with the repeated addition concept is appearing in Unit 2. According to the textbook (pp.32–34) repeated addition concept is illustrated with examples such as “¾ liter of water was poured three times and used up” “1¼ liter of water was poured three times and used up. How much water was used?” The textbook models these as “¾ × 3” for three groups of ¾ and “1¼ × 3” for three groups 1¼. This approach differs from the English expression “a groups of b”, and using repeated addition for 3 × ½ may not as intuitive in Korean as it is in English. It would be interesting to investigate how the responses might change when the equation were presented as ½ × 3 instead of 3 × ½.
Another plausible explanation for Korean PSTs’ using division (3 ÷ 2) for 3 × ½ is their computational proficiency. In Part II, Q5 presented a word problem requiring the algorithm for solving 9 × ½, and Korean PSTs achieved 100% accuracy. However, when asked to develop word problems for whole number × fraction tasks, they often converted the multiplication concept to division. Due to their strong computational fluency, Korean PSTs could find the answer to the equation 3 × ½ is 1 ½, it might have been easier to think about the context using 3 ÷ 2. Since there was no follow up interview with the PSTs, conducting interviews with them would provide a clearer explanation of the reasoning behind their approach.
The two groups’ differing visual representations of the same equations were another obvious distinction. For instance, in the most challenging task of illustrating visual models for ¾ of ⅓, the U.S. PSTs represented the visual representation that is aligned with the given equation, ¾ of ⅓. However, many Korean PSTs solved ¾ of ⅓ as ⅓ of ¾. Both tasks yield the same answer due to the commutative property, but the conceptual process and the visual representations are different. When solving ¾ of ⅓, PSTs first represent ⅓ of the whole then cut that ⅓ into four equal parts, creating 1/12 equal pieces, resulting in an answer of 3/12, (see examples in Figure 1). However, when the equation is switched as ⅓ of ¾, PSTs represent ¾ of the whole and divide this into three equal parts to represent ⅓. Since there are already three equal parts (3 groups of ¼), no further cutting is necessary, and it is easy to see that ⅓ of ¾ is ¼ (see examples in Figure 2). U.S.-PSTs might interpret the task as ¾ of ⅓, following their language structure. They would likely start by drawing ⅓ first and then find ¾ of the remaining ⅓. However, the Korean language does not follow the same structure, and the order of multiplication equation in Korean textbooks differ. When the task was translated into Korean, “¾ of ⅓” was not translated using a Korean term that signifies “of”; instead, it was provided as it is. As a result, it seems that Korean PSTs applied commutative property to make it easier to solve the problem. It is noteworthy to mention that since the task was presented as “of”, not “x”, from the perspective of U.S.-PSTs, it was interpreted as three-fourths of one-third instead of interpreting “of” as an operator of fraction of multiplication. This interpretation may have hindered the consideration of the commutative property of multiplication in their approach to the task.
The diversity of diagrams that the Korean PSTs employed was another visual distinction between the two groups. While the Korean PSTs’ diagrams varied from circles, rectangles, numbers lines to set models with groups of circles, the U.S. PSTs primarily employed area models with circles or rectangles in their successful visual representations. Furthermore, for ¾ of ⅓, the Korean PSTs represented the new unit independently. For example, if Korean PSTs shaded ¾ of the whole first, they drew ¾ as a separate shape to represent ⅓ of ¾ whereas the U.S. PSTs represented both fractions using the same whole. In the multiplication of fractions, the Korean's method eloquently illustrated the meaning of the part of the whole and the part of the part (the referent unit).
In terms of the most difficult task, which involved visualizing 1
In the meantime, a successful strategy that emerged in the division task was the clear identification of one whole and a fractional part within the problems. When solving division tasks (e.g., 5 ÷ ¼ or ¼ ÷ 5) among both groups of PSTs, those who clearly illustrated what constituted one whole in the task and how the fractional number related to the whole were able to produce accurate diagrams. Frequently, it was observed that several PSTs arrived at the correct answer using algorithms, but their illustrations did not align with the answer. In these cases, the presented diagram did not clearly depict the one whole in the task and failed to demonstrate how the answer was connected to the drawings or the fractional part.
Implication
The findings from this study suggest several implications for preparing PSTs to effectively teach fraction multiplication and division problems, which are acknowledged as the most challenging topic in elementary mathematics (Park et al., 2013). First, the superior performance of Korean PSTs underscores the significant need to broaden the knowledge of fractions beyond computational competency to build deeper conceptual understanding of fraction concepts for PSTs (Adu-Gyamfi et al., 2019). As highlighted in previous studies (Ball, 1990; Park et al., 2013) PSTs’ fractional knowledge is procedure-based. Korean PSTs, who successfully completed the tasks with algorithms, struggled to reason through for higher-level of cognitive demands. This emphasizes the necessity for meaningful discussions about the conceptual understanding behind the algorithm and its connection to the visual diagram. Teacher educators should encourage PSTs who demonstrate competency in algorithms to justify their solutions. The findings of the present study also suggest that PSTs should engage in discussion about the referent unit in the problem, importance of one whole in a fraction, connecting the symbolic algorithm with the visual representations, exploring various strategies, and more. This approach aims to deepen PSTs’ conceptual understanding and enhance their ability to reason through fraction multiplication and division problems.
Secondly, the findings on the performance of U.S. PSTs suggest that providing context in the problems of fraction multiplication and division is a crucial experience for PSTs. Despite the struggles of U.S. PSTs, particularly in the task of visual representations, the average rate of producing accurate diagrams was much higher when the division was presented using context and story problems compared to when it was presented with only a symbolic equation. Furthermore, presenting problems with a context may benefit English speaking students by providing broader interpretations in terms of language use (i.e., 3 groups of ½, one-third of one-fourth).
Thirdly, the comparative analysis strongly highlights that applying properties of multiplication and inverse operations should be emphasized when teaching fraction multiplication and division problems. The commutative and distributive properties, usually addressed in teaching whole number operations, are not focused on when working on fraction concepts. Additionally, multiplication and division are often taught separately, with multiplication proceeding division (Van de Walle et al., 2019). However, the present study demonstrates a crucial need to combine multiplication and division concepts to emphasize the inverse operation, as this approach led to higher proficiency among Korean PSTs. Furthermore, it was evident that the application of properties benefited Korean PSTs in solving the most challenging task in this study, which involved illustration representations (Q: 9, 1
Lastly, the implication of this study suggests a need to further investigate the prior experiences of PSTs in math classes preceding their methods course including the examination of textbooks and curriculum. Moreover, it is essential to explore whether PSTs need to take additional courses, training, or onboarding courses during their undergraduate studies to better prepare future educators as well as to meet the needs of students. This research can also serve to inform and prepare mentor teachers for the integration of new student-teachers in the classroom. Recognizing the common misunderstandings among PSTs regarding fraction multiplication and division, mentor teachers could offer more applicable experiences to PSTs to enhance their practice and instructional abilities.
Limitations and future research
The findings of this study are constrained by a limited sample size and lack of background information of PSTs, underscoring the need for a larger and more diverse participant sample to bolster the study's robustness. Moreover, expanding the scope and sequence of the task levels within each category could offer valuable insights. For example, incorporating tasks aimed at fostering conceptual understanding of whole number division or conducting a comparative analysis of fraction content within the curricula of both countries could yield further insights. It is anticipated that future research endeavors will contribute to enhancing PSTs’ conceptual grasp in this domain of mathematics. Such understanding is pivotal in guiding PSTs with the requisite pedagogical tools to effectively teach the most challenging topics in elementary school mathematics when instructing their future students.
Footnotes
Contributorship
Hyun Jung Kang conducted the research and drafted the article. Grace Breiten substantially revised the literature review. Both authors read, edited and approved the manuscript and approved the final article.
Declaration of conflicting interests
The authors declared no potential conflicts of interest with respect to the research, authorship, and/or publication of this article.
Funding
The authors received no financial support for the research, authorship, and/or publication of this article.
Informed consent
All participants in the study provided informed consent.