
Abstract
This small-scale comparative study investigated Spanish and Turkish middle school students’ mastery of four core cognitive skills required for proportional reasoning using the log-linear cognitive diagnosis model. We compared students in the two samples for their proportional reasoning and provided a diagnostic assessment of their strengths and weaknesses. The study included 314 Spanish eighth grade and 282 Turkish seventh grade students. The students were administered a proportional reasoning test with 22 multiple-choice items. We found significant differences between the two samples in two of the cognitive skills. While the Spanish sample were better at understanding nonproportional relationships, the Turkish sample were better at understanding the concept of ratio. Furthermore, while the Spanish sample had a more dispersed distribution of students among different attribute profiles, the Turkish sample mostly consisted of either low-performing or high-performing students. To better understand the similarities and differences between the two samples, we compared students’ performance on some specific test items. The study shows how cognitive diagnostic models, which are not widely used in small-scale comparative studies, can be very useful in revealing similarities and differences between two samples that cannot be detected by traditional psychometric models.
Keywords
Introduction
Manzon (2011) defines comparative education as “an interdisciplinary subfield of education studies that systematically examines the similarities and differences between educational systems in two or more national or cultural contexts” (p. 215). Postlethwaite (1988) provides four different purposes of comparative education with one of them being “describing similarities and differences in educational phenomena between systems of education and interpreting why they exist” (pp. xix–xx). Stigler et al. (2000) state that “cross-cultural comparison is a powerful way to unveil unnoticed but ubiquitous practices” (p. 88). Some researchers (e.g., Cai, 1995; Cai et al., 2016) also pointed out the importance of conducting comparative studies in the domain of mathematics education.
While some comparative studies use results from large-scale international studies such as Trends in International Mathematics and Science Study (TIMSS) (e.g., Şen & Arıcan, 2015), others use these results in order to compare instructional practices among different countries (e.g., Bokhove, 2022). Moreover, some studies can be narrower oriented, focusing only on particular topics or concepts (e.g., Chin & Lin, 2009). Proportional reasoning is one of the important skills in mathematics education. The use of proportional reasoning techniques for problem-solving is present (sometimes without any explanation) in many ancient mathematical texts (Oller-Marcén & Gairín, 2015). Furthermore, the relevance of proportional reasoning is justified by the important and extensive real-life applications (Cramer & Post, 1993) and by the presence of this skill in the official curricula and textbooks of primary and secondary education throughout the world (Lo et al., 2001; Lundberg, 2011; Martínez-Juste et al., 2017; National Council of Teachers of Mathematics [NCTM], 2000).
Considering the importance and ubiquity of proportional reasoning, it is important to conduct international comparative studies focusing both on the treatment of this skill in different countries and on the students’ possible similarities or differences according to their performance, developmental trends, etc. In relation to the former, there are several cross-national comparisons of textbooks focusing on proportional reasoning. For instance, Lo et al. (2001) compared textbooks from Japan, China, Chinese Taipei, and the United States finding many differences in terms of definitions of concepts, types of problems, and sequencing. Meanwhile, Ponte and Marques (2011) compared some grades 6 and 7 textbooks from Portugal, Brazil, Spain, and the United States, and among other results, they obtained that “in the Portuguese, Brazilian, and American textbooks the notion of ratio plays an important role, but it does not happen in the Spanish textbook” (p. 46). Similarly, Incikabi and Tjoe (2013) compared the types of proportion and ratio problems presented in Turkish and American textbooks and reported that “the US textbooks included fewer pure mathematics problems but more real-life-application problems than Turkish textbooks” (p. 8).
In terms of students’ proportional reasoning, there are studies showing that certain phenomena, like the so-called “illusion of linearity,” are common in many different countries (e.g., Fernández et al., 2012; Modestou & Gagatsis, 2007; Van Dooren et al., 2009). However, studies explicitly comparing the performance of students from different countries in this context are less common. In this regard, it is worth mentioning the work by Jiang et al. (2017) who compared 925 Chinese and Spanish fourth to eighth graders’ responses to a test of 8 missing-value word problems (4 proportional and 4 additive). Their findings indicated differences between Chinese and Spanish students’ development of additive and proportional reasoning. Moreover, Jiang et al. (2017) reported that “number structure and nature of quantities had a different impact on each country” (p. 551).
The proportional reasoning research conducted in Spain and Turkey (e.g., Arıcan, 2018; Arıcan, 2019; Atabaş & Öner, 2016; Valverde Soto & Castro Martínez, 2009) shows that both Turkish and Spanish middle school students have similar difficulties understanding ratio, proportion, and proportional relationship concepts. In fact, as we will later show, the treatment of ratio and proportion topics in middle school curricula is very much similar in both countries. However, according to Schubring (1987), “teaching practice is not so much determined by ministerial decrees and official syllabuses as by the textbooks” (p. 41). In this respect, we have pointed out above that an indirect comparison of Turkish and Spanish textbooks reveals some similarities, but also certain differences, in their treatment of proportionality. This apparently conflicting situation motivates the interest of comparing Spanish and Turkish students’ proportional reasoning.
In the current study, Spanish and Turkish middle school students’ proportional reasoning was compared through applying a multidimensional test with 22 multiple-choice items that examined their mastery of four key cognitive skills: understanding the concept of ratio; understanding directly proportional relationships; understanding inversely proportional relationships; and understanding nonproportional relationships. In addition to being important for solving ratio and proportion problems, these four skills are the central aspects on which the mathematics curriculum is built around proportional reasoning in both countries. Moreover, the proportional reasoning test was designed from a log-linear cognitive diagnostic model (LCDM) perspective (Henson et al., 2009), which is a form of cognitive diagnostic models (CDMs). The study shows how CDMs, which are not widely used in small-scale comparative studies, can be very useful in linking similarities and differences in distribution of students’ profiles to similarities and differences in national curricula of two countries. Investigating students’ proportional reasoning by applying CDMs could demonstrate how multidimensional psychometric methods are more sensitive to these similarities and differences than traditional unidimensional models. Additionally, CDMs allow us to provide a diagnostic assessment of students’ strengths and weaknesses in terms of their proportional reasoning.
To accomplish the abovementioned objectives, this study provides a two-level comparison of Spanish and Turkish middle school students’ proportional reasoning:
First, we compare Spanish and Turkish students’ mastery of four core cognitive skills required to solve ratio and proportion problems by applying a proportional reasoning test developed for diagnostic assessment. Second, we compare the performance of students in the two countries on some specific test items. To do this, we provide possible interpretations of the similarities and differences of the two samples in terms of some item characteristics such as context, type of the items, and representations.
Conceptual framework
In this section, we synthesize some key aspects of proportional reasoning, provide a description of CDMs, and present our purpose for using the LCDM in analyzing students’ proportional reasoning.
Proportional reasoning
The development of proportional reasoning covers a long-time interval and involves both qualitative and quantitative methods of thought as well as the comprehension of the sense of covariation between quantities (Lesh et al., 1988). Proportional reasoning is also related to the understanding of concepts such as whole-number multiplication (Hino & Kato, 2019), rational numbers (Lamon, 2007), multiplicative structures (Vergnaud, 1983), and functional modeling (De Bock et al., 2017; García et al., 2006).
In order to demonstrate competence in proportional reasoning, students should be able to identify multiplicative relationships (direct and inverse) presented in proportion problems, as well as to distinguish them from nonproportional relationships (Lim, 2009; Orrill et al., 2017). They should also have the ability to solve proportion tasks and aptitude to make arguments and deductions in a comprehensive way in proportional situations (Lamon, 1993, 2007). In addition, students should be able to represent multiplicative relationships using a variety of mathematical representations such as verbal (2 dogs for every 7 cats), symbolic–algebraic (2:7, 2/7, f(x) = 2x/7), iconic, tabular and/or pictorial (including function graphs), and so forth (Arıcan, 2021; Bayazit, 2013; Martínez-Juste et al., 2015). The current study examined students’ mastery of the four key cognitive skills cited above due to their crucial role in reflecting proportional reasoning competence.
Below, we elaborate on some central concepts related to proportional reasoning. As we will elaborate on the Methods section, the four key cognitive skills were developed in connection with these central concepts.
Ratio and rate
Lobato et al. (2010) define ratio as a “multiplicative comparison of two quantities, or it is a joining of two quantities in a composed unit” (p. 12). For instance, if we compare heights of two children by forming a ratio, the multiplicative relationship between their heights shows how much taller or shorter one child is than the other. Moreover, a ratio also can be formed by joining two quantities. For example, in the context of an athlete running 100 m in 10 s, the statement 100 m in 10 s forms a ratio that has a new unit namely speed. On the other hand, rate is defined as “a set of infinitely many equivalent ratios” (Lobato et al., 2010, p. 42). Contrary to the common definition of rate, which is comparison of two quantities with different units, quantities forming a rate can have the same or different units. For instance, in the context of mixing 3 cups of water and 2 cups of lemon juice to make lemonade, calculating the amount of lemon juice concentrate for any amount of water demonstrates comprehension of the rate concept.
Lamon (1993) distinguishes two types of semantic problems: well-chunked measures (if the rate has its own meaning as a quantity of an intensive magnitude) and associated sets (otherwise). Moreover, regarding to the concept of ratio, Lamon (1993) also distinguishes two semantic types of problems: stretchers and shrinkers (usually related to geometric contexts) and part–part–whole (in which two, or more, additive homogeneous magnitudes combined to add a whole). In this last case, we can consider part–part and part–whole ratios.
Proportional relationships
Another key element of proportional reasoning is the multiplicative structure underlying the problem situations (Vergnaud, 1983). The multiplicative structure includes simple direct proportion situations (Karplus et al., 1983; Lamon, 1993; Singh, 2000b; Van Dooren et al., 2008) but also inverse and multiple proportion situations (Arıcan, 2018; Levain & Vergnaud, 1995). There are two multiplicative structures that lead to the understanding of directly and inversely proportional relationships. The first structure is isomorphism of measures, which appears in situations of direct simple proportion and provides meaning to the quotient of magnitudes. The second is product of measures that provides meaning to the product of magnitudes, especially if they are extensive (Vergnaud, 1983). These two elements are, in fact, essential to describe the situations of inverse proportion and, more generally, those of multiple proportions (Arıcan, 2018).
From a mathematical point of view, proportionality organizes phenomena modeled by relatively simple functions such as f(x) = kx in the case of direct proportion and f(x) = k/x in the case of inverse proportion. Generally, situations of multiple proportions (that may involve direct and inverse relationships between pairs of quantities) can be modeled by homogeneous functions of the form f(x1,…,xn) = k
Once a directly proportional relationship has been formed between two quantities, we may distinguish between within or between ratios (Freudenthal, 1983), that are central to characterize and recognize proportional relationships in terms of the processes of invariance and constancy. For example, let us consider a linear function, f, between the quantities x and y, such as y = f(x) = kx. Then, a within ratio x1/x2 remains invariant (x1/x2 = f(x1)/f(x2)), and the between ratio f(x)/x equals to a constant (f(x)/x = k). Therefore, a between ratio in a linear function, f(x) = kx, generates the constant of proportionality, k.
To promote the development of proportional reasoning, students must face different types of rich and nonroutine tasks (Singh, 2000a). A widely used classification of proportionality tasks (Cramer & Post, 1993) is based on the distinction between missing-value problems and comparison problems (either quantitative or qualitative). This classification is usually restricted to direct proportion situations but can be extended not only to inverse proportion situations but also to multiple proportion situations (Martínez-Juste et al., 2017, 2019). In missing-value problems, three of the four values are given and students were asked to determine the missing value (Lamon, 2007). In comparison problems, two ratios are compared to determine if they are equal, or whether one is greater or less (Lobato et al., 2010).
Nonproportional relationships
Teaching should incline students toward multiplicative reasoning by making them work within different proportional structures, but also should provide them the opportunity to apply multiplicative reasoning critically. One way to achieve this goal is to allow students to work with nonproportional relationships (Van Dooren et al., 2008).
Modestou et al. (2008) point out the tendency toward the inadequate use of linear models in perimeter, area, and volume problems, which involve not only linear, but also affine, quadratic, and cubic relationships among quantities. This overuse of linear models is rather common, and it is usually referred to as “illusion of linearity” in the literature (Van Dooren et al., 2005, 2009). In order to control this phenomenon, working with affine relationships can be helpful, especially in the case of middle school students due to their cognitive stage (Fernández et al., 2012).
Cognitive diagnostic models
Traditional psychometric models provide a single score for a continuous estimation of examinees’ overall ability of a subject such as mathematics (Bradshaw & Templin, 2014). However, these methods are limited in the sense of providing diagnostic feedback on multiple dimensions of examinees’ cognitive ability. Hence, in the field of educational and psychological measurement, there has been a continuously growing attention on statistical models with latent variables that allow “multidimensional classifications of respondents for the purpose of a fine-grained diagnosis” (Rupp & Templin, 2008, p. 220). CDMs are a family of psychometric models that have been designed for this diagnostic assessment purpose (Rupp et al., 2010).
Instead of measuring an overall mathematics ability, CDMs break mathematics down into a set of skills (usually called attributes) and classify examinees as master or nonmaster of these skills based on their responses to the given items. An attribute is a categorical latent trait that we want to estimate. The critical step in CDMs is to specify attributes. Tatsuoka et al. (2016) stated that two conditions should be satisfied when specifying attributes: attributes should capture fine-grained understanding, and they should be workable. The four core cognitive skills that were presented in the introduction are critical for developing proportional reasoning (as shown in the theoretical framework section). Hence, the attributes provide fine-grained understanding for students’ proportional reasoning, and they are workable since there exists many researches on them. Therefore, the purpose of CDMs is to offer diagnostic feedback regarding these carefully defined attributes (Bradshaw et al., 2014).
The view of development that underlies the assumptions of CDMs “is more consistent with the nature of proportional reasoning by Lesh et al. (1988)” (Tjoe & de la Torre, 2014, p. 238). The current study uses the LCDM to investigate Spanish and Turkish middle school students’ mastery of four attributes. The LCDM was designed as an effort to extend a general diagnostic model (Von Davier, 2005) to include latent variable interaction effects (Bradshaw & Templin, 2014). We used the LCDM to compare students’ proportional reasoning because it allows for a mix of items in which there are and are not interactions between attributes. A second reason is that the LCDM provides “empirical information regarding a reasonable model” (Henson et al., 2009, p. 208) (see Table 4 for the selection process of a reasonable model). If, for instance, we consider an item measuring two attributes (

To achieve the previously introduced research objectives, we carry out a cross-sectional study with exploratory and descriptive purposes. Furthermore, as we will elaborate below, we adopt a quantitative approach both for the data collection and analysis (Bradburn & Gilford, 1990).
The students’ curricular background
In both countries, students are introduced to the ratio concept for the first time in sixth grade. In Turkey, the national mathematics curriculum (Turkish Ministry of National Education [TMNE], 2018) necessitates students to use the ratio concept (and its different representations) to compare quantities, the computation of ratios of two quantities (with the same or different units), and the work with part–part and part–whole ratios (see Table 1). The Spanish sixth grade national mathematics curriculum (Spanish Ministry of Education, Culture and Sports [SMECS], 2015) only introduces the use of the “rule of three” to solve real-life direct proportion problems. In Turkey, students are introduced with proportions in seventh grade. On the other hand, the Spanish curriculum provides proportion instruction in seventh and eighth grades together. The fact that the Spanish curriculum does not explicitly state which contents must be addressed in seventh or eighth grade obliged us to compare seventh grade Turkish students with eighth grade Spanish students. Therefore, we can be certain that primary instruction on ratio and proportion was complete in each country.
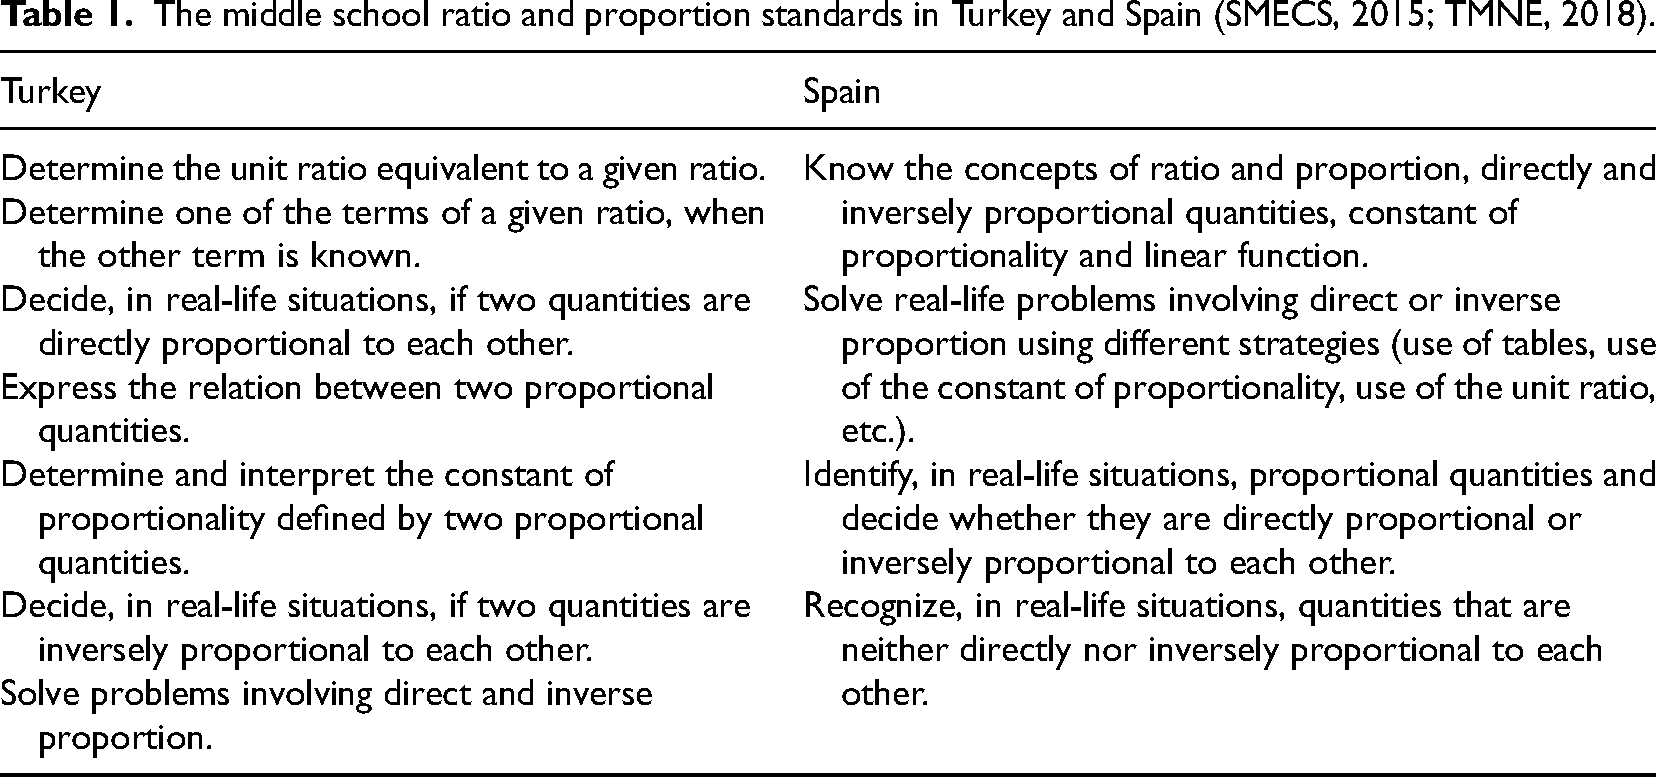
The middle school ratio and proportion standards in Turkey and Spain (SMECS, 2015; TMNE, 2018).
The middle school ratio and proportion standards in Turkey and Spain (SMECS, 2015; TMNE, 2018).
A quick analysis of Table 1 shows that the curricular standards of both countries are very similar. They are articulated around the same main ideas: the concept of a ratio, working with direct proportional structures, working with inverse proportional structures, understanding nonproportional relationships, and solving daily-life problems. 1
Bradburn and Gilford (1990) point out that “studies of relatively small, localized samples in a small number of sites can also play an important role in comparative education” (p. 26). For this study, the convenience sample (Neuman, 2007) consisted of 596 students: 282 Turkish seventh grade students and 314 Spanish eighth grade students. As we stated above, in Turkey, ratio, proportion, and proportional relationships are taught in sixth and seventh grades while in Spain it takes up to eighth grade. Hence, all the participating students had already completed instruction about ratio and proportion before taking the proportional reasoning test. Finally, both the Spanish and Turkish samples consisted of students from a single district. The relative centralization of the two countries’ education systems, both of which follow a centralized national curriculum, implies that this is neither a concern nor a threat in terms of representability.
The development of the proportional reasoning test
The proportional reasoning test was developed by Arıcan (2019) following an LCDM perspective. The test included 22 multiple-choice items (see Appendix I) that took the key elements of proportional reasoning into consideration. The items involved understanding ratio and rate concepts, direct and inverse proportional relationships, and nonproportional relationships. Moreover, the test included items with different underlying structure (simple proportion, multiple proportions, and affine relations). In addition, the items included most of the semantic types of problems considered by Lamon (1993).
The test was specifically designed in order to measure middle school students’ mastery of the following four attributes:
A1: Understanding the concept of a ratio and determining the value of a quantity in a given ratio. A2: Understanding directly proportional relationships and solving problems involving this type of relationships. A3: Understanding inversely proportional relationships and solving problems involving this type of relationships. A4: Understanding nonproportional relationships and solving problems involving this type of relationships.
The four attributes were determined by examining relevant research, Turkish curriculum, and international standards (Arıcan, 2019). These attributes reflect competence in proportional reasoning, and their development follows concepts central to proportional reasoning (see Section 2.1). In particular, A1 refers to the concept of ratio, whereas A2 and A3 are related to the understanding of proportional relationships (both direct and inverse). On the other hand, A4 accounts for understanding of nonproportional relationships such as additive and affine relationships and distinguishing directly and inversely proportional relationships from nonproportional relationships. These attributes also reflect the main concepts that underpin curriculum standards in both countries (see Table 1). Further details about the design and validation of the test can be found in Arıcan (2019).
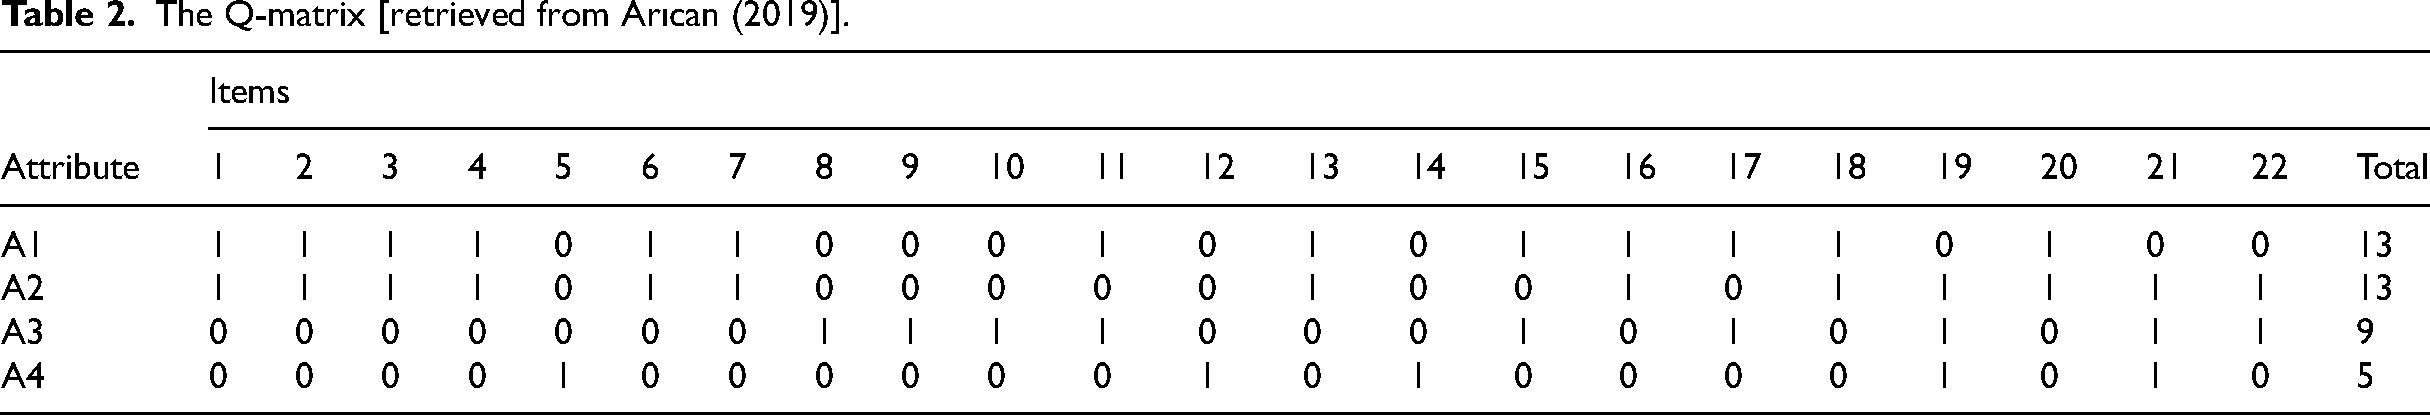
According to Arıcan (2019), the Q-matrix (Tatsuoka, 1985) that describes the alignment between items and attributes was obtained as a result of four mathematics education experts independently coding the 22 items in relation to their measured attributes. The Q-matrix is presented in Table 2, where a “1” entry represents that the attribute is measured by the item.
The Q-matrix [retrieved from Arıcan (2019)].
The Q-matrix [retrieved from Arıcan (2019)].
The test items can be further classified along two dimensions: representations and task context. Regarding the representations, we combine the categories described by Bayazit (2013) and by Martínez-Juste et al. (2015). Particularly, we consider verbal (V), symbolic-algebraic (S), tabular (T), and pictorial (P) representations. On the other hand, regarding the task context, we distinguish between intramathematical (IM) and nonmathematical (NM) contexts (Organization for Economic Co-operation and Development [OECD], 2004). Table 3 provides the description of each item according to these dimensions and categories.
Representations and task contexts involved in each test item.
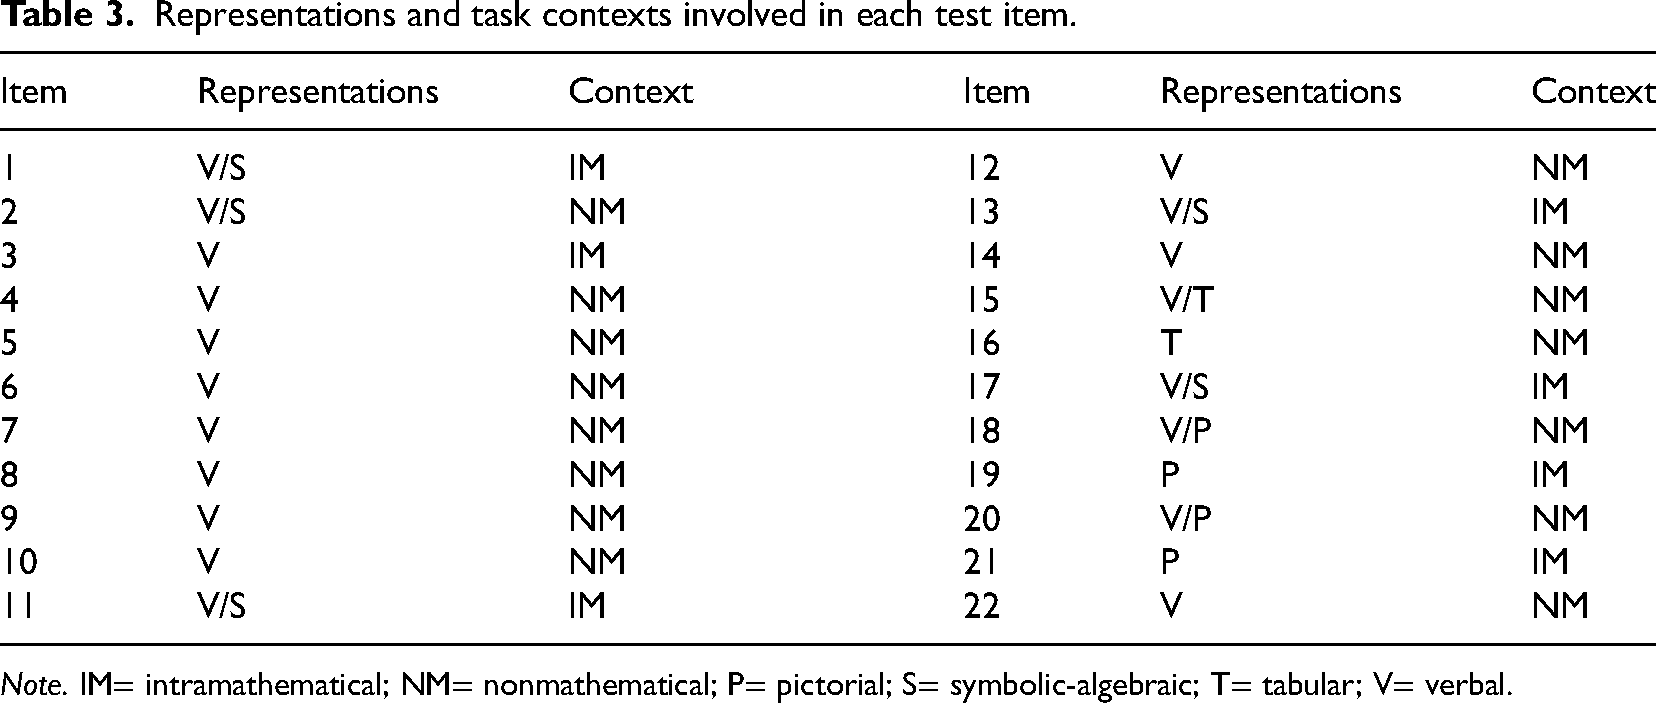
Note. IM= intramathematical; NM= nonmathematical; P= pictorial; S= symbolic-algebraic; T= tabular; V= verbal.
The frequency and distribution of the different representations and contexts among the items is very similar to that of textbooks and traditional teaching practices in two countries. These two variables were not explicitly taken into account during the development of the proportional reasoning test, but we believe they can provide useful information and insight during the detailed item-level analysis of the students’ responses.
In Turkey, the data were collected during the 2018 spring semester. The students were given 40 min to complete the test in person, and five preservice teachers assisted the researcher in collecting the students’ responses. On the other hand, in Spain, the data were collected during the 2020 spring semester. Due to the COVID-19 outbreak, the students were given 50 min to complete the test online using Google Forms 2 (10 additional minutes were granted in case there were technical issues), and the researcher collaborated with the students’ teachers in collecting all the responses. The data collection and analysis were performed separately in the two countries for comparison purposes and to get a better insight into the students’ attribute profiles. All the required permissions and consents were obtained, in both countries, prior to the test administration. This guaranteed that all the participating students did so on a voluntary basis. In each country, the test was administered in the corresponding language, and the only difference was that the names used in test items were adapted to be Turkish and Spanish names, respectively.
The students’ responses to the proportional reasoning test were coded dichotomously (0/1 for incorrect and correct responses, respectively). Using the Q-matrix and these coded responses, the data were analyzed using the Mplus 6.12 statistical software (Muthen & Muthen, 2011). Based on the number of attributes used, the LCDM estimates intercept, simple main effects, and interaction effects (see Equation 1). In the current study, we had four attributes and, since no item measured these four attributes simultaneously, we only had to consider one-way, two-way, and three-way log-linear structural model parameterizations in our LCDM model. The one-way structural model estimated the intercept and simple main effects. On the other hand, the two-way structural model estimated the intercept, simple main effects, and two-way interaction effects (e.g.,
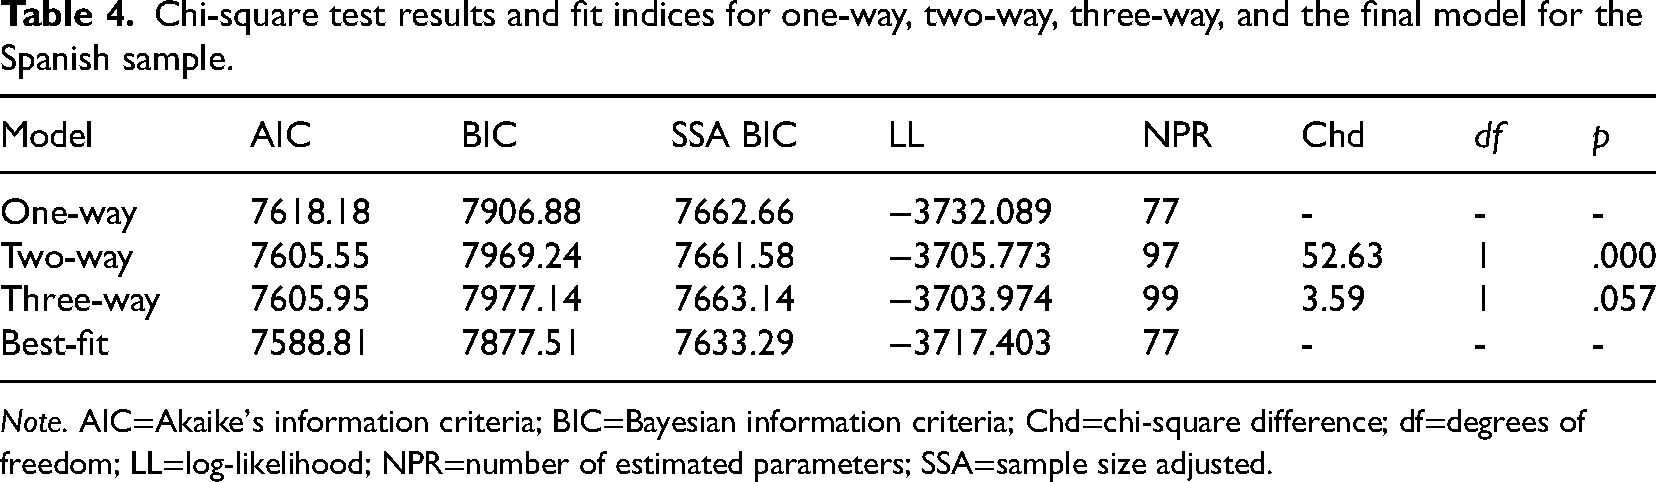
The first step of the data analysis was to determine the best-fit model. Arıcan (2019) reported that for the Turkish sample the two-way model fitted the data better than the one-way and three-way models. For the Spanish case, conducting a chi-square difference test using the log-likelihood values with the Maximum Likelihood Robust estimator (Satorra & Bentler, 2010), we compared one-way, two-way, and three-way models with each other (Table 4). In Table 4, a significant chi-square difference (p < .05) suggests that the larger model with more freely estimated parameters would better fit the data than the smaller model with less freely estimated parameters (Werner & Schermelleh-Engel, 2010). However, a nonsignificant chi-square difference indicates that both models fit the data equally well. In that case, the data estimation should be carried out using the model with smaller information model fit indices (i.e., Akaike's information criteria, Bayesian information criteria [BIC], and sample size adjusted BIC). The analysis suggested that the two-way model fitted the data better than one-way and three-way models. Moreover, again following Arıcan (2019), we removed one by one nonsignificant interactions and simple main effects from the two-way model by paying attention to the model fit indices at each step. Our best-fit model for the Spanish sample included 77 freely estimated parameters.
Chi-square test results and fit indices for one-way, two-way, three-way, and the final model for the Spanish sample.
Chi-square test results and fit indices for one-way, two-way, three-way, and the final model for the Spanish sample.
Note. AIC=Akaike's information criteria; BIC=Bayesian information criteria; Chd=chi-square difference; df=degrees of freedom; LL=log-likelihood; NPR=number of estimated parameters; SSA=sample size adjusted.
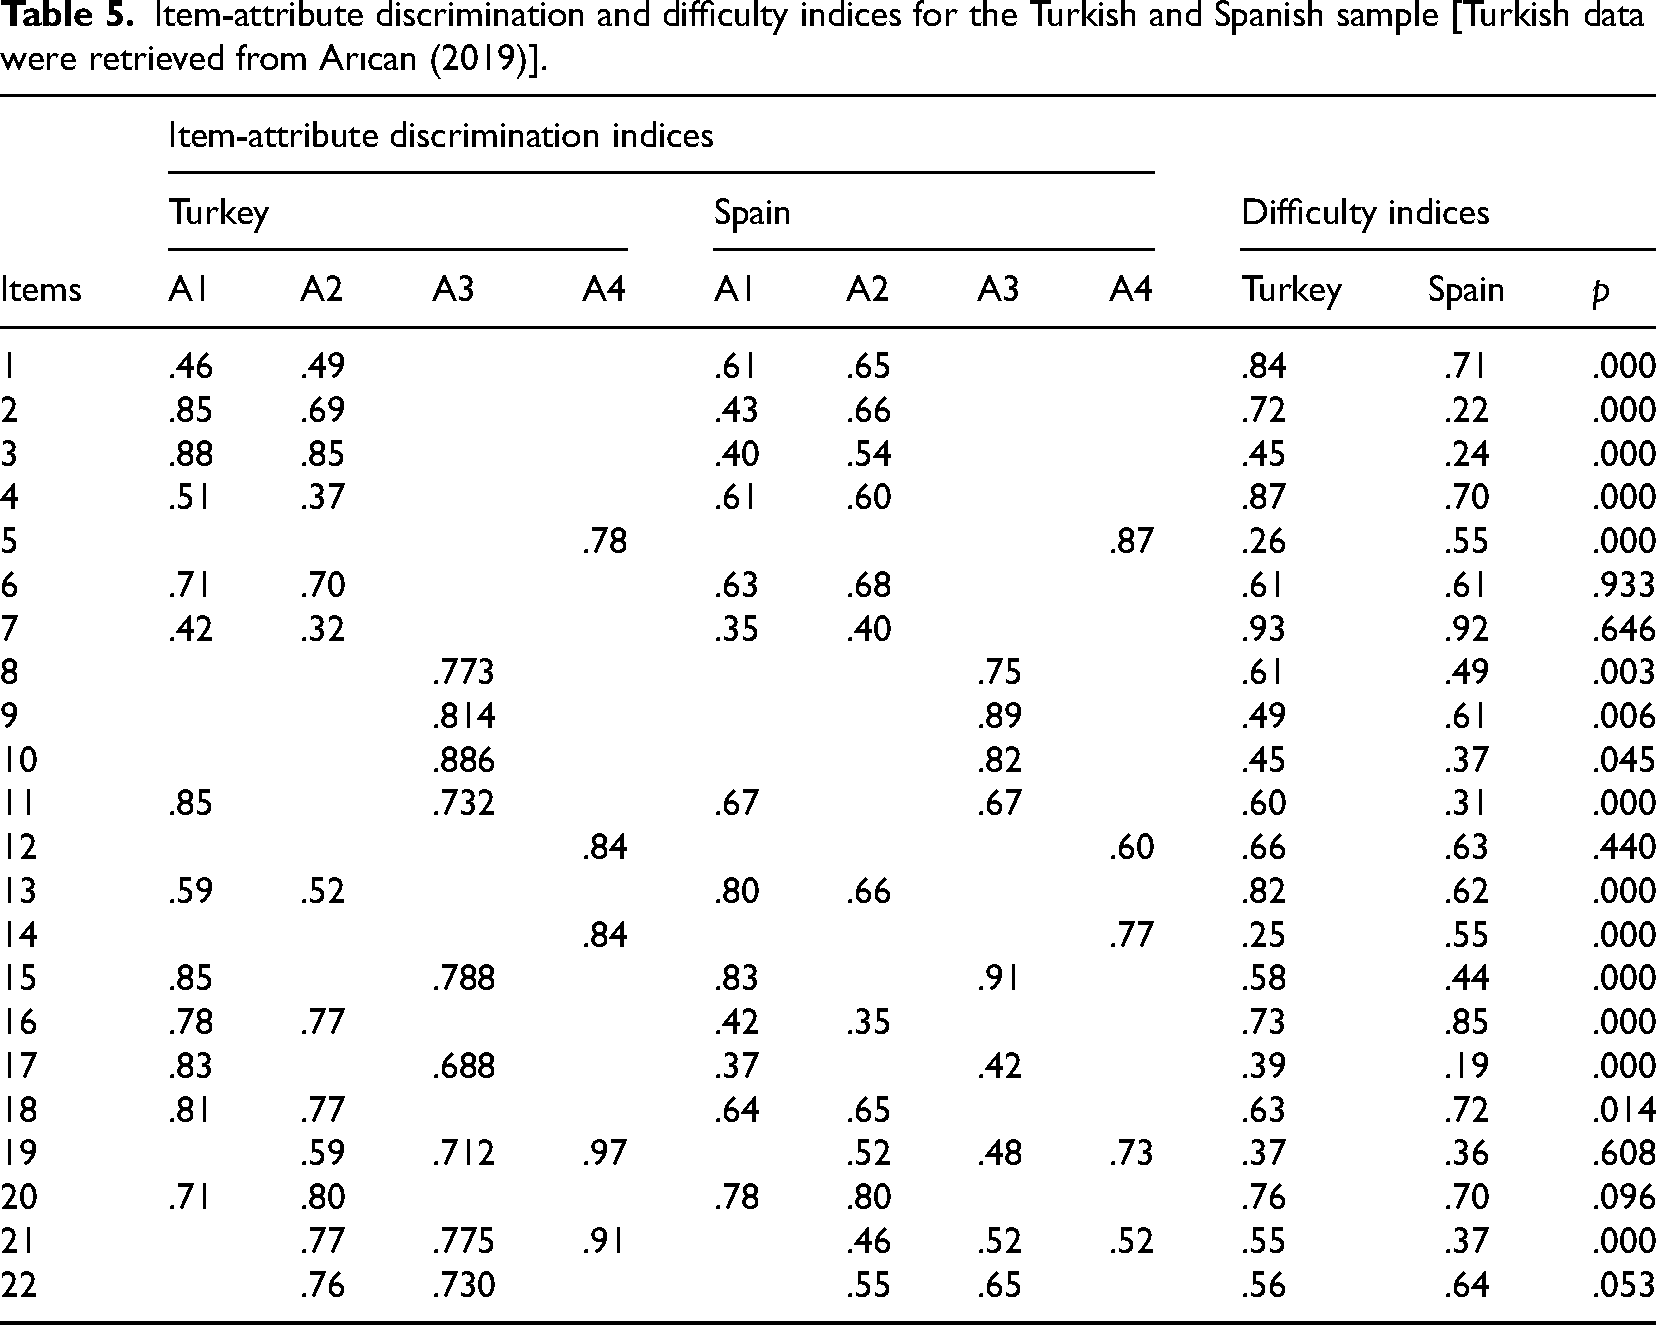
Item-attribute discrimination indices show how well an item discriminates between masters and nonmasters of the required attribute or attributes (Henson et al., 2008). An index value 0 indicates that masters and nonmasters of an attribute have the same chance for answering the item in question. On the other hand, an index value of 1 indicates that only masters of the attribute can answer that item, which shows perfect discrimination between masters and nonmasters. Although there is not a cut-score for determining poor discrimination indices, .30 and below usually suggest low discrimination indices (Arıcan, 2019; de la Torre, 2008). Therefore, Table 5 shows that overall, the items discriminated well between masters and nonmasters of the required attributes in both countries.
Item-attribute discrimination and difficulty indices for the Turkish and Spanish sample [Turkish data were retrieved from Arıcan (2019)].
Item-attribute discrimination and difficulty indices for the Turkish and Spanish sample [Turkish data were retrieved from Arıcan (2019)].
Table 5 presents item difficulty indices for both samples. Item difficulty index shows the proportion of those who answered an item correctly and ranges from 0 to 1. An index close to 0 indicates that the item is difficult and an index close to 1 indicates that the item is easy. As reported by Arıcan (2019), item difficulty index for the Turkish sample ranged between .25 and .93, with a mean of .59. In the case of Spain, item difficulty index ranged between .19 and .92, with a mean of .53. While items 5 and 14 turned out to be the most difficult items for Turkish students (being answered by only 26% and 25% of the students, respectively), Spanish students had most difficulty in answering items 17, 2, and 3. On the other hand, item 7 was the easiest one for students in both countries, being correctly answered by 93% and 92% of the students, respectively. Although this information is not included in Table 5, it is worth focusing on the most unanswered items (see Appendix II). In this regard, items 10 and 22 were left unanswered by around 18% and 16% of the Turkish students, whereas 12% and 7% of the Spanish students left unanswered items 3 and 17.
We have performed a Fisher exact test to compare the difficulty index in each item (grouping together incorrect and blank answers). The p values reported in Table 5 show that there were significant differences in students’ performances in two countries on 16 out of 22 items at a 95% confidence level. However, we should note that Spanish students performed better than Turkish students on only 5 of these 16 items.
The findings are presented in two sections: first, we compared the students in two countries in terms of attribute profiles that they belonged and attribute mastery status; second, we present an item-level analysis for selected items that provide valuable information about the two samples.
Attribute profile and attribute mastery comparison
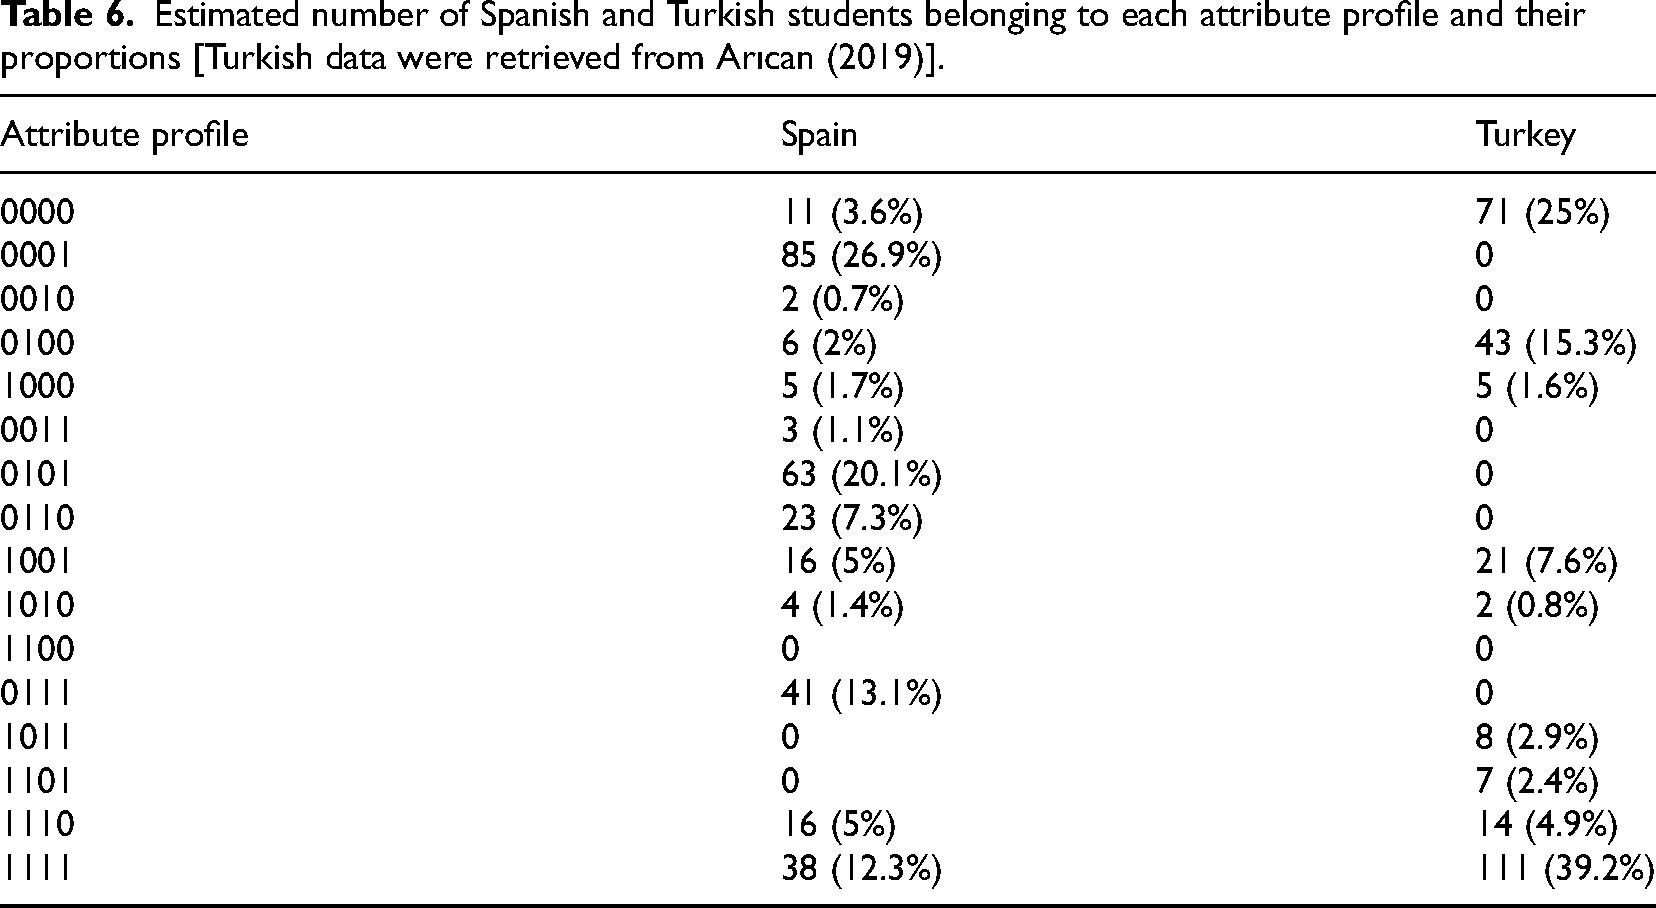
In Table 6, the estimated number of students belonging to each attribute profile and their percentages were presented for both countries. Since there were four attributes, 16 ( = 24) attribute profiles obtained as a result of the LCDM analysis in which 0 and 1 represent mastery and nonmastery of attributes, respectively. Table 6 shows that Spanish students belonged to more attribute profiles, which indicated variety in their profiles, than Turkish students. Spanish students mostly belonged to attribute profiles 0001, 0101, 0111, and 1111. On the other hand, Turkish students mostly belonged to attribute profiles 0000, 0100, and 1111. Hence, the Turkish sample mostly consisted of students who either mastered or nonmastered the four attributes and students who mastered attribute two alone. However, there were less Spanish students who mastered all four attributes and did not master any of these four attributes.
Estimated number of Spanish and Turkish students belonging to each attribute profile and their proportions [Turkish data were retrieved from Arıcan (2019)].
Estimated number of Spanish and Turkish students belonging to each attribute profile and their proportions [Turkish data were retrieved from Arıcan (2019)].
Table 6 shows that the estimated distribution of students among the different profiles varies in each country. A chi-square test was used in testing the association between the variables “Country” and “Attribute profile” that showed a significance association (p < .01). In fact, there was a very strong level of association because we obtained a value of .765 for Cramer's V coefficient (Blaikie, 2003). This means that the students are distributed among the profiles quite differently in each country, leading to a (so to speak) different country profile regarding proportionality. More particularly, a post hoc z-test on the adjusted residuals with Bonferroni correction reveals that there are significant differences (p < .05) between two countries regarding the attribute profiles 0000, 0001, 0100, 0101, 0110, 0111, 1011, 1101, and 1111. This implies that the profiles in which there are significant differences between both countries are mostly low-performance (mastering at most one attribute) and high-performance profiles (mastering three or more attributes).
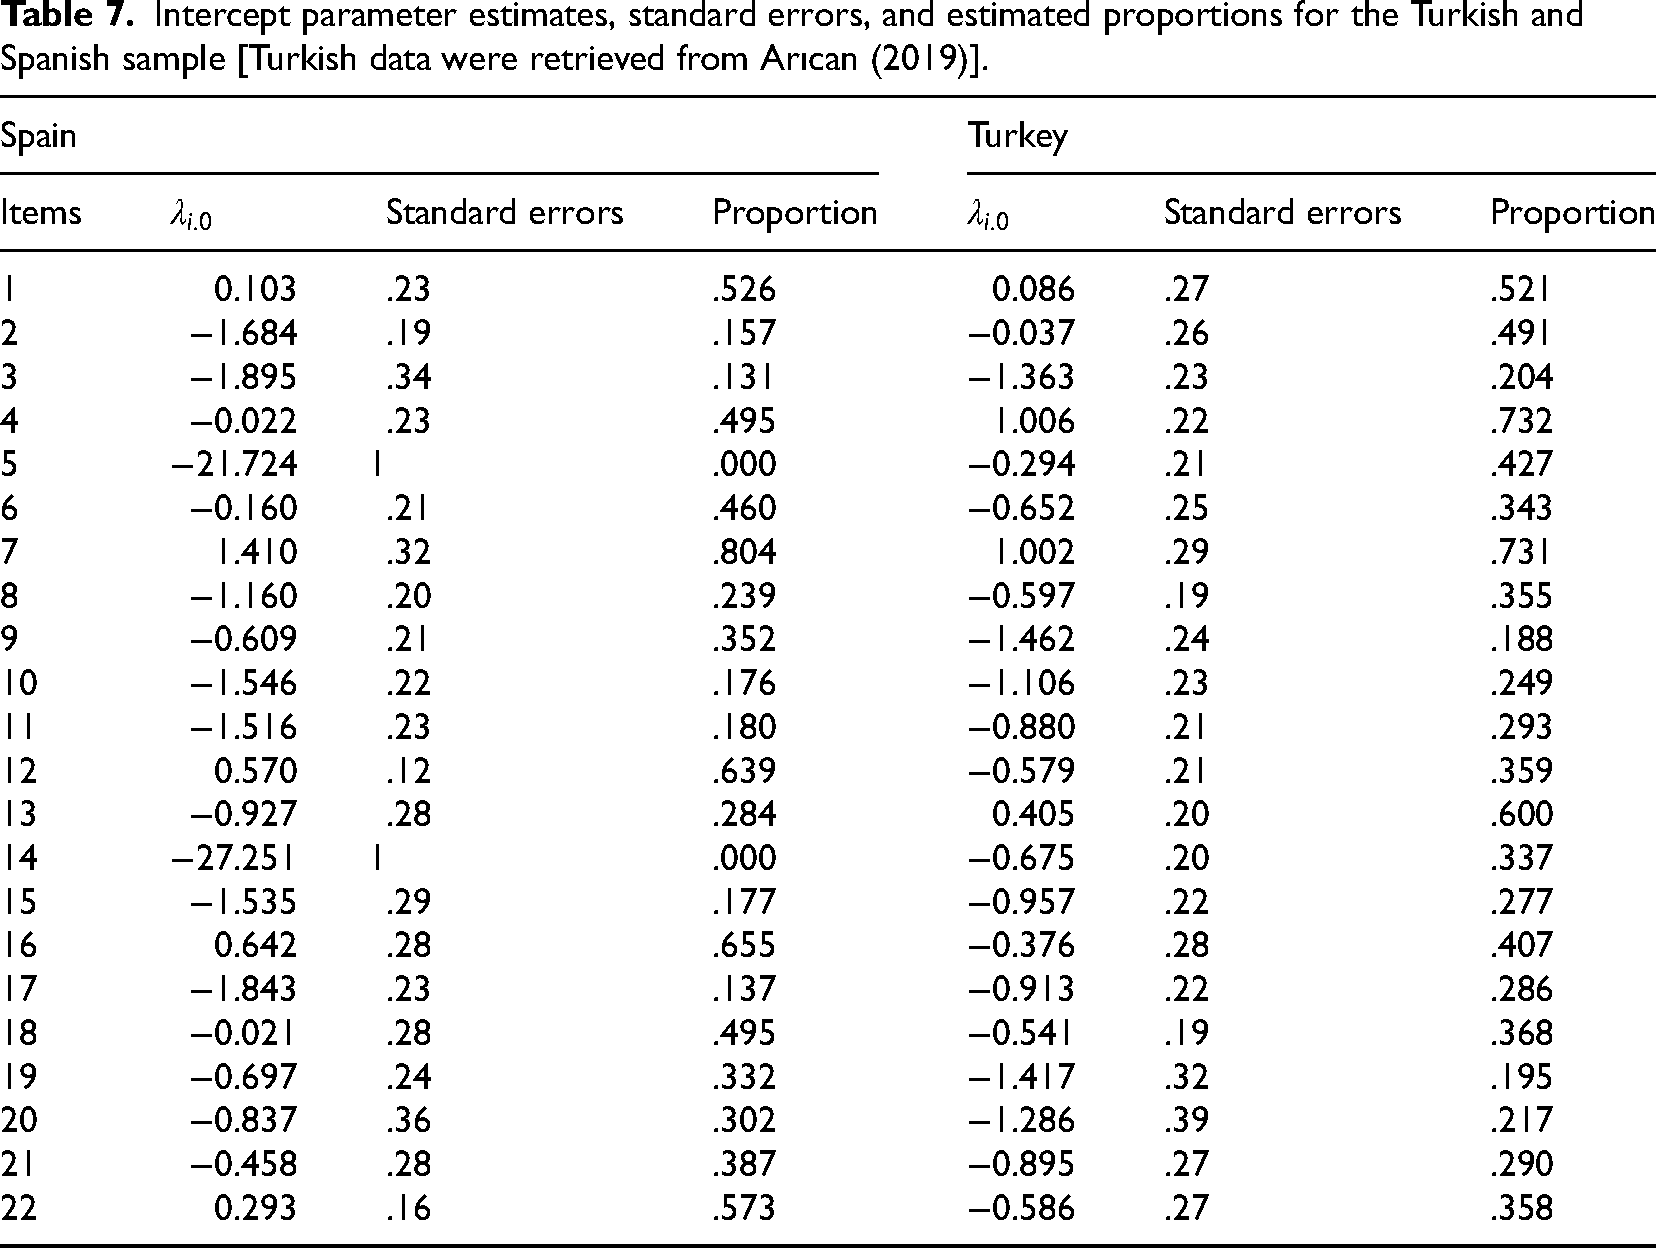
The LCDM analysis provides estimations for the intercept, main, and interaction effect parameters. For instance, in Equation 1, the intercept (i.e.,
Intercept parameter estimates, standard errors, and estimated proportions for the Turkish and Spanish sample [Turkish data were retrieved from Arıcan (2019)].
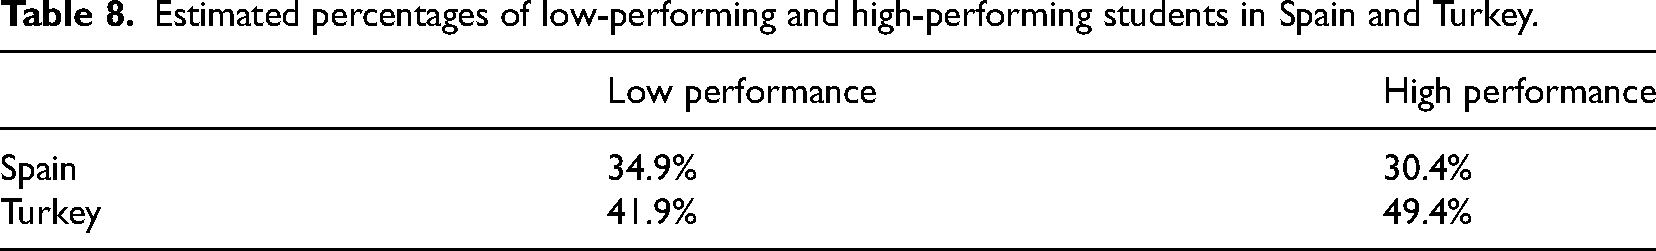
It is also important to compare the percentages of low-performing and high-performing students in both countries. As we have just mentioned, we consider that low-performing students are those mastering at most one attribute, and high-performing students are those mastering three or more attributes. Table 8 shows that the Turkish sample mostly consisted of either low-performing or high-performing students. The Spanish sample, on the other hand, had a more dispersed distribution of students.
Estimated percentages of low-performing and high-performing students in Spain and Turkey.
Proportions of Spanish and Turkish students’ attribute mastery are calculated by summing up corresponding proportions in Table 6. Table 9 shows the proportions of Spanish and Turkish students’ mastery of each attribute and reliability indices.
Spanish and Turkish students’ attribute mastery proportions and reliability indices [Turkish data were retrieved from Arıcan (2019)].
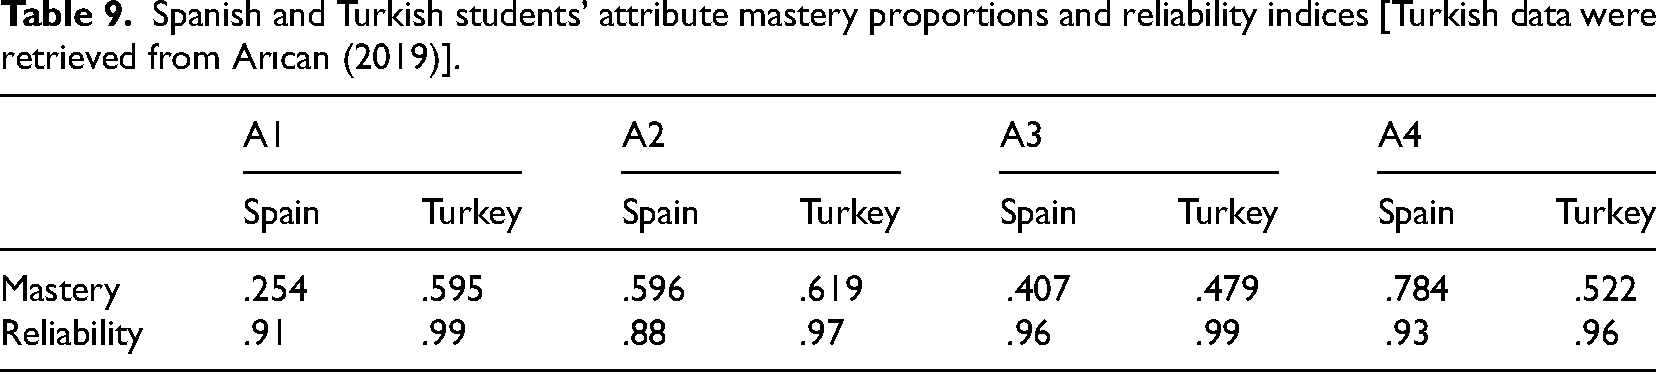
The corresponding two proportions z-test shows that there are significant differences in attribute mastery between both countries only regarding A1 and A4. This finding shows that while Turkish students were better at “understanding the concept of a ratio and determining the value of a quantity in a given ratio,” Spanish students were better at “understanding nonproportional relationships and solving daily-life problems involving this type of relationships.” In Table 9, the reliability indices were slightly lower for the Spanish sample than for the Turkish sample. However, this result is understandable since the proportional reasoning test was originally designed by following the Turkish middle school mathematics curriculum. On the other hand, the reliability indices for the Spanish sample also indicated highly reliable attribute mastery estimations.
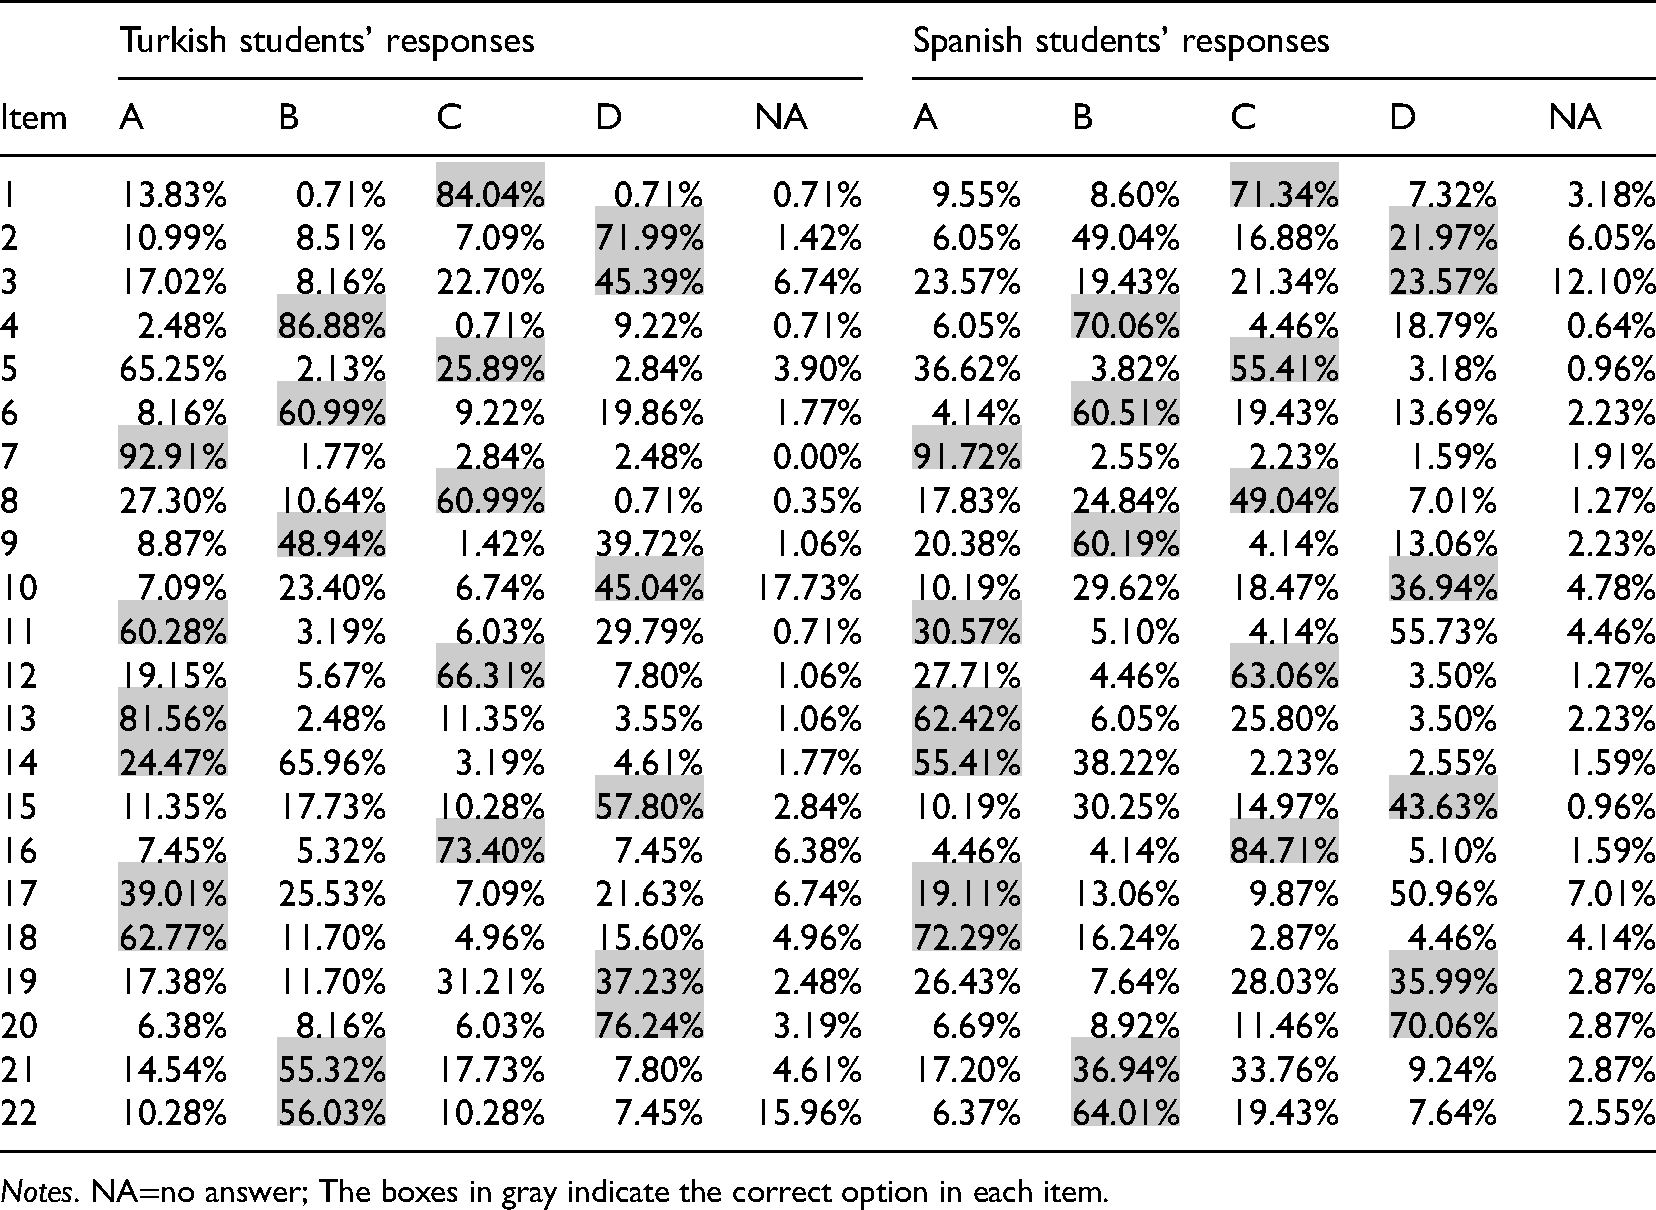
As can be seen in Table 5, there were some items in which the performance of Spanish and Turkish students differ. In those cases, it is interesting not only to compare the item difficulty indices (i.e., the proportions of students that correctly answered items) but also to analyze the different incorrect answers given by the students (the specific distribution of answers can be found in Appendix II). Particularly, we focus only on those items for which the difference between the difficulty indices was greater than 20%. Namely, we focus on items 2, 3, 5, 11, 13, 14, and 17.
This item is presented in a NM context using a verbal–symbolic representation. The difference between the difficulty indices for this item was the greatest (50%) and in Turkish students’ favor. Almost one-half of the Spanish students chose 12 as their answer (possibly due to considering the data
This item involved a proportional situation in a geometrical context using a verbal representation. The Turkish students performed better in this item, even if only 45% of them answered correctly. This item was left unanswered by about 12% of Spanish students (being the most unanswered item of the test). Moreover, the students who provided an answer, opted almost uniformly between the four options.
This item has the same structure as a missing-value problem, but in an additive situation. It was presented in a NM context using a verbal representation. The Spanish students performed better on this item than their Turkish counterparts. In fact, this was one of the items in which Turkish students performed poorly (only 26% of them provided correct answers). In both cases, the most commonly chosen wrong answer was 48, which implies treating the situation as if it was proportional.
This item is a missing-value problem in an inversely proportional situation. It was presented in a mathematical context using a verbal–symbolic representation involving algebraic notation. The Turkish students performed much better on this item than the Spanish students (only 31% of the Spanish students provided correct answers). In both countries, the most popular incorrect answer was 2 (about 30% of the Turkish students and about 55% of the Spanish students selected this answer). A possible explanation is that it would be the right choice if the situation was directly proportional.
This item is a missing-value problem in a directly proportional situation. It was presented in a mathematical context using a verbal–symbolic representation involving algebraic notation. Both countries performed quite well, but the results were particularly good for the Turkish students (82% of correct answers). The most common wrong answer in both cases was 14, which implied the use of additive reasoning.
Similar to item 5, this item was written as a missing-value problem, but in an additive situation. It was presented in a NM context using a verbal representation. Again, the Spanish students performed better than Turkish ones. Moreover, this was the item that Turkish students had the most difficulty answering correctly (only 25% answered correctly). Also as in item 5, the most commonly chosen wrong answer (in both countries) was 600, which implies treating the situation as if it was proportional.
This item was written as a missing-value problem in an inversely proportional situation. It was presented in a mathematical context using a verbal–symbolic representation involving algebraic notations, and the solution of this item required algebraic manipulations. This item obtained the worst combined result from the two samples (with only 19% of correct answers in Spain and 39% in Turkey). As for the most preferred wrong answer, Spanish students mostly chose 4 (about 50%) as their answers. This incorrect selection seems to imply omitting some of the required algebraic manipulations. On the other hand, the Turkish students equally selected 2 and 4 (about 25% and 21%, respectively) as their answers.
Discussion and conclusions
CDM are widely used statistical tools that are very useful in investigating examinees’ mastery status of certain skills (Arıcan & Kuzu, 2020). Furthermore, these models are also fruitfully used to perform large-scale detailed comparisons between different student populations (e.g., Dogan & Tatsuoka, 2008; Şen & Arıcan, 2015). In the current study, we applied the LCDM in a small-scale study to compare Spanish and Turkish middle school students’ mastery of four core cognitive skills related to proportional reasoning. Curriculum standards of both countries place great emphasis on these skills because of their critical role in developing students’ proportional reasoning. The application of the LCDM, which is not common in small-scale comparative research, turned out to be very useful and allowed us to identify some significant differences between the two samples and to obtain different attribute profiles and estimated distributions of the students belonging to these profiles. As Hilton et al. (2013) point out, the use of these type of instruments in small-scale samples can also be useful because they provide teachers with information about their own students that can even be used in designing professional development workshops.
The data analysis indicated significant differences in Spanish and Turkish students’ mastery of two attributes. The first attribute in which we determined a significant difference was attribute 1, defined as “understanding the concept of a ratio and determining the value of a quantity in a given ratio.” In average, 25.4% of Spanish students and 59.5% of Turkish students mastered this attribute. This attribute involves understanding the ratio concept, which is regarded as a core concept of proportional reasoning. This finding is consistent with the finding provided by Ponte and Marques (2011) who stated that in comparison to Brazilian, Portuguese, and American middle school mathematics textbooks, less attention is given to the notion of ratio in Spanish textbooks. While the ratio concept is covered both in Spanish and Turkish curricula, Martínez-Juste et al. (2017) point out that Spanish textbooks do not pay much attention to conceptual aspects of proportionality.
The difference in the mastery proportion of attribute 1 is particularly clear in the light of items 1, 2, and 4. These three items are missing-value problems in which a ratio and an “absolute” quantity were given. In all of these three items, Spanish students performed significantly worse than their Turkish counterparts (see Table 5) but the difference was particularly remarkable in item 2, which was correctly answered only by 22% of Spanish students versus 72% of Turkish students. This item involves a part–part–whole situation (Lamon, 1993) in which the part–part ratio and whole were given, the students were asked to determine one of the missing parts. Some researchers have pointed out that these so-called proportional division problems may be difficult for students (Alatorre & Figueras, 2004; Wright, 2014). This difficulty seems to be supported by our results, and the poor performance of Spanish students might be partly explained by the certain lack of this type of problems in Spanish textbooks, just like it happens in the US setting (I et al., 2020).
The second attribute with a significant difference between both countries was attribute 4, defined as “understanding nonproportional relationships and solving daily-life problems involving this type of relationships.” While an average of 78.4% of Spanish students mastered this attribute, 52.2% of Turkish students mastered it. This attribute is especially important when dealing with real-life problems since there seems to exist a “students’ tendency to overgeneralize the range of applicability of the proportional model” (Van Dooren et al., 2005, p. 59).
The difference in the mastery of attribute 4 is particularly clear in the light of items 5 and 14, in which Spanish students performed significantly better than their Turkish counterparts (see Table 5). These two problems were mathematically identical, having the same structure as a missing-value problem, but in an additive situation. Around 55% of Spanish students answered both items correctly, while less than 26% Turkish students provided correct responses. In both countries, the most popular wrong answer (36%–38% in Spain and 65%–66% in Turkey, respectively) consisted in reasoning in a proportional way illustrating the well-known phenomenon of “illusion of linearity” (Van Dooren et al., 2008). Hence, as reported by Atabaş and Öner (2016), Turkish students’ difficulties appeared to be mostly related with their lack of experience with this type of additive situations. However, it must be noted that, in item 12, which involved a missing-value problem in an affine situation, the students from both countries performed similarly well (63% of correct answers in Spain and 66% in Turkey). This item did not involve the comparison of two quantities, but rather required reasoning with a single quantity (i.e., univariate reasoning). Therefore, the students in two countries might have solved this item more easily than items 5 and 14.
Turkish students’ overuse of directly proportional strategies is also clear especially in item 9 (a missing-value problem with an inversely proportional relationship). Almost 40% of Turkish students answered this problem as if it was a direct proportion situation, while only 13% of Spanish students did so. It must be noted, however, that the performance in this item was not significantly different (see Table 5). In this regard, Fernández et al. (2012) noted that a progressive transition from overusing additive methods to overusing multiplicative methods takes place along primary and secondary education and that it occurs at different ages depending on the country. Although Spanish students (eighth grade) were 1 year ahead of Turkish students (seventh grade), the transition from overuse of additive methods to overuse of multiplicative methods was more apparent for Turkish students. Thus, the real difficulty appears to be the lack of understanding about which model (multiplicative and additive) is the correct one to use, and not the lack of skills to solve certain problems.
When we focus on the different attribute profiles (Table 6), it is noteworthy that approximately 80% of the Turkish students are distributed across three profiles (0000, 0100, and 1111) with seven profiles containing no students. Hence, the Turkish sample mostly consisted of either low-performing or high-performing students. On the other hand, we find only three empty profiles for the Spain sample. Therefore, Spanish students had a more dispersed distribution of students among different attribute profiles. Our findings are somewhat consistent with the Programme for International Student Assessment (PISA) 2018 results (OECD, 2019), in comparison to Spanish students, we found a greater difference in Turkish students’ performance.
The results obtained from some items show significant differences between the Turkish and Spanish students. These differences could be interpreted in terms of the problem contexts and external representations used in presenting problems. Particularly, we observe that Spanish students had a lower performance than their Turkish peers in all the items with IM contexts (items 1, 3, 11, 13, 17, 19, and 21). A general explanation for this result could be that, in Spain, proportionality is usually presented in an arithmetic context involving contextualized situations (Martínez-Juste et al., 2015). This type of presentation yields a disconnection between the ratio and proportion and Geometry, Algebra, and Functions in which proportionality and linear models also play a critical role (García et al., 2006).
In item 3, one additional reason for the Spanish students’ poor performance could be explained by the fact that the problem involved the knowledge of geometry (the exterior angle of a triangle) which is not explicitly included in the Spanish curriculum. On the other hand, regarding the remaining items presented in an IM context, both those involving algebraic language (items 11, 13, and 17) and those involving pictorial representations using function graphs (items 19 and 21), Spanish students’ poor performance might also be related to the different representations used in problem statements. In fact, works such as those of Van Dooren et al. (2008) or De Bock et al. (2017) point out the influence of different external representations over students’ successes of solving tasks involving proportionality. In items 19 and 21, we should point out that, the graphs of directly inversely proportional relationships are not introduced in the Turkish middle school curriculum, and in Spain, only the graph of directly proportional relationships is introduced in seventh grade.
To conclude, as Cai et al. (2016, p. 9) point out: Given the fact that simple comparisons of international rankings provide little guidance for understanding and improving students’ mathematics learning, it is important to understand international performance differences by other means. […] Therefore, in order to provide the education community with a deeper understanding of the teaching and learning of mathematics, it is essential for some international comparative studies to provide evidence of students’ thinking and reasoning beyond correctness of answers to mathematical problems. The evidence of students’ thinking includes the qualitative analysis of solution strategies, mathematical errors, mathematical justifications, and representations.
A limitation of the current study is that it included a relatively small sample of Spanish and Turkish middle school students. Moreover, the students’ proportional reasoning was compared using quantitative techniques alone. Hence, we suggest future studies to use this study as the basis for designing a wider comparative study that should combine quantitative data with qualitative data to better understand students’ proportional reasoning. Future studies should also examine students’ reasoning and performances in different topics and subject areas.
Footnotes
Acknowledgements
This work was carried out within the research group “Investigación en Educación Matemática” (S60_20R) officially recognized by Gobierno de Aragón (SM-J, JMM-E, and AMO-M). Parts of this study were presented in the first International Online Conference on Mathematics Education, Istanbul, Turkey in 2021.
Contributorship
The proportional reasoning test was designed by Muhammet Arıcan and applied to the Turkish sample. Sergio Martínez-Juste translated the same test to Spanish and applied to the Spanish sample. The LCDM analysis was performed by Muhammet Arıcan and item-level analysis was performed by Sergio Martínez-Juste, José M. Muñoz-Escolano, and Antonio M. Oller-Marcén. The first draft of the manuscript was written by all the authors. All authors read and approved the final manuscript.
Data availability
The datasets generated during and/or analyzed during the current study are available from the corresponding author on reasonable request.
Informed consent
Informed consent was obtained from all individual participants included in the study. Ethical approval was obtained from Kırşehir Ahi Evran University with the registration number: 201803072484825651
Declaration of Conflicting Interests
The author(s) declared no potential conflicts of interest with respect to the research, authorship, and/or publication of this article.
Funding
The author(s) received no financial support for the research, authorship, and/or publication of this article.
1
We must point out that since the moment this research was conducted, a new curriculum was introduced in Spanish middle school. However, there are no significant changes in the new curriculum regarding ratio and proportion standards.
Notes
Author biographies
Appendix I. Proportional reasoning test [Retrieved from Arıcan (2019),pp. 253–254].
Appendix II. The percentages of Turkish (N = 282) and Spanish (N = 314) students’ responses to the proportional reasoning test.
| Turkish students’ responses | Spanish students’ responses | |||||||||
|---|---|---|---|---|---|---|---|---|---|---|
| Item | A | B | C | D | NA | A | B | C | D | NA |
| 1 | 13.83% | 0.71% | 84.04% | 0.71% | 0.71% | 9.55% | 8.60% | 71.34% | 7.32% | 3.18% |
| 2 | 10.99% | 8.51% | 7.09% | 71.99% | 1.42% | 6.05% | 49.04% | 16.88% | 21.97% | 6.05% |
| 3 | 17.02% | 8.16% | 22.70% | 45.39% | 6.74% | 23.57% | 19.43% | 21.34% | 23.57% | 12.10% |
| 4 | 2.48% | 86.88% | 0.71% | 9.22% | 0.71% | 6.05% | 70.06% | 4.46% | 18.79% | 0.64% |
| 5 | 65.25% | 2.13% | 25.89% | 2.84% | 3.90% | 36.62% | 3.82% | 55.41% | 3.18% | 0.96% |
| 6 | 8.16% | 60.99% | 9.22% | 19.86% | 1.77% | 4.14% | 60.51% | 19.43% | 13.69% | 2.23% |
| 7 | 92.91% | 1.77% | 2.84% | 2.48% | 0.00% | 91.72% | 2.55% | 2.23% | 1.59% | 1.91% |
| 8 | 27.30% | 10.64% | 60.99% | 0.71% | 0.35% | 17.83% | 24.84% | 49.04% | 7.01% | 1.27% |
| 9 | 8.87% | 48.94% | 1.42% | 39.72% | 1.06% | 20.38% | 60.19% | 4.14% | 13.06% | 2.23% |
| 10 | 7.09% | 23.40% | 6.74% | 45.04% | 17.73% | 10.19% | 29.62% | 18.47% | 36.94% | 4.78% |
| 11 | 60.28% | 3.19% | 6.03% | 29.79% | 0.71% | 30.57% | 5.10% | 4.14% | 55.73% | 4.46% |
| 12 | 19.15% | 5.67% | 66.31% | 7.80% | 1.06% | 27.71% | 4.46% | 63.06% | 3.50% | 1.27% |
| 13 | 81.56% | 2.48% | 11.35% | 3.55% | 1.06% | 62.42% | 6.05% | 25.80% | 3.50% | 2.23% |
| 14 | 24.47% | 65.96% | 3.19% | 4.61% | 1.77% | 55.41% | 38.22% | 2.23% | 2.55% | 1.59% |
| 15 | 11.35% | 17.73% | 10.28% | 57.80% | 2.84% | 10.19% | 30.25% | 14.97% | 43.63% | 0.96% |
| 16 | 7.45% | 5.32% | 73.40% | 7.45% | 6.38% | 4.46% | 4.14% | 84.71% | 5.10% | 1.59% |
| 17 | 39.01% | 25.53% | 7.09% | 21.63% | 6.74% | 19.11% | 13.06% | 9.87% | 50.96% | 7.01% |
| 18 | 62.77% | 11.70% | 4.96% | 15.60% | 4.96% | 72.29% | 16.24% | 2.87% | 4.46% | 4.14% |
| 19 | 17.38% | 11.70% | 31.21% | 37.23% | 2.48% | 26.43% | 7.64% | 28.03% | 35.99% | 2.87% |
| 20 | 6.38% | 8.16% | 6.03% | 76.24% | 3.19% | 6.69% | 8.92% | 11.46% | 70.06% | 2.87% |
| 21 | 14.54% | 55.32% | 17.73% | 7.80% | 4.61% | 17.20% | 36.94% | 33.76% | 9.24% | 2.87% |
| 22 | 10.28% | 56.03% | 10.28% | 7.45% | 15.96% | 6.37% | 64.01% | 19.43% | 7.64% | 2.55% |
Notes. NA=no answer; The boxes in gray indicate the correct option in each item.