
Abstract
Mathematics is a highly esteemed discipline in high schools in Ghana; hence, mathematics teachers enjoy exceptionally high prestige, which by default makes them popular. However, not all mathematics teachers are popular, perhaps because such teachers do not provide quality mathematics instruction. Although the speculation that teaching quality can prompt teacher popularity, just as teachers’ popularity may be a candidate for teaching quality abounds, research studies that seek to relate mathematics teachers’ popularity to the quality of their instruction are scarce. Using closed and open-ended questionnaires, data on teacher popularity and instructional quality from 774 high school students was used to explore the predictability of teacher popularity from the quality of their mathematics instruction. The study found high school mathematics teachers to be generally popular and provided quality mathematics instruction. Although teacher popularity was predicted by quality instruction, teachers’ instructional practices of fostering mathematics explanation and providing feedback were not significant predictors of teachers’ popularity. Nevertheless, teachers’ adaptive support was the major reason students liked their mathematics teachers. This study also showed that the levels of popularity showed how different high school math teachers did different things to improve the quality of their lessons.
Introduction
The minimum qualification for most high school mathematics teachers in Ghana is a bachelor's degree in mathematics education-related or mathematics-related programs (Buabeng et al., 2020). Per this qualification, high school mathematics teachers are equipped with professional and academic requirements to aid them in preparing and delivering mathematics lessons to high school students. Like other high school teachers in Ghana, mathematics teachers are expected to offer mathematics lessons that strengthen students’ theoretical and practical mathematics skills, give homework, grade assignments and quizzes, and keep track of students’ progress (Al-Qaisi, 2010). Although mathematics teachers feel a sense of accomplishment as their students make progress and develop, it might be challenging for teachers to keep high school students interested in mathematics. As opined by Godbey (as cited in Tap, 2021, p. 4), making a lesson interesting and useful takes more than just making hard math concepts easier to understand.
Similar to some Asian countries like Singapore (Tan, 2009), mathematics is a compulsory subject at the senior high school in Ghana irrespective of students’ elective courses studied or the category of senior high school attended (Ministry of Education [MoE], 2020). The elective courses studied at the senior high school include General Arts, Science, Home Economics, and Visual Arts. The categorization of high schools can be by resources and facilities (categories A, B, and C), or by gender (gendered or mixed-sex). Besides, the practice in Ghana is that students must obtain at least a passing grade in mathematics if they desire to pursue post-high school education or get recruited into the public security forces. Therefore, the value of high school mathematics makes it a privilege to teach mathematics in high schools in Ghana. As acknowledged by Mehmet and Thomas (2020), mathematics is a highly esteemed discipline. Hence, mathematics teachers generally enjoy exceptionally high prestige in society (Ilany, 2022). Consequently, teaching mathematics (without being prejudice for other subjects) at a high school in Ghana means the teachers cannot compromise on their roles (as stated in the preceding paragraph). The mathematics teacher must be punctual and regular in lessons and sometimes offer tuition outside the teaching timetable to complete the syllabus. Moreover, the mathematics teacher must ensure effective classroom management so that instructional time is maximized. By deliberately doing these things, mathematics teachers can complete their teaching syllabus, and adequately prepare students for their exit examinations. However, the mathematics teacher's resolve and practices to create the enabling learning environment for cognitive activation create antagonism between them and a section of students. If the approaches used by mathematics teachers to activate cognition do not meet the expectations of students, then in the opinion of Anthony (1996), teachers may be “punished” for it or be “rewarded” if it is done well. The negative reaction from students might explain the perception of mathematics teachers, which is echoed by Fasasi and Yahya (2008) as being the first category of teachers, students do not like or that students have something against them.
Nevertheless, mathematics teachers have become popular subject teachers in high schools although not all popular teachers are necessarily better teachers (Fenderson et al., 1997). To Ilany (2022), teachers’ empathy toward the challenges and frustrations some students face when learning mathematics as well as teachers’ wish to support students to succeed and boost their self-confidence in mathematics have attracted many students to them. Regrettably, some students experience the unfortunate misfortune of having the wrong mathematics teachers. In such cases, the mathematics teachers lack the proper attitude toward teaching (i.e., such teachers are inexperienced or lack enthusiasm and do not care whether their students understand). This latter situation does not only dent students’ likeability for mathematics but has the potential to reduce the popularity of mathematics teachers. According to Fauth et al. (2014), the likeability of mathematics teachers or the attractiveness of students toward their mathematics teachers describes mathematics teachers’ popularity.
Teacher popularity
In sociology, the term “popularity” is the state of being well-liked by others (Scott & Judge, 2009). While popularity is an individual attribute, Scott and Judge (2009) referred to it as a social phenomenon that can only be understood in the context of a group of people. For most people, it is plausible to believe that popularity is a widely regarded self-relevant comparison dimension (Zuckerman & Jost, 2001). Also, in educational institutions, Fauth et al. (2018) has suggested that every school has one or two teachers who, for whatever reason, have become celebrities among their students. Popular teachers are either fun-liked laidback teachers who are more lenient with student discipline or teachers who are knowledgeable, fair, and achieve excellent results (Hampshire-Dell, 2020). Within the perspective of popularity in schools, the popularity of a teacher is a collective thought by their students, which can be measured and compared (Cillessen & Marks, 2011; Fauth et al., 2018). According to Fauth et al. (2018), a teacher’s popularity is defined by students generally positive, emotive perception of a teacher. Popularity determines a teacher's interaction with students. Because a teacher's popularity reflects the interpersonal relationships that exist between the teacher and the students, it may have an impact on the classroom experience and motivate students to achieve and succeed with their teacher. According to Montalvo et al. (2007), students are more willing to do things to satisfy their favorite teachers. Students sympathize with popular teachers because popular teachers motivate students to like them. Reasonably, a teacher who is caring, personable, gives oral or written confidence-building comments, provides one-on-one assistance, and is concerned about students’ lives even outside of school may likely win the hearts of most students (Kloss, 2013).
Researchers (Fauth et al., 2014; Kunter et al., 2013) have consciously investigated teacher popularity as a confounding factor to teaching quality within the framework of instruction describing classroom processes. Nonetheless, a few researchers, noticeably Kloss (2013) and Fauth et al. (2018), have proposed an independence between teaching quality and teacher popularity. To this end, while research studies that sought to relate mathematics teachers’ popularity to the quality of their instruction are scarce (Fauth et al., 2018), Kloss (2013) and Fauth et al. (2018) maintain that high teaching quality can elicit sympathy for teachers and that teachers’ popularity may be a candidate for teaching quality. Fauth et al. (2018) further opined that teacher popularity is a helpful indicator of teacher quality and subsequently called for its inclusion in future studies. Besides, because the knowledge of teachers’ popularity provides pertinent information that is not intrinsic to measurements of teaching quality, this present study seeks to explore the predictability of the popularity of mathematics teachers from the quality of their mathematics instruction.
Instructional quality in mathematics
The term “instructional quality” was coined by Holzberger et al. (2013) to describe how well a teacher engages learners and the processes that lead students to effective learning. The engagements encompass all necessary psychological and curricular experiences, as well as adaptable learning scenarios (Kuterbach, 2012). Several models have been developed to evaluate the quality of mathematics instruction. Some of these models include the Three Basic Dimension (TBD) framework (Klieme et al., 2009), the Mathematical Quality of Instruction (MQI) (Loewenberg-Ball et al., 2011), and the Mathematics-Scan (M-Scan) (Walkowiak et al., 2014). Among these models, Klieme et al.'s (2009) TBD, described as a hybrid model (Charalambous & Praetorius, 2018) incorporates three dimensions of instruction. These are cognitive activation, classroom management, and supportive climate.
According to Klieme et al. (2009), cognitive activation dimension of instructional quality explains teacher's ability to activate in-depth processing of new learning and information. Cognitive activation also draws on students’ prior knowledge, concepts, and skills through relevant teaching resources and challenging tasks (Baumert & Kunter, 2013b). Klieme et al. (2009) used classroom management to describe the responsibility of the teacher in ensuring that students’ time on task is maximized. It connotes the use of mutually designed rules, directives, and guidelines aimed at keeping order and preventing disruptions. Lastly, supportive climate of instructional quality explicates the role of the teacher in facilitating teacher–student relationships, providing constructive feedback and caring behavior, and addressing students’ emotions, interests, and motivation. Meeting the learning outcomes in a supportive climate requires the teacher to be friendly, respect students, and offer individual learning support (Baumert & Kunter, 2013a; Klieme et al., 2009).
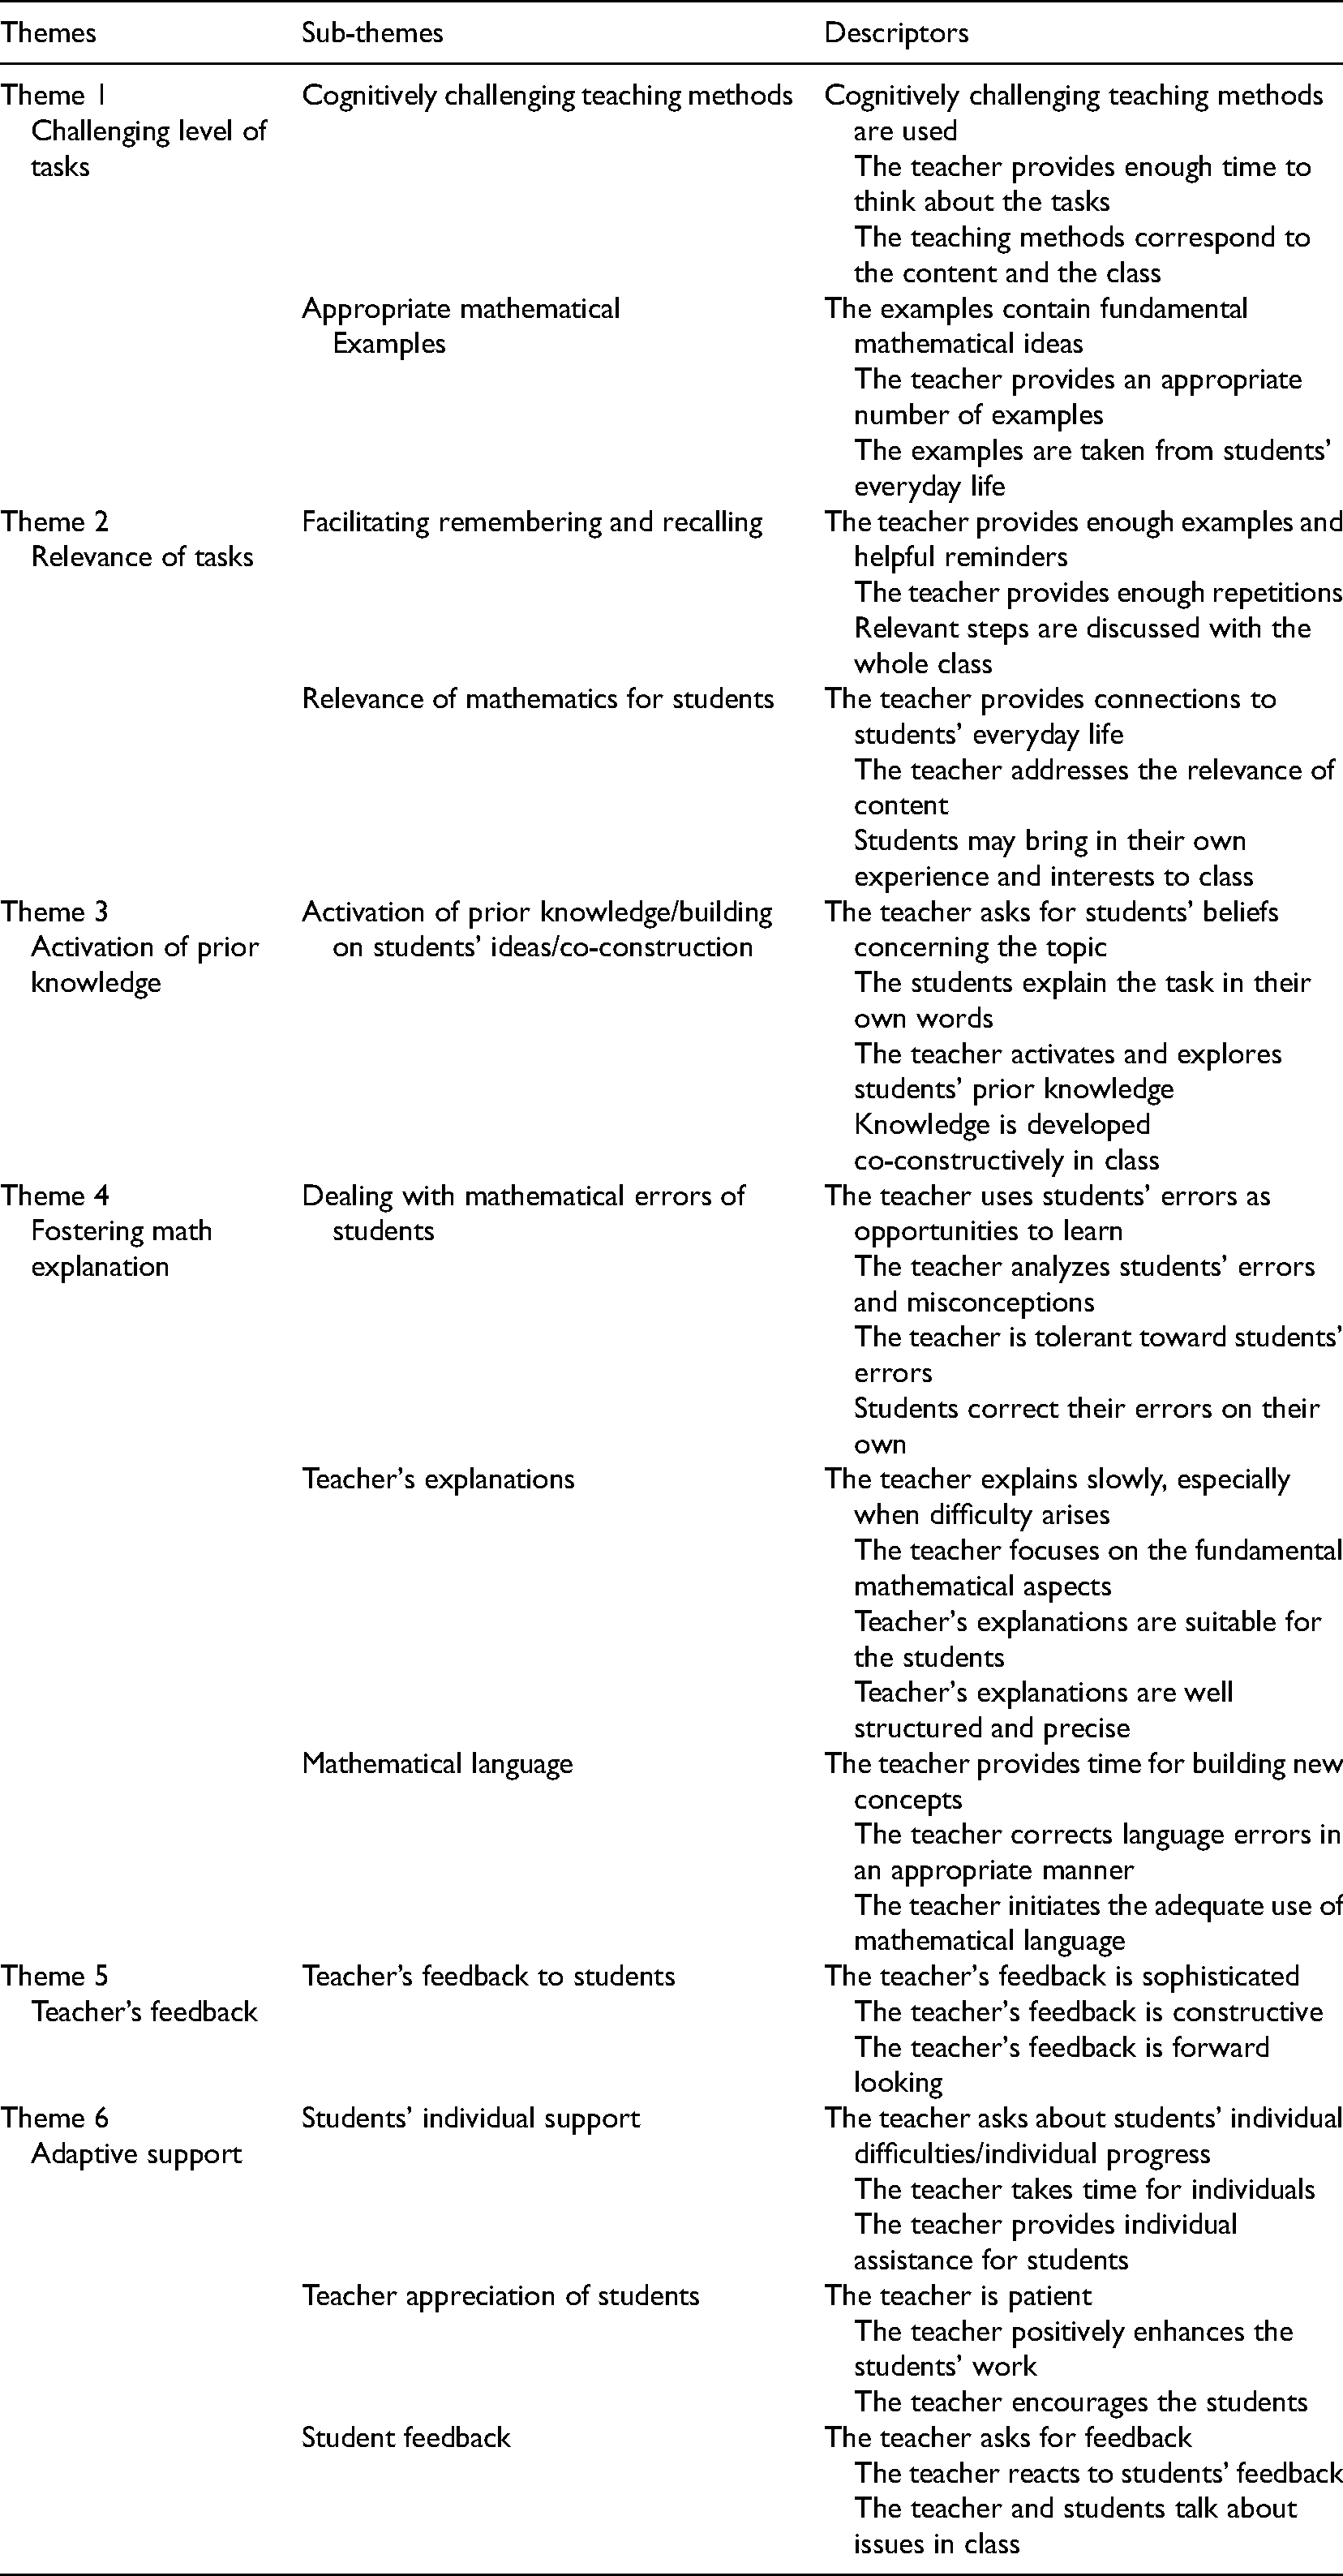
Previous studies (Fauth et al., 2018; Kunter et al., 2013) have sought to relate the three broad dimensions of TBD with the popularity of teachers. Whiles such studies (Fauth et al., 2018; Kunter et al., 2013) have revealed varying levels of significant and nonsignificant correlations, the studies have failed to reveal specific instructional practices that significantly or insignificantly related to teacher popularity. It suffices to examine how specific instructional activities across the three dimensions of TBD related to the popularity of mathematics teachers. Specifically, six activities (here after) described loosely as dimensions of instructional quality are worth considering. These dimensions are: (1) challenging level of tasks, (2) relevance of tasks, (3) activation of prior knowledge, (4) fostering mathematics explanation, (5) teacher's feedback, and (6) adaptive support. The summary of instructional descriptors defining these six dimensions of instructional quality (Kunter & Baumert, 2006; Peña-López, 2012; Schlesinger et al., 2018) is presented in the Appendix.
The dimension of relevance of tasks in this study has two strands (Appendix). That is, tasks which facilitate remembering and recalling (Mahmud et al., 2020), and tasks which elicit the relevance of mathematics to students (Neubrand et al., 2013). To achieve the former strand, the teacher provides enough examples and helpful reminders, enough repetitions, and a whole-class discussion on relevant steps of solving tasks. For the second strand of relevance of tasks, teachers include tasks which connect students to their everyday life, address the relevance of content, and require students to bring their own experiences and interests to class (Schlesinger et al., 2018). According to Neubrand et al. (2013), any activity requiring engagement with and processing of a specific mathematical situation can be viewed as a mathematical task, even if the relations being addressed are “generic.” However, mathematical task involves engagement with a particular mathematical concept, and it calls for students to address a constrained area in a goal-oriented way (Neubrand et al., 2013). The opportunities provided in tasks range from pedagogical, cognitive, communicative, comprehension-focused, and other perspectives (Mason & Johnston-Wilder, as cited in Neubrand et al., 2013, p. 126). This means that the way in which teachers and students use tasks as a tool in mathematics instruction will determine whether they are able to take advantage of this potential. Accordingly, students’ grasp of mathematical concepts and methods, their development of sophisticated conceptual networks, and eventually their perception of mathematics can all be influenced by teachers who are aware of the possibilities of tasks and orchestrate them effectively (Neubrand et al., 2013). Similarly, Mahmud et al. (2020) intimated that when students are taught to recall a mathematical concept they have previously mastered, they can increase their mastery of and proficiency for the mathematical language. It is therefore important for a quality mathematics instruction to consider the relevance of mathematical tasks during instruction such that the solution procedures can be recalled for future use.
The second dimension of instructional quality is the challenging levels of tasks. Following the discussion about tasks in the preceding paragraph, the dimension of challenging levels of tasks also involves two strands (Appendix). First, the application of cognitively challenging teaching methods (Baumert & Kunter, 2013b) in which teachers provide enough time for students to think about tasks, and the teacher's use of teaching methods that correspond to the content and the class. Secondly, this dimension concerns the usage of appropriate mathematical examples (Lee et al., 2016) in which fundamental mathematical ideas, appropriate number of tasks, and the sources of tasks determine the mathematical examples teachers use in instruction. The intent of this dimension is to ensure that the examples and teaching approaches foster higher-order thinking (Ottmar et al., 2014). While acknowledging that challenging tasks stimulate students’ cognitive demands, Praetorius et al. (2018) argue that they are insufficient to motivate students to achieve the desired level of instruction. Instead, the level of support provided to students, the feedback they receive, and how well a teacher interacts with students in the academic setting are all important factors.
The third dimension of instructional quality is adaptive support. Corno (2008) defines adaptive support as the degree of instructional support teachers provide in relation to the varying levels of student competence. This dimension goes beyond the teacher's recognition of the unique needs of each student (Corno, 2008). However, adaptive support dimension of instructional quality in this study encompasses three strands relating to individual student support, teacher appreciation of students, and student feedback (Appendix). Individual student support indicates the teacher's preparedness to ask about students’ individual difficulties/progress, make time for individual students, and provide individual assistance for students. Teacher's patience, encouragement, and motivation to students describe a teacher's appreciation of students. On student feedback, adaptive support is manifested as the teacher asks for feedback from students, reacts to students’ feedback, and to the manner the teacher and students’ talk about issues in class. As teachers strive to attend to individual student needs, students’ self-regulated learning improves (Corno, 2008), performance is enhanced (Kardan & Conati, 2015) and by extension, students’ likeability of the teacher improves.
The fourth dimension of instructional quality is teacher's feedback to students. This dimension indicates the constructive, sophisticated, and forward-looking nature of the feedback (Appendix). The importance of teacher's feedback in education has always been significant, and it is based on the idea that action without feedback is wholly ineffective for a student (Wang & Zhang, 2020). According to Cramp (2011), teacher's feedback is the information given by teachers on specifics of a student's performance or knowledge. Feedback is intended to help students perform better academically (Pereira et al., 2016). This suggests that teacher's feedback directly influences students’ academic performance as it encourages students’ learning engagement, and it is more beneficial when the frequency, complexity, or diversity of assessment is high (Wang & Zhang, 2020).
The fifth dimension of instructional quality is the activation of students’ prior knowledge. According to Liu et al. (2019) and Polman et al. (2021), the recall of prior knowledge by students about the subject being studied influences their understanding of the content. In this study, activation of students’ prior knowledge deals with developing mathematics ideas based on students’ existing ideas and schemas (Appendix). To activate students’ prior knowledge, the teacher consciously asks for students’ beliefs concerning the topic, asks students to explain mathematics task in their own words, and co-constructs and develop mathematics knowledge with the students. Based on previous literature, Liu et al. (2019) acknowledged that students with less prior knowledge are less comfortable speaking with their peers. Such students make instructional contribution late and just take into account one side of an argument. Nevertheless, Liu et al. (2019) empirically discovered that students with lower prior knowledge can still compete favorably with those with higher prior knowledge in argumentation through peer-to-peer dialogue interactions in theoretical topics. Given the importance prior knowledge of students plays in the creation of high-quality arguments for effectively imparting new knowledge (Liu et al., 2019; Polman et al., 2021), Polman et al. (2021) urge all teachers to engage students’ existing knowledge. This is because, students recognize what they already know when previous knowledge is activated, making it possible for them to relate new information to what they already know (Dong et al., 2020).
The sixth dimension of instructional quality in this study is fostering mathematical explanation. This dimension has three strands: dealing with mathematical errors of students (Kshetree et al., 2021), teacher's explanations (Pournara et al., 2015), and mathematical language (Wasser, 2022). In dealing with mathematical errors, the teacher uses students’ errors as opportunities for them to learn, analyzes students’ errors and misconceptions, and impresses on students to correct their own errors. Moreso, the teacher's explanations of mathematical concepts are fundamentally well structured, precise and suitable for the students. Furthermore, the teacher initiates adequate use of mathematical language, corrects language errors in appropriate manner that is not offensive to students, and provide sufficient time for students to build new concepts. In the view of Wasser (2022), every student has their own viewpoint, however, when students hear their classmates explain mathematics ideas and solutions during mathematics talks, it gives them a distinct perspective that helps them to better comprehend mathematics and correct their own errors and misconceptions. Notedly, it is impossible for students to meaningfully learn mathematics if their errors are not addressed (Kshetree et al., 2021). If the mathematics errors are not addressed, Kshetree et al. (2021) opine that students may integrate new ideas into old errors, passing the entire learning process through the errors and misconceptions. Hence, students’ ability to comprehend mathematical concepts may be hindered by chronic errors, lead to frequent repetition of the errors, result in low performance, anxiety, unfavorable attitudes, and poor perceptions of mathematics (Kshetree et al., 2021).
Empirical review on teacher popularity and instructional quality in mathematics
The contest of ideas concerning the conceptualization of teacher popularity within the umbrella of instructional quality from the 1930s might not end anytime soon. Whereas some instructional researchers have questioned the credibility of students’ evaluations of instruction on the basis that such evaluations are adulterated by the popularity of the teacher (Cipriano et al., 2019; Deaker et al., 2016), others (Fauth et al., 2014, 2018) have argued otherwise.
Previous studies that successfully separated instructional quality from teacher popularity also found appreciable correlations between the constructs. For example, using data from secondary and elementary school students, respectively, Wagner (2008) and Fauth et al. (2014) found strong relationships between teacher popularity and instructional quality indicators. Wagner (2008) found substantial correlations between teacher popularity and measures of supportive climate but modest correlations between teacher popularity and classroom management features when it comes to the three dimensions of instructional quality. Kunter et al. (2013) went on to say that a positive supportive climate is especially important for students’ motivation and interest. Similarly, Fauth et al. (2018) found a significant relationship between teacher popularity and supportive climate but not between teacher popularity and classroom management and cognitive activation. These findings might be explained by the fact that a supportive climate displays a positive teacher–student relationship. Furthermore, other studies (Gaertner, 2014) that explored the effects of teacher popularity on teaching quality also concluded that the more popular a teacher is, the higher the teaching quality.
Among other things, Fauth et al. (2018) attempted to examine whether instructional quality (teaching quality or classroom processes) determined teacher popularity. The study used data from 1,070 third-grade learners and their 54 teachers across time. Fauth et al. (2018) used Wagner’s (2008) three-item scale was used to determine teacher popularity: “I like my instructor a lot.” “My teacher is fantastic,” and “I am fond of my teacher.” In their conclusion, the researchers assumed reasonably that quality teachers are more likely to be popular with students. For primary school students, where teachers serve the dual purposes of being instructors and caregivers, a teacher popularity is a good sign of the teacher's ability and quality (Fauth et al., 2018). Although Fauth et al. (2018) undertook a rigorous analysis of data, their research was pinned on primary school students whom critics (Van der Lans et al., 2015) claim that primary school learners have problems comprehending some items on the instructional quality questionnaire. Consequently, the attention drifts to high school students who according to Gore (2018), are matured and can honestly recognize and differentiate quality teaching from the likeability of their teachers. Literature has showed that teacher popularity provides valuable information that is not inherent in measures of teaching quality (Fauth et al., 2018). Nevertheless, the speculations that quality teaching may make teachers popular (Lindstrom, 2021), and the scarcity of empirical research that seek to predict the popularity of mathematics teachers from the quality of instruction irrespective of the level form additional to the basis for this study.
Research questions
The aforementioned empirical findings and theoretical considerations led to finding answers to these research questions.
What homogenous clusters of popular mathematics teachers emerge based on students’ perceptions and characteristics? What instructional activities explain students’ likeability of a mathematics teacher? What is the effect of instructional quality on the popularity of mathematics teachers?
Research design
This present study used a descriptive survey as its research design to gage students’ thoughts about the quality of mathematics instruction and mathematics teachers’ popularity. This study’s design permitted the use of multiple data-gathering tools to thoroughly answer the research questions. Both quantitative and qualitative data were sought from a cross-section of second-year students who could appropriately assess the quality of mathematics instruction and the popularity of mathematics teachers. The quantitative data captured students’ ratings of the quality of mathematics instruction and their popularity (research questions 1 and 3), whereas the qualitative data elicited students’ explanations for the rating of teachers’ popularity (research question 2). Both the qualitative and quantitative data were collected simultaneously.
Participants
The analysis in this study relied on cross-sectional data from 774 second-year senior high school students in 1 of the 16 regions in Ghana. The target population was all second-year students in the selected region. However, six participating schools, based on Ghana Education Service's (GES) categorization (i.e., categories A, B, and C) were involved in this study. From each category, two schools were sampled. Coincidently, the six schools were either unisex (four schools) or gendered (two schools) which offered General Arts, Business, Home Economics, Science, and Visual Arts courses. The 774 second-year high school students were sampled using a multistage sampling technique. Respectively, 259, 260, and 255 students were sampled from categories A, B, and C schools. Participation in this study was voluntary. Teachers gave informed consent for students who were below 18 years old, but older students (18 years and above) signed the informed consent form. The data collection in this study was approved by the Institutional Review Board of the University of Cape Coast, Ghana. At the level of course studied, the representation of general arts students was higher (32.7%) than home economics students, which was the least (2.5%) represented. At the level of students’ gender, more male students (59.9%) were represented than female students (40.1%). According to school type, whereas the representations of students from categories A, B, and C were almost even (averagely 33%), students in unisex schools (66.4%) outnumbered those in gendered schools (33.6%).
Instrumentation
A questionnaire was the main research instrument used to collect data for this study. The questionnaire had three parts: a biodata part (part 1), a closed-ended part (part 2), and an open-ended part (part 3). Students’ school category (categories A, B, or C), school type (single or mixed gender), and S gender were taken in part 1. The closed-ended part (part 2) was made up of the instructional quality and the teacher popularity questionnaire. Part 3 contained an open-ended question. All of the closed-ended questions on the questionnaire were answered on a four-point Likert scale where 1 meant strongly disagree and 4 meant strongly agree.
Instructional quality questionnaire
Thirty items, which were adapted from Kunter and Baumert (2006), Peña-López (2012), and Schlesinger et al. (2018), were slightly modified to measure students’ perception of the quality of instruction in mathematics. The items on the instructional quality questionnaire focused on six dimensions of instructional quality: challenging level of tasks (e.g., My mathematics teacher sets word problem tasks where we have to take time to think); relevance of tasks (e.g., My mathematics teacher provides word problem tasks that relate to our everyday life activities); activation of prior knowledge (e.g., My mathematics teacher presents word problem tasks that require us to apply what we have learnt to new contexts); fostering mathematics explanation (e.g., My mathematics teacher asks students to explain how we have solved mathematics tasks); teacher’s feedback (e.g., My mathematics teacher gives feedback on the way students arrive at the answers to mathematics tasks); and adaptive support (e.g., My mathematics teacher gives students the opportunity to express opinions about mathematics tasks).
With 25 items (five items failed convergence criteria), factor and confirmatory factor analyses were used to confirm the six-factor structure of instructional quality. The fit indices of the Confirmatory Factor analysis (CFA) model based on literature (Gaskin & Lim, 2016; Zainudin, 2012) were excellent: the Standard Root Mean Residual (SRMR) = .0404, Root Mean Square Error of Approximation (RMSEA) = .037, Goodness-of-Fit Index (GFI) = .946, Adjusted Goodness-of-Fit Index (AGFI) = .934, Comparative Fit Index (CFI) = .965, Tucker Lewis index (TLI) = 906, and the Chi-square Degrees of Freedom Ratio (Chi2/df) = 2.072. Additionally, the reliability verified using Cronbach alpha (
Teacher popularity questionnaire
A three-item teacher popularity questionnaire developed by Wegner (as cited in Fauth et al., 2018, p. 1234) was adopted to assess teachers’ popularity. The factor loadings for the three items “I like my mathematics teacher very much,” “My mathematics teacher is great,” and “I am fond of my mathematics teacher” were .81, .77, and .59, respectively. Besides, the reliability verified using Cronbach alpha (
The open-ended question
Following the closed-ended questionnaire, an open-ended question relating to the teaching and learning of mathematics was posed to students to explain why they like their mathematics teachers. The first part of the question was to respond with a yes or no to “On the basis of how your mathematics teacher teaches, do you like your mathematics teacher?” A follow-up to this question asked the students to explain why they liked or disliked their mathematics teachers.
The explanations from the students were coded deductively. A coding frame was adapted from Schlesinger et al. (2018) for coding the responses of students’ likeability of their mathematics teachers (teachers’ popularity). The coding frame (presented in Appendix and explained in the section named “Instructional quality in mathematics”) included the six dimensions/themes of instructional quality (as applied in the instructional quality questionnaire), the corresponding sub-themes, and indicators. The themes were as follows: challenging level of tasks (theme 1); relevance of tasks (theme 2); activation of prior knowledge (theme 3); fostering mathematics explanation (theme 4); teacher feedback (theme 5); and adaptive support (theme 6).
To achieve a reliable result from the coding process, a mathematics educationist who was not part of the development of the coding frame and had no vested interest in the findings of this study was recruited to help in the coding process. I organized a sensitization meeting with my co-coder where we discussed the coding frame, the unit of coding, and the degree of mental thought that codes captured. Out of the 774 students, 452 (58.4%) respondents expressed likeability for their mathematics teachers. The views expressed by these 452 respondents were included in the analysis. By popular decision (O’Connor & Joffe, 2020), 46 of the 452 data set representing 10.2% were purposively sampled and intercoded. To ensure that the full data sets were represented during the intercoding phase, the entire data set of 452 was stratified into three categories: less, moderate, and overlaid expressed texts. From these categories, 15, 15, and 16 data sets were randomly selected from less, moderate, and overlaid expressed text, respectively. To make the process of coding and the comparison of codes effective, we tabulated the assigned codes in an MS Excel spread sheet file. Before calculating the intercoder reliability, I met with my co-coder to identify, reflect, and discuss differing codes and the interpretations thereof. Subsequently, Cohen's kappa functionality in SPSS 21 was used to determine the intercoder reliability. Figure 1 shows a screen shot of the data entry interface for SPSS 21.
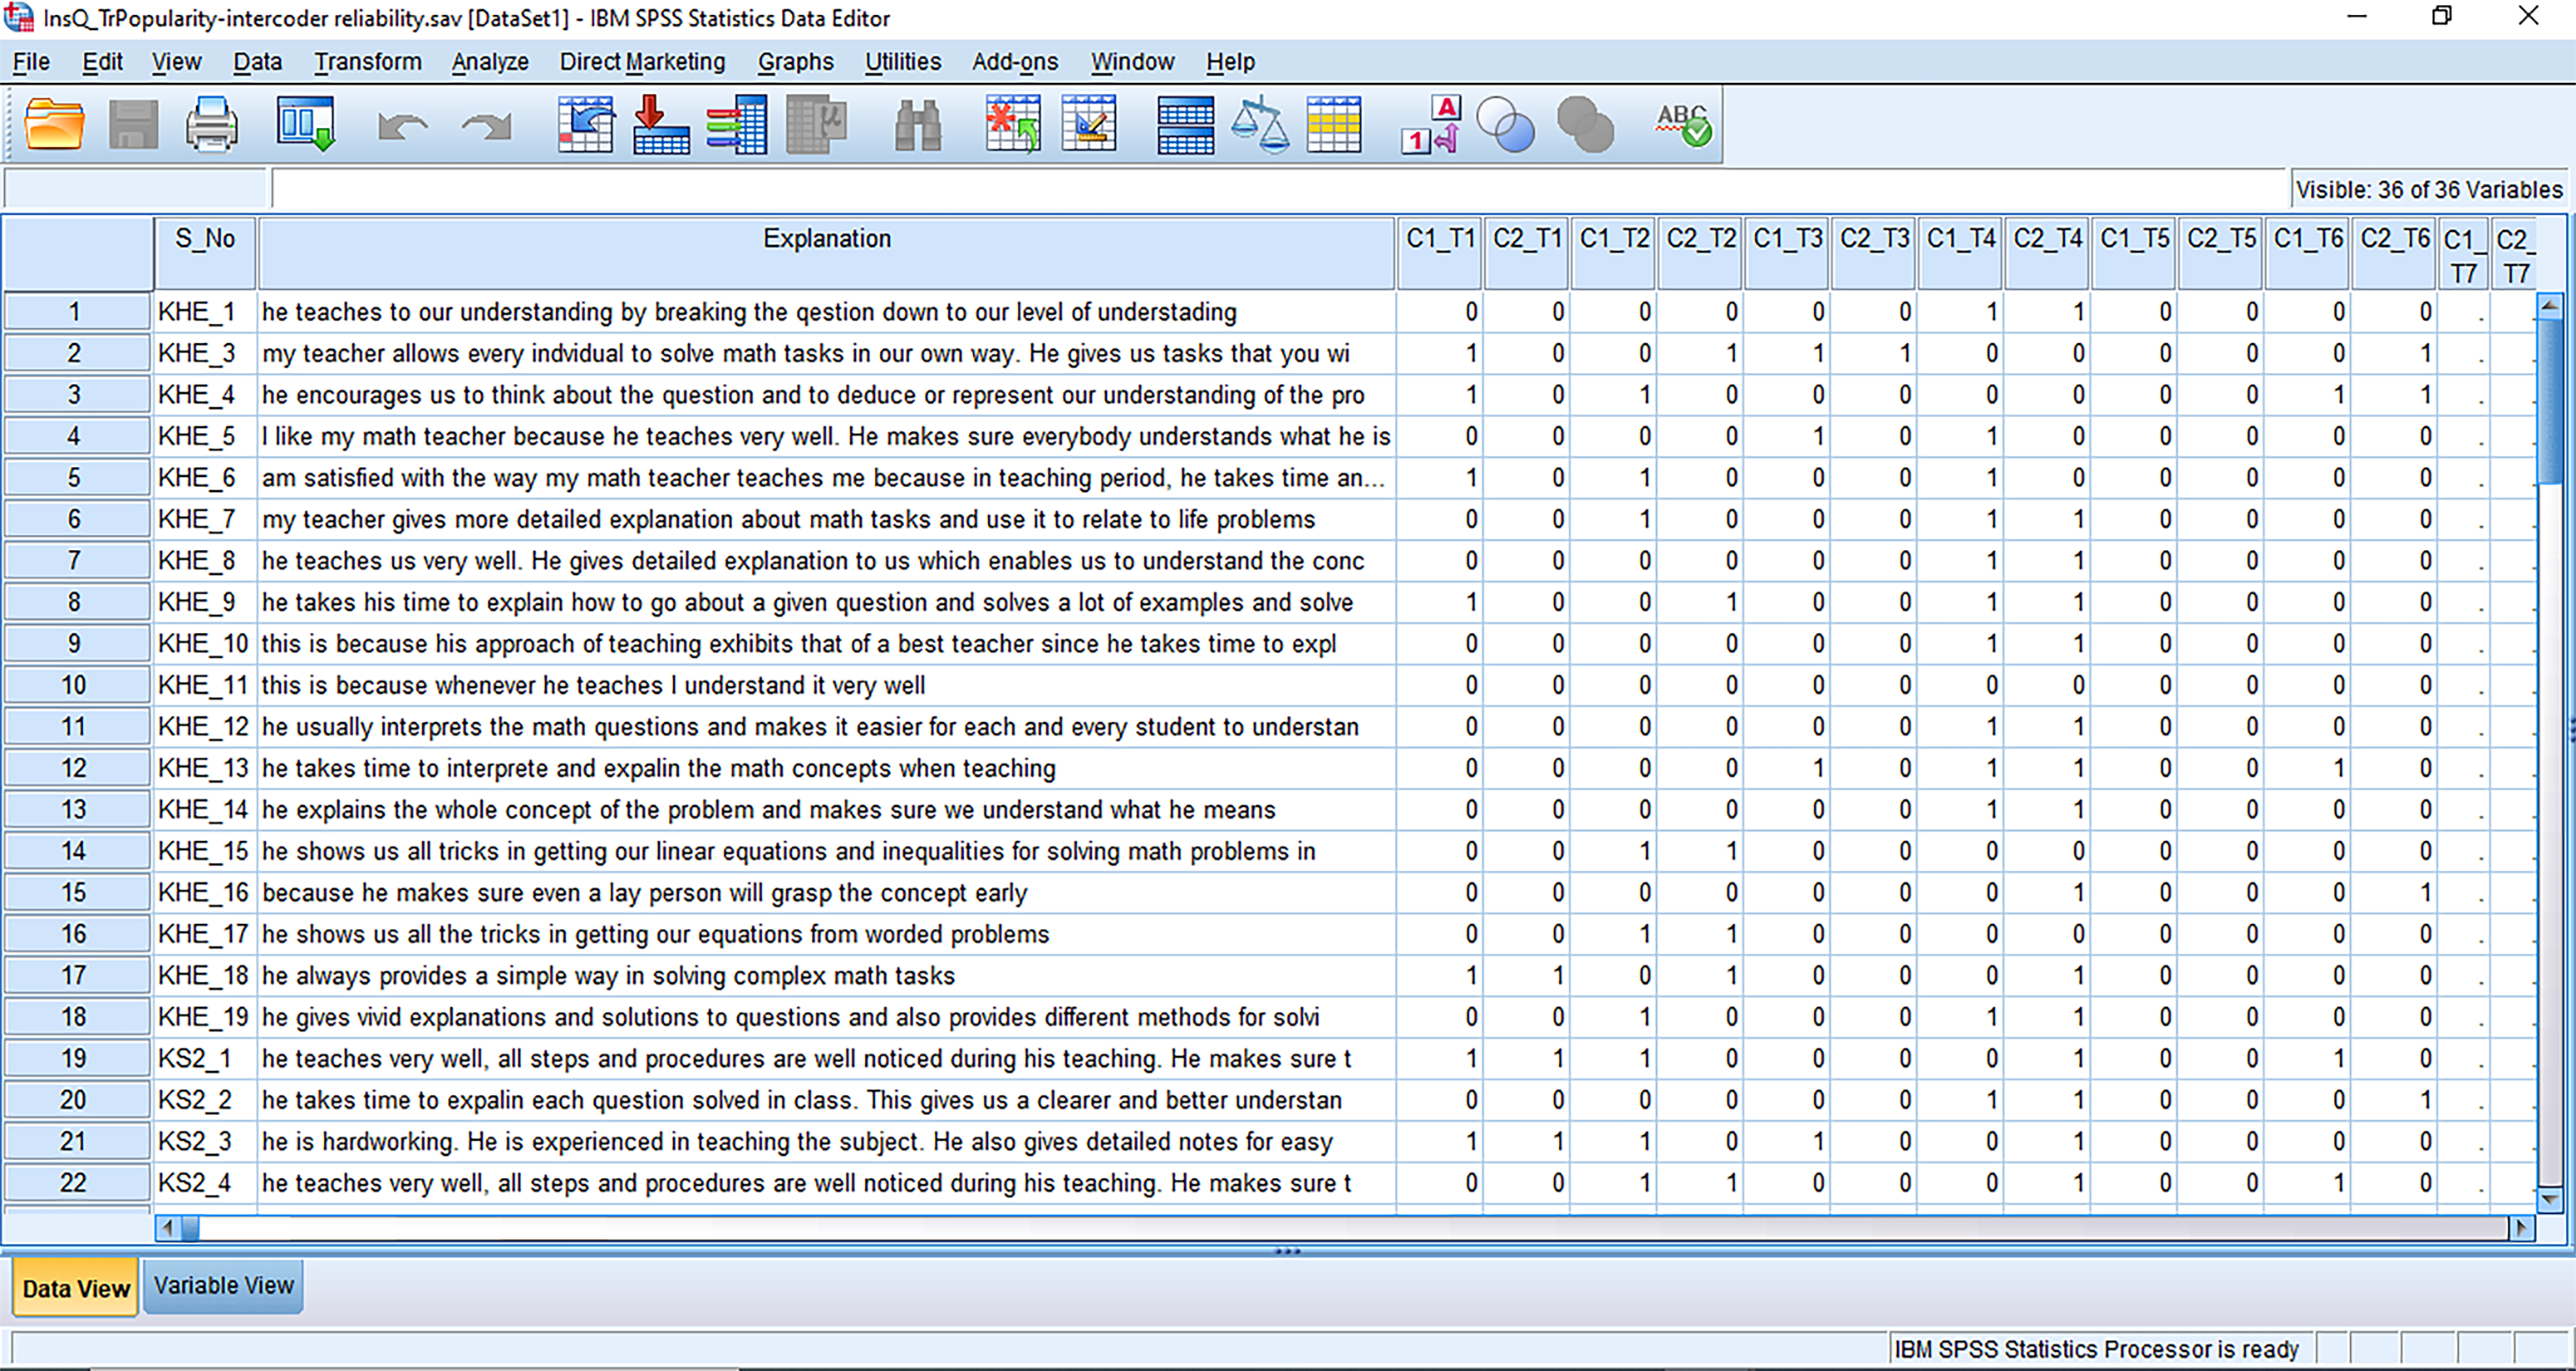
Representation of coders’ decisions regarding application of the six instructional quality elated codes in SPSS interface, the student identity (S_No) and the data unit or quotes (explanations). Note. C1 = coder 1, C2 = coder 2, Tn = theme number.
From Figure 1, the corresponding cell displays 1 (one) if a code has been applied to a data unit, and a 0 (zero) indicates that no code has been applied. In this data set, each code had two equivalent columns, which indicate the application of specific codes by both coders. Table 1 shows the reliability between coders for each theme based on Cohen’s kappa coefficient.
Intercoder reliability coefficients (46 data set).
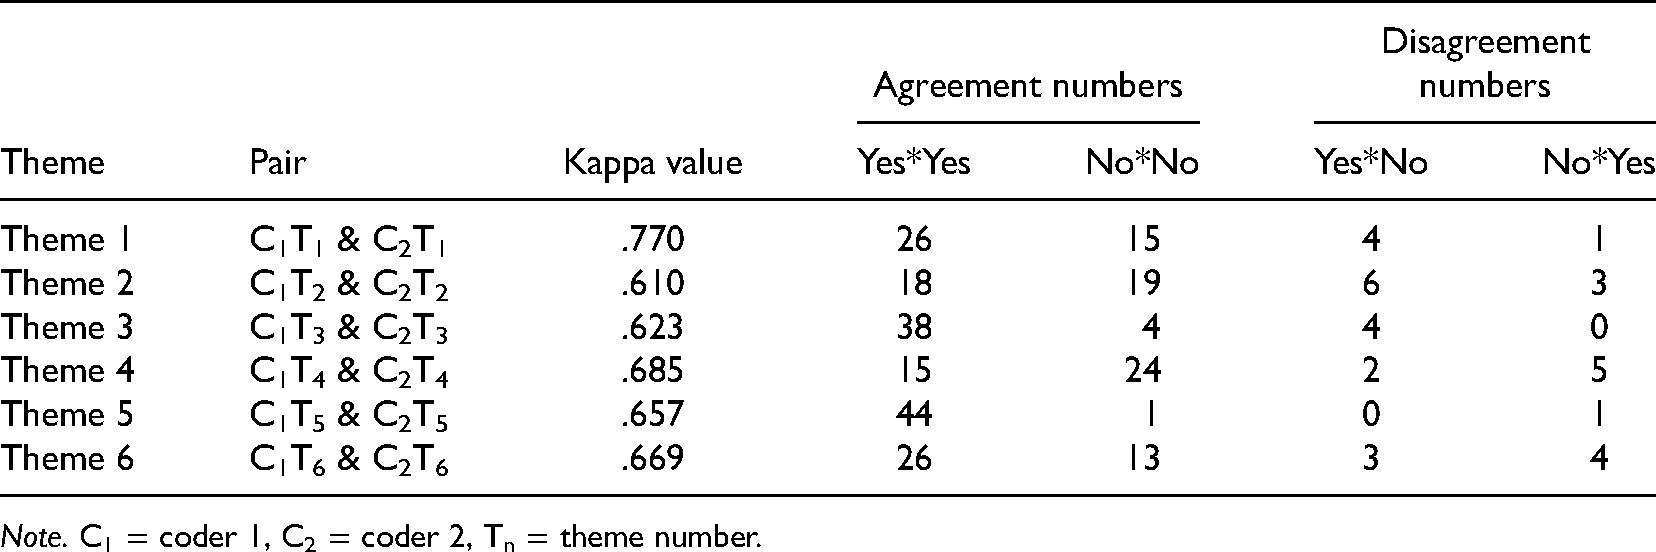
Note. C1 = coder 1, C2 = coder 2, Tn = theme number.
According to Landis and Koch (1977) recommendation, Cohen's kappa values ranging between .61 and .80 indicate substantial agreement. Therefore, from Table 1, there was a substantial agreement between the two coders. Since the reliability was good enough, I moved on to code the rest of the data set.
Data was analyzed in two phases according to the data type. The first phase of quantitative data analysis involved the use of exploratory data analysis, multivariate analysis of variance (MANOVA), and standard multiple regression (SMR) analysis. Starting with a descriptive analysis, the mean (and its standard deviation) was used to summarize continuous variables, while frequencies were used to describe the categorical variables. The data, which was initially screened for unengaged responses and missing entries, showed that <1% (.16%) of data entries, excluding respondents’ biodata, were missing completely at random. However, to avoid risking statistical results even though the missing data was <5% (Tabachnick & Fidell, 2013) and completely random, a multiple imputation approach as recommended by Eekhout et al. (2014) was used to replace the missing data.
Based on the participants’ background characteristics (courses studied, gender, and school type), mathematics teachers’ popularity was divided into groups using a two-step auto-clustering analysis approach. To compare the instructional quality of mathematics teachers across the clusters of their popularity, the descriptive statistics for each cluster and a one-way MANOVA were performed. Additionally, the SMR was performed to examine the predictability of teacher popularity from the quality of their mathematics instruction. In the SMR analysis, the basic assumptions underpinning SMR were verified. Specifically, multiple regression assumptions were tested, and no significant violations were committed. A visual inspection of box plots showed that the data on teacher popularity and instructional quality were relatively normally distributed. Multicollinearity among the predictor variables was absent since (
In the second phase, the qualitative data was analyzed thematically with the aid of NVivo 12 software. Themes, patterns, and relationships emanating from the codes were interpreted to provide meaning to the quantitative results. By doing so, joint displays (Creswell & Plano Clark, 2018; Guetterman et al., 2015) were used to summarize and interpret students’ likeability of their teachers (research question 2). In the results section, data analyses are presented according to the research questions.
Results
Research question 1: What homogenous clusters of popular mathematics teachers emerge based on students’ perceptions and characteristics?
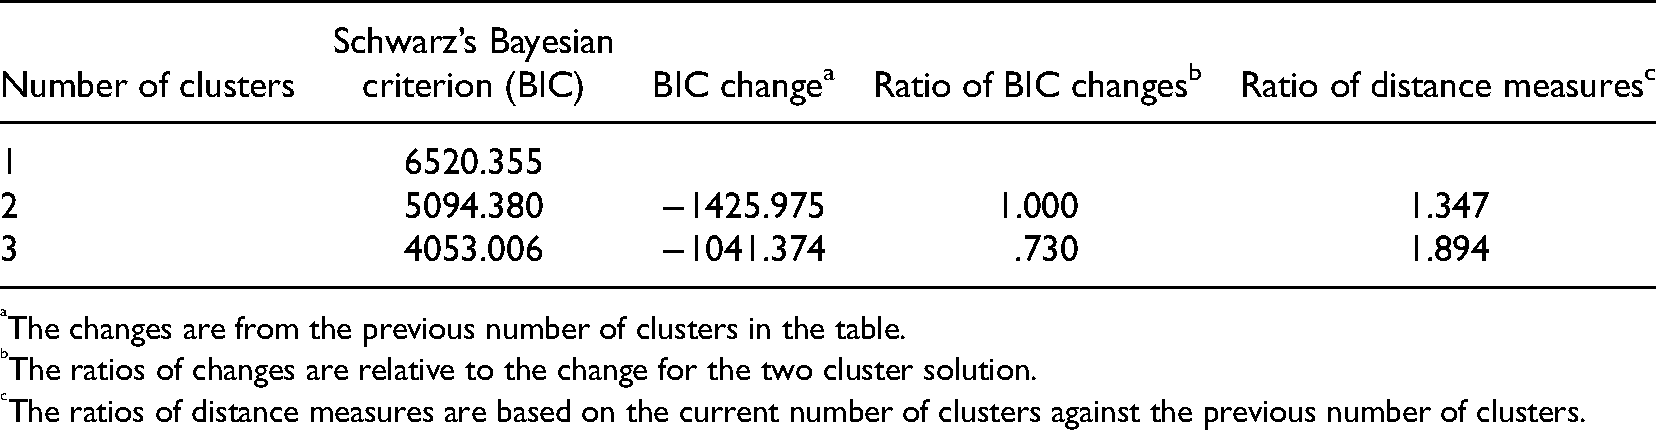
Four background characteristics of the research participants were included in the present study. The characteristics included: the course studied (General Arts, Business, Home Economics, Science, and Visual Arts); gender (male or female); school type according to GES categorization (A, B, or C); and gender categorized school type (gendered or unisex). Based on a two-step auto-clustering analysis, a three-cluster solution that best profiled the popularity of mathematics teachers in connection to the background data was revealed. The predictor importance of students’ background characteristics to the formation of mathematics teachers’ popularity clusters was school type (GES category = 1.0, gender category = .73), course studied = .54, and gender = .53. Moreover, the ratio of the largest cluster to the smallest cluster was 3.44. Furthermore, the cluster quality (average Sihouette = .5) was good. The auto-clustering statistics confirming the suitability of the number of clusters are presented in Table 2.
Autoclustering statistics.
Autoclustering statistics.
The changes are from the previous number of clusters in the table.
The ratios of changes are relative to the change for the two cluster solution.
The ratios of distance measures are based on the current number of clusters against the previous number of clusters.
The descriptive statistics for the three clusters of mathematics teachers’ popularity are also presented in Table 3. Using the mean rating as a yardstick for describing teachers’ popularity (Table 3), mathematics teachers can be classified as very popular, moderately popular, or less popular. Numerically, the very popular mathematics teachers (cluster 2, M = 3.44, SD = .536) were fewer than the moderately popular teachers (cluster 1, M = 3.38, SD = .588) and more than the less popular teachers (cluster 3, M = 3.19, SD = .586). The equality of sample sizes for cluster 1 (N = 447), cluster 2 (N = 197), and cluster 3 (N = 130) was statistically significant (p < .001,
Frequency, mean, and standard deviation for each cluster of teacher popularity.
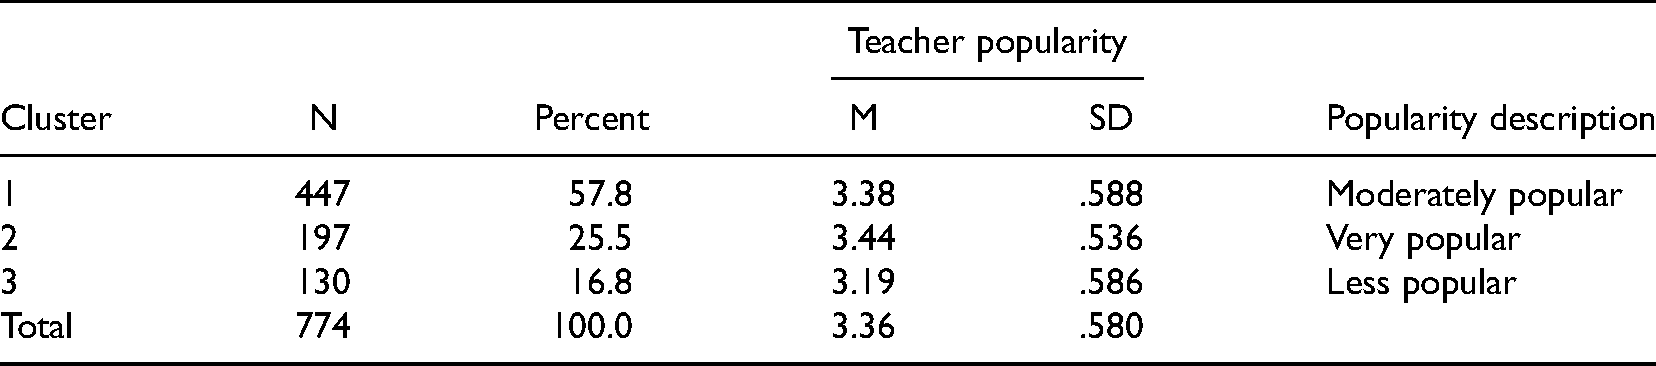
Table 4 shows the background distribution of participants. Remarkably, the distribution of mathematics teachers’ popularity was also varied across the background variables (Table 4).
Number of cases for each variable per cluster.
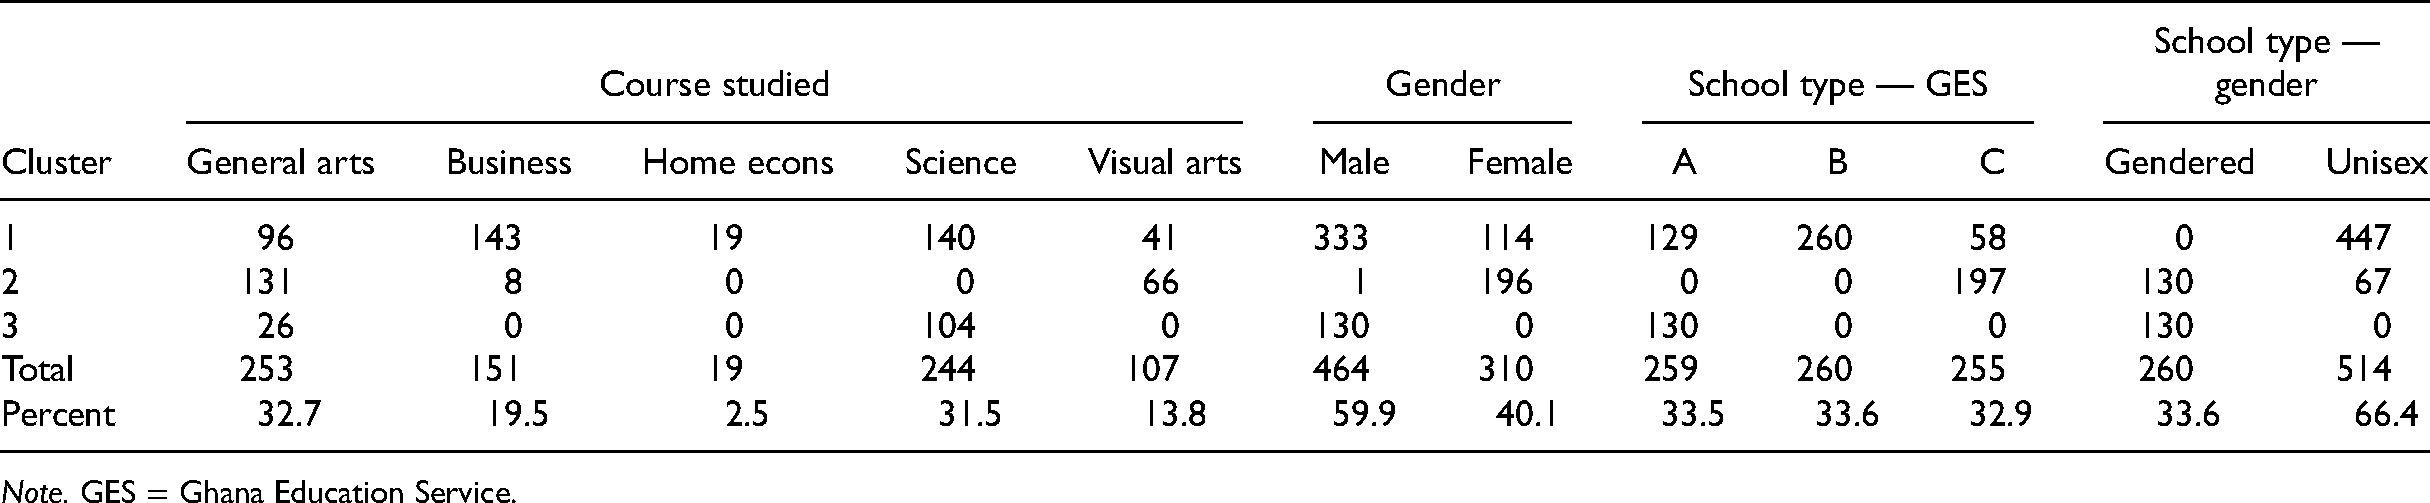
Note. GES = Ghana Education Service.
In terms of students’ gender, mathematics teachers were very popular with female students, while moderately popular mathematics teachers were identified with male students. For school type, the very popular mathematics teachers were found with students in category C and gendered schools, whereas the moderately popular mathematics teachers were found with students in category B and unisex schools. Moreso, less popular mathematics teachers were identified with students in category A and gendered schools as well. Relating to the courses studied, students studying general and visual arts found their mathematics teachers to be very popular. However, students studying business, home economics, and science found their mathematics to be moderately popular.
Prior to investigating the differences in the quality of instruction among the levels of teacher popularity, the survey data on the quality of mathematics instruction as presented in Table 5 was analyzed.
Students’ perceived quality of mathematics instruction.
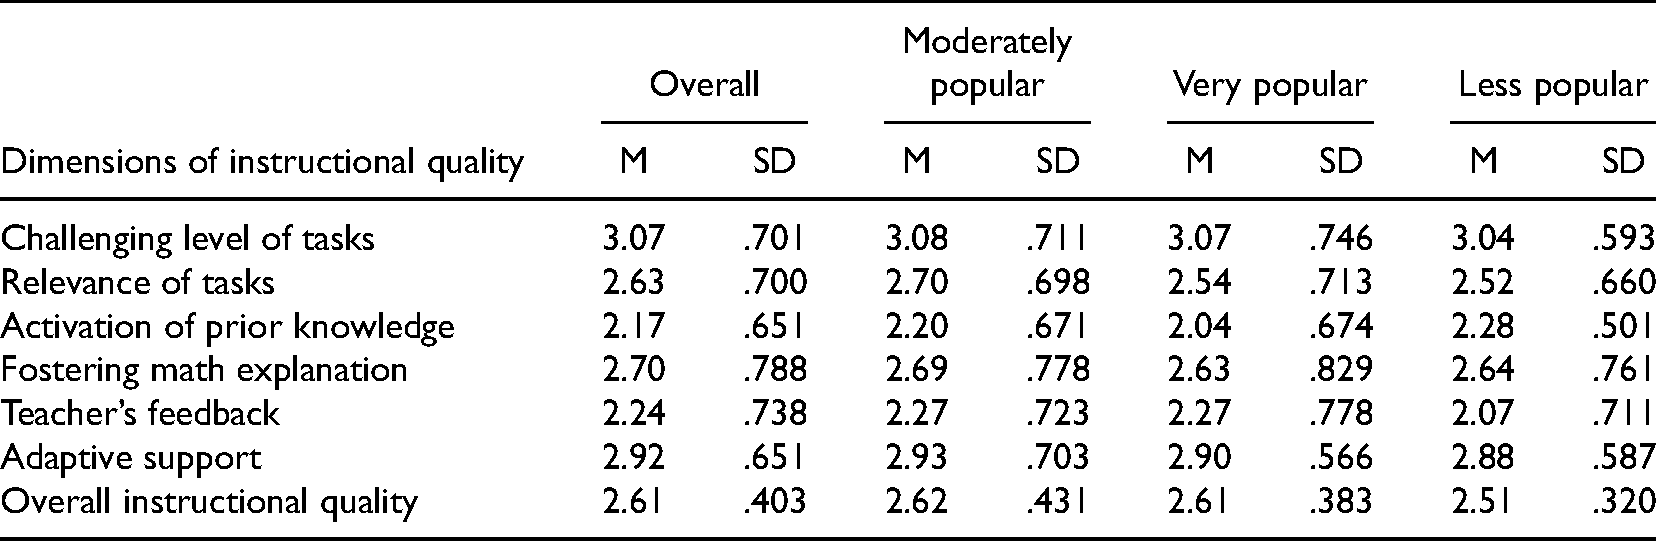
Based on the six dimensions of instructional quality (Table 5), challenging level of mathematics tasks, was highly rated (M = 3.07, SD = .701). By extension, instructional strategies, which connote teachers’ use of cognitively challenging teaching methods vis-a-vis the mathematics content and level; teachers’ provision of appropriate number and difficulty level of tasks; and teachers’ provision of sufficient time-on-task for students’ learning, were key drivers of the quality of mathematics instruction. Nonetheless, the activation of prior knowledge was the least-rated dimension of instruction quality in mathematics (M = 2.17, SD = .651). Thus, using the indicators of activation of prior knowledge, the data indicates that teachers seldom activated and explored students’ prior knowledge. It was also likely that teachers hardly gave students the opportunity to use their own words to explain tasks, or that teachers did not co-construct knowledge with their students in class. When the data on instructional quality was taken together (Table 5), the average quality of instructional rating (M = 2.61, SD = .403) was moderate based on Tekin's formula (as cited in Deringol, 2018), low rating (mean score of 1.00–1.99), moderate rating (mean rating of 2.00–2.99), and high rating (mean score of 3.00–3.99). Nevertheless, the overall rating of instructional quality was higher than the rating for teacher’s feedback and the activation of prior knowledge (Table 5). This means that the teacher’s feedback dimension of instructional quality, which is indicated by the sophistication, constructiveness, and forward-looking nature of teachers’ feedback to students, might be inadequate. As a result, the activation of students’ prior knowledge and teachers’ feedback to students during mathematics instruction were lowering factors for instruction quality.
Across all teacher popularity levels (Table 5), moderately popular mathematics teachers received the highest instructional quality rating (M = 2.62, SD = .431). This was followed by very popular (M = 2.61, SD = .383) and then less popular (M = 2.51, SD = .320) teachers. A one-way between-group MANOVA was conducted to investigate differences in the quality of instruction among the levels of teacher popularity. The popularity levels of very popular, moderately popular, and less popular were independent variables, while the six dimensions of instructional quality were the dependent variables. A preliminary testing of MANOVA assumptions showed that the test of the assumption of homogeneity of variance-covariance was violated (Box’ test sign < .001). Similarly, the assumption of equality of variance (Levene's test) for the dimensions of challenging level of tasks, activation of prior knowledge, and adaptive support was violated. (Hence, a more stringent alpha level of .025 was used to determine the significance for the univariate F-test).
The Pillai's Trace Multivariate Test of Significance showed a statistically significant difference among the levels of teacher popularity in terms of the quality of instructional engagements F(12, 1534) = 2.709, p = .001; Pillai's Trace = .042; partial eta squared = .02. Using the Bonferroni adjustment (
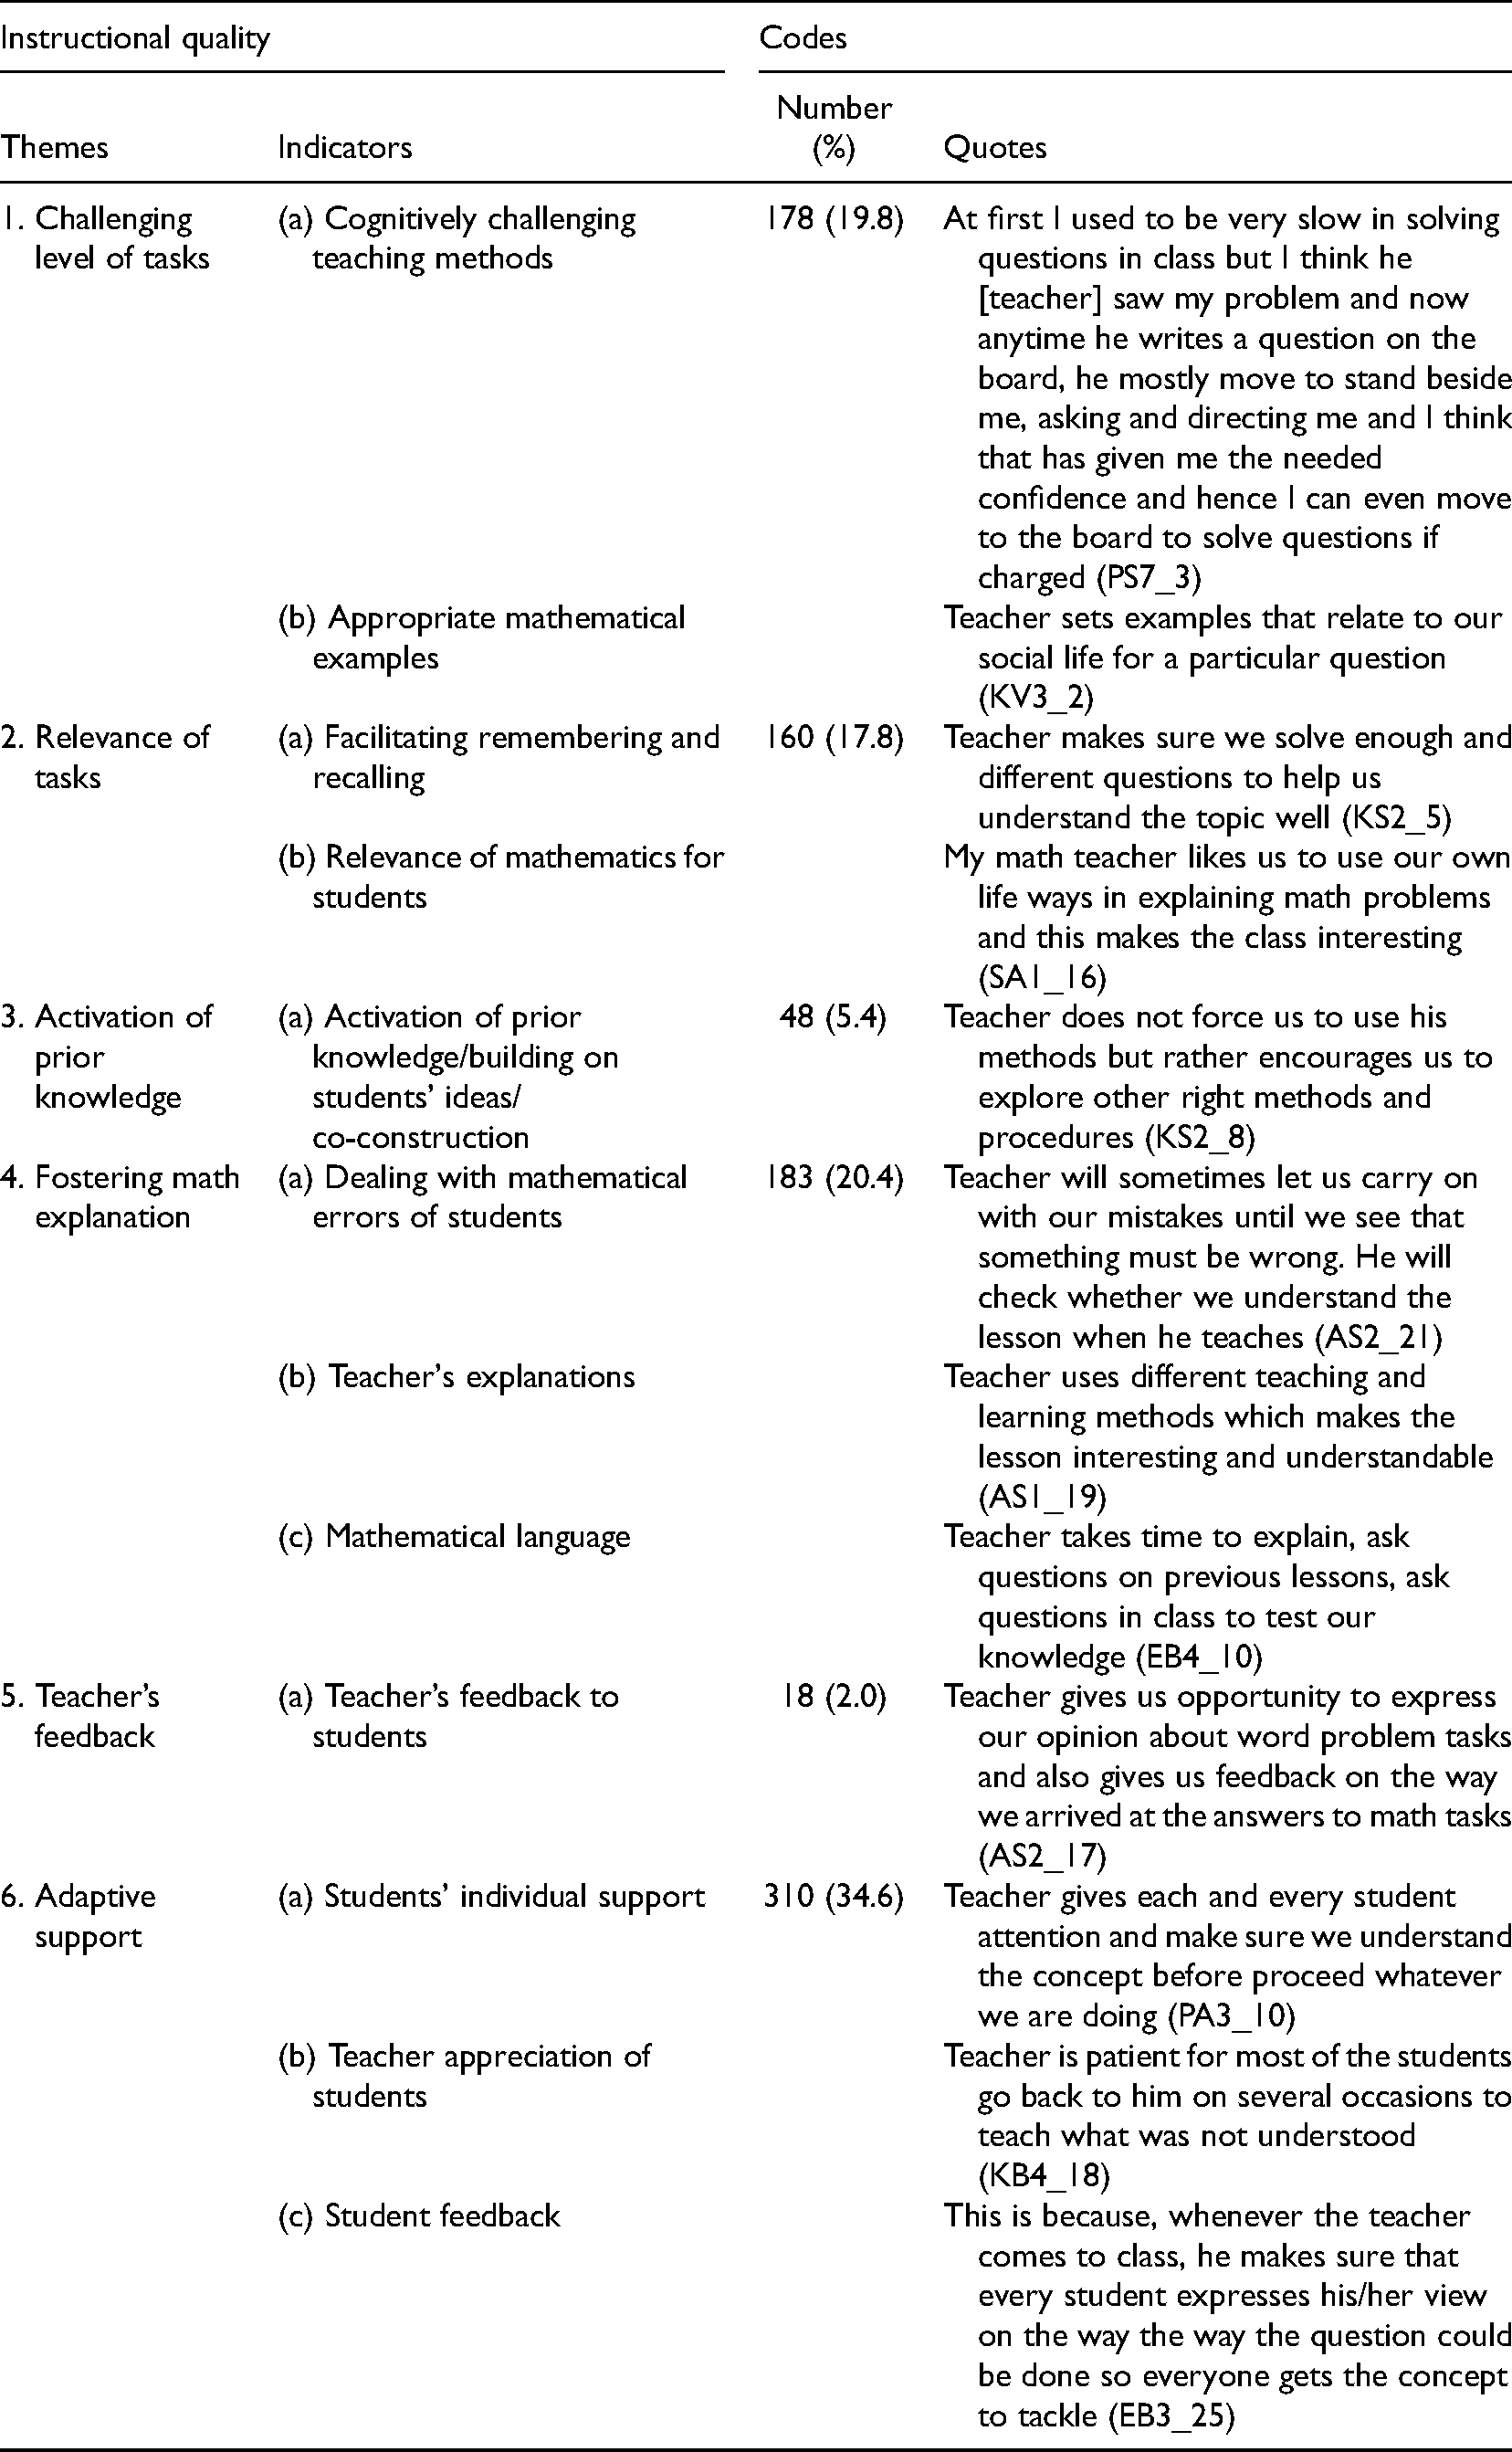
From the reasons respondents gave in support of why they liked their mathematics teachers, 897 codes were deduced. Based on responses from open-ended question, 452 out of the 774 (that is 58.4%) expressed likeability of their mathematics teachers. Table 6 shows a summary of how much students like their mathematics teachers based on how well they teach mathematics.
Joint display of students’ likeability of teachers (total codes = 897).
Joint display of students’ likeability of teachers (total codes = 897).
Teachers’ adaptive support, which comes in the form of students’ individual support, teacher appreciation of students, and student feedback, was most cited for being the source of liking teachers (Table 6). Students liked their mathematics teachers because they often supported them in their mathematics learning, as explained by NV1_25 who said, “he[teacher] teaches his students to our understanding and encourages us[students] and I am very proud of that.” The second most cited dimension of instructional quality that students liked their teachers for was fostering mathematical explanations (Table 6). The explanations provided by the students that led to their liking related to teachers’ ability to deal with the mathematical errors of students, teacher's explanations, and the development of mathematical language. For example, a student disclosed that “he[teacher] will sometimes let us carry on with our mistakes until we see that something must be wrong. He will check whether we understand the lesson when he teaches.” Besides fostering mathematics explanation, the challenging level of tasks teachers used was the third instructional practice that attracted students to like their mathematics teachers (Table 6). As posited by one of the respondents, KV3_2, their likeability of their mathematics teacher was because the teacher sets examples that related to their social life. Another respondent, KS2_19 intimated that the teacher uses past questions (referring to exit external examination) and likely examination questions in their instruction. The instructional practices of the teachers in using appropriate mathematical examples and challenging tasks signified that the teachers provided appropriate challenging level of tasks. The least popular dimension that the students cited for explaining the popularity of mathematics teachers was teachers’ feedback to students. Eighteen codes explaining teachers’ feedback were derived (Table 6).
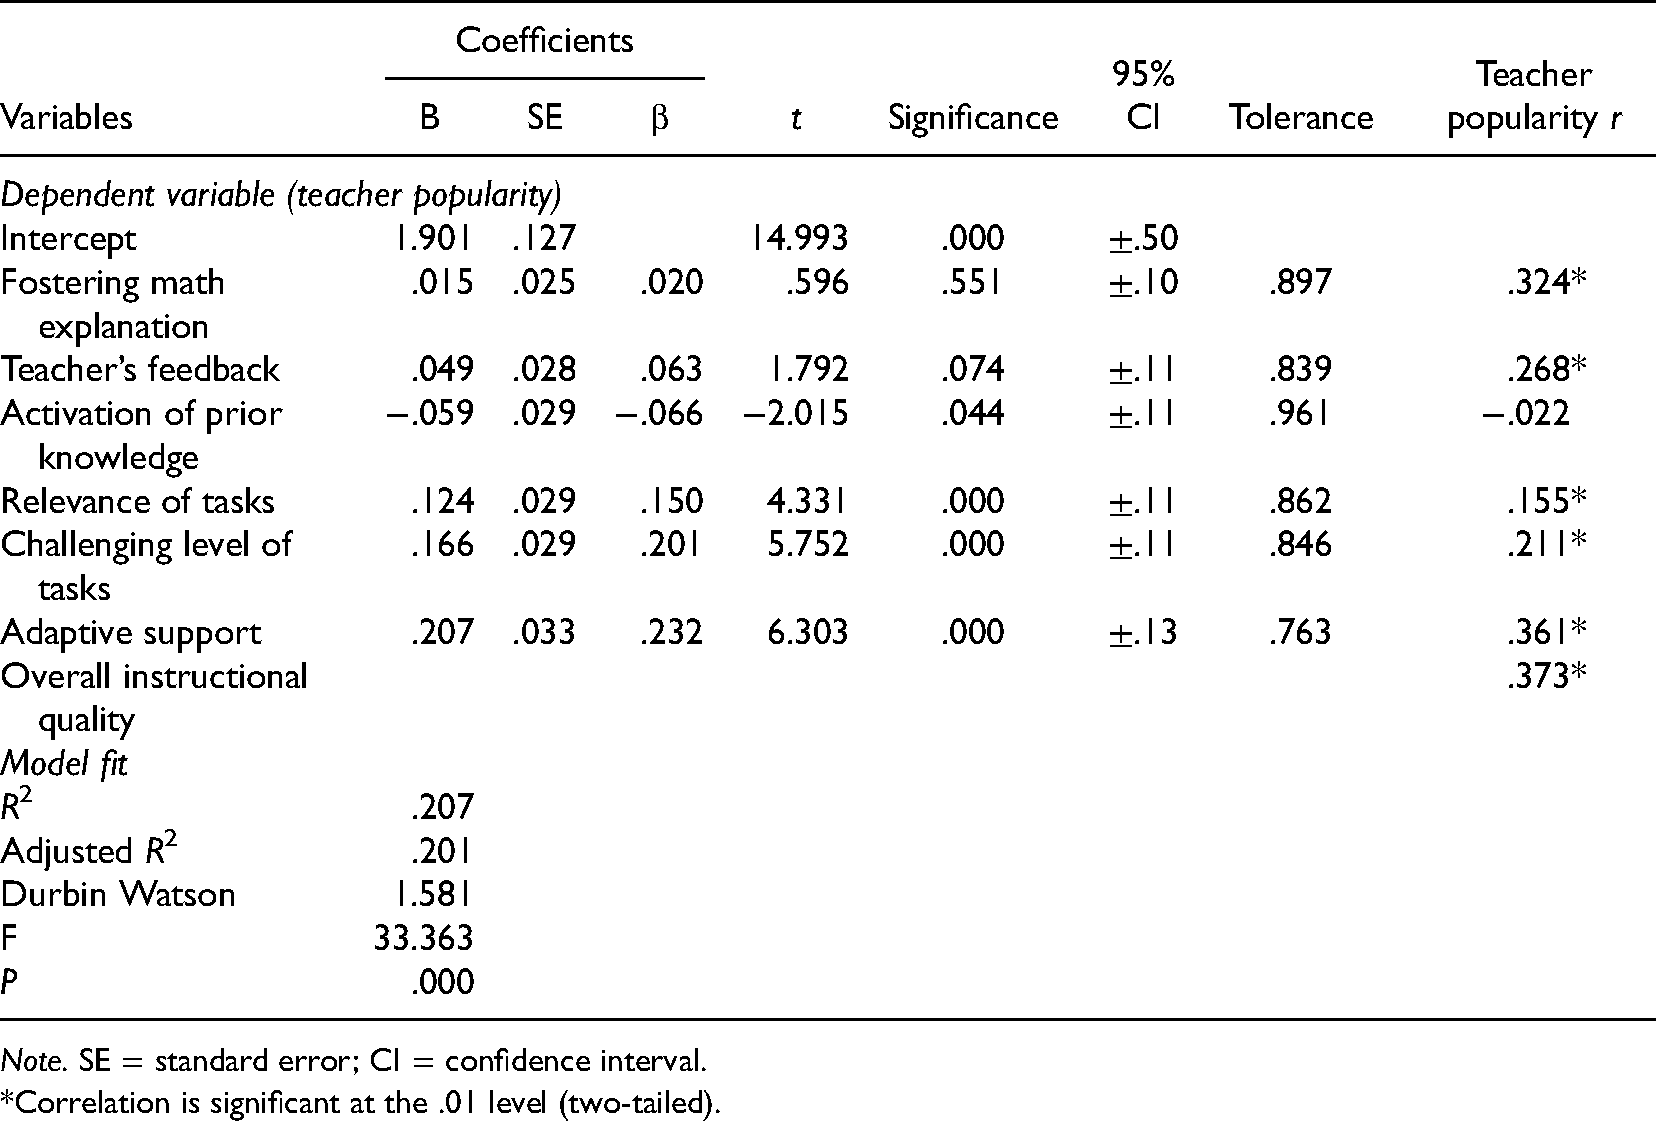
To examine the predictability of teachers’ popularity from the quality of instruction, teacher popularity was regressed on the six dimensions of instructional quality using standard multiple regression analysis. Markedly, significant correlations (at .01 significant level) between teacher popularity and the dimensions of instructional quality were found, except for the dimension of activation of prior knowledge (Table 7). The results of the standard regression models are presented in Table 7. (Note: the effect of predictors
Model summary of standard multiple regression of teacher popularity on practices of instructional quality.
Model summary of standard multiple regression of teacher popularity on practices of instructional quality.
Note. SE = standard error; CI = confidence interval.
*Correlation is significant at the .01 level (two-tailed).
The regression model for teacher popularity (
This study sought primarily to explore the predictability of mathematics teachers’ popularity based on the quality of instruction in mathematics. Unlike Fauth et al. (2018), who conjectured that a teacher popularity may be parallel to the quality of teaching, this study has confirmed that the instructional quality measures are different from teacher popularity measures. Using the average of students’ likeability of their teachers as a reliable measure of a teacher’s popularity (Fauth et al., 2018), this study has empirically confirmed the popularity of mathematics teachers at the high school level. Despite the notion held within students’ circles that mathematics teachers are too serious, no-nonsense takers, like caning, among others (Leong, 2015), a good percentage of students still liked mathematics teachers. An average high mean rating of 3.36 out of 4.0 (i.e., 84%) convincedly established the popularity of mathematics teachers. While other factors such as the prestige of teaching mathematics may contribute to this high level of popularity (Ilany, 2022), the importance of quality mathematics instruction cannot be overstated. One finding worth noticing in this study was the discovery of a 58.9% likeability of mathematics teachers based on their teaching. The finding therefore corroborates the idea that popular teachers are usually those with a high quality of instruction (Fauth et al., 2014). As expected, teachers who are knowledgeable, fair, and achieve excellent results turn out to be popular (Hampshire-Dell, 2020) and students’ likeability can be very positive toward such teachers, as suggested by one of the respondents in this study: “In fact, he [teacher] is a very great teacher and I will always want him to be my math teacher” (EB1_4).
A closer look at the findings of this study from instructional perspectives agree with previous studies (Fauth et al., 2018; Kunter, et al., 2013; Wagner, 2008) that not all dimensions of instructional quality relate to teacher popularity. Specifically, the study showed that three dimensions of instructional quality, in ordinal sense, that is adaptive support, challenging level of tasks, and relevance of tasks provided the strongest reasons for students’ likeability of mathematics teachers. Most importantly, it seems that the individual support for students, and teachers’ appreciation of students, which are interwoven with the appropriateness of mathematical examples and challenging teaching methods might have won the hearts of many students. This result is akin to the findings of previous studies which have concluded that adaptive support builds confidence and enhances self-regulated learning in students (Corno, 2008), challenging level of tasks motivates students to learn mathematics (Livy et al., 2018), and relevance of tasks make mathematics real to students (Wijaya et al., 2018) provided that teacher quality (to wit mathematics teachers enact quality instruction) made popular teachers (Fauth et al., 2014). Interestingly, the finding that providing challenging tasks to activate students’ cognition positively related to teacher popularity was noteworthy considering concerns raised by Anthony (1996). Nonetheless this finding confirms the observation of Russo and Minas (2020), which suggests that students enjoy being challenged in mathematics.
The findings further revealed that the least mean rated dimension of instructional quality, that is activating prior knowledge caused a significantly decrease in the popularity of mathematics teachers (a unit increase in mathematics teachers’ attempt at activating students’ prior knowledge decreased popularity by approximately 6%). The interesting part of this findings was that activating prior knowledge was not hypothesized to predict teacher popularity since the constructs never correlated statistically. Nevertheless, given that activating prior knowledge was a significant predictor in the regression model, it is likely that the positive benefits of activating prior knowledge on popularity was subsumed by other variables in the regression model. Be as it may, instructional activities that were targeted at activating students’ prior knowledge, such as asking for students’ beliefs about a topic, asking students to explain tasks in their own words, or co-constructing knowledge with students, made teachers less popular. Although, students come to school with a vast experience and knowledge, which teachers can utilize such experiences to foster learning, it can be conjectured that mathematics teachers in this study did not adhere to the admonitions of Noddings (2005) and Dávila (2015) that teachers should be sensitive in activating students’ prior knowledge as it can be a boring instructional activity. Since the activation of students’ prior knowledge derailed students’ likeability of mathematics teachers, it is possible to alter the conclusion of Dong et al. (2020) and suggest that students recognize what they already know when previous knowledge is “meaningfully” activated. Only then will students enjoy mathematics instructions and improve the likeability of mathematics teachers.
Additionally, two other dimensions of instructional quality, that is fostering mathematics explanation, and teacher’s feedback did not predict the popularity of mathematics teachers. As expected, teacher’s feedback dimension had the least references from the students, which suggests that the feedback mathematics teachers provided did not make students to like them. Even though, the students seem to have suggested that their teachers provided feedback on how they got answers to questions, what remains suspicious is the social and emotional reactions of the teachers accompanying the feedback provided. As pointed out by Fauth et al. (2018), respect, warmth, and recognition of students’ opinion relate strongly with teacher popularity.
Like any popularity contest, the findings of this study showed that mathematics teachers could be categorized into three popularity groups (i.e., very popular, moderately popular, and less popular). Interestingly, the number of moderately popular teachers outnumbered the number of very popular and less popular teachers. Thus, although the popularity of mathematics teachers is not in doubt among high school students, they are not all very popular. A possible reason could be that many students are not too fond of their mathematics teachers. This is because out of the three items on the popularity scale, the question about fondness of students to their mathematics teachers was the least item to explain teacher popularity. This submission seems to agree with the conclusion of Payne (1987) that teachers’ disrespect for students can make them unpopular. Besides, the data also suggested that students’ characteristics such as their gender and courses studied might possibly determine the popularity of mathematics teachers. Female students in this study like the findings of Fauth et al. (2018), liked their mathematics teachers more than male students.
Regarding the quality of instruction, the three groups of popular teachers were similar in relation to the challenging level of tasks for mathematics instruction, the attempt at fostering mathematics explanation, and the adaptive support provided. However, the three groups of popular teachers were dissimilar in the other three dimensions of instructional quality (relevance of tasks, activation of prior knowledge, and teachers’ feedback). Coincidentally, these differences occurred among the dimensions which were either not fancied by students (according to participant responses) or had the least mean rating (according to the survey), and so did not significantly predict the popularity of teachers. This finding may somewhat provide a concrete basis for a teacher to belong to a specific category of popularity. As seen from the descriptive statistics, unlike the moderate and less popular teachers, the very popular teachers were not highly rated in the dimensions of instructional quality that did not sufficiently predict teacher popularity.
Conclusion
This present study has shown that at the senior high school level in Ghana, mathematics teachers are generally popular. The popularity of these mathematics teachers could be clustered into three groups: very popular, moderately popular, and less popular, with most of the mathematics teachers being moderately popular. Besides, the study has also confirmed that high school mathematics teachers provided moderate-quality instruction. Although the popularity of mathematics teachers was predicted by the quality of mathematics instruction, teachers’ instructional practices of fostering mathematics explanation and providing feedback were not significant predictors of teachers’ popularity. Nonetheless, teachers’ adaptive support, which is defined by the learning support rendered to individual students, teachers’ appreciation of students’ effort, and teachers’ accommodation of students’ feedback, were the major reasons students liked their mathematics teachers. This study further showed that the three groups of popular teachers differed in three dimensions defining the quality of mathematics instruction (relevance of tasks, activation of prior knowledge, and teachers’ feedback), but they were indifferent in the dimensions of challenging level of tasks, fostering mathematics explanation, and adaptive support.
Limitations and recommendations
Although the survey results in this study were validated with the responses from the open-ended question, the findings were not triangulated with the views of the mathematics teachers on whose heads the dice was thrown. Moreso, the analysis in this study was taken from a composite measurement as a reflection of the opinions of all students put together. It is possible that class-level and school-level analyses may provide differing results. That notwithstanding, this study has showed that high school students’ evaluation of instructional quality in mathematics cannot be wholly branded a popularity contest and that the popularity of mathematics teachers can be predicted by the quality of instruction.
Since the popularity of a mathematics teacher and the quality of mathematics instruction correlated positively, mathematics teachers should endeavor to enact quality instruction in all dimensions. By so doing, teachers become more popular and students are more willing to do things to satisfy their favorite teachers. Also, popular teachers can motivate students to like them and the topic. It is recommended that future studies be conducted to further explore specific instructional practices in mathematics that do not heighten teacher popularity. Additionally, the inclusion of teacher enjoyment of teaching mathematics in the teacher popularity and instructional quality relationship might be interesting to explore in future research. By merging the findings of this present study with the results of previous studies (Frenzel et al., 2016; Russo et al., 2020) that related teacher enjoyment with instructional quality, a significant relationship might be expected between teacher popularity and teaching enjoyment.
Footnotes
Declaration of Conflicting Interests
The author(s) declared no potential conflicts of interest with respect to the research, authorship, and/or publication of this article.
Funding
The author(s) received no financial support for the research, authorship, and/or publication of this article.
Author biography
Isaac Bengre Taley is a mathematics teacher educationist at Mampong Technical College of Education, Ghana. His research interests include instructional quality in mathematics, teaching and assessing linguistically framed mathematics tasks, affect in mathematics, and mathematics teacher development. He has also published a couple of articles relating to virtual mathematics instruction in the wake of the COVID-19 pandemic.
Coding frame spanning six dimensions/themes of instructional quality.
| Themes | Sub-themes | Descriptors |
| Theme 1 Challenging level of tasks |
Cognitively challenging teaching methods | Cognitively challenging teaching methods are used The teacher provides enough time to think about the tasks The teaching methods correspond to the content and the class |
| Appropriate mathematical Examples |
The examples contain fundamental mathematical ideas The teacher provides an appropriate number of examples The examples are taken from students’ everyday life |
|
| Theme 2 Relevance of tasks |
Facilitating remembering and recalling | The teacher provides enough examples and helpful reminders The teacher provides enough repetitions Relevant steps are discussed with the whole class |
| Relevance of mathematics for students | The teacher provides connections to students’ everyday life The teacher addresses the relevance of content Students may bring in their own experience and interests to class |
|
| Theme 3 Activation of prior knowledge |
Activation of prior knowledge/building on students’ ideas/co-construction | The teacher asks for students’ beliefs concerning the topic The students explain the task in their own words The teacher activates and explores students’ prior knowledge Knowledge is developed co-constructively in class |
| Theme 4 Fostering math explanation |
Dealing with mathematical errors of students |
The teacher uses students’ errors as opportunities to learn The teacher analyzes students’ errors and misconceptions The teacher is tolerant toward students’ errors Students correct their errors on their own |
| Teacher's explanations | The teacher explains slowly, especially when difficulty arises The teacher focuses on the fundamental mathematical aspects Teacher's explanations are suitable for the students Teacher's explanations are well structured and precise |
|
| Mathematical language | The teacher provides time for building new concepts The teacher corrects language errors in an appropriate manner The teacher initiates the adequate use of mathematical language |
|
| Theme 5 Teacher’s feedback |
Teacher’s feedback to students | The teacher's feedback is sophisticated The teacher's feedback is constructive The teacher's feedback is forward looking |
| Theme 6 Adaptive support |
Students’ individual support | The teacher asks about students’ individual difficulties/individual progress The teacher takes time for individuals The teacher provides individual assistance for students |
| Teacher appreciation of students | The teacher is patient The teacher positively enhances the students’ work The teacher encourages the students |
|
| Student feedback | The teacher asks for feedback The teacher reacts to students’ feedback The teacher and students talk about issues in class |