
Abstract
After each round of International Large-scale Assessments such as the Trends in International Mathematics and Science Study (TIMSS) and the Programme for International Student Assessment (PISA), excellent achievements by countries in East Asia are explained in terms of their instructional practices. However, instructional practices are not easily captured in self-reported scales. In addition, speculations on what approaches lead to the highest mathematics achievement are often combined and conflated with discussions on how mathematical content needs to be taught. This article reports on a secondary analysis of TIMSS 2019 Grade 8 data from 46 jurisdictions of teacher-reported answers on instructional practices. Using a data-driven exploratory factor analysis, three instructional scales are compiled and supplemented with variables on barriers to instruction and instructional time. Multilevel models of all countries are created for students and teachers, in which the relationship between these instructional practices and mathematics achievement is explored. Across countries, the results show that the three new scales for instructional practice work in limited and different ways, but that barriers toward instruction, and to a lesser extent, instructional time, predict mathematics achievement. However, there is no consistent pattern of instructional practices across all countries, and also not among East Asian countries.
Introduction
One of the persistent discussions in secondary mathematics education is the one about which instructional practices in classrooms are the most effective to learn mathematics. Often such discussions cover more than just that tension, with emphasis on the approaches that lead to the highest mathematics achievement (e.g., inquiry or teacher-directed), the nature of tasks that students are asked to do (e.g., more open or more closed tasks), discussions about conceptual and procedural knowledge, or whether there should be more practice of basic skills or often vaguely formulated “problem-solving tasks.” In these initial sentences, it can be hard to seem neutral in describing the quandary, because tensions can be so high that even calling basic skills “rote” or referring to “real” understanding, can be seen as biased, leading to a rather fruitless polarization of the discussion. It is no coincidence that earlier instantiations of the debate have been termed the “Math Wars” (Schoenfeld, 2004). The proliferation of International Large-Scale Assessments (ILSAs) such as the Programme for International Student Assessment (PISA) and the Trends in International Mathematics and Science Study (TIMSS) has contributed to the debate as well, as still in the most recent results, many East Asian countries score higher than Western countries in both content and cognitive domains (Mullis et al., 2020; OECD, 2019). This unsurprisingly then leads to speculations as to why they do better, with associated claims about East Asian mathematics teaching practices. Already some time ago, Biggs (1994, 1998) highlighted the “Paradox of the Asian learner” where—according to Western views—seemingly traditional Asian classrooms aimed at “low-level cognitive goals” (e.g., emphasizing memorization), still lead to better outcomes for reasoning and other “higher order” skills. More recently, Leung (2001, 2017) described how the features in both East Asian and Western mathematics education are based on deep-rooted cultural values and paradigms. Leung’s (2001) study indicates how multiple perceived dichotomies seem to come together in comparisons between the East and West.
Two things can be noted here. Firstly, these factors often do not, whether we like it or not, stand on their own, and that the discussion is multifaceted. Secondly, it remains to be seen that these distinctions, although useful for our thinking, really are dichotomies. As Leung (2001) points out, Western scholars might “consider their East Asian counterparts as old fashioned in sticking to a product view of mathematics, but East Asians believe that their Western counterparts may have gone too far towards the process extreme” (p. 39). Leung (2001) also highlights that seeing memorization as learning without understanding is “too simplistic a view” (p. 41). Despite such nuance, Leung (2017) also asserts that East Asian countries form a cultural cluster. So, on the one hand, research has shown us that a multifaceted view is necessary; on the other hand, we still see caricatural discussions on the “best” way to teach mathematics, not seldom pointing toward those countries in East Asia that score high on international assessments and a reductive view on their instructional practices. This article aims to reinvestigate the theme of instructional practices in East and West with recent data from Grade 8 (lower secondary) TIMSS 2019.
We focus here on the “East” as in “East Asia,” and in particular the East Asian jurisdictions included in TIMSS 2019: Japan, Hong Kong SAR, Chinese Taipei, Korea, Singapore, and Malaysia. Based on 13 teacher-reported questionnaire items on instructional practices and a data-driven exploratory factor analysis (EFA), new scales for instructional practices are created. The scales are complemented with variables on barriers toward instruction and instructional time. The article then explores whether these practices are associated with mathematics achievement, including 43 of 46 jurisdictions countries in the TIMSS 2019 dataset, by creating multilevel models. The aims are three-fold: firstly, to show that discussions about instructional practices depend on the operationalization of the key concepts, a data-driven approach is used to create our instructional scales. Secondly, this article provides a contemporary analysis with the 2019 data. Thirdly, the article shows that with these scales, there seems to be no consistent pattern in differences in instructional practices between “East” and “West.”
Literature review
This study can be situated in many decades of discussions on the “best” way to teach mathematics in schools, which we here interpret as “leading to the highest mathematics achievement.” Although this article does not aim to fully review the available literature, the impetus for the focus of this article lies in a prevailing quest to make generalizations about effective instructional practices in mathematics classrooms across the world. One of the influential publications on mathematics education in East Asia is the work by Leung (2001). In comparing West and East, Leung (2001) describes multiple dichotomies: product versus process; rote learning versus meaningful learning; studying hard versus pleasurable learning; extrinsic versus intrinsic motivations; whole-class teaching versus individualized learning; and competence of teachers: subject matter versus pedagogy. With such a range of variables, one question that arises is to what extent these approaches “occur together.” Are teachers who value process over product also inclined to prioritize conceptual knowledge? Do teachers who value pedagogy more than subject knowledge spend enough time on procedural knowledge? These are hard questions, especially in an international comparative context. We first review some of the more general literature on these dichotomies and then focus more on the literature about the distinction between East and West and studies that use ILSA data to do so. Finally, through some policy and media examples, we argue why our current study is relevant.
Components of mathematics teaching
Even without the international comparative element, there has been plenty of debate regarding the most effective ways in which to teach mathematics. The theme was central in what has been described as the “Math Wars” (Schoenfeld, 2004) in which an important issue concerned how students best acquire mathematical knowledge and skills: by practicing algorithms, or by focusing on reasoning and strategic problem-solving activities. In a synthesis of the available research on the concept of “mathematical proficiency,” Kilpatrick et al. (2001) synthesized five strands: conceptual understanding, procedural fluency, strategic competence, adaptive reasoning, and productive disposition. Conceptual understanding was defined as “the comprehension of mathematical concepts, operations, and relations” and procedural fluency as the “skill in carrying out procedures flexibly, accurately, efficiently, and appropriately” (p. 116). The five strands were said to be interwoven and interdependent, with room for different representations and solution methods, so that students could “discuss the similarities and differences of the representations, the advantages of each, and how they must be connected if they are to yield the same answer” (p. 119). Here, we already see how teaching methods and types of knowledge also are interwoven. After all, a view that multiple solutions would need to be covered, requires a different teaching strategy than one where you use one algorithm and apply this one algorithm. The role of algorithms in education has combined numerous talking points (Fan & Bokhove, 2014). In numerous classrooms, “algorithms” have been seen as part of a broader discussion on “procedural fluency” and “conceptual understanding” (e.g., Brownell, 1945; Hiebert & Lefevre, 1986; Skemp, 1976; Star, 2005).
Rittle-Johnson et al. (2015) reviewed the literature on the longstanding debate about the relationship between conceptual and procedural knowledge, concluding that procedural knowledge supports conceptual knowledge, as well as vice versa, and that the relationship between the two is bidirectional. They also note that limited research has been done on specific sequencing of instruction. Of course, trying to provide more or less successful sequencing, does seem to imply that attempts to link types of knowledge to particular teaching methods and strategies, is what is being asked here. One form of learning and teaching that sometimes is mentioned in relation to more conceptual understanding is “generative learning” (see Brod, 2021, for a review). Generative (GEN) learning strategies are activities that prompt learners to generate meaningful information that goes beyond the instruction. In doing so, learners activate prior knowledge and link to the newly provided information, which aids the integration of the knowledge in existing knowledge structures. Two examples of generative strategies are elaborative interrogation and self-explanation, which, according to Brod (2021), show benefits for various student groups under varying learning conditions. In mathematics education, Rittle-Johnson et al.’s (2017) meta-analysis of the literature on self-explanation prompts showed a moderate effect size for short-term improvement in conceptual knowledge. However, such effects were not always persistent and did not equate to time on task. Debates tend to mix different teaching practices. In their work on teaching practices, Pampaka and Williams (2016) explain how prior research has tried to relate student approaches to learning (strategic, surface/deep, etc.) to the teaching approaches literature. For example, an older review by Beattie et al. (1997) concluded that a fuller understanding of the “complex, composite and contingent nature of deep and surface learning and its interrelationship within the teaching-learning environment” (p. 1) is required. Beausaert et al. (2013) argued that a “teacher-centred approach predicts a surface approach to learning and a student-centered approach predicts a deep approach to learning” (p. 1). Finally, Chen and Li (2010) related Chinese teachers’ instructional practices and their possible impact on students’ learning, highlighting how teachers’ practices helped students build knowledge connections and coherence through lesson instruction. In sum, discussions about instructional practices seldom “stand alone” and are multifaceted.
Mathematics education in East and West
Numerous scholars have tried to describe the differences between West and East, covering multiple themes of Eastern and Western cultures (e.g., in addition to previous references, Bryan et al. 2007; Kaiser & Blömeke, 2013; Shimizu & Williams, 2012). In their analyses of mathematics education in the East and West, Leung (2006) and Leung et al. (2015) reported how culture mattered, especially a Confucian Heritage Culture, which included an examination culture, belief in effort, stress on memorization and practice, stress on reflection, discussion, and the Chinese language. However, Leung (2006) has also pointed out how even within the cluster of East Asian countries there are differences. For example, in comparing the results from a comparative study of primary school mathematics teachers in China and the United States by Ma (1999) and a small-scale replication of that study in Hong Kong SAR and Korea (Leung & Park, 2002), the majority of the teaching strategies reported by Hong Kong SAR and Korean teachers were procedurally rather than conceptually directed. This, however, then immediately introduces more discussion about what we mean by procedurally and conceptually; this is not so much a paradox, but a combination of both, for example in variation (Marton et al., 1996). Rather than seeing “memorization” and “understanding” as two mutually exclusive entities, in the context of East Asian countries, the starting point is that both work together to produce higher quality outcomes, not just in terms of test outcomes, but also in terms of metrics for mathematical understanding (Fan & Bokhove, 2014; Hess & Azuma, 1991; Marton et al., 1996; Rittle-Johnson et al., 2015).
In trying to decipher the concrete differences between West and East, Dahlin and Watkins (2000) argue that the linking pin between both is the role of repetition. Meaningful repetition can create “a deep impression”, which leads to memorization, and it can also lead to “discovering new meaning” (Dahlin & Watkins, 2000, p. 66), which in turn leads to understanding (Li, 1999). Such literature again gives the impression that many of the concepts associated with conceptual and procedural knowledge, also are associated with teaching methods. Cheng (2014) explicitly linked teaching practices to “procedural” and “conceptual,” positing a priori that teaching quality might be related to certain types of instructional practices. However, using TIMSS 2011 data, no combinations of the components of conceptual and procedural mathematics teaching practices were apparent across five high-performing Asian education systems. Despite this, scholars such as Leung et al. (2015) argued that there are “distinctive features in the classroom teaching and teacher education and development in East Asian countries which are markedly different from the corresponding practices in Western countries” (p. 137). Leung (2017) highlights three studies (Guo, 2014; Lie, 2014; Wu, 2009) that show such a “cultural cluster.”
ILSAs and instructional practices
Research with ILSAs data has also tried to unpick instructional practices in the mathematics classroom. In the seminal TIMSS 1999 Video Study, Hiebert et al. (2005) reported on results from seven countries. The countries participating in the mathematics portion of the TIMSS 1999 Video Study were Australia, the Czech Republic, Hong Kong SAR, Japan, the Netherlands, Switzerland, and the United States. Among the striking differences were that for applications of mathematics, the United States was the lowest with 34% problems per lesson, and Japan high with 74%. However, Hong Kong SAR was at the low end with 40%. On repeating procedures, Hong Kong SAR (81%), scored high just like the United States and European countries, but Japan was low. Both Hong Kong SAR and Japan were relatively low on reviewing and high on introducing and practicing new content. These observational results indicate instructional differences, also between East Asian jurisdictions.
With a focus on PISA 2012 mathematics results, Caro et al. (2016) looked at subject-specific teaching strategies related to mathematics performance of students across education systems whilst considering curvilinear associations and interactions with the socioeconomic and instructional context. They found that cognitive activation and teacher-directed instruction were positively related to mathematics performance, but that too high levels of the latter were negative for student performance. Associations of student-oriented strategies with mathematics performance were inconsistent. Wu et al. (2020) also used PISA 2012 data to examine the use of learning strategies in mathematics among East Asian students in East Asian educational systems. Their latent class analysis of the data found four classes of learning strategy types. The majority of the students in all seven East Asian educational systems utilized metacognitive strategies in combination with memorization. The authors concluded that “the cognitive processes employed by students of East Asian backgrounds are more complex and nuanced than the previous perception that they relied heavily on memorization” (Wu et al., 2020, p. 643).
Again using PISA 2012, Echazarra et al. (2016) studied the predictive nature of four instructional scales: an index of teacher-direct instruction, an index of student-oriented instruction, an index of cognitive activation, and an index of formative-assessment instruction. Theoretically, the authors seem to include assumptions for particular practices, for example, that “teacher-directed instruction risks leaving students in a passive and disengaged role, and performing monotonous tasks” (Echazarra et al., 2016, p. 34), student-centered teaching methods giving “students a more active role in classroom processes” (Echazarra et al., 2016, p. 34), and “[i]n order to foster conceptual understanding and students’ motivation to learn, teachers have to use content and stimuli that are challenging for students and demand the use of higher-order skills” (Echazarra et al., 2016, p. 34). The authors also assert that “teacher-directed and student-oriented strategies represent somewhat opposite ideas about instruction” (p. 48). However, there are substantial differences across all countries and East Asian countries in particular. For teacher-directed instruction, Japan, Shanghai–China, and Korea were at the higher end, Chinese Taipei, Singapore, and Hong Kong SAR more in the middle, and Malaysia at the lower end in the relative use of teacher-direct instruction. For student-oriented instruction, Singapore, Shanghai–China, and Hong Kong SAR were at the lower end, while Korea, Malaysia, and Japan were at the upper end. For formative assessment, Korea and Japan were at the bottom, while Malaysia, Hong Kong SAR, and Singapore more toward the higher end. Finally, for cognitive activation, Singapore and Hong Kong SAR were in the top half, while Malaysia and Korea toward the lower end. Echazarra et al. (2016) also looked at memorization practices reporting that their findings “challenges some deep-rooted beliefs about the over-reliance on rote learning and memorisation in East Asian countries, particularly those sharing a Confucian heritage” (p. 75).
Views on instructional practices in policy and media
Although we have already seen a tension between on the one hand a view that there are “cultural clusters” and on the other hand, instructional practices are multifaceted and firmly set in a local context, another factor in this debate is the fact that policies and media are still very much immersed in caricatures of instructional practices in East Asia. A recent policy example is the mention of Asia in a research review by the inspectorate in England (Ofsted, 2021). In discussing Asian practices, a mix of practices emerges. For example, Lim (2007) is cited several times in the review, who investigated characteristics of effective mathematics teaching in five Shanghai schools. She concluded that these classrooms showed teaching with variation, an emphasis on precise and elegant mathematical language, an emphasis on logical reasoning, mathematical thinking and proofing during teaching, order and serious classroom discipline, strong coherent teacher–student rapport, and a strong collaborative culture amongst mathematics teachers. The review also highlights Asian examples such as the Mathematics Teacher Exchange with Shanghai (Boylan et al., 2018) and homework practices in Singapore. In newspapers, results from ILSA often are set against those from the top-performing countries, for example, after the PISA 2018 results: “The global trend shows Asian school systems such as China and Singapore getting the best results” (Coughlan, 2019) with associated speculation about the many factors that purportedly cause this effectiveness. The overarching view seems to be that we still need further insight into the instructional practices in East and West.
The current study
The current study, then, combines several instructional elements regarding possible differences between East Asian countries and other countries. Firstly, it uses recent data from TIMSS 2019 to explore the issue. TIMSS is a dataset that is more tightly related to countries’ curriculum choices than for example PISA (Rindermann & Baumeister, 2015) and has data from secondary schools’ Grade 8. Secondly, TIMSS’ sampling of classrooms means that questionnaire results of mathematics teachers can be used to combine different instructional practices in coherent scales. As we use TIMSS 2019 data, instructional practices are those practices that either teachers or students do or are asked to do during a mathematics lesson in the classroom. Although the International Association for the Evaluation of Educational Achievement (IEA) has created a dedicated scale for “Teachers’ Emphasis on Science Investigation” in the Grade 8 TIMSS 2019 dataset (Martin et al., 2020, p. 16.320), there are no 2019 scales for instructional practices in mathematics classrooms, despite questionnaire items being available on this. Rather than base the composition of these scales on prior literature—we have already seen that there are many differing views on the essential instructional components of such scales—scales will be created by performing an EFA (RQ1). We then use the scales as predictors of mathematics achievement in multilevel models we create for each country (RQ2). Finally, we explore if there is a pattern in the predictive power of instructional practices with regard to “East” and “West” (RQ3). The questions that will be addressed are:
RQ1. What coherent scales for instructional practices can be created based on TIMSS 2019 Grade 8 data?
RQ2. To what extent do these scales for instructional practices predict mathematics achievement in the 46 jurisdictions of the TIMSS 2019 Grade 8 dataset?
RQ3. Are there consistent patterns in instructional practices in different areas of the world, with an emphasis on East Asia?
Methodology
The Trends in Mathematics and Science Study (TIMSS) in 2019 is the seventh assessment cycle of TIMSS, conducted by the IEA. 1 TIMSS 2019 was conducted in the fourth and eighth grades in 64 countries and 8 benchmarking systems. TIMSS has been conducted since 1995, with assessments conducted every four years. As part of their study, TIMSS collects mathematics achievement data, and also contextual questionnaires from students, principals of schools, and mathematics teachers. In this analysis, data from the grade eight international database of the TIMSS 2019 cycle for 46 jurisdictions are used by combining data from students and mathematics teachers (Fishbein et al., 2021). TIMSS 2019 uses a two-stage sampling approach, first by sampling schools and then within the school by selecting one (or more) intact class from the target grade of each participating school. 2
Analytical approach
To answer the first research question, an EFA of the teacher-reported data is conducted, which is reported in the section on instructional scales. To answer the second research question, multilevel models per country are constructed, because data are clustered as students nested in teachers/classrooms (Stapleton et al., 2016). The third research question is answered by observing the patterns in the descriptive statistics and results of our multilevel models. Through multilevel modeling, an adaptation of the general linear model for hierarchical datasets, we can explore the impact of student and teacher characteristics on students’ achievement (Snijders & Bosker, 2012). We use the package BIFIEsurvey (Robitzsch & Oberwimmer, 2022), within the statistical packages R and Rstudio (R Core Team, 2021; RStudio Team, 2021), which enables us to compute hierarchical two-level models with random intercepts and random slopes. Full maximum likelihood estimation is conducted by means of an EM algorithm (Raudenbush & Bryk, 2002). In our approach, the complex sampling design of TIMSS 2019 data is taken into account (Rutkowski et al., 2010). This means that three aspects are included in the analyses. To cater for different probabilities of units being selected (classrooms/teachers and students) sampling weights are used. Sampling weights ensure that the choice of sampling design does not have an undesired effect on the analyses of data. In this case, weights for mathematics teachers are used at the classroom level (level 2, MATWGT), and weights at the student level (level 1) are calculated from the total weight and level 2 weights by the BIFIEsurvey package. 3 As TIMSS 2019 uses an incomplete and rotated-booklet design for testing children on the major outcome variables, five plausible values (PVs) for achievement are used. To correctly analyze, the BIFIEsurvey package combines the five plausible values into a single set of point estimates and standard errors using Rubin's rules (Rubin, 1987). A final aspect concerns the variance estimation. As standard variance estimation formulas are not appropriate for data obtained with a complex sample design (Rutkowski et al., 2010), a Jack-knife procedure is used. In this study, it is relevant to note that mathematics teachers were not randomly sampled; they are the mathematics teachers of randomly sampled classrooms. An R script was created that generates descriptive statistics and the model results.
Variables
The following variables are included in the analyses.
As dependent variable(s), the five plausible values are used for mathematics achievement, BSMMAT01 to BSMMAT05. These are imputed scores averaging 500 and a standard deviation of 100 (Martin et al., 2020).
Instructional scales (teacher level)
As independent variables, scales are created from variables included in the teacher questionnaire. In operationalizing the pertinent activities in the classroom, contrary to, for example, similar types of scales in PISA 2015, self-reported behaviors from mathematics teachers are deemed more trustworthy than that of students. A few questions in the mathematics teacher questionnaire are particularly relevant for instructional approaches. 4
Firstly, Question 12 in the teacher questionnaire asked “how often do you do the following in teaching this class” with teachers asked to answer on a four-point scale (1 = every or almost every lesson, 2 = about half the lessons, 3 = some lessons, 4 = none) for seven activities, as mentioned in Table 1 (BTBG12A-G). A second question (Question 15, BTBM15A-F) asked teachers “In teaching mathematics to this class, how often do you ask students to do the following” with the same answer options. Two items in Question 15, pertaining to mixed or same-ability groups, were not used in this analysis, as they pertained to the way students were organized within the classroom, not specific instructional approaches.
Operationalization of instructional scales GEN, TA, and PO.
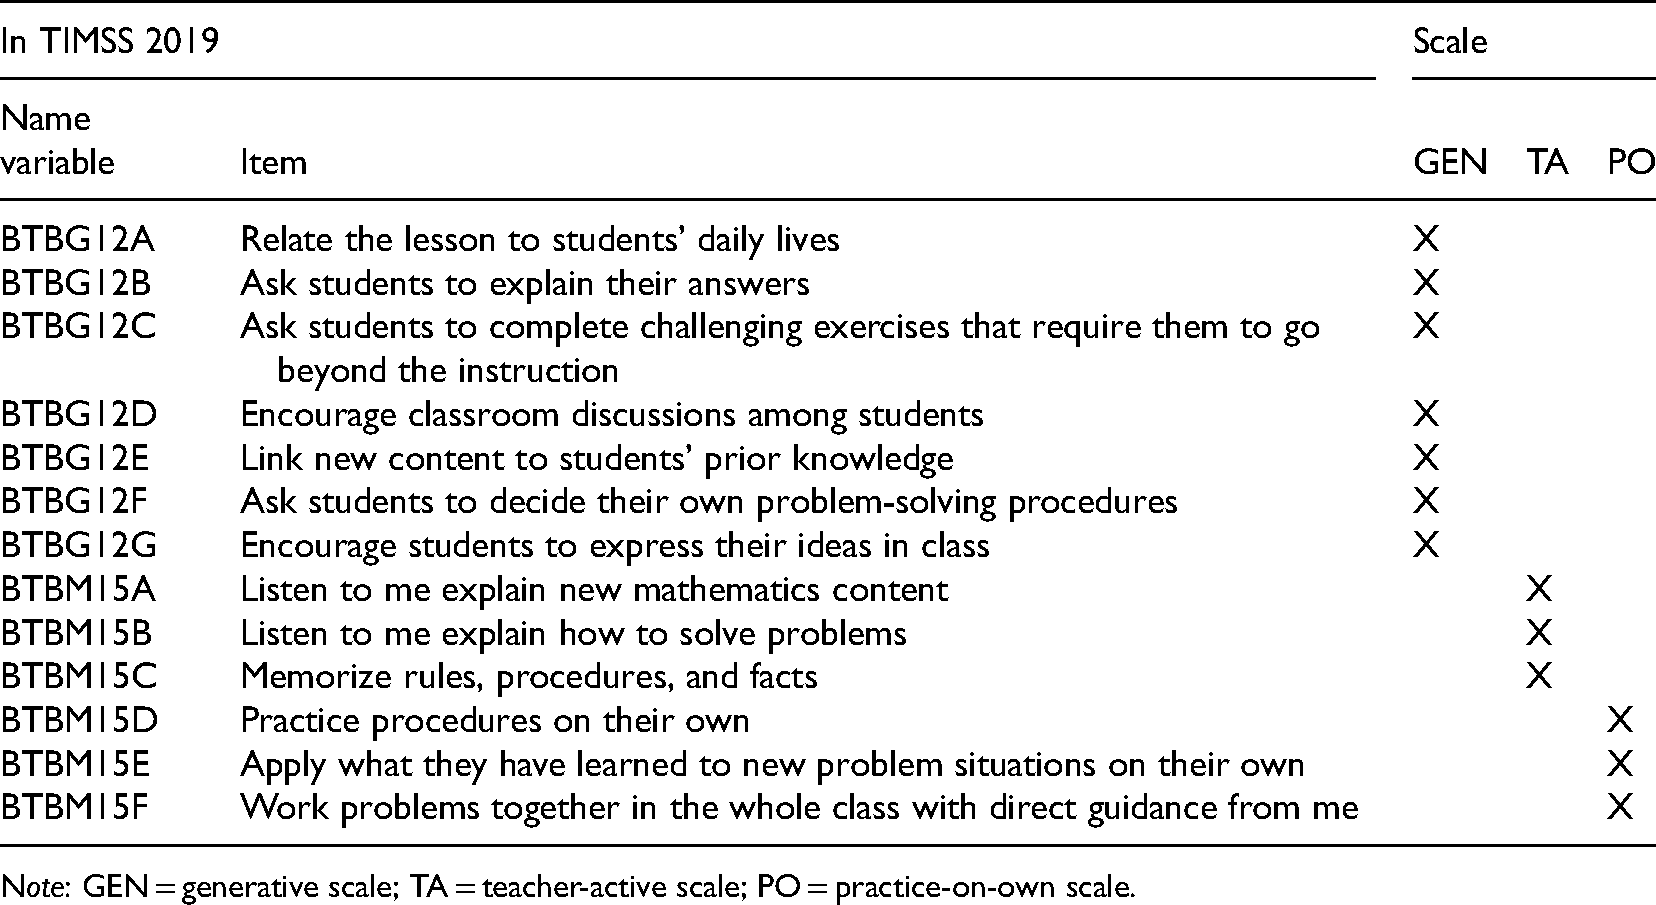
Operationalization of instructional scales GEN, TA, and PO.
Note: GEN = generative scale; TA = teacher-active scale; PO = practice-on-own scale.
All items were first reverse coded (4 became 1, 3 became 2, 2 became 3, and 1 became 4) so that “higher” denoted “more.” Then an EFA with varimax rotation was conducted with the 13 questionnaire items, using the psych package in R (Revelle, 2022). A scree plot indicated that a three- or four-factor solution would fit best, but upon trying a four-factor solution, one questionnaire item (BTNM15F) was not loaded on a factor. Furthermore, three questionnaire items loaded on two factors. Regarding model fit for the three-factor solution, the RMSEA index was 0.051; according to Hu and Bentler (1999), this indicates a close fit. The Tucker–Lewis Index was 0.936—an acceptable value considering it is over 0.9. Finally, the RMSR was 0.05, with values up to 0.08 being acceptable (Hu & Bentler, 1999). Using a threshold for loadings over 0.3, Table 1 indicates the three factors we translated in scales. BTBG12A-G averaged together to make a scale we called “Generative” (GEN) as we felt the items asked students actively generate knowledge (alpha = 0.779). BTBM15A-C averaged together to make a scale that refers to more teacher activity, so we called it “Teacher-Active” (TA, alpha = 0.725). Finally, we averaged BTBM15D-F to make a scale that referred to as “Practice-on-Own” (PO, alpha = 0.609). 5 Note that although the EFA resulted in disjunct scales, this study does not see the scales as mutually exclusive, as it is perfectly possible to employ generative instructional practices, teacher direction, and space for independent practice in the same lesson, something the TIMSS 1999 video study has also shown (Hiebert et al., 2005). Another question asked teachers “In a typical week, how much time do you spend teaching mathematics to the students in this class? (minutes)” (BTBM14), which is included as instructional time. As the study focuses on instruction, homework was not included. In line with the literature on “Opportunity to Learn,” one expectation was that instructional time might mediate both achievement and instructional practices (e.g., Bokhove et al., 2019; Carroll, 1963). The IEA created the “Classroom Teaching Limited by Students Not Ready for Instruction” (BTBGLSN) scale based on teachers’ responses to questions about barriers to teaching their class, including those on lacking prerequisite knowledge or skills, a lack of basic nutrition, a lack of sleep, absence from class, disruption by students, uninterested students, mental, emotional or psychological impairment; and students having difficulties understanding the language of instruction. The scale was standardized to a mean of 10 and a standard deviation of 2. With this scale, higher scores mean “better,” so, in this case, fewer barriers and limitations to teaching. 6 This variable is included in the analyses because it is expected that all instructional practices can potentially be influenced negatively because of such barriers.
The Home Educational Resources (BSBGHER) scale was created based on students’ reports regarding the availability of three home resources which are included as a proxy for socioeconomic status (SES). SES is a longstanding predictor of academic achievement (e.g., for a review, see Sirin, 2005). The scale contains items on the number of books at home, the highest level of education of either parent, and the number of home study supports. The scale was standardized to a mean of 10 and a standard deviation of 2. With this scale, higher scores mean “better”: more resources and thus higher SES. Finally, gender is included as a control variable (ITSEX, 1 = female, 2 = male).
Model building
Several models per country are created with the five PVs for mathematics achievement as dependent variables: a null model, Model 1 which adds two student control level variables BSBGHER and ITSEX, Model 2 which adds the three newly created instructional scales GEN, TA, and PO, and a Model 3 which further adds the limitations to teaching scale and instructional time. Although our analysis script contains code for all interim models, this paper only reports on the final model. We do not treat missing data, but use listwise deletion. No centering was used. As two countries’ models did not converge, the final sample included 44 countries with 260,111 students for the descriptive statistics.
Results
Table 2 presents descriptive statistics for all included variables. Firstly, we can confirm that mathematics achievement in five of the six East Asian jurisdictions, namely Chinese Taipei, Hong Kong SAR, Japan, Korea, and Singapore are among the highest. Only Malaysia scores much lower, but this is in line with Malaysia not typically being included (yet) as an example of East Asian higher mathematics achievement. We can see substantial differences in instructional time between countries as well with Japan and Korea at the low end of total instructional time per week This might give the impression that East Asian countries have less instructional time across the board, but that is not the case with the other jurisdictions more in the middle of the pack. Nevertheless, it is notable that more instructional time is often associated with higher achievement, but just like Japan in Bokhove et al. (2019), this is not necessarily the case. All values for the three instructional practices scales GEN, TA, and PO, are over the midpoint of 2.5 for all jurisdictions, suggesting that these practices occur frequently and are not mutually exclusive (i.e., when one score is high, the other can also be high). However, it also is clear that practices vary considerably across countries. For example, Dubai and Bahrain score highest for generative practices (GEN) with little spread, with Chinese Taipei and Hong Kong SAR scoring lowest. In fact, it is notable that East Asian countries all score well below average, with five out of six jurisdictions, under 3. In contrast, Middle Eastern countries, except Georgia, have higher than average GEN scores. For the TA scale, Bahrain, Kazakhstan, and Oman score highest, while Norway and Hong Kong SAR score lowest for the measure. Finally, the PO scale shows Chinese Taipei and Hong Kong SAR as the lowest; and Bahrain and Qatar as the highest. These findings show that relatively high or low scores for the scales can coexist; in other words, the teaching practices are not mutually exclusive. They further show that although there are substantial differences between countries, clusters of countries seem to be apparent. However, a lower or higher level of practice does not say much about the predictive value of these practices with regard to mathematics achievement. We therefore now turn to the multilevel models. Table 3 shows the results for the final model for all countries. 7 Although it is not the main focus of this paper, it firstly can be noted that in many jurisdictions there are significant differences between males and females, within most countries males outperforming females, but many Middle-Eastern countries showing the opposite result. SES is a positive predictor of Grade 8 mathematics achievement, in line with prior literature. GEN practices are only a significant predictor in 12 countries, with four negative and eight positive. In East Asian countries, only in Singapore generative practices are a significant negative predictor of mathematics achievement. Even fewer of the betas for TA and PO are significant, with most being negative. For our East Asian focus, only in Hong Kong SAR, the “Teacher-Active” scale is a significant negative predictor of mathematics achievement, while in Singapore the “Practice-on-Own” scale is a significant positive predictor of mathematics achievement. In almost all countries, the absence of limitations for teaching (BTBGLSN) is a positive predictor of mathematics achievement. Notably, though, this is not the case in Korea. Finally, instructional time (BTBM14) is a significant predictor of mathematics achievement in 19 out of 43 countries, six negatively and 13 positively. 8 Looking at East Asian jurisdictions, we see instructional time being a positive predictor of mathematics achievement in Chinese Taipei and Japan, a negative predictor of mathematics achievement in Singapore, and no significant predictor in Hong Kong SAR and Korea. These results do not show a consistent pattern of country clusters.
Descriptive statistics for key variables.
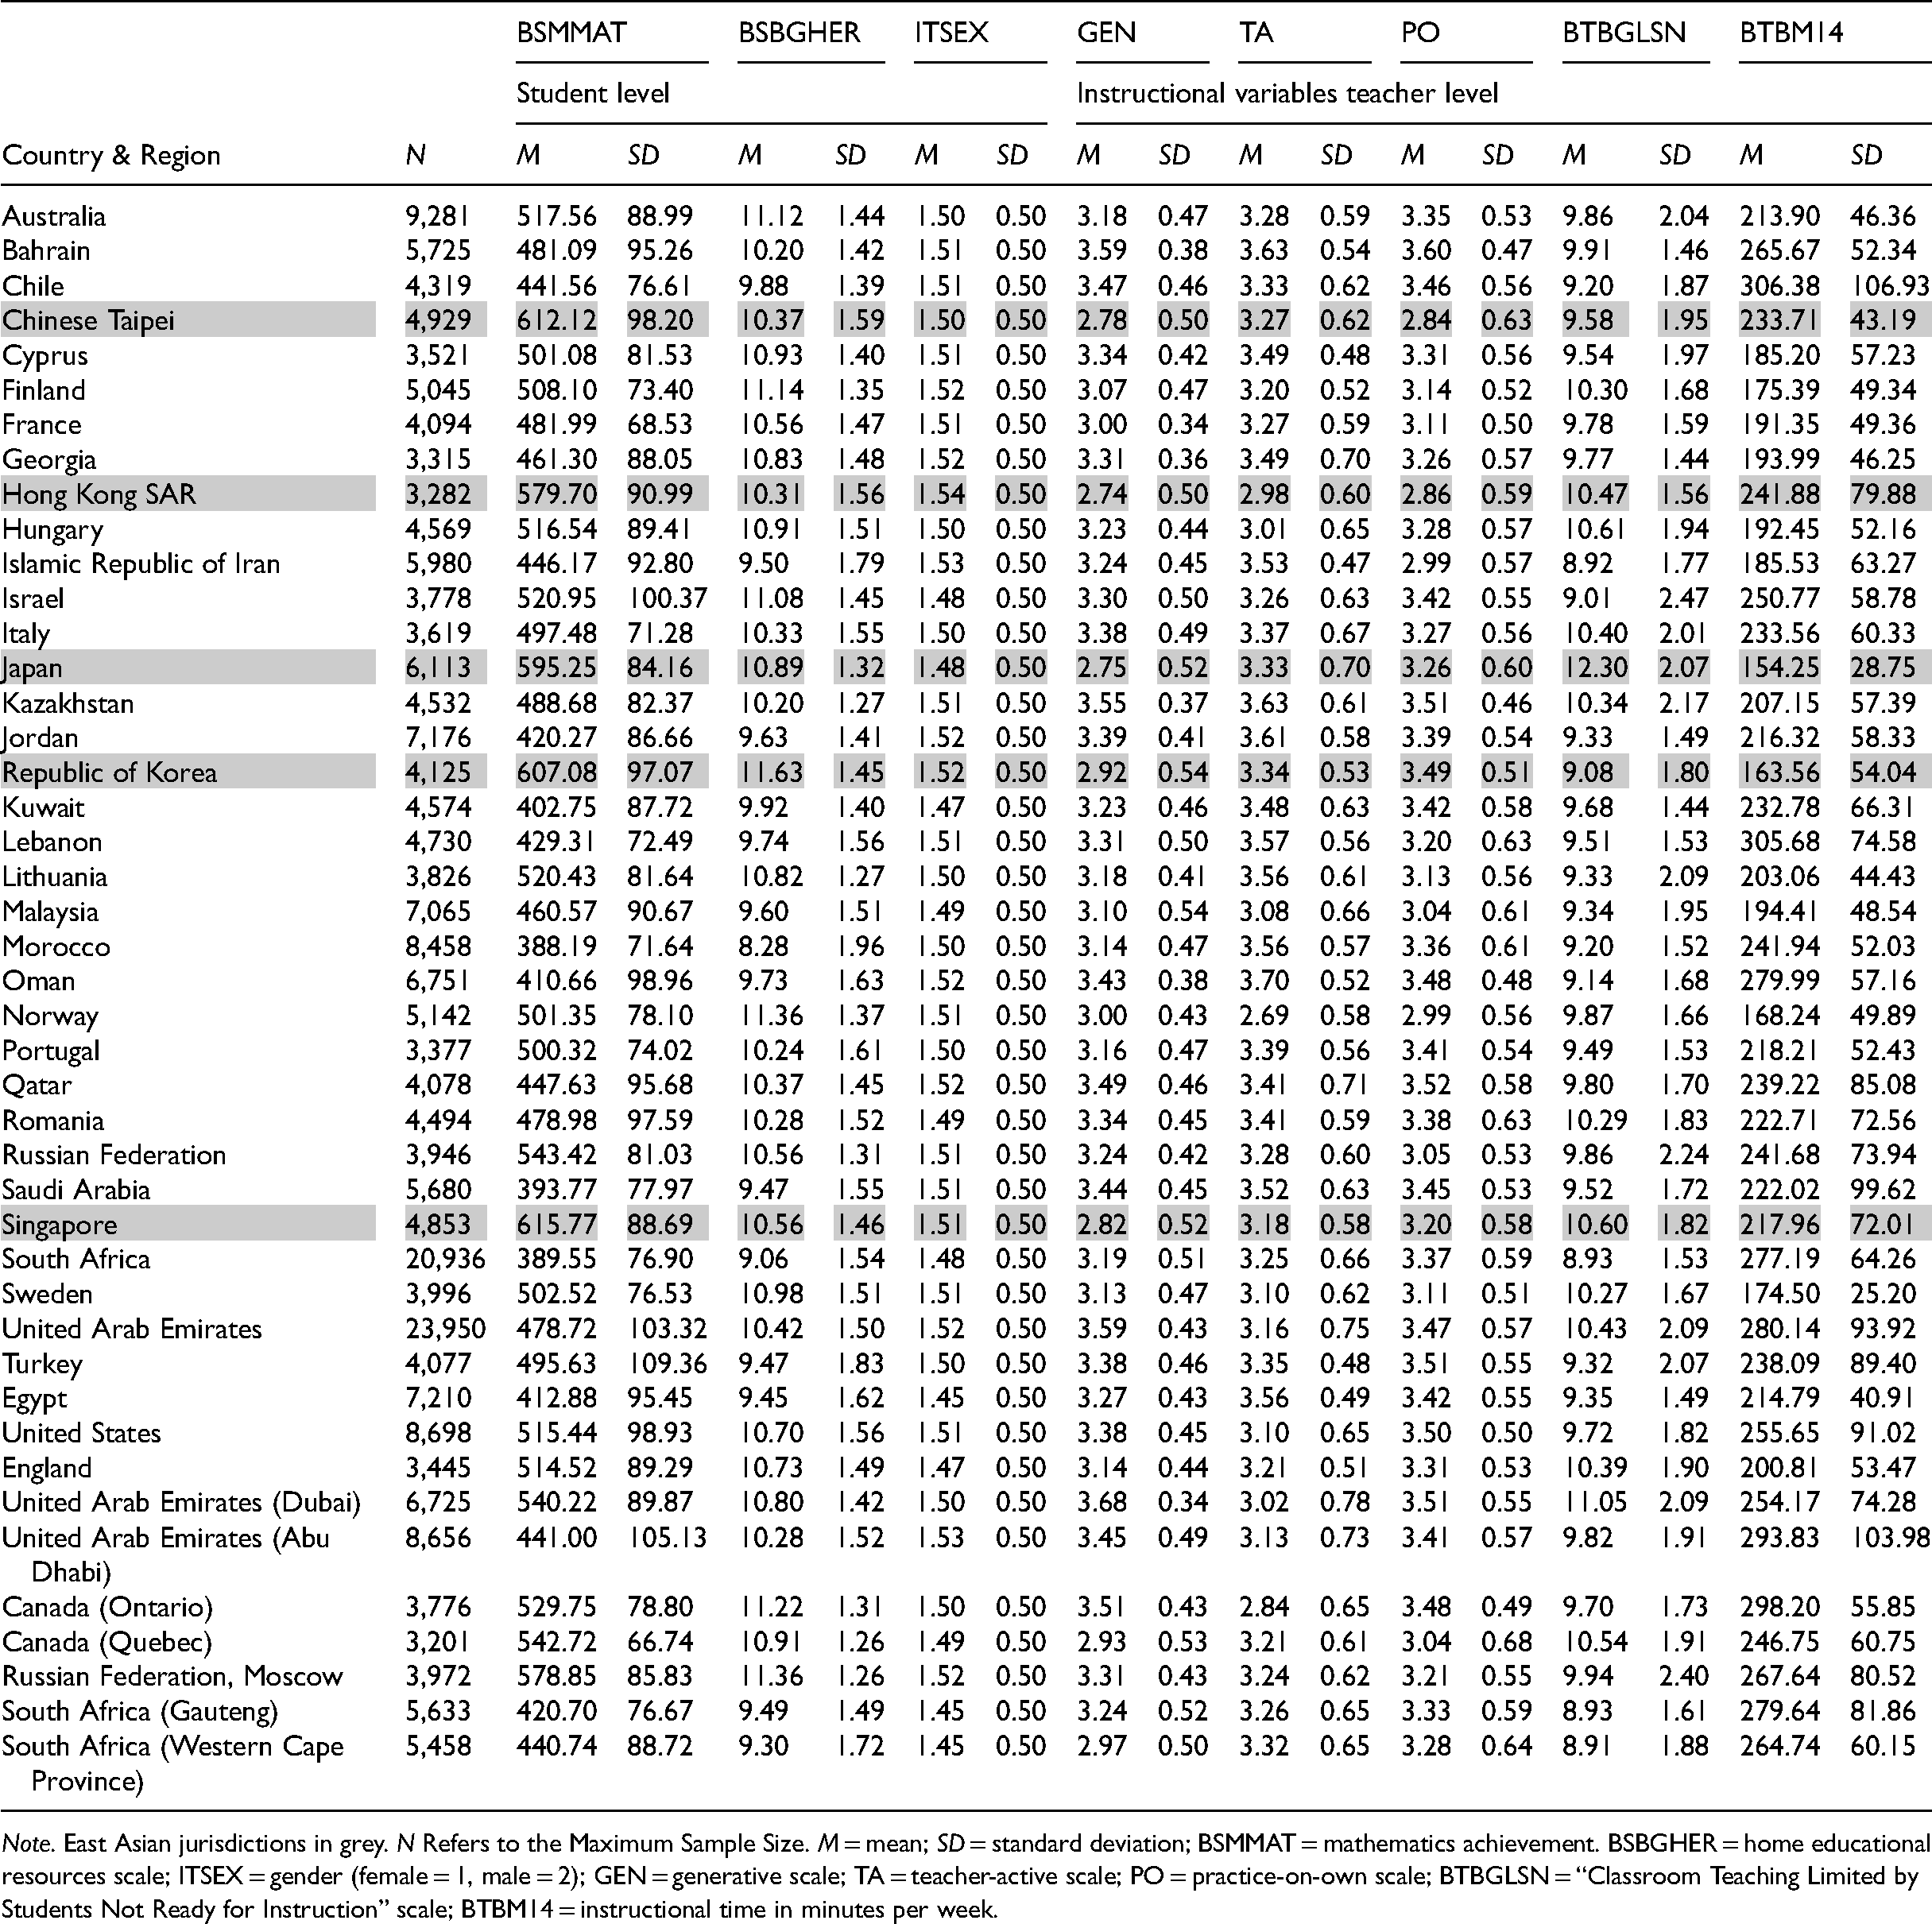
Descriptive statistics for key variables.
Note. East Asian jurisdictions in grey. N Refers to the Maximum Sample Size. M = mean; SD = standard deviation; BSMMAT = mathematics achievement. BSBGHER = home educational resources scale; ITSEX = gender (female = 1, male = 2); GEN = generative scale; TA = teacher-active scale; PO = practice-on-own scale; BTBGLSN = “Classroom Teaching Limited by Students Not Ready for Instruction” scale; BTBM14 = instructional time in minutes per week.
Model results.
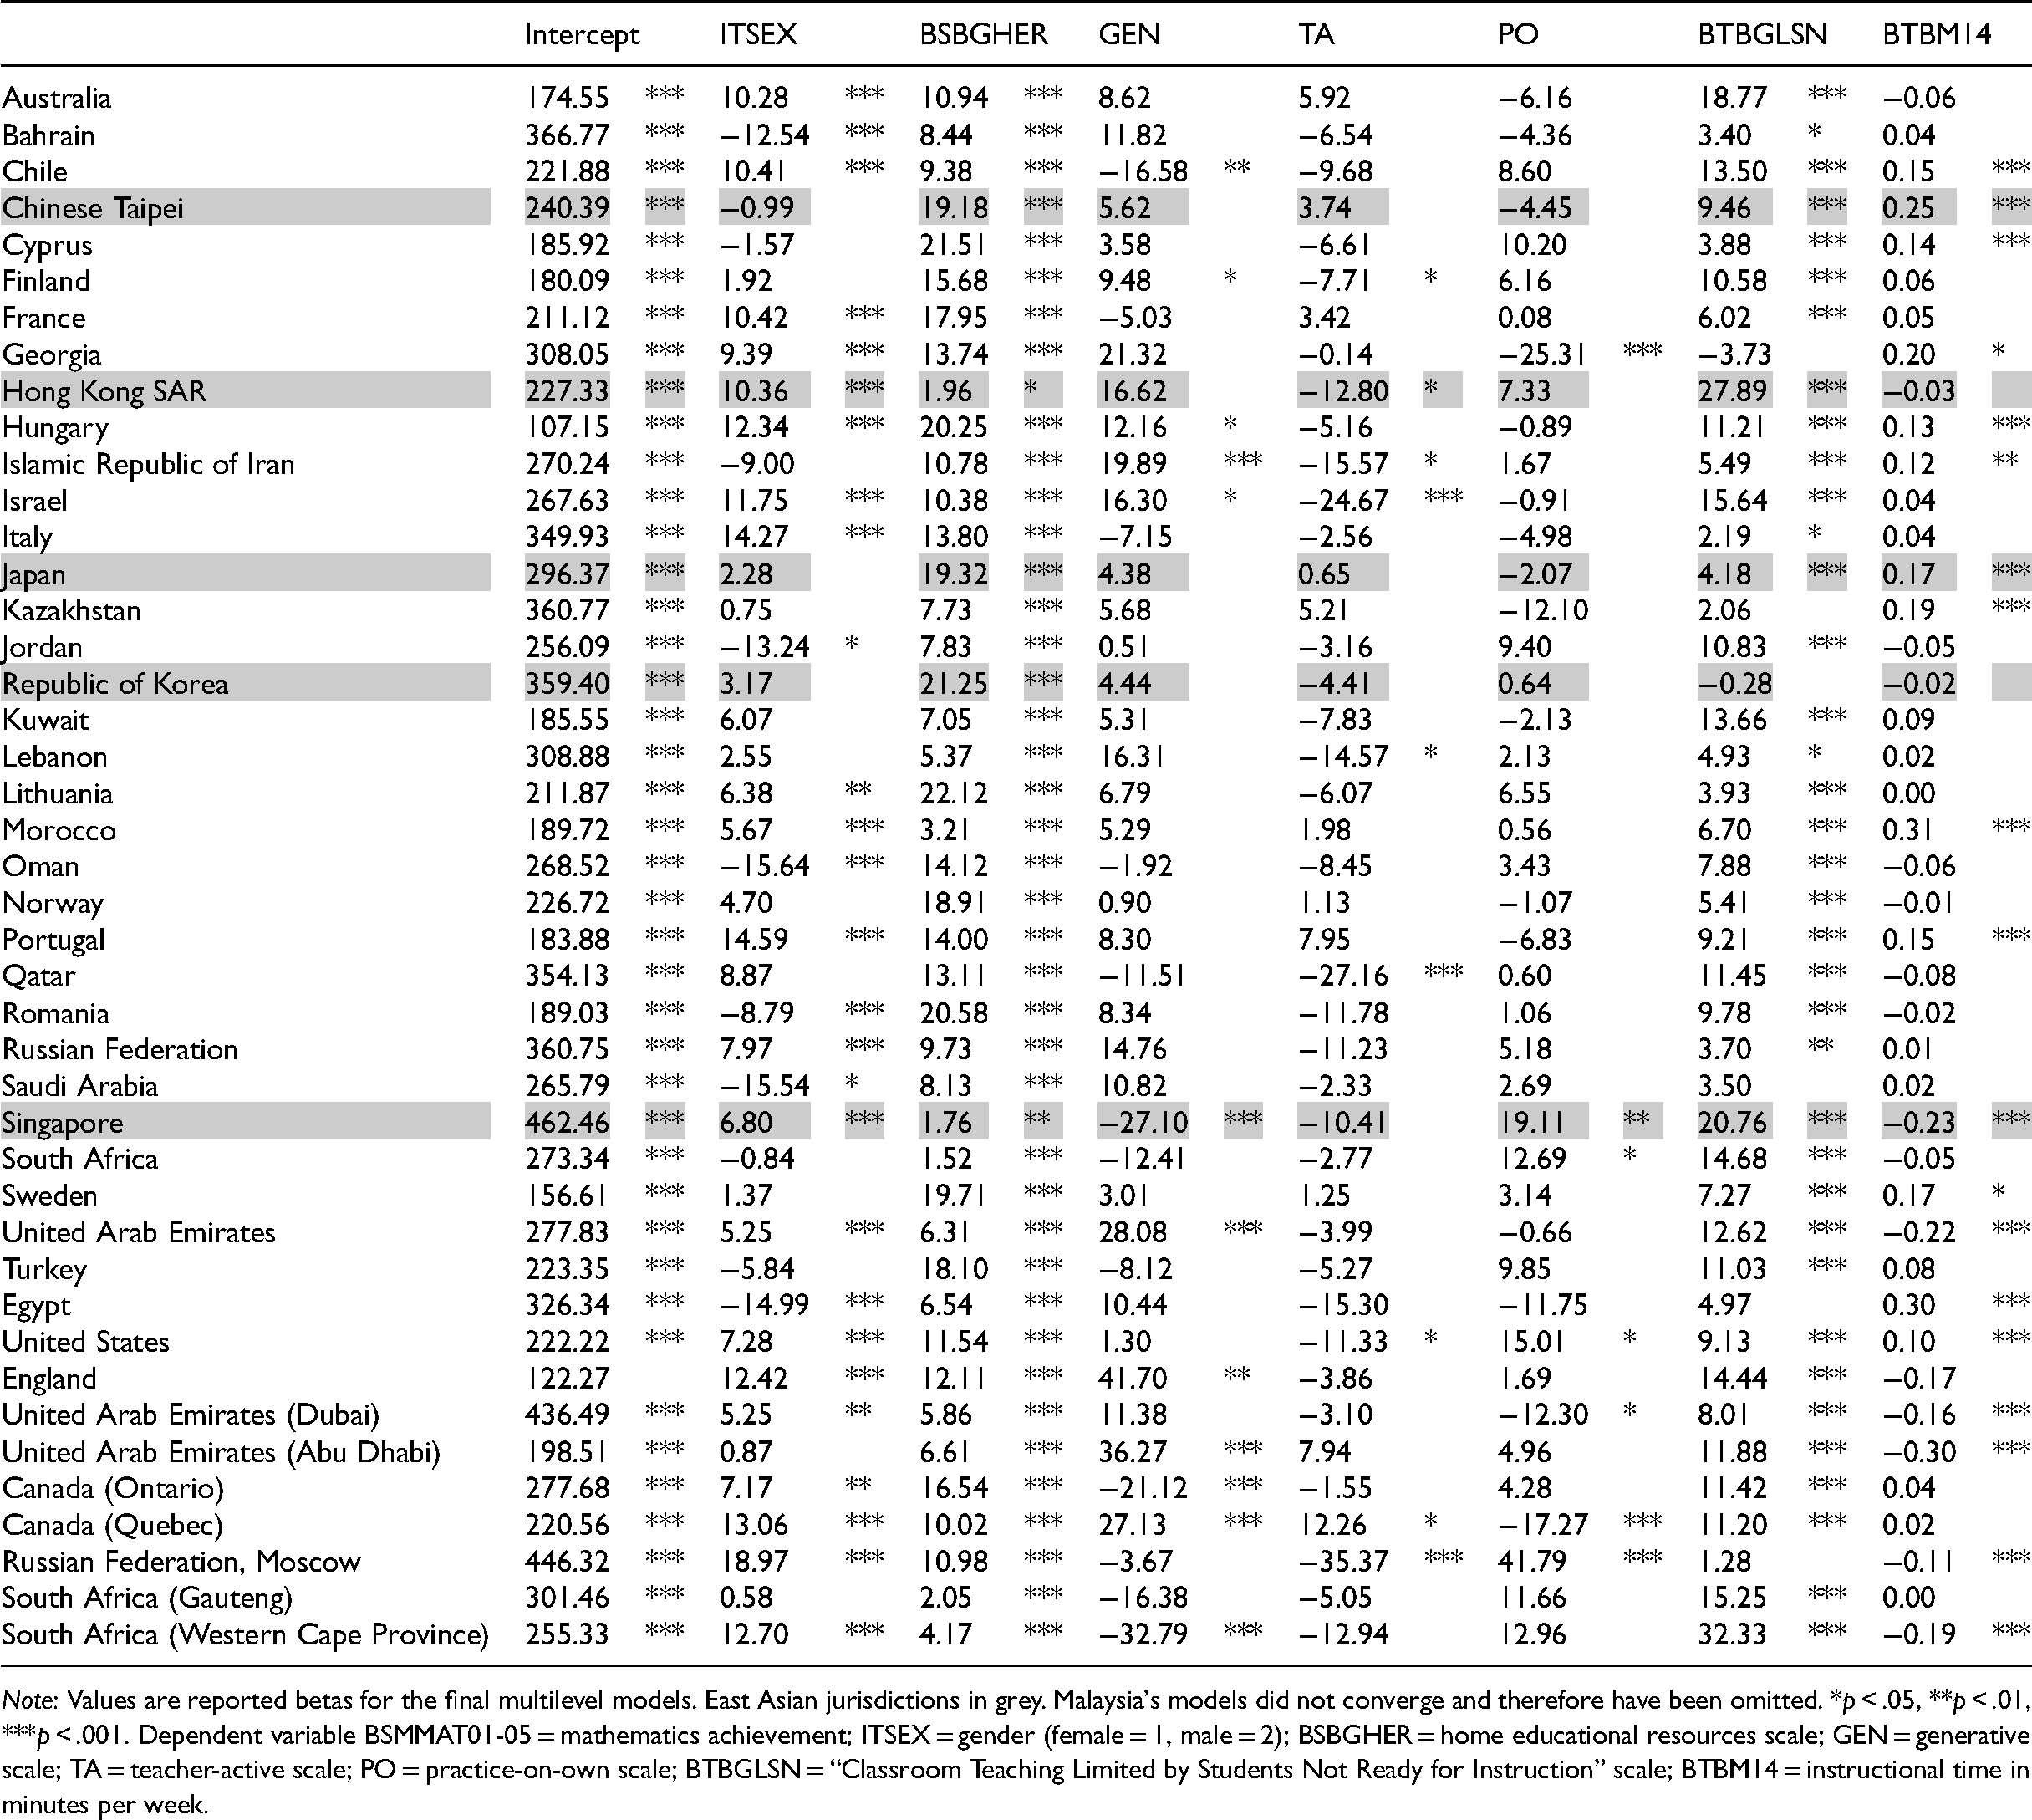
Note: Values are reported betas for the final multilevel models. East Asian jurisdictions in grey. Malaysia's models did not converge and therefore have been omitted. *p < .05, **p < .01, ***p < .001. Dependent variable BSMMAT01-05 = mathematics achievement; ITSEX = gender (female = 1, male = 2); BSBGHER = home educational resources scale; GEN = generative scale; TA = teacher-active scale; PO = practice-on-own scale; BTBGLSN = “Classroom Teaching Limited by Students Not Ready for Instruction” scale; BTBM14 = instructional time in minutes per week.
Across all countries, the results show that the extent to which instructional variables are predictive of Grade 8 mathematics achievement, differs considerably, even within clusters of countries that typically are seen as “related.” Between East-Asian countries, there is quite some variance, with for example Singapore showing generative practices (GEN) as a significant negative predictor, and PO as a significant positive predictor. However, other jurisdictions such as Chinese Taipei, Japan, and Korea show no significant predictors (Table 3). East Asian jurisdictions do report relatively fewer GEN practices, than most other countries (Table 2). Two other instructional predictors, limitations for teaching and instructional time, also show no consistent pattern, both across all countries as East Asian countries in particular. For example, although in Chinese Taipei, Japan, and Singapore limitations for teaching and instructional time both are significant predictors, the latter is negative in Singapore and positive in the other two. In Hong Kong SAR, only the limitations for teaching are a significant positive predictor. In Korea, neither variables are predictive of Grade 8 mathematics achievement. So, although we posited two current views on “clusters of countries,” one view that says that there is some coherence and another view that within East Asia there are many differences, our results are more in line with the latter. To echo previous results by Cheng (2014), one approach cannot be said to be uniformly more predictive of positive outcomes than the other. Our findings contradict suggestions by Leung (2017) that East Asian countries form a cultural cluster. If the question is, as posited in Leung’s (2017) title “Does culture really matter?”, then we agree that the answer still is “probably,” with this study providing some further evidence toward this. However, although there might be common elements between certain cultures, they also are inherently unique. In addition, cultural influences are hard to determine in even just one country, let alone numerous cultures across the world. We therefore need to continue our research in effective mathematics education practices, but realize that there is not one “silver bullet” that works across all available contexts. Having said that, this also does not mean we cannot learn from other countries’ prevalent instructional practices, with some practices supported by sociological, pedagogical, and psychological research.
Regarding our analytical approach, we acknowledge that our findings will be influenced by the choice of variables. In this case, we used instructional variables available in the Grade 8 TIMSS 2019 dataset, but the way we combine them in scales is subject to analytical choices, which can have consequences on our conclusions. For example, many analysts have looked at inquiry-based learning in science based on PISA 2015 data. Two separate analyses of the data, using different compositions of the inquiry scales, yielded different results (Jerrim et al., 2020; Oliver et al., 2021). This article presents data-driven choices, based on factor analysis, with regard to scales we dubbed “generative,” “teacher-active,” and “practice-on-own.” Although we describe our analytical choices as transparently as possible, they still are subject to some arbitrariness. In fact, analyses of secondary data like these, inherently include many analytical choices, which in term lead to analytical variability (Bokhove, 2022). In other words, different variable choices might yield different results. To mitigate issues with analytical variability, in future research secondary data analyses could be preregistered, with analysis scripts deposited in, for example, the Open Science Framework, 9 or even a registered report.
A further limitation of our analysis is that secondary data analyses with TIMSS data cannot determine causality. For this, we would need longitudinal data, and as TIMSS only provides cross-sectional data, this prevents strong causal assertions, unless we try to cater for this in our analyses. Using older TIMSS data, Gustafsson (2013) asserted that causal relations can be explored if threats to valid causal inference from observational data are addressed. In relation to the focus of teaching practices, it could be the case that teachers simply adopt different practices for students with different prior proficiency. For example, in PISA 2015 data, a negative association between inquiry-based instruction and science achievement was found (OECD, 2016) which led to a conclusion that some of the arguments against hands-on activities should not be disregarded. However, the findings also noted that teachers may be using hands-on activities to make science more attractive to disengaged students. This point regarding causality is part of wider criticisms some scholars have addressed at ILSA providers (e.g., Zhao, 2017, 2020) and the challenges to disentangle all the country, school, and other contextual variables that make up an education system.
Although this study's use of teacher data was partly predicated on students not always knowing best with regard to their learning (e.g., see Kirschner & van Merriënboer, 2013), it also isn’t necessarily the case that teacher's perceptions of their teaching approaches will match students’ experiences (Beausaert et al., 2013). Referring to other studies (e.g., Nijhuis et al., 2005), they conclude that it is important and relevant to measure students’ perceptions of the teachers’ approaches to teaching instead of using teachers’ self-reports and call for more research on students’ perceptions. This would present ILSA analysts of secondary education mathematics with a quandary as the two main studies TIMSS and PISA, each have their own emphases. That challenge extends to other contextual variables as well. For example, this analysis did not include all possible confounding variables. Although we, for example, included a proxy for SES and instructional time, there are numerous other relevant variables, including demographic factors, characteristics of school systems, time in school, time spent teaching particular topics, emphasis on testing, societal and family cultures, level of education for teachers, teacher professional development, inequities within a country, variation of funding/access to schooling within a country, affective measures such as confidence and many more. Furthermore, this study focused on mathematics achievement as an outcome, but there are many more noncognitive outcomes of mathematics education as well.
Notwithstanding this, using current data from TIMSS 2019 does provide some more insight into the association between instructional practices and mathematics achievement across multiple countries. Such large-scale international comparisons would be hard to conduct in any other way. Although we capture between-teacher variance in our models, we do not account for school-level variables, as the TIMSS dataset samples one or two classrooms per school, and hence might not be representative of instructional practices of the whole school. One challenge in comparing results from different countries lies in the extent different curricula more or less incentivize particular practices. Of course, individual teachers play an important role in this, but it could be argued that some curricula perhaps enable more opportunities for learning and teaching “the right content” for TIMSS outcomes. In that sense, TIMSS’ curriculum focus could obscure certain effects. To check such a suspicion, we turned to the TIMSS 2019 Test-Curriculum Matching Analysis (TCMA; Mullis et al., 2020). The TCMA analyses the extent to which the TIMSS 2019 mathematics assessment items are relevant for each country's curriculum, calculating comparative outcome scores when only achievement items that are judged to be relevant to its own curriculum, are included. Although these analyses show some more differences between countries, none of them are notable with regard to this study's findings, hinting like Jerrim (2015) that East Asia's high levels of achievement also arise because of culture, not just curriculum. One such cultural aspect might be the use of out-of-school tutoring. This paper focuses on instructional practices in the classroom, but one aspect that Leung et al. (2015) and others have pointed out is the role of tutoring, for example, in Juku schools in Japan, and Hagwons in Korea.
Finally, although this study focused on the overall Grade 8 TIMSS 2019 mathematics achievement, it could be argued that traditional ILSA assessment items are less suitable for evaluating conceptual knowledge. It therefore was interesting that in the TIMSS 2019 cycle, a pilot study with problem-solving and inquiry tasks was conducted (Mullis et al., 2021). Although limited in scope, some countries’ achievement scores differed slightly upon including the items in the overall score (Mullis et al., 2021). The patterns of differences, however, again were not consistent, with for example Chinese Taipei and Korea scoring lower, but Singapore and Hong Kong SAR at a similar level as the general achievement score. The limited scope of the pilot study does not allow for firm conclusions on this, but could indicate that the way we assess mathematics in ILSA influences outcomes as well. Further research could look into the potential of further diversifying assessment items in large-scale studies, with an eye for implementation and feasibility. For example, recent results with randomized controlled trials have shown that “comparative judgement” could be a valid, reliable, and practical tool to measure conceptual understanding (Jones et al., 2019).
In conclusion, this article again confirms that diversity in instructional practices in international mathematics classrooms is not easy to capture with teacher-reported questionnaire data, but that if we would conclude one thing, it is that instructional practices differ considerably, across the world, and even within regions such as East Asia. In reporting on country differences, we need to be aware of this diversity.
Footnotes
Acknowledgments
The author thanks the reviewers for their constructive comments.
Declaration of Conflicting Interests
The author(s) declared no potential conflicts of interest with respect to the research, authorship, and/or publication of this article.
Funding
The author(s) received no financial support for the research, authorship, and/or publication of this article.