
Abstract
A notably high percentage (33%) of students with mathematics learning difficulties (MLD) has been reported in Tibet, which can partly be explained by the current state of mathematics teaching. Less known is what kind of errors these students are making in different types of mathematical tasks. This study investigated the types and frequency of errors made in mathematics tasks by Tibetan seventh-grade students (n = 30) with MLD, as well as whether gender and school type had any effects on these errors. The novel Mathematics Error Pattern Identification Test (MEPIT) was used to identify the following eight different error types: visual-spatial, comprehension, transformation, relevance, fact, procedural, measurement, and presentation. Students identified as having MLD completed the MEPIT in two sessions due to its length (64 items). Regression analysis and t-tests were used. The most frequent error types were fact and comprehension errors. Compared to the boys in the study, the girls seemed to be more vulnerable to fact and relevance errors. The students in the rural school made more comprehension errors compared to the students in the urban school. Our exploratory study calls for further research on assessing errors that students with MLD make in mathematical tasks. MEPIT was shown to be a promising assessment tool for Tibetan teachers to identify errors that students with MLD may make in mathematics tasks.
Keywords
Introduction
China seems to have a very good reputation for its mathematics education (OECD, 2012, 2015); however, there is a considerable achievement gap between Tibetan students and other Chinese students in learning mathematics (e.g., Basang & Shi, 2006; Fang et al., 2008; Tibetan Examination Yuan, 2015). This is also manifested in a notably high percentage (33%) of students with mathematics learning difficulties (MLD) in Tibet (Wang, 2008) compared to the prevalence of MLD indicated in the research literature in general, ranging from 5% to 7% when defined as severe mathematical learning disability to 20% to 25% when including those with persistent low achievement in mathematics (Geary, 2011; Karagiannakis et al., 2014).
Reasons for the high prevalence rate of MLD in Tibet may be different factors linked to MLD (e.g., deficits in neurocognitive number processing, poor working memory, or low motivation; Geary, 2011) but also stemming relatively strongly from the previous and current state of mathematics education. There was no modern mathematics education in Tibet until 1951, the enrolment rate of preschool education in Tibet is lower than the average in China, and the majority of Tibetan children lack academic support from their parents (Basang & Shi, 2006; Fang et al., 2008; Wang, 2008; Wang & Zhao, 2012). Furthermore, there has been a lack of qualified Tibetan mathematics teachers, as students in Tibet have been unwilling to choose to study mathematics in higher education, let alone becoming mathematics teachers. Trying to address the problem, the Ministry of Education of China has encouraged mathematics teachers all over the country to support Tibet by working there. There are thus an increasing number of Han Chinese mathematics teachers in Tibet, currently more than Tibetan mathematics teachers (MoE, P.R.C., 2015). This movement, often called “YuánZàng” (Supporting Tibet), has already improved the quality of mathematics education in Tibet. However, it has also faced many barriers to implementation (MoE, P.R.C., 2015; Wang & Zhao, 2012). The major issue is that Han Chinese teachers often do not have direct learning experiences in Tibet. Differences in language and culture may affect teaching and learning processes, and thus the instruction given does not necessarily meet the needs of Tibetan students in the most effective way—for example, providing adequate educational support for the students struggling with mathematics.
Although China has made educational equity a priority, the rural–urban gap in education quality remains a serious issue (OECD, 2016). Problems such as poor infrastructure, although improved in recent years, shortages of qualified teachers, and economic disadvantage in rural areas continue to cause rural education to lag behind urban education. This is also the present reality in Tibet (MoE, P.R.C., 2015; Wang & Zhao, 2012).
In this study, our approach to the dilemma of mathematics difficulties faced in Tibet involved reviewing the errors that Tibetan students with MLD make in mathematics. To the best of our knowledge, this study is one of the first conducted in Tibet that investigates the error types and frequencies that students with MLD make in mathematics tasks. The novelty of this study also lies in using a measure developed for this purpose—the Mathematics Error Pattern Identification Test (MEPIT) (Rong, 2016). Furthermore, we were interested to discover if there were any differences between the urban and rural schools and among genders in terms of error types. If mathematics teachers in Tibet had an appropriate tool for analyzing the errors their students make, they would be able to use this knowledge to address students’ learning needs more efficiently (Hansen, 2005; McGuire, 2013).
Types of mathematical errors
Mathematical errors refer to those pervasive errors that students make based on the difficulties they have experienced when dealing with mathematical problems (Herholdt & Sapire, 2014; Ketterlin-Geller & Yovanoff, 2009). Various types of mathematical errors have been described in the research literature depending on the research purposes and theoretical approaches. Based on the reviewed literature, the following eight error types were identified and used in this study.
Visual-spatial errors refer to the errors made because of poor visual-spatial skills. These errors occur as difficulties in recognizing numbers, mathematical expressions, quantities, or shapes (e.g., Desoete et al., 2004; Hansen, 2005; Kuo et al., 2001; Raghubar et al., 2009). For example, some students may mistake + as ×, 3 as 8, 6 as 9, and may use the same number twice in multi-digit computation tasks; as well, some students cannot correctly read time on a clock.
Comprehension errors often happen in mathematical word problems. Such an error is seen when a student understands the words but does not understand the overall problem or specific terms within the problem, when a student has difficulties in grasping the mathematical meaning of a problem, or when a student is seeking to retrieve mathematical information from graphs, tables, texts, or other sources (e.g., BOSTES, 2016; Desoete et al., 2004; Hansen, 2005). The following is an example of such a problem: In the classroom, there are 5 tables with 6 children at each table. How many children are there in the classroom? The student is expected to respond that 5 groups of 6 equal 30. However, if making a comprehension error, the student may draw a picture showing two tables, with 5 children at one table and 6 children at the other, thus obtaining an answer of 11 (adapted from BOSTES, 2016).
Transformation errors occur when students understand the meaning of problems but cannot implement strategies or operations to deal with the problems that could be solved by commonly used mathematical methods and simple mathematical concepts and procedures (e.g., BOSTES, 2016; Kuo et al., 2001; Wijaya et al., 2014). For example, Tony is thinking of a number. If he doubles the number and adds 4, he gets 18. What is the number? The student is expected to answer the number is 7. Making a transformation error, the student nevertheless may calculate and provide 5 as an answer, for example, indicating that the student has failed to transform mathematical information into the proper calculation process.
Relevance errors take place when students cannot exclude irrelevant information in a task (e.g., Desoete et al., 2004; Hansen, 2005). For example, Jack has 1 brother and 3 sisters. Bill has 2 more brothers than Jack. How many brothers does Bill have? Here, “3 sisters” is irrelevant information. For many students with MLD, it is often difficult to exclude irrelevant information (Desoete et al., 2004). Often, such students will simply add all or some of the numbers in the task together and thus end up with an incorrect answer.
Fact errors concern retrieving mathematics facts (Mazzocco et al., 2008). Many researchers strictly define fact errors as computational errors, in which students use the proper operation but make a mistake in retrieving the correct answer for a simple arithmetic fact from long-term memory (e.g., Ketterlin-Geller & Yovanoff, 2009; Raghubar et al., 2009). Other studies, especially those conducted in Asia, suggest a broader spectrum of mathematics facts, which cover not only number facts but also facts concerning other basic mathematical definitions and concepts, including the properties of numbers, magnitude of numbers, geometric properties, and notations (e.g., Kuo et al., 2001; Wang, 2006). In this study, fact errors refer to this broader definition.
Procedural errors refer to mistakes in the process of carrying out algorithmic procedures, which include incorrect operations, incorrect algorithms, placement errors, incorrect steps, and missing steps (e.g., Hansen, 2005; Kuo et al., 2001; MoE, Singapore, 2013; Raghubar et al., 2009). Errors concerning the misuse of arithmetic procedures or a deficit in understanding procedures, such as problems borrowing from zero or subtracting the smaller number from the larger number instead of borrowing (Raghubar et al., 2009), sequencing digits incorrectly, aligning parts of an algorithm incorrectly, using steps that are not associated with any operation, and skipping steps that are needed to complete a procedure (BOSTES, 2016) are considered to be procedural errors.
Measurement errors refer to errors in measurement; the errors occur when students have difficulties in remembering relationships between measurement units (e.g., 1 km = 1,000 m), choosing appropriate units of measurement, or using measuring tools (e.g., ruler, protractor). In addition, students making measurement errors often omit measurement units in real-life problems (e.g., Hansen, 2005; MoE, Singapore, 2013).
Presentation errors happen when students have solved a problem but have presented the answer in a mathematically incorrect manner. Here, students often have difficulties in generating equivalent representations for a given mathematical entity or relationship, and they make mistakes in creating equations, inequalities, geometric figures, or diagrams that model the problem in a mathematically proper form (e.g., BOSTES, 2016; Hansen, 2005; Kuo et al., 2001; MoE, Singapore, 2013). For example, A class of 30 students is to be divided into 3 equal-sized teams. How many students will there be in each team? The student might arrive at the answer 10 students but present the answer as
Most common error types among students with MLD
Although there are many studies showing that students with MLD perform significantly weaker compared to their peers in basic mathematical skills (e.g., arithmetic skills, base-10 and place value, word problems; e.g., Kaufmann et al., 2003; Vanbinst et al., 2014), there are relatively few studies that have systematically investigated the error types among students with MLD. Research by Raghubar et al. (2009) showed that among third and fourth graders, the severity of MLD was associated with higher rates of fact errors in simple arithmetic. Fact error was also among the most described errors that were made by students with MLD in the eighth grade (Mazzocco et al., 2008).
Students with MLD are also characterized by making procedural errors (Geary, 2011; Raghubar et al., 2009). Regarding multi-digit calculations, third and fourth graders with severe MLD have been found to commit more errors in subtraction tasks but not in addition compared to low-achieving students (Raghubar et al., 2009). The same study showed that as the students got older, they made fewer procedural errors, indicating that students with MDL may have developmental delays in their knowledge and in the implementation of computational procedures.
Visual-spatial skills seem to affect a number of mathematical skills, especially those supporting number representation (e.g., number inversions and reversal, alignment of column digits) and nonverbal number processing (e.g., Bull et al., 2008; De Smedt et al., 2009), affecting early mathematics performance more than later performance (de Weijer-Bergsma et al., 2015). Regarding children with MLD, Raghubar et al. (2009) found little evidence for third and fourth graders with MLD making visual-spatial errors in multi-digit calculations.
Many studies have suggested that on average there are no gender differences in mathematics achievement, although some gender gaps do exist across nations and cultures (Else-Quest et al., 2010; Hyde & Mertz, 2009; OECD, 2015). Regarding MLD and gender, the prevalence of MLD seems to be the same for boys and girls (Devine et al., 2013). However, there are currently few studies further investigating whether there are any gender differences in terms of mathematical error types made by students with MLD.
Research questions
This study aimed to analyze the errors made by students with MLD in Tibet, particularly regarding error types and frequency. Additionally, given that the quality of mathematics instruction may differ between the rural and urban schools due to the level of mathematics teaching, we were also interested in focusing on this aspect. Although the prevalence of MLD among boys and girls seems relatively equal, prior studies have rarely focused in depth on errors students make and if there are differences based on gender. Therefore, the research questions this study aimed to answer are as follows:
What are the types and frequencies of mathematical errors made by the students with MLD? Are there gender and school type (rural vs. urban) differences in error types?
Methods
Participants
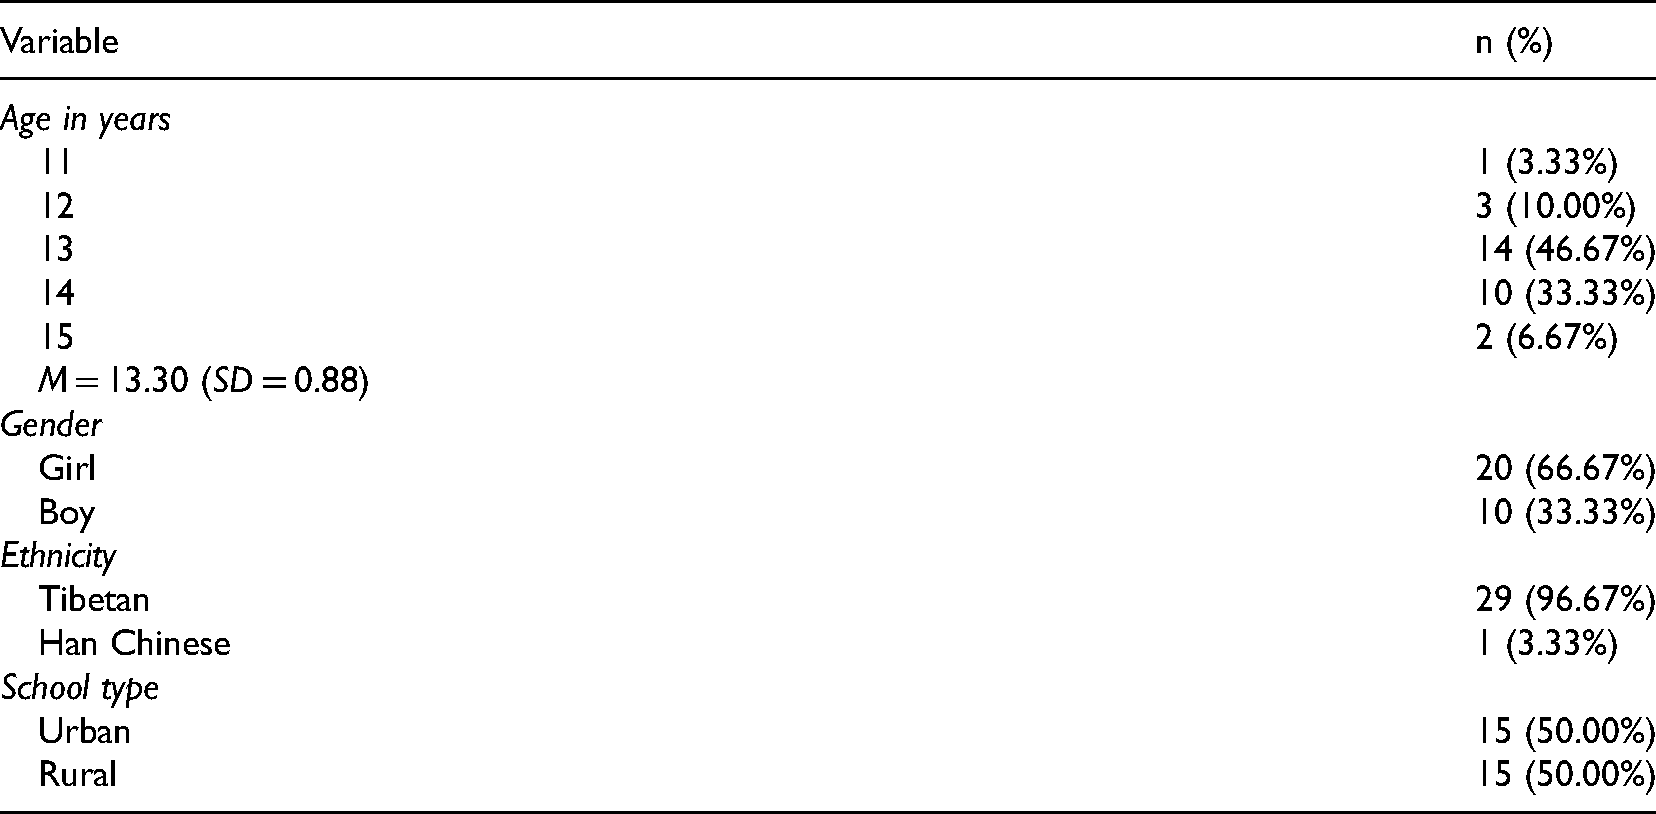
Participants (n = 30) were from two schools in Tibet that volunteered to participate in the study. One was an urban school located in Lhasa (the capital of the Tibet Autonomous Region) and another was a rural school in the countryside of Lhasa region. The following criteria were used in the participant selection process: (1) participants were seventh graders; (2) participants’ mathematics scores from the previous mathematics examination (Secondary School Entrance Examination, organized by the local government) were two or more SDs below the average; (3) participants were recognized by their mathematics teachers as having difficulties in learning mathematics; (4) participants’ Chinese literacy scores from previous examinations were average or above average; and (5) participants themselves agreed to take part in this study. Among these, criteria 2 and 3 were used to identify students with MLD, which consisted of formal assessment (standardized achievement test) and informal assessment (teacher's observations). Criterion 4 was used to exclude the influence of reading difficulties. The participants’ demographic background information is shown in Table 1.
The demographic background information of participants.
The demographic background information of participants.
As shown in Table 1, there was a noticeable variation in age among the seventh graders. This was mainly due to the fact that some participants had repeated 1 or 2 years in primary school because of their difficulties in learning mathematics. In Tibet, students with learning difficulties are always advised to repeat one or more years in general education. At the time of the study, there was no special educational support available (e.g., individualized educational programs, schools specializing in learning disabilities; Ji, 2013). Students could have private tutors after school, but students’ families were responsible for paying for this. There were more girls (n = 20) than boys (n = 10) identified with MLD in the present study. This contradicted previous research findings that there are equal numbers of boys and girls with MLD (e.g., Devine et al., 2013); however, this difference could be explained by the relatively small sample size in the study.
The MEPIT was used in this study (Rong, 2016). MEPIT was developed to identify eight types of mathematical errors: visual-spatial, comprehension, transformation, relevance, fact, procedural, measurement, and presentation. There are a total of 64 items in MEPIT, measuring a variety of mathematics areas (e.g., addition, subtraction, multiplication, and division; decimals; fractions; measurement; geometry). Due to its length, the test is divided into two parts, Part I and Part II, with items in both parts (n = 32) at the same level of difficulty and measuring the same types of mathematics errors. MEPIT was developed based on a combination of items taken from the Mathematical Basic Ability Diagnostic Test (MBADT; Kuo et al., 2001; n = 20), TIMSS Mathematics—Fourth Grade (IEA, 2015; n = 6), and from the study by Desoete et al. (2004; n = 3). In addition, three items were developed by the first author of this paper. The MBADT served as the starting point for the MEPIT, and to cover different mathematical skills and identify eight possible error types, 12 more items were added. Most of the items included in the MEPIT were already proven to work in previous studies. Most of the tasks in the MEPIT were identical to their original source, and others were revised to better fit the cultural and age context (e.g., adjusting expressions in the questions to fit into the Tibetan context, changing some numbers in the tasks). An overview of the question types, their origin, and most possible error types are provided in the Appendix (Supplemental Table A1), and the descriptions of each error type are given in Supplemental Table A2.
Concerning criterion validity, the correlation between the score of the Secondary School Entrance Examination (M = 63.13, SD = 13.78, with a maximum total score of 100 points) and the score of the MEPIT (M = 52.70, SD = 6.38, with a maximum total score of 64 points) was r = 0.48 (p < .01). The correlation coefficient (r) between the scores of Parts I and II was 0.73 (p < .01). Applying the statistics of split-half reliability and coefficient alpha to the score of the MEPIT, the results suggested a strong internal consistency reliability (split-half coefficient = 0.84, Cronbach's α = 0.84).
Procedure
Testing was conducted in September 2016. Participants were given a 1-week interval between taking Part I and Part II of the MEPIT test. In each school, participants were gathered together and instructed by the researcher (first author) before taking the test. The crucial point was to instruct participants to write all their calculation procedures on the test papers, as all the details of their responses were essential to the error analysis. An experienced mathematics teacher invigilated the testing. Each testing session lasted approximately 40 min. Participants took the test during their self-study time (i.e., seventh graders in Tibet have 40 min of self-study time every day, during which there are no formal teaching activities) in a quiet classroom.
Data analysis
The data collected between Part I and Part II of the test were scored and coded separately; next, they were combined together to become the result of the MEPIT and recorded into an Excel document for descriptive statistics where appropriate to look at frequencies of error types. Quantitative data were then run by SPSS (IBM SPSS Statistics 19) for inferential statistics. Pearson's r correlation coefficient and multiple linear regression analyses were conducted to investigate the relations between the error types and their association to the total score of the MEPIT, respectively. The t-test was used to compare the error types, first by gender and then by school types (i.e., urban vs. rural). Due to the small sample size, nonparametric analyses (the Mann–Whitney U-test) were also conducted, and the results were reported if different from the parametric analyses. Effect sizes were calculated as Cohen's d.
Results
Frequencies of error types
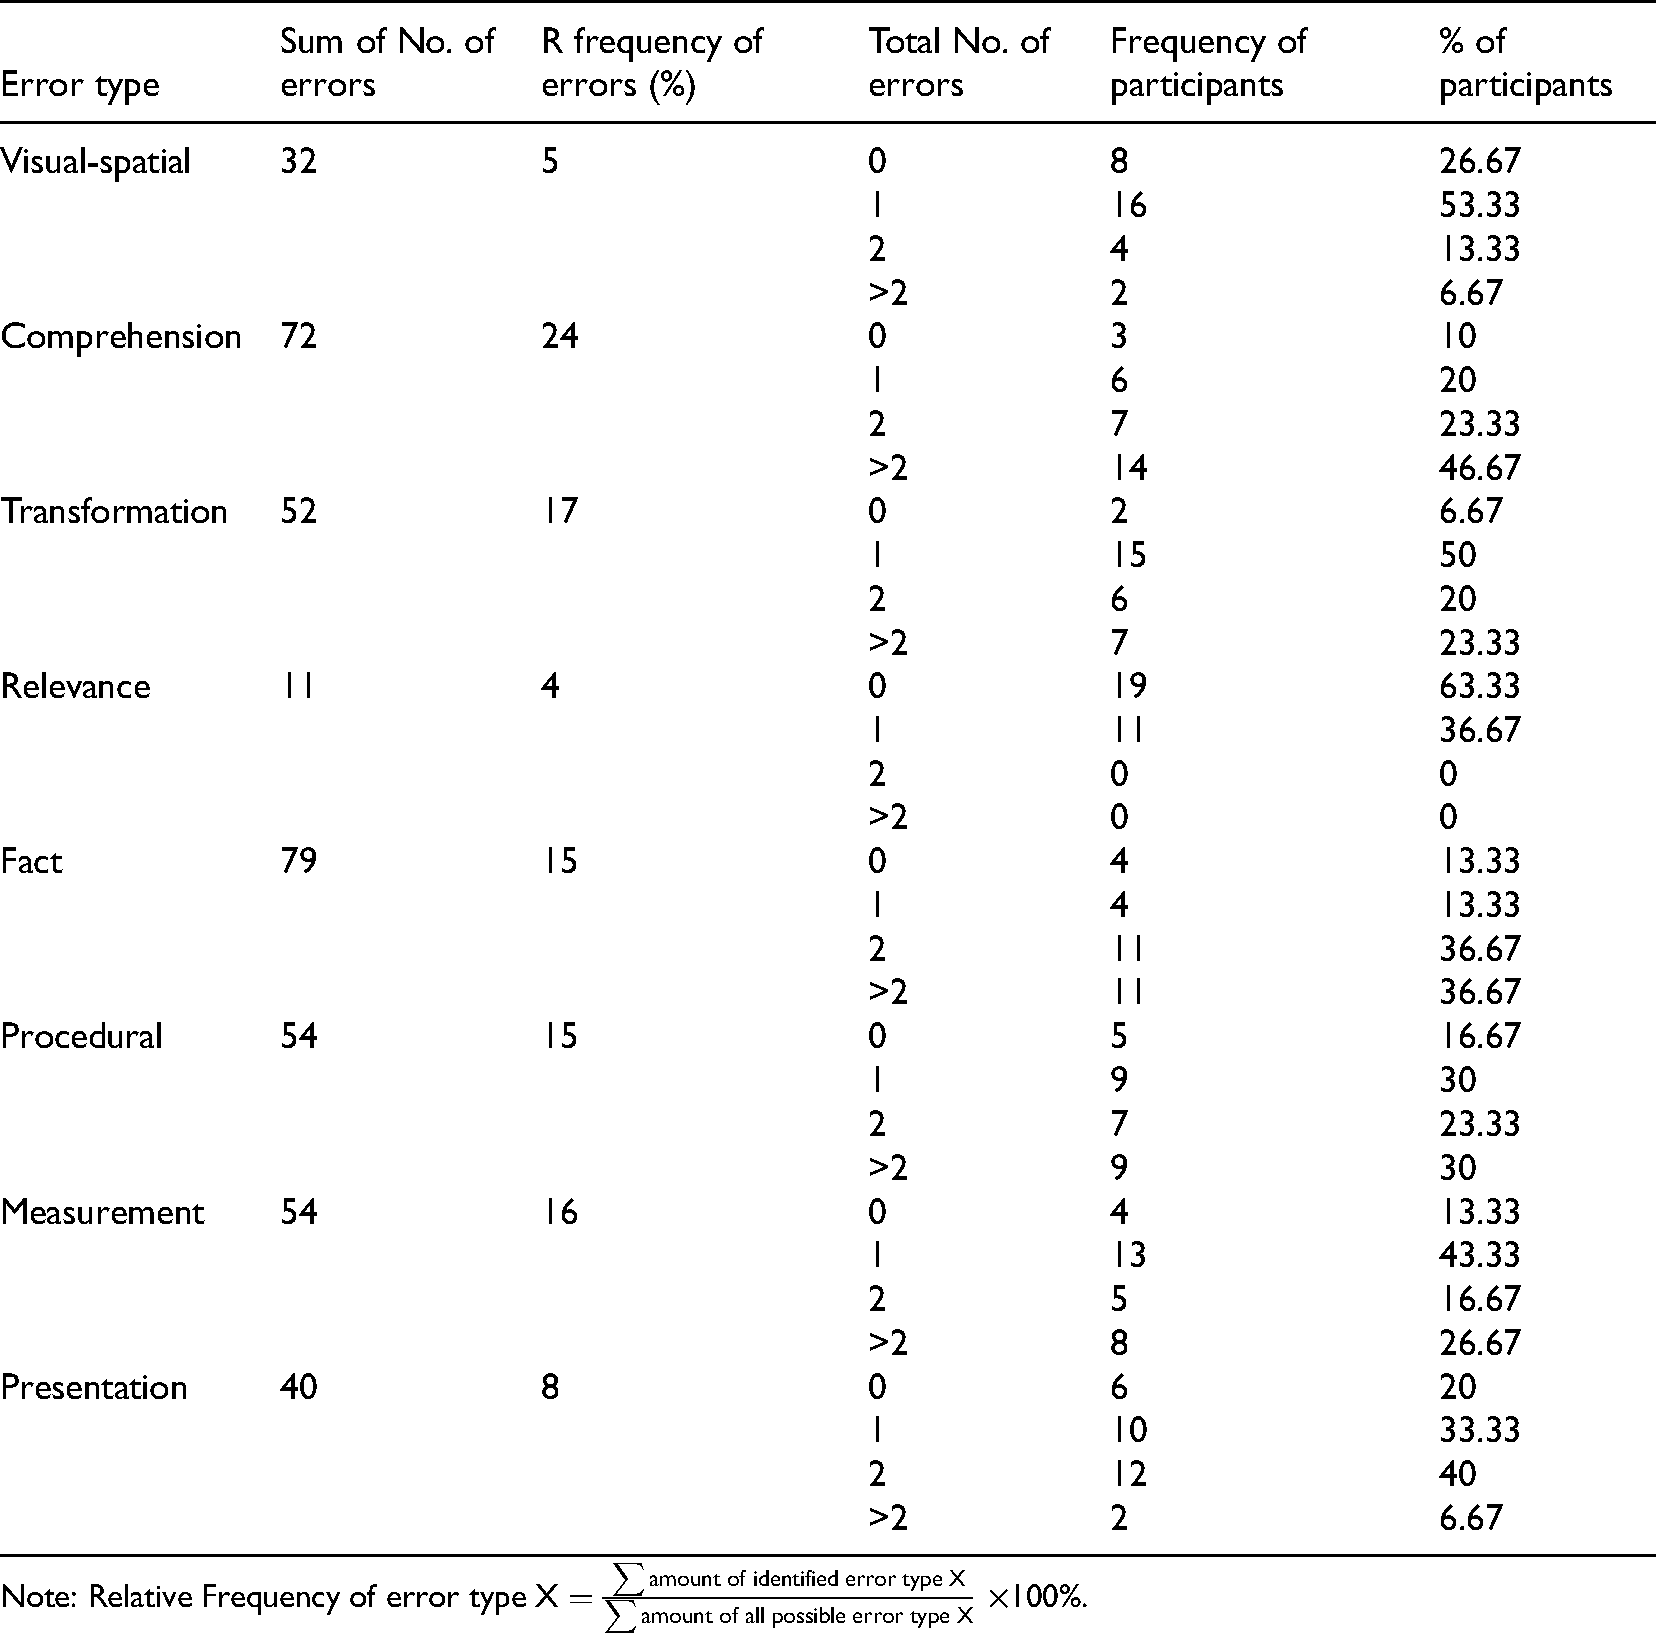
Error frequencies of participants are shown in Table 2. To gain a total view of error distributions, the sum of all error types identified in the MEPIT test was calculated. Among the eight error types, fact errors constituted the largest proportion, while relevance errors constituted the least. Nonetheless, since these error types were not distributed equally in the MEPIT, one specific error type occupying a higher proportion might have been caused by the higher number of test items with the potential to identify this error. This also resulted in the major deficiency of sum numbers. To reduce this bias, relative frequency of error types was calculated. Now, comprehension error occupied the largest proportion, and relevance error occupied the least. Students basically committed the same number of transformation errors, measurement errors, fact errors, and procedural errors. From another perspective, there was a variation of error frequency with many students making no errors, or many making one to two errors of a particular error type. This differentiation is also reflected in Table 2, as evaluated in four groups involving no error, one error, two errors, and more than two errors.
Frequencies of error types.
Frequencies of error types.
Note:
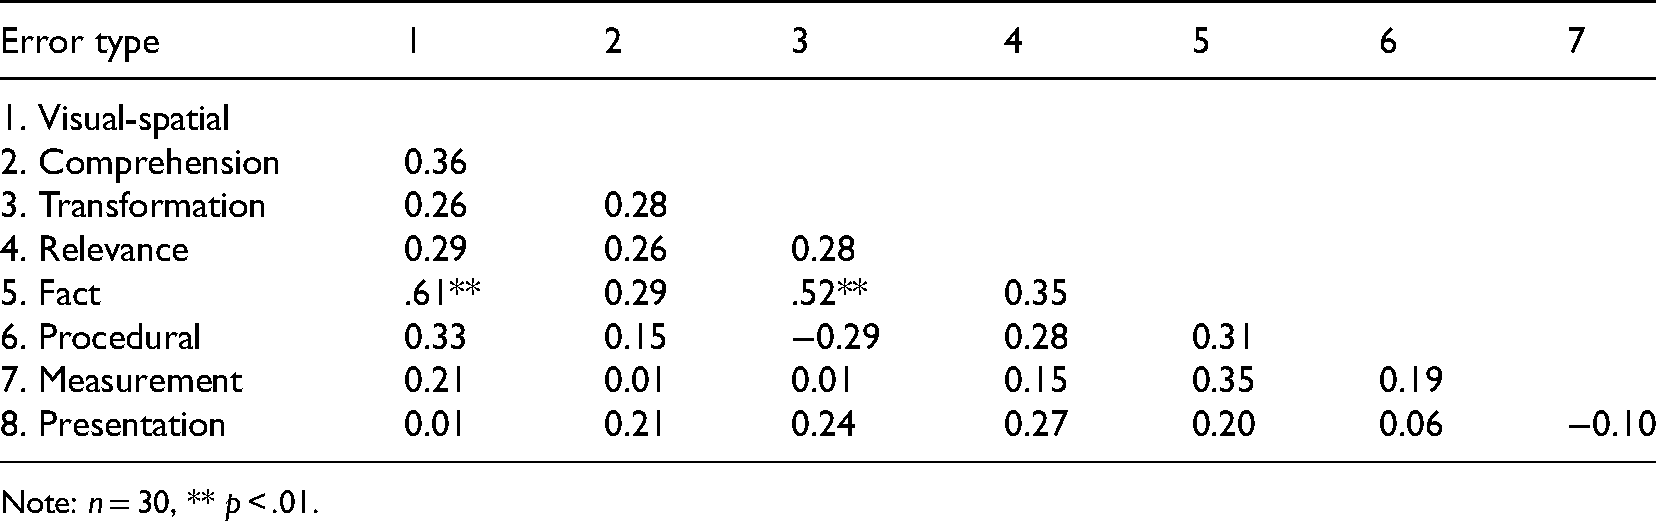
The eight error types were investigated in two aspects: relationships within the eight error types and relationships between the eight error types and the total score of the MEPIT. The Pearson's r correlation coefficient test showed that fact errors were strongly related to visual-spatial errors (r = 0.61, p < .01) and to transformation errors (r = 0.52, p < .01). Most of the associations between the error types were weak or moderate, suggesting that the error types were quite independent of each other (Table 3).
Correlations between eight error types.
Correlations between eight error types.
Note: n = 30, ** p < .01.
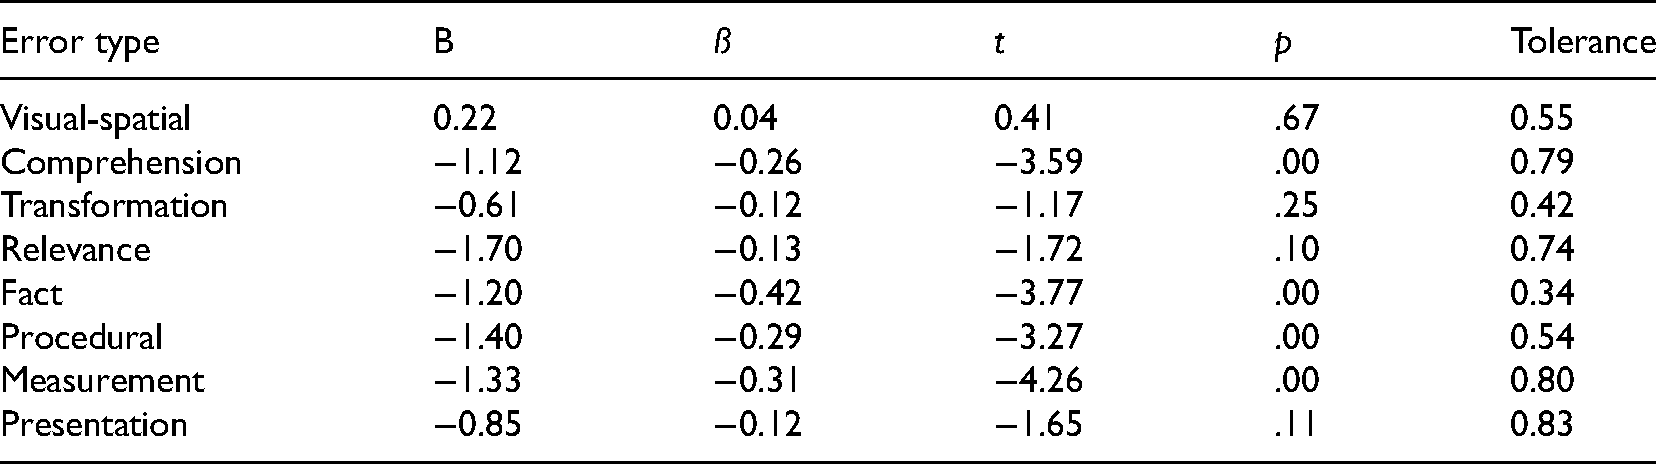
Multiple linear regression was used to examine relationships between the eight error types and the total score of the MEPIT. As shown in Table 4, the results suggest that the eight error types were particularly good at predicting the score of the MEPIT (R2 = 0.911, adjusted R2 = 0.877, strong fit). All the relationships were negative. This is not a surprise because it is reasonable to assume that if students make more errors, they would receive lower scores. Fact errors had the strongest effect on the total scores of the MEPIT (ß = −0.42), followed by measurement errors (ß = −0.31), procedural errors (ß = −0.29), and comprehension errors (ß = −0.26).
Relationships between eight error types and score of MEPIT using multiple linear regression.
The overall performance of girls (M = 50.45, SD = 6.60) in the MEPIT was weaker than that of boys, M = 57.20, SD = 2.35, t (28) = −3.16, p < .05. According to mean values, girls seemed to make more errors compared to boys among all types of errors, excluding presentation errors. The SDs of girls were higher than those of boys (except measurement errors), which indicated that errors made by girls were more dispersed than those made by boys (Table 5). Results of t-test showed a statistically significant difference between girls and boys in terms of fact errors, t (28) = 2.27, p < .05, d = 1.08, and relevance errors, t (28) = 3.38, p < .05, d = 2.16. Differences between girls and boys concerning other types of errors were not statistically significant.
Gender differences in eight error types.
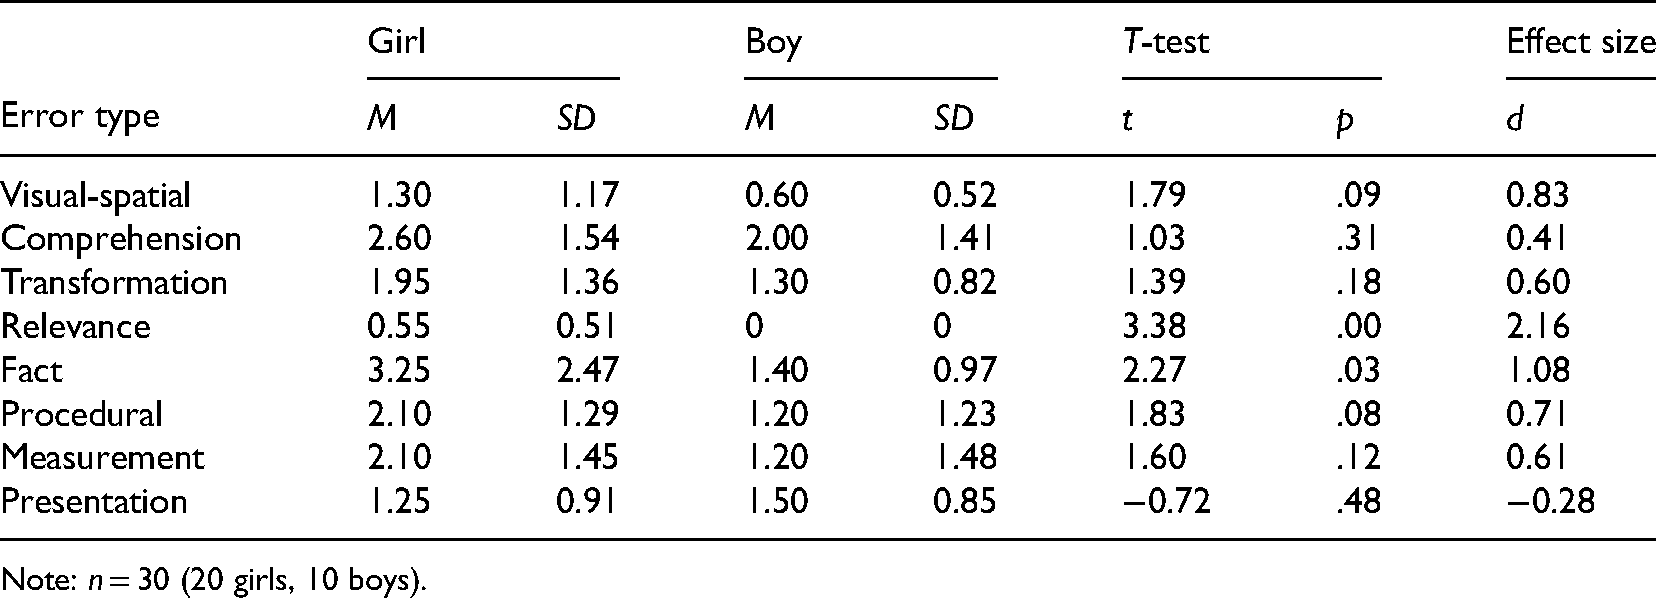
Gender differences in eight error types.
Note: n = 30 (20 girls, 10 boys).
The overall performance of students in the rural school (M = 49.80, SD = 7.12) in the MEPIT was weaker than that of students in the urban school, M = 55.60, SD = 3.94, t (28) = 2.76, p < .05. On average, students from the rural school made more errors than those from the urban school, and their errors were more dispersed (Table 6). However, the only statistically significant difference in error types was found for comprehension errors, t (28) = −2.36, p < .05, d = 0.88.
Differences between school types in eight error types.
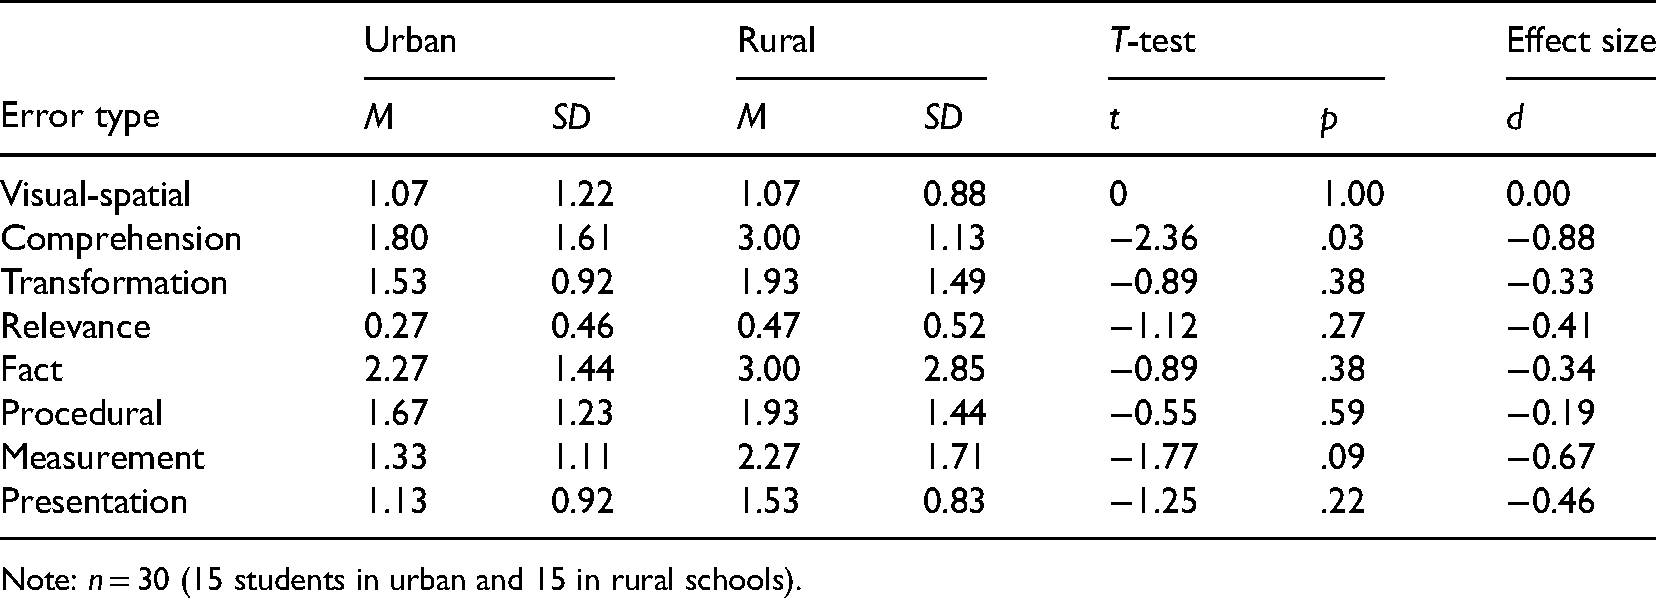
Differences between school types in eight error types.
Note: n = 30 (15 students in urban and 15 in rural schools).
For many decades several researchers and (special) educational practitioners have emphasized the importance of describing and investigating errors manifested in students’ mathematics work (e.g., Hansen, 2005; Herholdt & Sapire, 2014; Raghubar et al., 2009). However, little research has been conducted in Tibet concerning students with MLD, and more specifically, investigating the errors they make in solving mathematical tasks. Error analysis is generally regarded as a prerequisite for better teaching design and to provide educational support for children with MLD (e.g., BOSTES, 2016; Mazzocco et al., 2008; McGuire, 2013). This exploratory study investigated the types of errors made by students with MLD in mathematical tasks from a Tibetan perspective.
The novel MEPIT test could identify relatively effectively the different mathematical error types. When looking at the relationships between these eight error types, most associations were weak or moderate, indicating that the error types were relatively independent from each other. The only exception was the category of fact errors, which had strong correlations with visual-spatial errors and transformation errors. It thus seems likely that fact errors, defined as outlined in this study, partly overlap with visual-spatial and transformation errors. It would be of interest to use a stricter definition of fact errors in future studies (i.e., concerning only errors made in fact retrieval), instead of a wider definition as in this study, to see if fact errors would then be an even more independent error type.
Fact errors were shown to be the most common error type when reported as the sum score. This is in line with previous international findings reporting that children with MLD often commit fact errors as a result of fact retrieval deficits (e.g., Geary et al., 2012; Mazzocco et al., 2008; Raghubar et al., 2009). The next frequently shown error type was comprehension errors. However, when looking at the relative frequency, this type turned out to be the most common error type. Comprehension skills are vital to solve mathematics problems, and previous research has also found that students with MLD often lack skills regarding mathematics (e.g., Desoete et al., 2004; Hansen, 2005). Basang and Shi (2006) have claimed that language barriers faced by Han Chinese teachers and Tibetan students could lead to difficulties in understanding mathematical concepts, rules, terms, and gaining mathematical meaning from word problems. The existence of Tibetan—Chinese—Mathematical Language interpretation chain produces dual obstacles, possibly also affecting comprehension errors to occur among students with MLD in Tibet. In addition, problems in fact retrieval and comprehension in mathematical word problems can be affected by cognitive deficits in representing and retrieving information from phonetic and semantic memory (Hanich et al., 2001). Transformation errors were also reported as one of the most frequent error types in this study. Wijaya et al. (2014) found that low-performing students tended to make more comprehension and transformation errors than high-performing students. Transformation errors often occur as a result of poor mental representation skills. Many mathematics problems require a transformation process to represent the problem mathematically before putting it into the calculation process (Desoete et al., 2004; OECD, 2012).
Considering the challenging Tibetan schooling context, for some children, the number of errors made may reflect inadequate practice opportunities in mathematics. In other words, these students may not have had enough experience with quality mathematics training in basic skills or early support with special educational approaches, such as using effective (early) mathematics interventions (Chodura et al., 2015). Grade retention for students with learning difficulties, common in Tibet at the time of conducting this study, has not been internationally shown to be an effective way of supporting the learning and development of academic skills compared to some other pedagogical approaches (Jimerson, 2001). Instead, early educational support by means of intensified and special needs support, such as in the Response to Intervention model (Lembke et al., 2012), might be more beneficial in the development of mathematical skills, in identifying students in need of educational support in mathematics, and with targeted support to diminish the prevalence of MLD.
Many studies have provided evidence that, on average, boys and girls differ very little in their mathematics achievement. However, quite considerable gender gaps do exist across nations and cultures (Else-Quest et al., 2010; Hyde & Mertz, 2009; OECD, 2015). In this study, girls made more errors and achieved significantly lower scores in the MEPIT than boys. Regarding the gender differences in error types, girls seemed to be more vulnerable to fact and relevance errors than boys. The magnitude of gender differences is influenced by the education system, schools, and classrooms (OECD, 2015), as well as depending on the socio-economic status and welfare of women (Else-Quest et al., 2010). One explanation for the gender differences found in this study might be that Tibetan girls often have more responsibilities in household chores, which may reduce their study time and thus lead to a poorer performance compared to Tibetan boys (Ji, 2013). However, as the group sizes were very small, these results require some caution in their interpretation. In terms of the differences between the school types, the MEPIT scores of students from the rural school were significantly lower than those from the urban school. In terms of error types, rural school children tended to make more comprehension errors than urban school children. The villages in Tibet are often scattered far away from cities and more confined to their own cultures. Students there are thus less exposed to the Chinese language and receive less literacy experiences than children in urban areas. The “YuánZàng” movement has improved the quality of education in Tibet. However, because most teachers are pooled into big cities, mathematics education in rural areas is still in a disadvantageous state (Fang et al., 2008; Ji, 2013).
Students learn from their errors. The practical implementation and value of this study would be to support teachers to make sense of errors that students may make and use the information to plan instruction accordingly. The novel MEPIT test provided for the Tibetan mathematics teachers would be the first step toward this. MEPIT might serve as a screener to identify possible errors and misconceptions the students make. In addition, for those who are identified as making the most errors, individually administered mathematical tasks (e.g., allowing students also to think aloud, thus explaining their mathematical thinking) could complement these findings.
The limitations of this study mainly concern the small sample size and measures used. Although the sample was unique, as not much research about MLD has been conducted in Tibet, a larger group of participants, both from urban and rural areas, would have increased the generalizability of the results. Using the novel MEPIT test, our study can therefore be considered as exploratory in nature. Inclusion of students with MLD often results in the sample size being rather low. The stricter the criteria used for the identification of MLD, the more challenging it is to get a large enough sample size. In addition, of interest for future studies would be including a group of average-performing students in mathematics to compare the error types between them and the students with MLD. Furthermore, with a bigger sample, it might be possible to investigate what kind of effects the mathematics teachers (e.g., including their teacher training and experience in mathematics) have on the frequency of different error types—for example, if the students in the same classroom make more similar errors compared to another classroom of students. Longitudinal studies would reveal if and when certain error types emerge, and further, what type is the most frequent at different grades.
This study included only the measure of the MEPIT for investigating errors in mathematical tasks. Our categorization of errors in the MEPIT was based on prior research, but there is always the possibility that we have overlooked some error types that would have been revealed in some tasks. In future studies, students with MLD could also be interviewed to determine errors in solving mathematics problems. These interviews might give more information about the processes, which take place while the student is solving the problem, for example by asking the student to explain “How did you solve this problem?” As different cognitive (e.g., executive functions) and language (e.g., reading comprehension) skills are often associated with mathematics performance, it would be of interest to add these measures as covariates in the future studies to find their role regarding different error types.
Conclusion
This study is one of the first conducted in Tibet investigating errors made by students with MLD in mathematical tasks. Identifying the error types made by these students could inform teachers in modifying their instruction to better meet the learning needs of their students. We found that the seventh-grade students with MLD most often made fact errors and comprehension errors. Girls were more likely to make mathematical errors compared to boys, especially fact and relevance errors. Regarding the school types, the students in the rural school made more comprehension errors. As our sample size was rather low, mainly due to the strict cut-off criteria set for the MLD, the results must be interpreted with caution. However, this exploratory study may show a way forward in investigating error types in mathematics. The novel measure, the MEPIT, could serve as a screening tool for both the researchers and the Tibetan teachers in identifying the errors students make in their mathematical tasks.
Supplemental Material
sj-docx-1-mea-10.1177_27527263221089357 - Supplemental material for Error analysis of students with mathematics learning difficulties in Tibet
Supplemental material, sj-docx-1-mea-10.1177_27527263221089357 for Error analysis of students with mathematics learning difficulties in Tibet by Lei Rong and Riikka Mononen in Asian Journal for Mathematics Education
Footnotes
Declaration of Conflicting Interests
The author(s) declared no potential conflicts of interest with respect to the research, authorship, and/or publication of this article.
Funding
The author(s) received no financial support for the research, authorship, and/or publication of this article.
Supplemental Material
Supplemental material for this article is available online.
References
Supplementary Material
Please find the following supplemental material available below.
For Open Access articles published under a Creative Commons License, all supplemental material carries the same license as the article it is associated with.
For non-Open Access articles published, all supplemental material carries a non-exclusive license, and permission requests for re-use of supplemental material or any part of supplemental material shall be sent directly to the copyright owner as specified in the copyright notice associated with the article.