
Abstract
Keywords
Introduction
Anterior open bites (AOB) are a type of dentofacial disharmony (DFD) impacting esthetics, speech, and incising food; stable correction requires orthodontics, skeletal anchorage, and/or orthognathic surgery.1 -3 AOB malocclusions are one of the most difficult to treat due to their multifactorial etiology and tendency to relapse.3,4 The prevalence of AOB is 3.5% among youths 8 to 17 years old; 17% of non-growing patients seek surgical orthodontics for correction of AOB.5 -7 AOB patients present with vertical discrepancies that impact tongue position and speech, with 83% demonstrating speech distortions, compared to only 5% to 7% of the general adolescent population; this 20-fold difference in prevalence suggests a causal link.8,9 AOB is the most common malocclusion associated with articulation disorders. 10 Pathologic speech impacts communication and self-confidence, which impairs social interactions, career development, and quality of life.8,11 -13
Production of consonants requires neuromuscular coordination of airflow against articulating structures including the tongue, teeth, and alveolus (Figure 1). This results in an acoustic signal that is perceived as a specific consonant. Between 80% and 90% of English consonants involve an articulation in the anterior oral cavity, suggesting occlusal and jaw relationships may affect articulation.13 -15 Consonants that depend on articulation of the tongue and alveolus include /t/ (a stop), /s/ (a fricative), and /tʃ/ (“ch,” an affricate); therefore, distortions can occur when structures of the oral cavity are malformed and/or malpositioned, as with DFD. 16 Common distortions associated with DFD patients include dental lisping where the tongue tip is placed too anteriorly from the alveolar ridge and interdental lisping where the tongue tip protrudes between the teeth. 17 Dental distortions are often associated with skeletal Class III malocclusion; interdental distortions are often associated with AOB. As indicated by Vallino and Tompson, 17 at times, these articulatory distortions may occur without an auditory component and are only visual in nature.
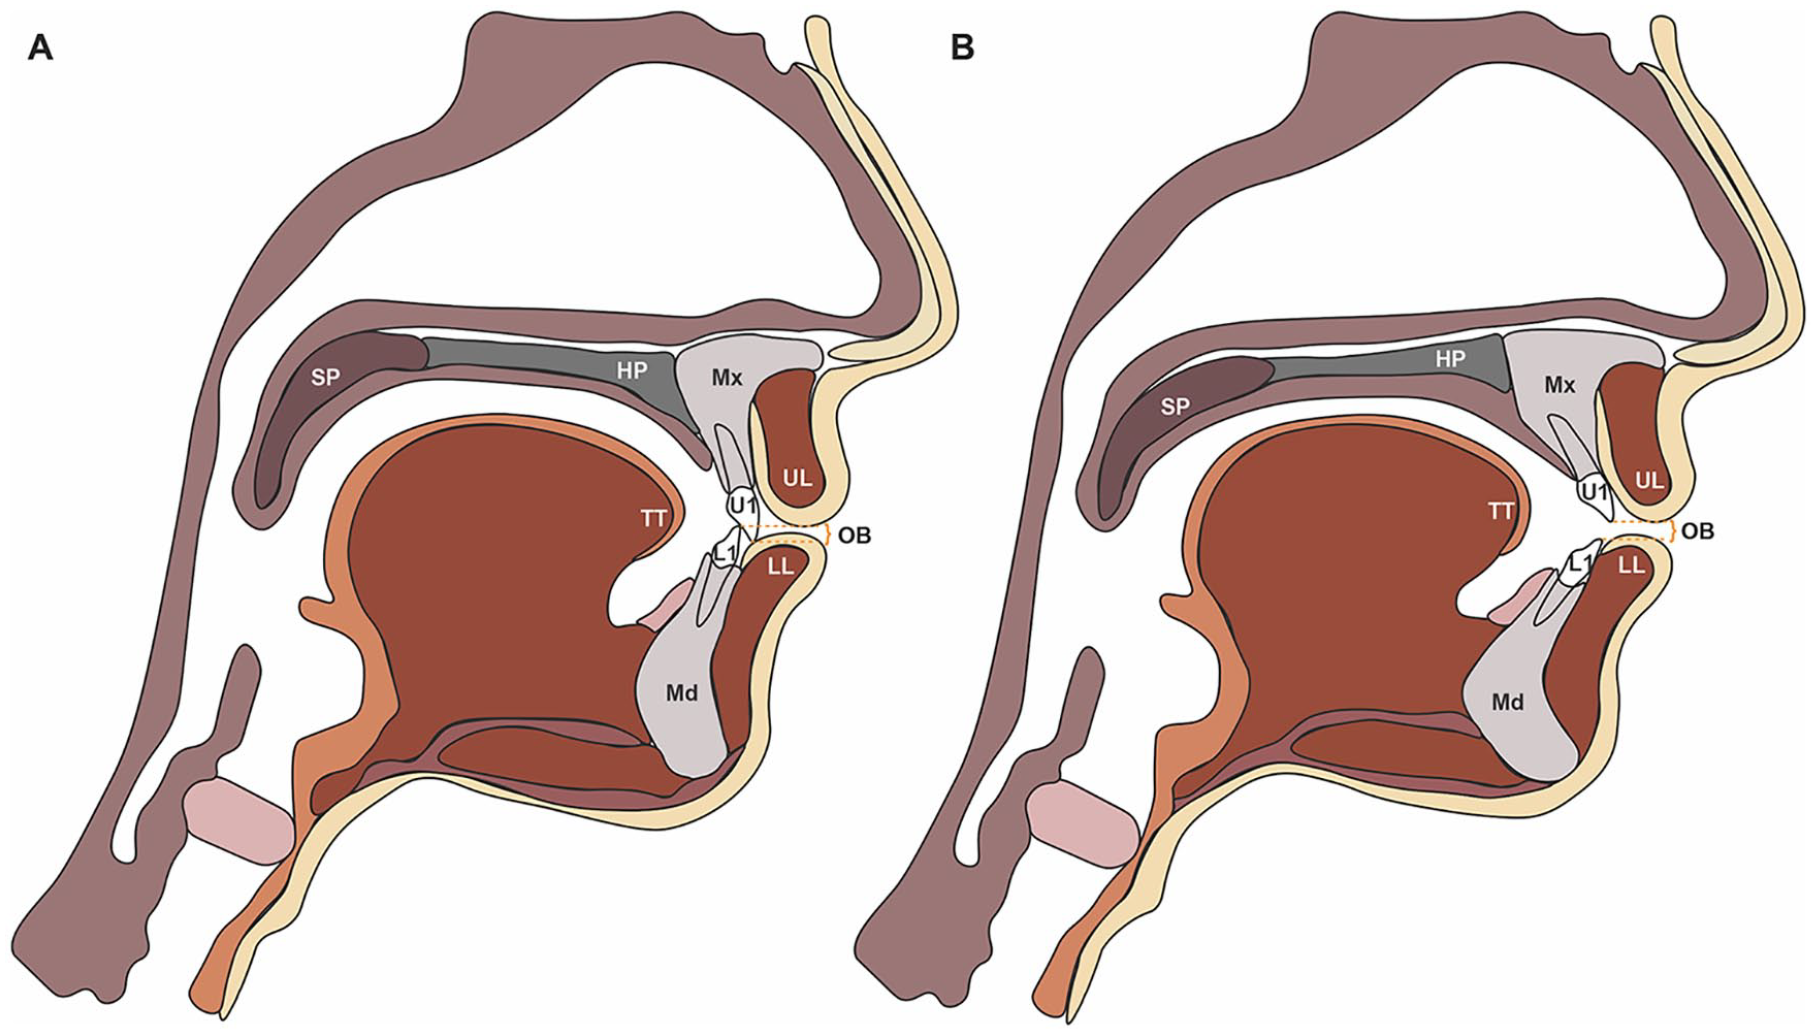
Sagittal schematics of jaw position and craniofacial structures. (A) Class I anatomy. (B) AOB anatomy. An AOB is the absence of vertical overlap between incisors when posterior teeth are in occlusion. 5 An AOB is a vertical discrepancy, and can be paired with any horizontal (anterior-posterior) positioning, including Class I, II, or III. AOB patients often present with skeletal discrepancies, which can include: a decreased ratio of posterior face height (PFH) to anterior face height (AFH) (short posterior face height, a short vertical ramus), a decrease in the ratio of upper face height (UFH) to lower face height (LFH, long lower face), tipped palatal plane (SN-PP), divergent dental bases (PP-GoGn) and an increase in mandibular plane angle (MPA, SN-GoGn angle, hyperdivergent tendency), and gonial angle.18,19 Labels: U1 = upper 1, L1 = lower 1, UL = upper lip, LL = lower lip, SP = soft palate (or velum), HP = hard palate, TT = tongue tip, Mx = maxilla, Md = mandible, and OJ = overjet. OJ is the extent of horizontal (anterior-posterior) overlap of the maxillary central incisors over the mandibular central incisors.
Perceptual studies link AOB to speech disorders. For example, an observational study found children and adults (8-36 years) with open bites as small as −2 mm demonstrated sound production errors. 14 In preschool aged children, speech therapists found articulation disorders in 84.4% of children with AOB compared to 23.2% in controls, with 81.3% of AOB children demonstrating abnormal resting tongue posture. 20 Children 9 to 12 years old with AOB (n = 5 AOB, 5 controls) were found to have articulatory distortions possibly due to increased lingual thickness and rapid, exaggerated tongue movements.4,21 Although some studies suggest speech distortions linked to AOB may stem from abnormal tongue posture, movement, or size, these studies are primarily based on speech therapists’ qualitative perceptual assessments and are derived from modest sample sizes.
A pressing need exists to understand how jaw disharmony relates to speech, as articulation concerns seem greater than impaired chewing as a motivator for surgery. 22 More than a quarter of our AOB patients have a chief concern related to speech, and as their providers, it is imperative that we can understand and identify speech issues to provide appropriate guidance and referral. Currently, we are unable to give evidence-based answers as to whether jaw disharmony correlates with speech distortions, if distortions occur due to structure, function, or both, and if orthognathic surgery will correct speech. This stems, in part, from the lack of quantitative speech evaluations in the DFD literature, which we address in this report by using spectral moment analysis (SMA).11,23-25 SMA is a method used to define characteristics of aperiodic noise in a speech signal using statistical descriptions. Here, we use SMA to quantitatively examine the relationship between vertical discrepancies and speech distortion in AOB patients. We hypothesize that when compared to control subjects with normal jaw proportions, patients with AOB have a difference in spectral properties of stop (/t/ or /k/), fricative (/s/ or /ʃ/), and affricate (/tʃ/) consonant sounds and that severity of AOB jaw disharmony correlates with degree of speech abnormality. To test our hypotheses, we recorded speech and obtained occlusal and cephalometric measurements to quantitatively examine differences in 39 AOB patients relative to reference subjects.62
Methods
This observational cohort study focused on the influence of vertical jaw disproportions on speech, comparing audio, occlusal, and cephalometric data from a control/reference population with patients with AOB. Thirty-nine DFD patients with AOB malocclusions were consecutively enrolled from the UNC DFD clinic (7 Class I, 10 Class II, and 22 Class III) over a 2-year period (12/2018-12/2020) for assembly of a DFD research database to evaluate surgical speech outcomes, as described. 11 Exclusion and inclusion criteria are found in Supplemental Table 1. Speech develops and matures by age 8; age variation within our range (14-40 years old), therefore, should not affect speech.14,26,27 Sixty-two reference controls were recruited as a convenience sample from dental patients and students, possessing ideal dental and skeletal proportions, including Class I jaw and dental relationships with positive overbite (0 mm ≤ OB ≤ 4 mm) (Supplemental Table 2).
Standard of care at our DFD clinic includes perceptual evaluations by an experienced speech language pathologist (SLP) and speech recordings for proper speech diagnosis and referral. Orthodontic and surgical records were collected including occlusal measurements, dental models, photos (intraoral and extraoral), panorex, and cephalogram radiographs. Cephalogram radiographs were traced to evaluate skeletal relationships (ANB, IMPA, Wits, FMA, SN-GoGn) as described, by a single examiner, blinded to patient identity, previously assigned DFD category, and the results of the speech evaluations. 11 Two weeks later, the same examiner retraced one-quarter of the cephalograms (n = 10, randomly chosen), for an intra-examiner concordance test to evaluate tracing reliability (Supplemental Table 3). Data were stratified by vertical status (overbite) and by anterior-posterior (AP) classification using overjet (OJ). Patient records were individually reviewed for overjet and molar AP relationships to ensure OJ was consistent with the AP severity of subjects.
Speech analyses were adapted from Lathrop-Marshall et al 11 and Zajac et al. 25 Subjects were qualitatively evaluated using a perceptual analysis for auditory and visual distortions by an experienced SLP in person, as described. 11 Subjects were seated in a sound-attenuated booth (Eckoustic Noise Control Products: Eckel Industries of Canada Limited) and fitted with a head-mounted microphone (AKG, model 520, Vienna, Austria). The microphone was connected to a single channel of the Computerized Speech Laboratory system (CSL Model 4500, Kay Pentax, Pentax Medical, NJ, USA).11,23 -25 The CSL was configured to record at a sampling rate of 44.1 kHz with a low-pass filter set at 80% of the Nyquist frequency (~18 kHz). Patients were audio recorded reading a series of 60 phrases containing 20-English words (Supplemental Table 4) within a carrier phrase (“say ____ again”). Each word/phrase was repeated 3 times in a fixed random order. The words were selected to evaluate 5 sounds articulated with the tongue at the alveolus or palate—/s/, /ʃ/ (spelled “sh”), /t/, /tʃ/ (spelled “ch”), and /k/.17,28 These sounds involve the generation of frication noise that we hypothesized would be affected by AOB.
Spectral moment analysis (SMA) is a technique for describing the distribution of sound energy in the frequency domain and is used to quantify the spectral characteristics of target sounds produced by speakers. 23 For SMA, an acoustic power spectrum is treated as if it were a probability distribution. The first spectral moment (M1) is the centroid tendency or frequency (eg, center of gravity) and is the mean frequency of the sound energy.11,23,24 For example, when we distinguish /s/ (as in “see”) and /ʃ/ (as in “she”) perceptually, we hear that /s/ has more high frequency energy and thus a higher M1 than /ʃ/. 29 The second moment (M2) is the spectral spread (eg, standard deviation, variance) of sound energy, and its value is lower in spectra with a more narrow concentration of energy around a particular frequency. The third moment (M3) is the skewness or tilt of the sound energy distribution. The fourth moment (M4) is the kurtosis or peakedness of the power spectrum.11,23,24 M1 and other spectral moments are used to quantify acoustic differences within a sound category and between different speakers, as used here. 23 Changes to consonant articulation that affect the size of the anterior oral cavity and/or the size of the mouth opening are expected to be reflected in the spectral moments generally, and in M1 and M2 in particular, because the centroid tendency (M1) and spectral spread (M2) are both related to the resonances of this front cavity. Since DFD patients have altered anterior oral cavities relative to references subjects, M1 and M2 values were determined by SMA and statistically evaluated.
With the examiner blinded to patient identity, DFD category, and perceptual speech evaluation results, we used TF32 software (CSpeech Software, Madison, WI, http://userpages.chorus.net/cspeech/) to determine the 4 spectral moments for each target consonant by placing a 20 ms window at the temporal midpoint of the 2 fricatives (/s/, /ʃ/) and at the beginning of the noise burst for the 2 stops (/t/, /k/) and affricate (/tʃ/).11,30 Approval was granted by the Institutional Review Board (IRB) of UNC Adams School of Dentistry (#18-1406 and #19-1196).
Statistical software (SAS software version 9.4, SAS Institute, Inc., Cary, NC) was used to compare spectral moments. We utilized a mixed model analysis with the word as a random variable. For SMA, the 4 spectral moments for each of the 5 sounds were evaluated for the “all AOB” cohort. Then, the AOB group was stratified by AP classification to remove potential confounding effects of AP discrepancies. The “all AOB,” Class I AOB, Class II AOB, and Class III AOB cohorts were analyzed as unadjusted data, as well as after adjustment for age, race, and gender. Regression analysis was used to test for a linear relationship between spectral moments, occlusal and skeletal measures (Occlusal value: overbite; Cephalometric values: FMA, SN-GoGn, ANB, and Wits). Statistical significance was accepted at P < .05 following Tukey adjustment and was accepted at P < .01 following Tukey and Bonferroni multiple-testing adjustments.
Results
Perceptual Evaluations
All evaluated consonants were distorted in a markedly higher fraction for patients with AOB than controls, when perceptually evaluated by a SLP who scored speech abnormalities (Figure 2). The percentage of AOB patients with visual dentalized production (when the tongue is visibly positioned too anteriorly) of the speech targets /sa/, /si/, /sɪsi/ (“sissy”), /ta/, and /la/ was at least 10 times the prevalence, and as high as approximately 70 times more frequent than controls for the /sa/ production. For visual interdental distortion (when the tongue visibly protrudes between the front teeth) of the same sounds, there are at least 2.5 times the prevalence among AOB patients compared to reference controls. Auditory (heard) distortions were seen in the AOB patients for all 5 sounds and were notably increased for the /ta/ and /sa/ sounds at 45 times and 80 times the prevalence of reference controls, respectively. Consistent with this high prevalence of perceived speech distortions for /sa/ and /ta/, SMA also identified significant shifts in the M1, M2, and M4 for the /s/ and /t/ sounds when comparing the AOB cohort with reference controls (Figures 3 and 4, Supplemental Figures 1 and 2).
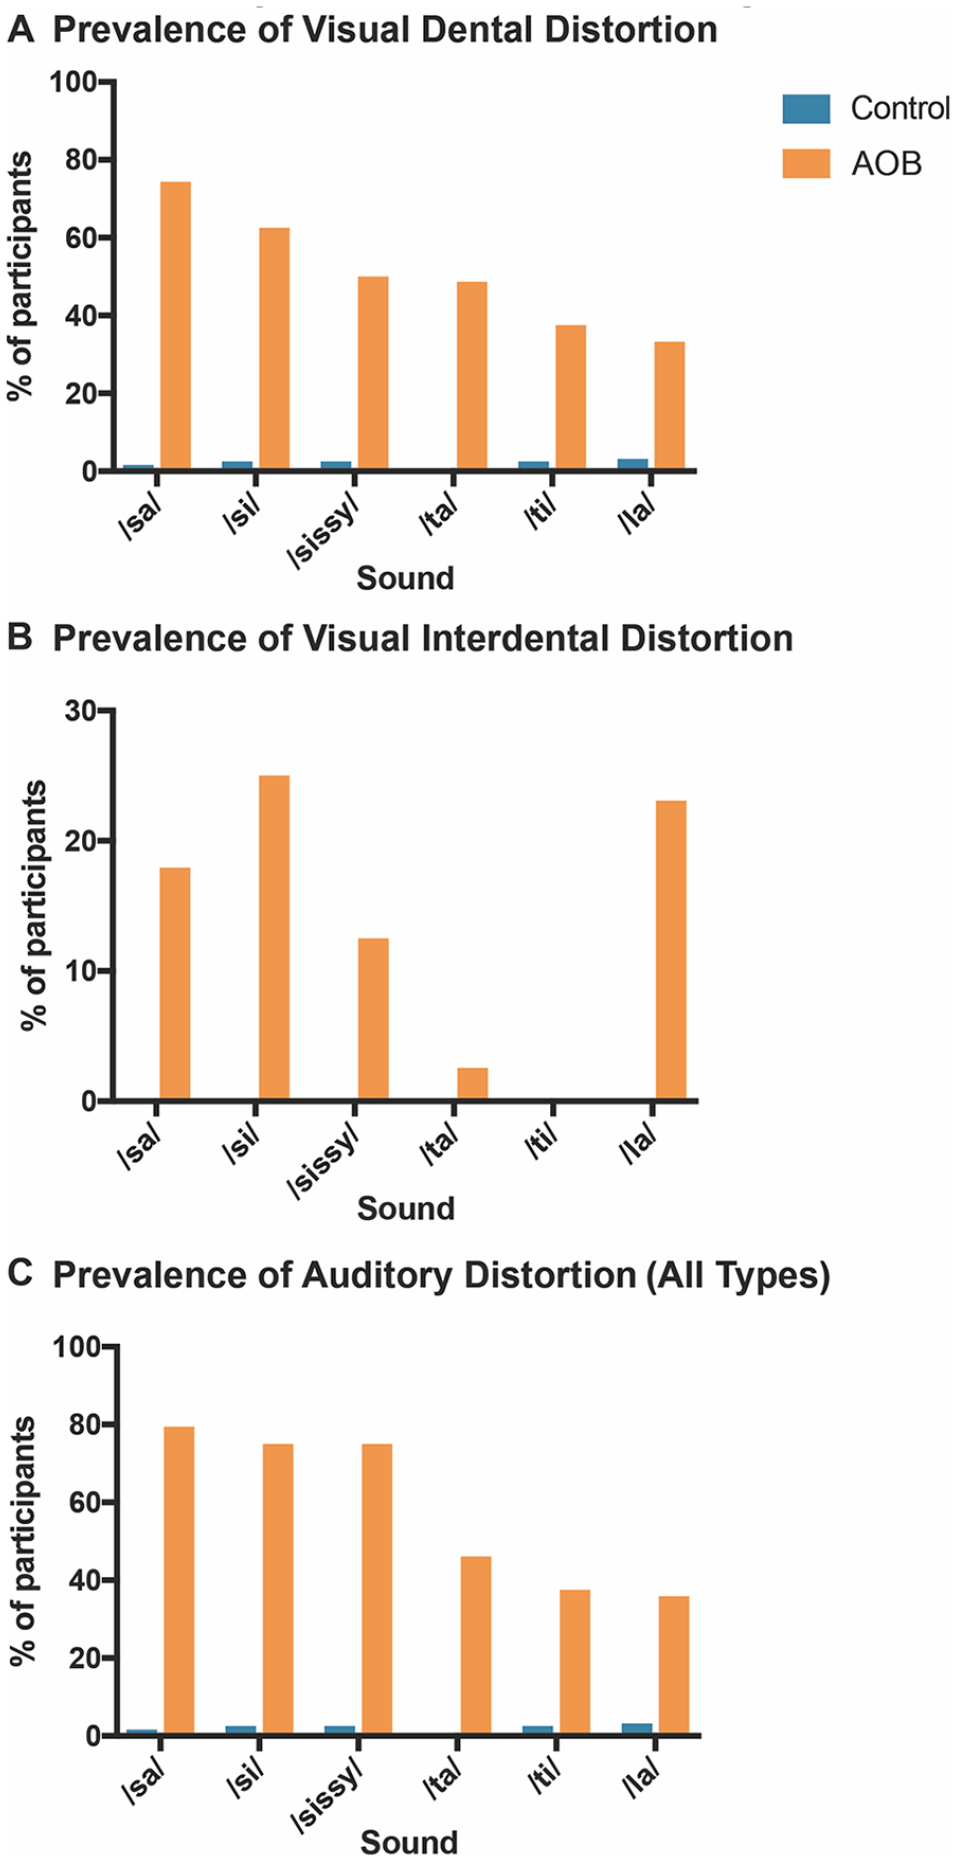
Prevalence of speech distortion in DFD Patients with AOB and Class I controls. A speech-language pathologist (SLP) performed a perceptual evaluation and scored patients for visual and auditory distortions. Percentages of participants exhibiting distortions are represented in the bar graphs. (A) Prevalence of visual dental distortion. A dental distortion occurs when the tongue is visibly positioned too anteriorly during sound production. (B) Prevalence of visual interdental distortion. An interdental distortion occurs when the tongue visibly protrudes between the front teeth during speech. 17 (C) Prevalence of auditory distortion (any type). An auditory distortion is when a sound is distorted or changed. Types of auditory distortions include whistled, backed, and lateralized. Blue: Control patients. Orange: DFD patients with AOB malocclusions.
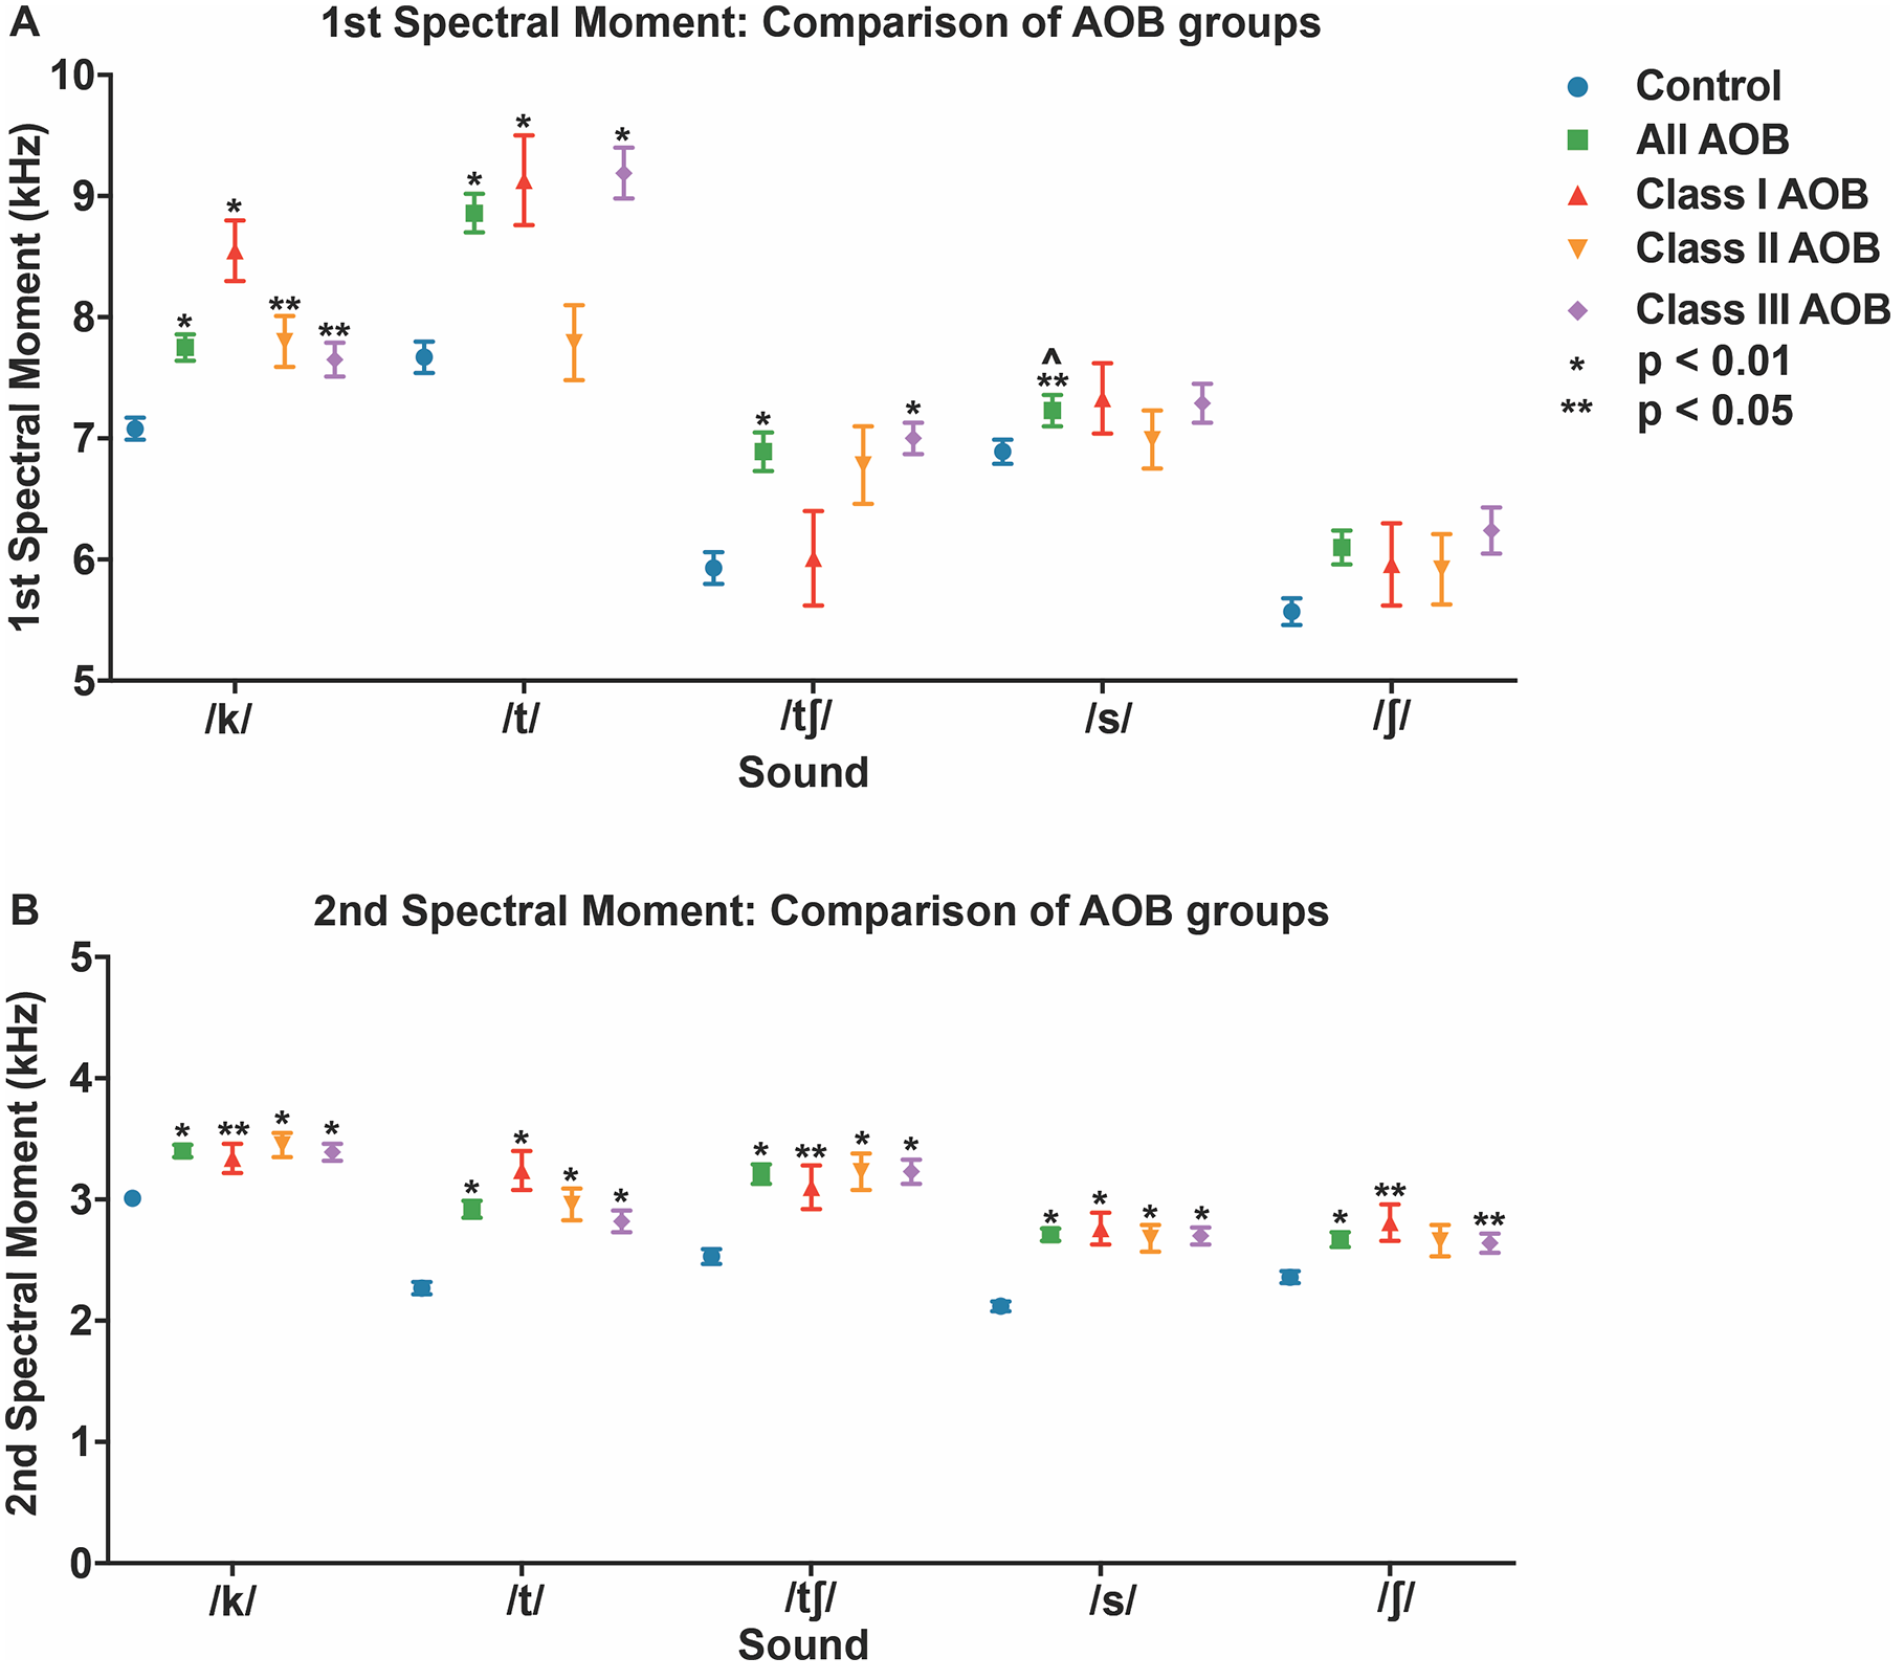
First and second spectral moments for patients with AOB DFD and Class I controls. (A) First Spectral Moment (M1, Mean Frequency) by sound. (B) Second spectral moment (M2, standard deviation = variance) by sound. Blue circle: Class I controls with positive overbite. Green square: “All AOB” DFD patients with negative overbite. Red triangle: Class I AOB DFD patients. Orange upside down triangle: Class II AOB DFD patients. Purple diamond: Class III AOB DFD patients. Bars represent standard deviation. Conventions: *p < 0.01 significant by Bonferonni adjustment. **p < 0.05. ^individual comparison has significance but no type III group significance (p > 0.05).
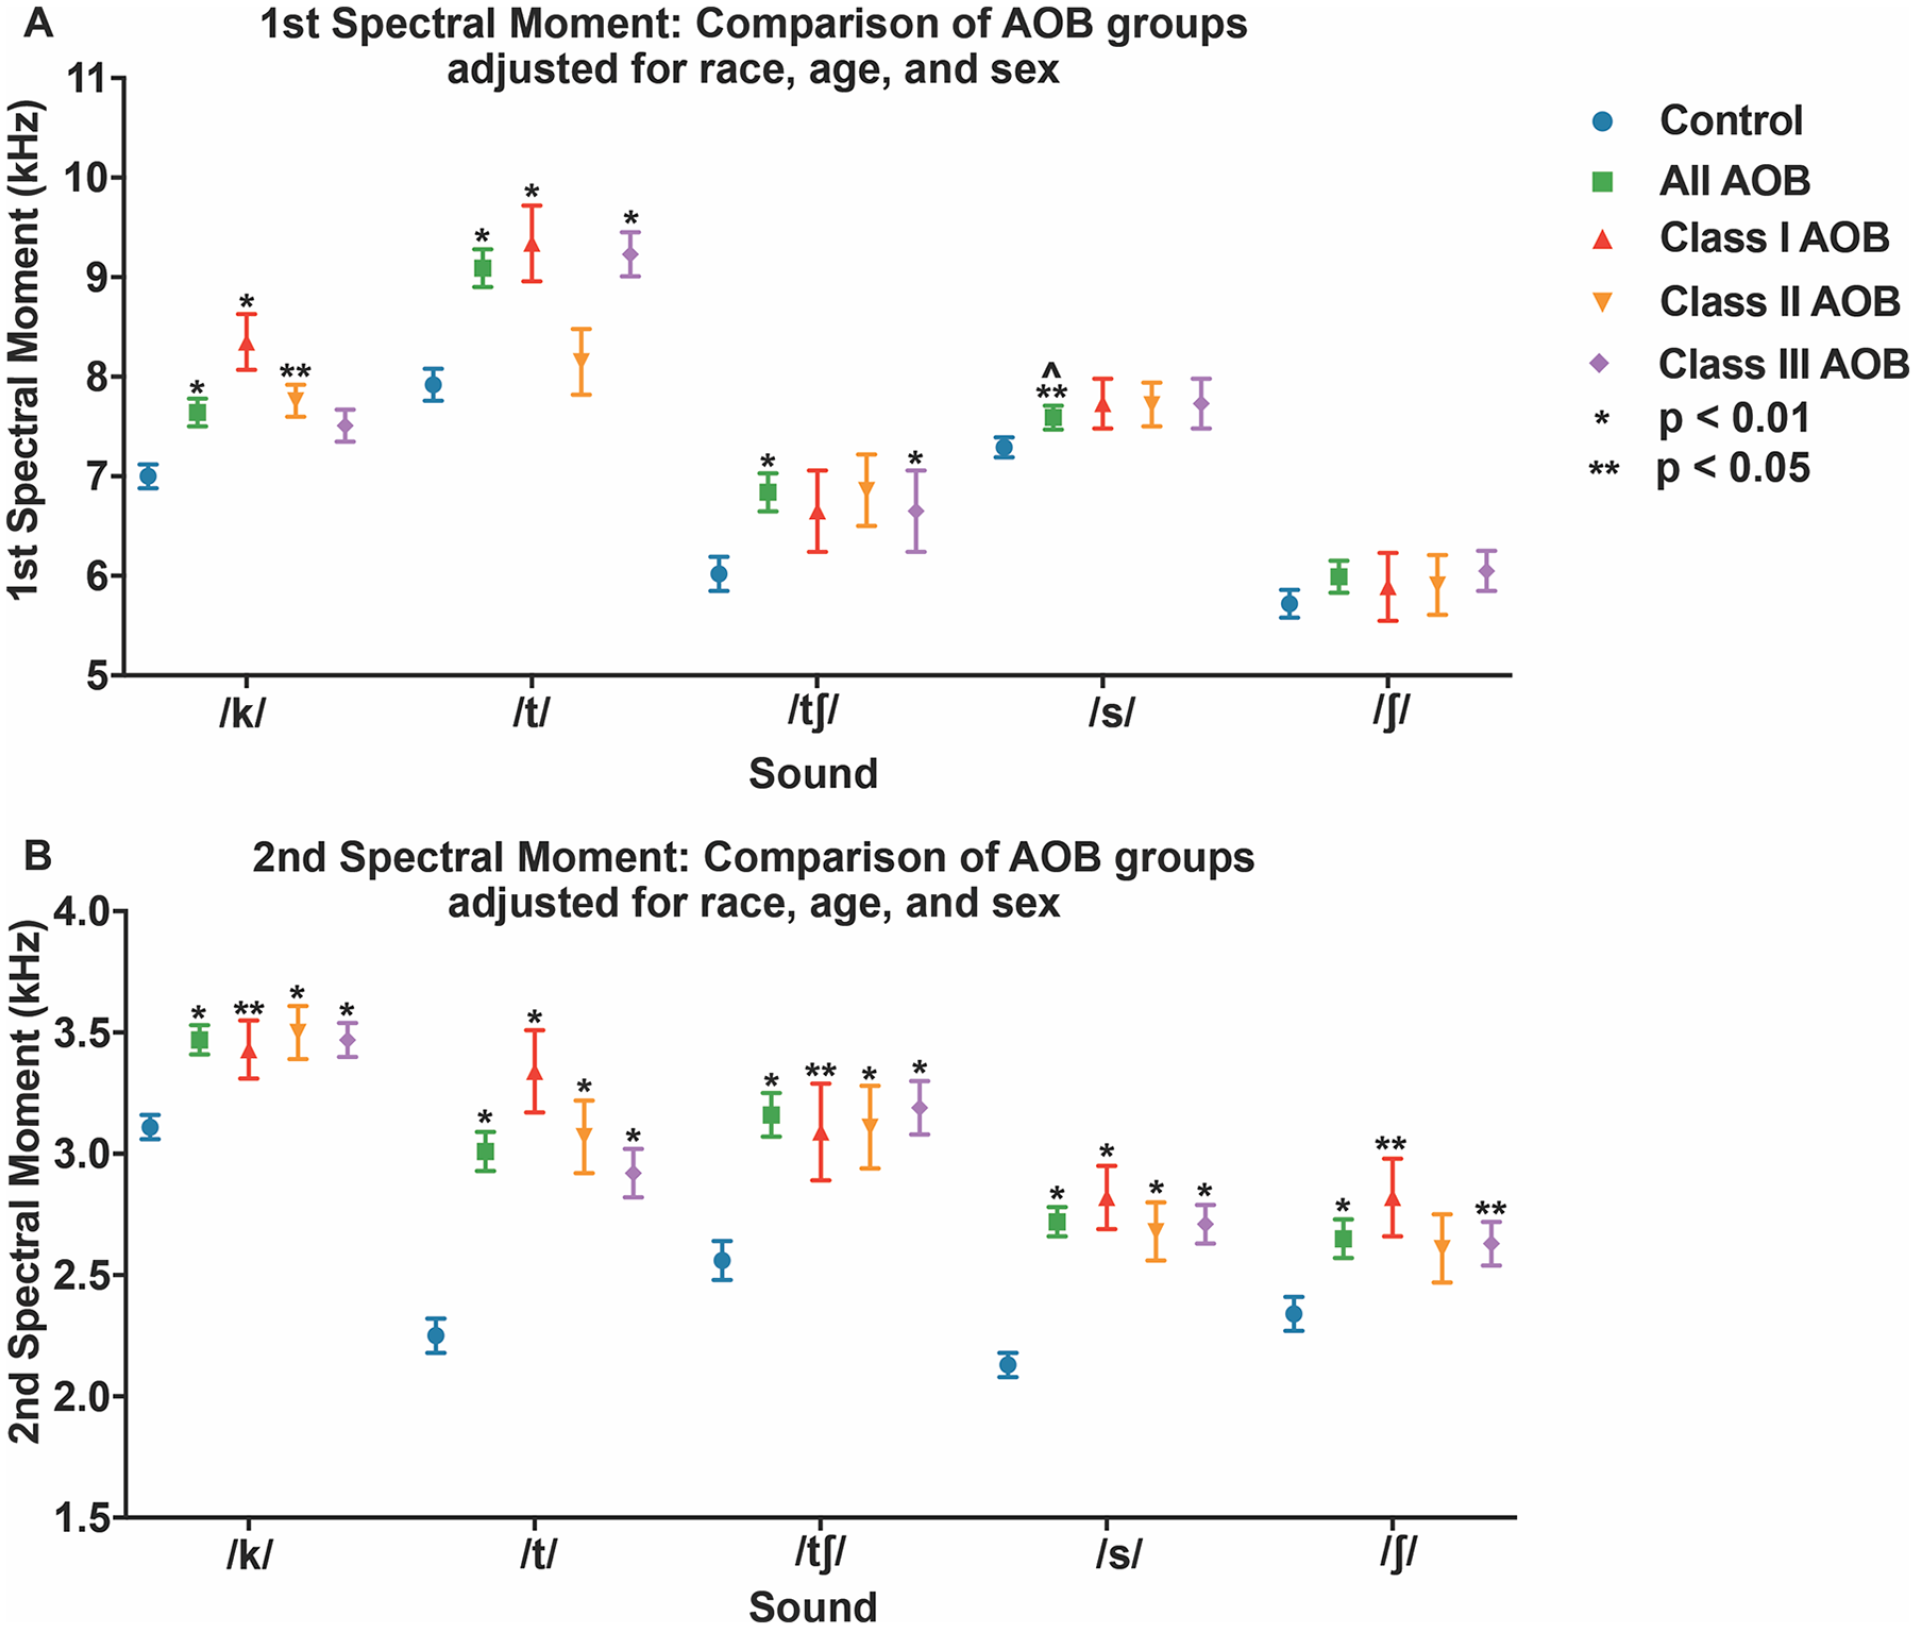
First and second spectral moments for patients with AOB DFD and Class I controls. (A) First Spectral Moment (M1, Mean Frequency) by sound. (B) Second spectral moment (M2, standard deviation = variance) by sound. Blue circle: Class I controls with positive overbite. Green square: “All AOB” DFD patients with negative overbite. Red triangle: Class I AOB DFD patients. Orange upside down triangle: Class II AOB DFD patients. Purple diamond: Class III AOB DFD patients. Bars represent standard deviation. Conventions: *p < 0.01 significant by Bonferonni adjustment. **p < 0.05. ^individual comparison has significance but no type III group significance (p > 0.05).
Spectral Moment Analysis by Cohort
When evaluating quantitatively, there are significant differences in the first spectral moment (M1) between AOB patients and reference subjects for 4 consonants (/k/, /t/, /tʃ/, and /s/); AOB subjects demonstrate a higher mean frequency, with and without adjustments for age, race, and sex covariates (P < .0001 for /k/, /t/, and /tʃ/; P = .03 for /s/) (Figures 3 and 4).
When stratified by anterior-posterior (AP) discrepancy, the Class I AOB group, with and without adjustments, demonstrated significant differences in M1 relative to controls for 2 consonants—/k/ (P < .0001) and /t/ (P = .0007 unadjusted (UA), P = .0005 adjusted (A)) (Figures 3 and 4). Significant differences in M1 were seen in the Class II AOB group for the /k/ consonant (P = .047UA, P = .04A), and in the Class III AOB group for 3 consonants—/k/ (p = .04), /t/ (P < .0001), and /tʃ/ (P < .0001), when unadjusted, and only 2 consonants—/t/ (P < .0001) and /tʃ/ (P < .005), with adjustments (Figures 3 and 4). The “all AOB” group demonstrated significant changes in the M1 of /t/, /k/, /tʃ/, and /s/, while some AP subgroups did not (Figure 3), likely due to the “all AOB” group having sufficient power to discern smaller differences.
All 5 consonant sounds were significantly different between the “all AOB” and reference cohorts for the second spectral moment (M2, spectral spread), with “all AOB” subjects having a higher spectral spread with and without covariate adjustments (P < .0001 for all except /ʃ/ P = .0002A) (Figures 3 and 4). When stratified by AP, the Class I and Class III AOB group demonstrated significant differences in spectral spread for all consonants relative to controls. The Class II AOB group demonstrated significant differences in M2 for 4 consonants—/k/ (P = .0003UA, P = .002A), /t/ (P < .0001), /s/ (P = .0002UA, P = .009A), and /tʃ/ (P < .0001), all except /ʃ/ (Figures 3 and 4).
There were minimal differences in the third spectral moment (M3) between the “all AOB” and reference groups. The only difference noted was in the Class III AOB subgroup for the /t/ (P = .02UA, P = .008A) and /tʃ/ (P = .005UA, P = .09A) sounds (Supplemental Figure 1). When comparing “all AOB” to reference, kurtosis (M4) was significantly different for 3 sounds—/t/ (P < .0001), /s/ (P = .0001UA, P = .0005A), and /tʃ/ (P = .0001UA, P = .002A)—with the AOB spectra being less peaked than the controls (Supplemental Figure 1). The Class I subgroup demonstrated significant differences in M4 for 2 consonants—/t/ (P = .003UA, P = .001A) and /s/ (P = .03A), while the Class II subgroup demonstrated no significant differences. The Class III subgroup’s M4 data are different for 3 of the consonants—/t/ (P = .02UA, P = .008A), /s/ (P = .002UA, P = .02A), and /tʃ/ (P = .004UA, P = .046A) (Supplemental Figure 1). For the third and fourth spectral moments, adjusted data are similar to the unadjusted data, with exceptions only for the /tʃ/ sound in M3 data of Class III AOB patients and the /s/ sound in M4 data of the Class I AOB subgroup (Supplemental Figure 2). Adjustments for race, age, and sex had slight impacts on all 4 spectral moments, suggesting they have minor influence on speech sounds, consistent with the literature. 10
Relationships Between Spectral Moments and Occlusal and Cephalometric Measurements
Retraced cephalograms revealed high intra-examiner concordance correlations, with values ranging from 0.926 to 0.997 (Supplemental Table 3). Regression analysis of spectral moments relative to cephalometric measurements revealed significant relationships, where the /t/ and /k/ sounds’ centroid frequency (M1) and spectral spread (M2) varied linearly with cephalometric measurements. Mandibular plane angle (MPA) was evaluated with Frankfort Mandibular Angle (FMA) and Sella-Nasion-Gonion-Gnathion (Sn-GoGn); as these angles increase, overbite tends to decrease vertically and the AP relationship becomes more Class II, with the mandible rotating downwards and backwards (Figure 5). 31 A linear relationship exists between SN-GoGn and the centroid frequency (M1) of the /t/ sound (P = .0049), such that as the mandibular plane increases with enlargement of the anterior mouth opening, M1 decreases (Figure 6). For the second spectral moment (M2), a linear relationship was found between Sn-GoGn and M2 of the /k/ sound (P = .0458), and between FMA and M2 of the /k/ (P = .0113) and /t/ (P = .0033) sounds (Figure 6). These indicate that as the MPA increases, resulting in a hyperdivergent presentation with a more Class II jaw relationship, the spectral spread (M2) of /k/ and /t/ increases. 32
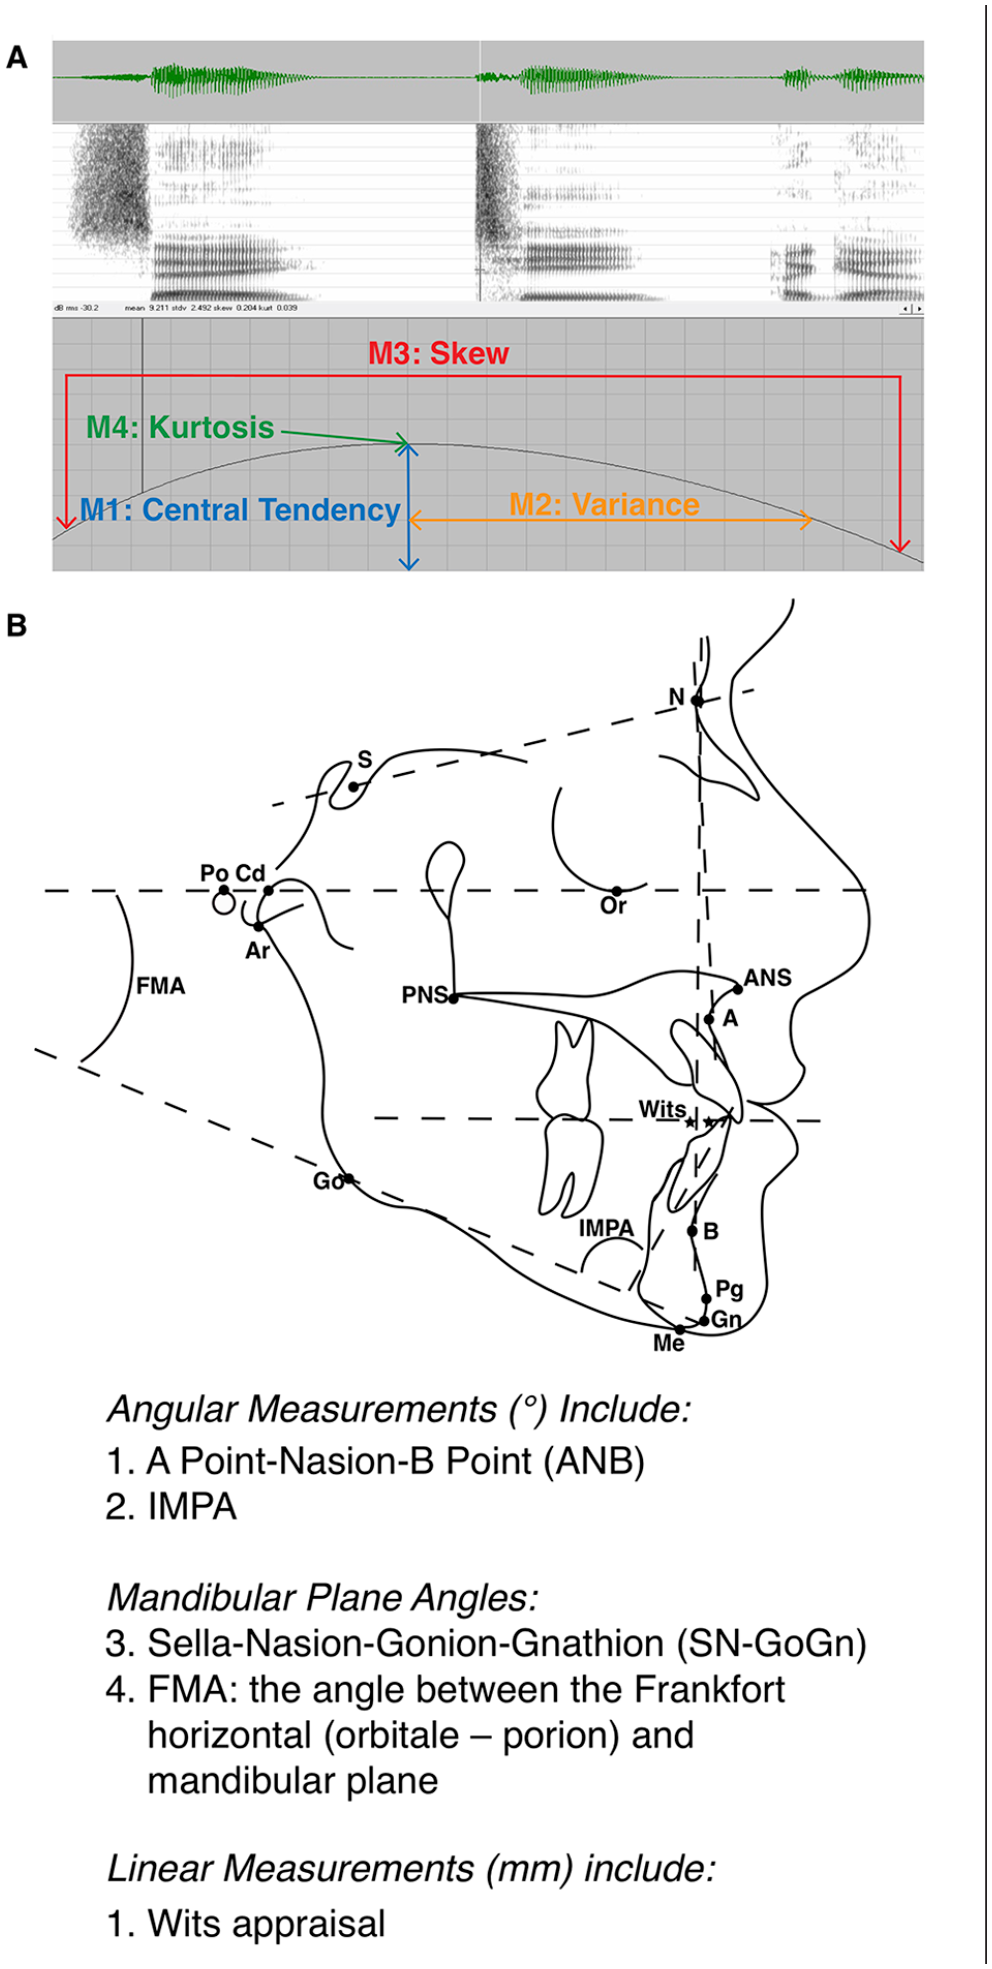
Spectral moment and cephalometric measurements. (A) Spectrogram of a sound wave demonstrating the 4 spectral moments. The first spectral moment is the centroid or central tendency (eg, center of gravity) and is the mean frequency of the sound energy (M1, measured in kHz).23,24 The second moment (M2, measured in kHz) is the spectral spread (variance, standard deviation) of sound energy; it indicates the spectral spread over which the sound energy is distributed.23,24 The third spectral moment is the tilt, or skewness of the sound energy curve (M3, unitless value). And the fourth spectral moment is the kurtosis, or peakedness, of the energy concentration (M4, unitless value). (B) Cephalometric analyses used to evaluate anterior-posterior and vertical positions of the craniofacial skeleton.
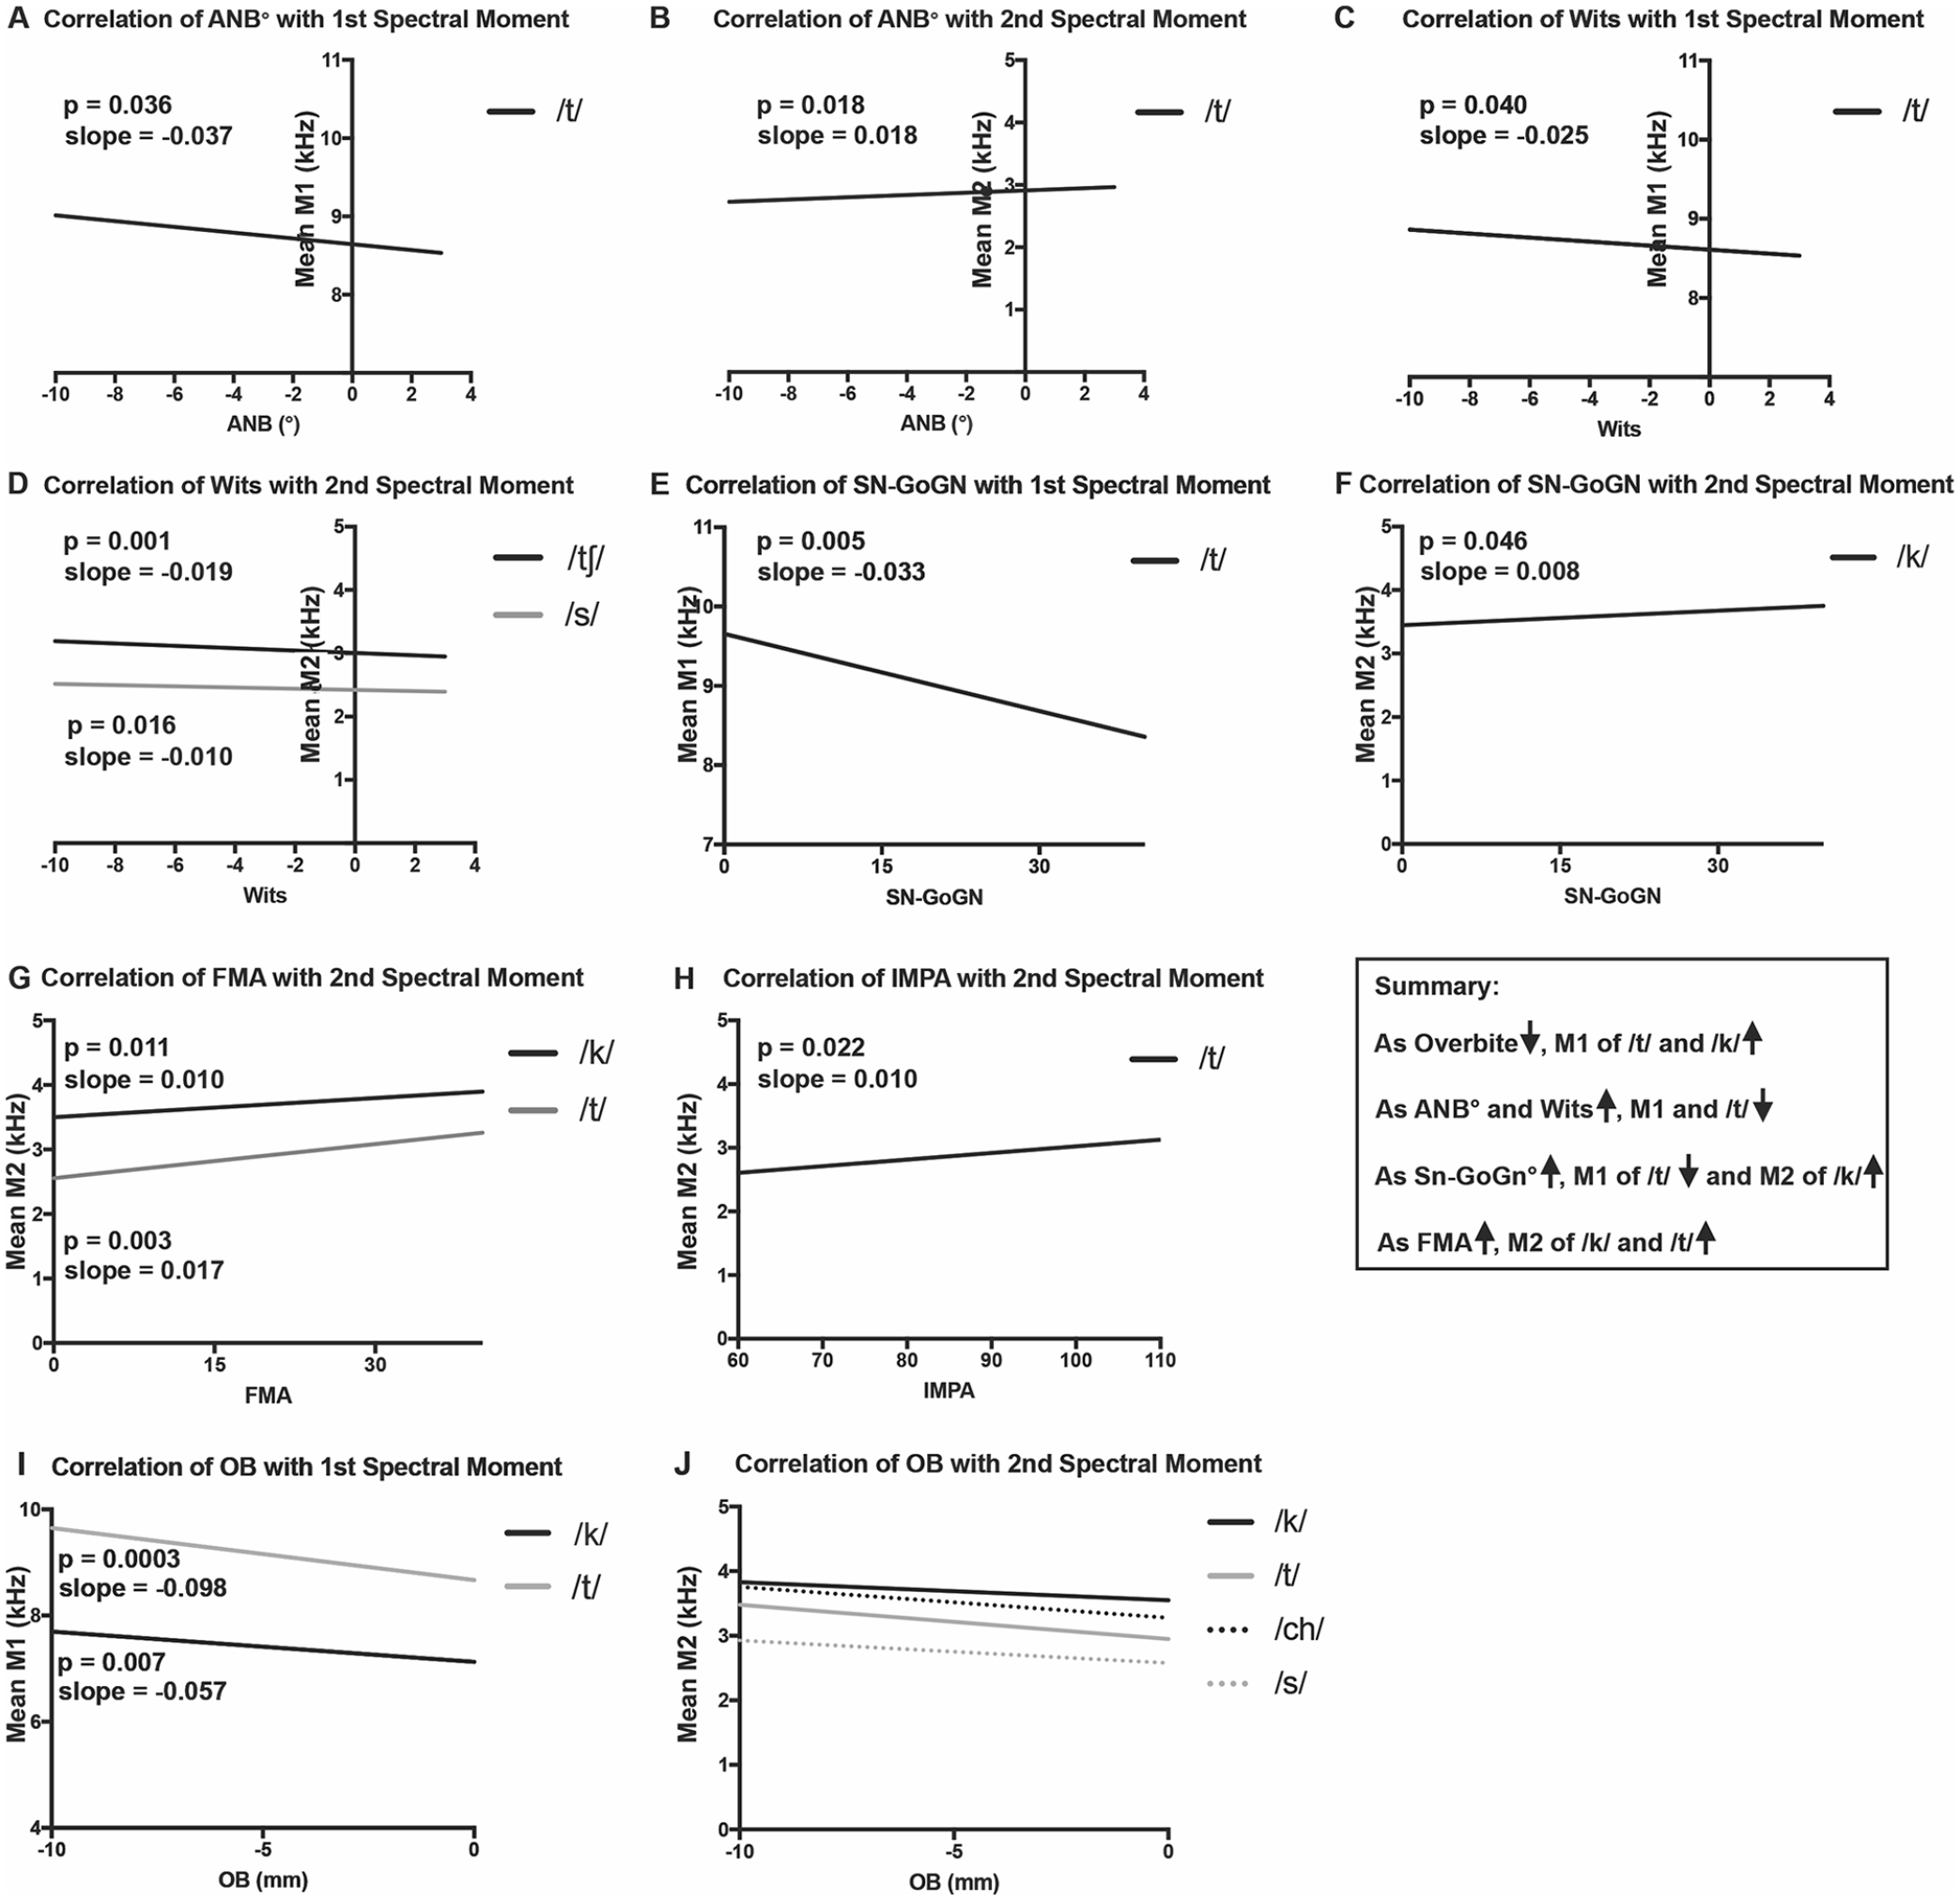
Regression plots of significant linear trends for patients with DFD and Class I controls, adjusted for race, sex, and age. Spectral Moments from DFD patients (Class II, III, and/or AOB) and controls plotted as a function of cephalometric and occlusal measures, for all relationships that are statistically significant (P < .05). (A) Correlation of ANB with the first spectral moment (M1). (B) Correlation of ANB with the second spectral moment (M2). (C) Correlation of Wits with M1. (D) Correlation of Wits with M2. (E) Correlation of SN-GoGn with M1. (F) Correlation of Sn-Go-Gn with M2. (G) Correlation of FMA with M2. (H) Correlation of IMPA with M2. (I) Correlation of Overbite (OB) with M1. (J) Correlation of OB with M2. P values and linear slopes are specified on the graphs for (A-I) For (J), consonant values follow (P value, Slope): /k/ (0.0072, −0.01877), /t/ (0.0377, −0.01823), /ch/ (<0.0001, −0.02387), /s/ (0.0001, −0.02387), /sh/ (0.0049, −0.01927).
Anterior-posterior (AP) skeletal relationships were evaluated using the ANB angle and Wits appraisal. As ANB and Wits increase, the AP relationship becomes more Class II or equivalently, less Class III (Figure 6), and M1 decreases linearly for the /t/ sound (P = .0395 Wits, P = 0.0359 ANB). 31 As a patient becomes more Class II by Wits appraisal and ANB angle, the mean frequency of M1 decreases, normalizing toward controls.
In analyzing the linear relationships between overbite and M1 of the 5 consonants, an inverse relationship exists: each sound exhibits a decreasing M1 as the overbite increases. Thus, the greater the magnitude of the AOB, the higher the frequency of M1. For the /t/ and /k/ sounds, these linear relationships were significant (P = .0003 /t/, P = .007 /k/) (Figure 6).
Discussion
We sought to understand speech distortions in our DFD surgical patients, as speech is critical for quality of life, communication, and professional success; therefore, it is important that orthodontists and surgeons understand why speech distortions appear in 80% to 90% of our orthognathic surgical candidates.8,9,12,28,33 To learn if orthodontists and oral surgeons can positively impact speech through treatment, we first need to characterize the presentation of speech abnormalities in DFD patients and how articulation errors correlate with malocclusion severity, using quantitative SMA and perceptual evaluations. Our study is the first to show that SMA data from the “all AOB” group demonstrate increases in the first spectral moment for /k/, /t/, /tʃ/, and /s/ consonants relative to the controls. In cohorts with potentially confounding AP components (Class II and Class III AOB), M1 was significantly higher for only 1 or 2 consonants in each cohort (Class II AOB: /k/; Class III AOB: /t/ and /tʃ/) (Figure 4). These differences in spectral measures between “all AOB,” Class II AOB and Class III AOB cohorts may demonstrate an AP-vertical interaction. Alternatively, the reduction in consonants demonstrating significant differences between the “all AOB” cohort and the AP subgroups may be a result of reduced sample size and, therefore, power. As the only known study to quantify AOB DFD patients’ speech and malocclusions using SMA paired with cephalometric measures, we are continuing to collect and analyze patients’ data for refinement of results with greater sample sizes.
The centroid frequency (M1) is affected by several factors including “lip rounding.” 34 Lip rounding is known to impact the size of the anterior mouth opening, with less rounding associated with a higher frequency of consonants. 34 The anterior mouth opening is also likely larger in AOB patients due to negative overbite and elevated mandibular plane angle (Figure 1). 34 This larger opening is acoustically similar to less lip rounding, which could contribute to increased M1 centroid frequency in consonants produced by DFD patients (Figures 3 and 4). 34 AOB subjects also produce consonants with energy that is spread over a wider range of frequencies than controls (ie, larger M2 spectral spread). This increased spectral spread may be due to the larger anterior mouth opening and the larger range of overbite seen in AOB malocclusions (OB Range: −0.5 to −10 mm for AOB; 2-3 mm for Controls, Supplemental Table 2) and the absence of a prominent low-frequency spectral peak. Reference subjects had a narrower range of (positive) overbites and, therefore, a more uniform, smaller anterior oral cavity size across subjects, leading to lower spectral spread (M2) than AOB subjects (Figures 3 and 4).
Regression analysis revealed linear relationships for several cephalometric measures and M1 of the /t/ sound including: MPA (SN-GoGn, Steiner analysis), ANB angle, and Wits appraisal. An increase in each cephalometric measurement (MPA, ANB angle, and Wits) was related to a linear decrease in M1 for /t/ (Figures 5 and 6). Interestingly, an increase in MPA, ANB, and Wits indicates a more Class II skeletal profile or less Class III profile, suggesting that as patients become more Class II, M1 for /t/ linearly decreases, normalizing toward controls. 31 Consistent with this, all AOB subgroups demonstrate a significant increase in M1 frequency for /t/ except for Class II AOB (Figures 3 and 4). This suggests that the Class II AP component has a compensatory effect on the /t/ centroid frequency (M1), such that it normalizes relative to other consonants and AOB anterior-posterior (AP) subgroups.
Our finding that the M2 spectral spread of /k/ and /t/ increased with rising MPA (SN-GoGn and FMA) could be due to the more Class II relationship associated with elevated MPA, where the mandible is rotated down and back (Figures 5 and 6). Skeletal Class II patients may posture into a “Sunday bite” (mandible forward), and therefore could display a range of habitual jaw postures and false occlusions, contributing to increased speech variance for /k/ and /t/. 31 Thus, a higher spectral spread may be seen due to variation in Class II compensatory movements seen in patients with elevated vertical dimension (eg, increased MPA; hyperdivergent profile).
An AOB malocclusion is the most common DFD phenotype associated with sound distortions.10,20,35 Most studies use perceptual evaluations with a dichotomous outcome, where a distortion is either present or absent.14,20,36 Our perceptual findings are consistent with these studies, with a multi-fold higher prevalence of auditory and visual distortions in the AOB cohort compared to controls (Figure 2).8 -10 However, quantitative data from a non-growing cohort, with cephalometrics to evaluate skeletal discrepancy, is important to understand how severity of DFD correlates with speech and to identify mechanisms of distortion. 10 Many studies also pool DFD phenotypes into 1 cohort, which is methodologically flawed; mechanisms underlying distortions associated with AP disharmonies may differ from vertical issues, as the anatomical disproportions are distinct.2,28 Our subgroup data are consistent with this theory.
While novel in many regards, this study is not without limitations. Demographic features of the DFD and reference groups are as closely matched as feasible but have differences. For example, the control sample was not one-for-one matched for age, resulting in a slightly older control cohort. There were few differences between adjusted and unadjusted data, indicating that race, age, and sex only slightly impact SMA values, consistent with other studies (Figures 3 and 4). 10 More DFD patients presented with fixed appliances than controls, but this is unlikely to be a confounding variable as patients were bonded more than 1 month prior to their study visit. Patients show no difference in speech articulation after rapidly adapting within weeks to labial bonded brackets and readapting after removal.37,38 A bigger AOB sample would have provided for enlarged AP subgroups and greater statistical power to discern differences in spectral moment shifts between Class I, II, and III AOB DFD patients. Our perceptual analysis was performed live during the DFD clinical visit by an SLP, precluding us from calculating an intra-examiner reliability; however our SLP has decades of experience as a clinical evaluator and speech researcher. The nature of the study limits our understanding of articulation problems in AOB patients to only 1 point in time. The question of whether treatment with orthodontics and orthognathic surgery leads to temporary or lasting correction of speech requires longitudinal, post-op follow-up that we are pursuing.
Understanding key principles of speech pathology and its presentation in DFD patients is clinically relevant to maxillofacial surgeons and orthodontists, as we are often managing care for AOB and Class III patients for a decade or longer during development. Oral surgeons and orthodontists are uniquely qualified to evaluate malocclusion severity and detect speech issues for appropriate SLP referral. In growing children, where interceptive orthodontics may correct open bites and Class III underbites, a combination of orthodontics and speech therapy may resolve both the malocclusion and speech issues. Interdisciplinary management of non-growing DFD patients by orthodontists, speech clinicians, and oral surgeons is likely necessary for speech improvement, following malocclusion correction. Having a working knowledge of speech pathology associated with DFDs will allow maxillofacial surgery and orthodontic providers to screen for articulation errors, answer patient questions, and guide appropriate interdisciplinary care at all ages. This may represent an opportunity for oral surgeons and orthodontists to expand our impact in overall health, development, and function.
This is the first study to apply SMA to quantitatively characterize speech in a sizable AOB DFD population. Using SMA, the degree of sound distortion was quantitatively related to the severity of open bite (Figure 6). Our findings point to a higher centroid frequency (M1) and spectral spread (M2) of consonants in the AOB population. We also identified linear relationships between M1 and M2 measures of /t/ and /k/ and changes in mandibular plane angle and occlusal measurements. Increased severity of AOB skeletal discrepancies correlated with more profound speech distortions. These data also offer insight into speech mechanisms, where a larger anterior mouth opening with less overbite and a steeper mandibular plane angle, may contribute to DFD patients’ articulation issues. Findings also indicate that orthodontists and oral surgeons could play an important role in interdisciplinary management and screening of DFD patients for articulation issues, as most AOB patients display perceptual speech distortions and therefore could benefit from SLP referral (Figure 2). Evidence of a quantitative relationship between jaw disproportion and speech distortion suggests causation and provides insight to fundamental mechanisms of speech.
Conclusions
A higher prevalence of auditory distortons (especially on /s/) and visual speech distortions exist in AOB DFD patients compared to controls.
Significant differences exist in the consonant spectral moments between the AOB DFD population and the controls.
Severity of skeletal AOB DFD is linearly correlated with the degree of speech distortion for certain consonants.
Supplemental Material
sj-docx-1-fac-10.1177_27325016221082229 – Supplemental material for Impacts of Skeletal Anterior Open Bite Malocclusion on Speech
Supplemental material, sj-docx-1-fac-10.1177_27325016221082229 for Impacts of Skeletal Anterior Open Bite Malocclusion on Speech by Mary Morgan Bitler Keyser, Hillary Lathrop, Samantha Jhingree, Natalie Giduz, Clare Bocklage, Sandrine Couldwell, Steven Oliver, Kevin Moss, Sylvia Frazier-Bowers, Ceib Phillips, Timothy Turvey, George Blakey, Ray White, David Zajac, Jeff Mielke and Laura Anne Jacox in FACE
Footnotes
Acknowledgements
We would like to thank all of our participants for their time and engagement with this study. We are thankful for the UNC Oral and Maxillofacial Surgery group for their collaboratory input, collegial spirit, and for allowing us to access their patients and clinics. We appreciate the support and expertise of S.T. Phillips in the UNC Clinical Research Unit (Go Health). We are grateful for the feedback and encouragement from Dr. Ching-Chang Ko.
Author Contributions
Mary Morgan Bitler Keyser—CRediT: Investigation, resources, data curation, writing—original draft, writing—review and editing, visualization, funding acquisition. M.B.K. organized our Monday morning Dentofacial Disharmony speech clinics and was instrumental in data collection with S.J. She assisted with patient recruitment, figure assembly, manuscript preparation. She was the lead author for this paper and managed the majority of original draft writing and editing with L.J. Hillary Lathrop—CRediT: Conceptualization, methodology, formal analysis, investigation, data curation, writing—original draft, visualization, supervision, project administration, funding acquisition. H.L. with L.J., J.M., and D.Z. proposed the research project and associated aims. L.J. and H.L. set up and optimized data collection and analysis methods including statistics with K.M., trained staff, and supervised the project. H.L., M.B.K., and L.J. revised the manuscript, with input from all authors. Samantha Jhingree—CRediT: Formal analysis, resources, investigation, data curation. S.J. quantitatively analyzed patient recordings using spectral moment analysis and assisted M.B.K. in data collection on Monday mornings. She assisted with patient coordination, enrollment, and data entry. Natalie Giduz—CRediT: Formal analysis, investigation, data curation. N.G. quantitatively analyzed patient recordings using spectral moment analysis. She assisted with enrollment of control/reference subjects. Clare Bocklage—CRediT: Writing—review and editing, visualization, data curation. C.B. participated in manuscript revision and figure creation. Sandrine Couldwell—CRediT: Data curation, resources, investigation. S.C. assisted with patient coordination, enrollment, and data collection from patients. She also entered patient data and maintained our database. Steven Oliver—CRediT: Investigation, writing—review and editing. S.O. assisted with manuscript writing and revision. Kevin Moss—CRediT: Formal analysis. K.M. consulted on and performed all statistical analyses. Sylvia Frazier-Bowers—CRediT: Writing—review and editing. S.F.B. provided helpful revision comments on this manuscript. Ceib Phillips—CRediT: Methodology, validation. C.P. consulted on study design. Timothy Turvey—CRediT: Methodology, resources. T.T. advised on study design and assisted with patient recruitment and enrollment through his oral surgery clinic. George Blakey—CRediT: Resources. G.B. assisted with patient recruitment and enrollment through his oral surgery clinic. Ray White—CRediT: Methodology, writing—review and editing. R.W. assisted with input on study design and manuscript revisions. Jeff Mielke—CRediT: Methodology, writing—review and editing. J.M. worked with L.J., H.L., and D.Z. on study design. He provided helpful revision comments on this manuscript. David Zajac—CRediT: Methodology, validation, investigation, resources, writing—review and editing. D.Z. worked with L.J., H.L., and J.M. on study design. He provided perceptual evaluations of participants’ speech and offered revision comments on this manuscript. Laura Jacox—CRediT: Conceptualization, methodology, investigation, resources, data curation, writing—original draft, writing—review and editing, visualization, supervision, project administration, funding acquisition. L.J. with H.L., J.M., and D.Z. proposed the research project and associated aims. L.J. and H.L. set up and optimized data collection and analysis methods including statistics with K.M., trained staff, and supervised the project. M.B.K. and L.J. wrote the manuscript, with input from all authors.
Declaration of Conflicting Interests
The author(s) declared no potential conflicts of interest with respect to the research, authorship, and/or publication of this article.
Funding
The author(s) disclosed receipt of the following financial support for the research, authorship, and/or publication of this article: This research was supported by the American Association of Orthodontics Research Aid Award (to MMBK) and the Postdoctoral Fellowship Award (to LAJ). Additionally, this work was supported by the Oral and Maxillofacial Surgery Foundation Research Support Grant (to LAJ). Finally, the project described was supported by the National Center for Advancing Translational Sciences (NCATS), National Institutes of Health (NIH), through Grant Award Number UL1TR002489 (to LAJ and HEL) and by the National Institutes of Dental and Craniofacial Research (NIDCR), NIH through a K08 award (to LAJ), with a Grant Award Number 1K08DE030235-01A1. The content is solely the responsibility of the authors and does not necessarily represent the official views of the NIH.
Data Availability Statement
The data that support the findings are included in the supplemental materials. Any further information is available from the corresponding author, upon reasonable request..
Supplemental Material
Supplemental material for this article is available online.
References
Supplementary Material
Please find the following supplemental material available below.
For Open Access articles published under a Creative Commons License, all supplemental material carries the same license as the article it is associated with.
For non-Open Access articles published, all supplemental material carries a non-exclusive license, and permission requests for re-use of supplemental material or any part of supplemental material shall be sent directly to the copyright owner as specified in the copyright notice associated with the article.