
Abstract
Previous research has identified five stable profiles in the 100-item HEXACO-PI-R. However, many researchers prefer to use the shorter 60-item HEXACO-PI-R. In this study we successfully identify a unified 5-profile solution across the 60- and 100-item measures of the HEXACO across four large samples totaling nearly 370,000 participants. However, our analyses with a holdout sample (n ≈ 10,000) indicate that the ability to independently reproduce this solution with the 60-item measure decays rapidly beginning as early as sample sizes of n = 1250, which is larger than the sample size needed for the 100-item version. To address this issue, we developed a Tutorial which includes a step-by-step methodological guide and syntax for researchers to help identify these seemingly robust personality profiles within their own data. This enables researchers to side-step this methodological hurdle in their own work and ask independent and substantive questions about the nature and implications of these personality profiles. In doing so we aim to facilitate the advancement of research on the recoverability, generalizability, understanding and utility of these five personality profiles. Finally, we provide a procedural demonstration using this tutorial with a small archival sample that includes an analysis comparing the profiles on an auxiliary variable of potential interest.
Researchers have become increasingly interested in taking a person-centered approach to the study of personality traits (Daljeet et al., 2017; Espinoza et al., 2020; Kerber et al., 2021; Nguyen, 2021; Yin et al., 2021). The objective of this approach is to identify meaningful differences in the ways that personality traits combine to form profiles, and how these profiles relate to other variables. Focusing on profiles rather than individual traits allows for the possibility that any given trait (e.g., extraversion) might relate differently with other variables depending on the relative strength of other traits in the profile. A key assumption underlying this approach is that there exists a limited number of meaningful profiles, each characterizing different unidentified subpopulations within the general population.
This assumption is challenged by studies of two dominant models of personality, the Five-Factor model (Digman, 1990) and the HEXACO model (Lee & Ashton, 2018), which find inconsistent profile structures even within analyses of the same model (Daljeet et al., 2017; Espinoza et al., 2020; Gerlach et al., 2018; Herzberg & Roth, 2006). This situation makes it difficult to compare findings across studies. A potential solution to this problem is to identify a robust profile structure within very large ‘population-like’ samples, and to use the parameters identified in these data to reproduce the ‘population-level’ profiles in small samples (Espinoza et al., 2020).
The issue of inconsistencies in profile structure attributable to small samples in personality profile research was investigated by Espinoza et al. (2020) using the HEXACO model of personality. The HEXACO model is a lexically-derived six-factor model that builds on the foundations of five-factor models (e.g., Digman, 1990) and recognizes Honesty-Humility as a sixth core personality trait in addition to Emotionality, Extraversion, Agreeableness, Conscientiousness and Openness to Experience (Ashton & Lee, 2007; Lee & Ashton, 2018). Using what they propose is a combined, population-like sample of over 370,000 respondents to the 100-item measure of HEXACO, Espinoza et al. (2020) found that a 5-profile solution fit the data best, and that this 5-profile solution could be consistently identified across subsamples of various sizes (N = 10,000–750). These findings provide some evidence that the difficulties in identifying the same profiles across samples in previous research may have been partly the result of insufficient sample sizes. Critically, they note that successful profile recovery became increasingly difficult with samples of n < 750, which are typical of sample sizes used in personality research.
The five HEXACO profiles identified in this work are: Achievement-Oriented Agentic (characterized by slightly above-average extraversion, above-average conscientiousness and below-average honesty–humility, emotionality and agreeableness), Ego-Oriented Agentic (above-average extraversion, slightly above-average conscientiousness and openness, slightly below-average agreeableness, and below-average honesty–humility and emotionality), Insecure (well-below-average honesty–humility, extraversion, agreeableness, conscientiousness and openness, and above-average emotionality), Communal (characterized by above-average honesty–humility and emotionality, slightly below-average agreeableness, conscientiousness and openness, and below-average extraversion), and Socially Adjusted (characterized by well-above-average honesty–humility and agreeableness, above-average extraversion, conscientiousness and openness, and slightly below-average emotionality). Preliminary interpretation of the profiles, and the assigned labels, were guided by agency-communion theory (Balkan, 1966), attachment theory (Bowlby, 1969), and the clustering of HEXACO traits according to an altruistic-social versus task focus (Ashton & Lee, 2001).
To encourage further investigation involving these profiles, Espinoza et al. (2020) provided the parameters obtained in their study. They argued that sharing the parameters for the personality profiles would allow researchers to reanalyze and leverage existing, or new, data sets to investigate the profiles without requiring that they go through the process of exploratory factor analysis and LPA and potentially arrive at unstable profile solutions that may not replicate in future research. Importantly, however, the parameters shared by Espinoza et al. were obtained using the 100-item version of the measure. Many researchers use the shorter 60-item version. Although the 60 items are embedded in the 100-item version (Lee & Ashton, 2018), there are no guarantees that the same profiles will emerge in the shorter version and/or that item parameters obtained for the 60 items will be the same when analyzed on their own.
In the present research, we adapt the procedures used by Espinoza et al. (2020) to investigate whether it is possible to identify the same profile structure using the 60-item version of the HEXACO-PI-R 1 . We similarly examine the recoverability of the optimal profile solution in increasingly smaller samples but using the HEXACO-60. Finally, and importantly, we extend previous research by providing a Tutorial in the form of a step-by-step guide, including syntax, for determining the appropriateness of applying the large-sample parameters for profiles identified using the HEXACO-60 to other samples, including those that may differ in sample size or in meaningful ways from the general population. This resource 2 concludes with a demonstration of how this guide might be applied using an archival data set. In sum, our objective is to facilitate the advancement of research on the understanding, generalizability, and utility of the personality profiles within the HEXACO model.
Establishing the Optimal Profile Structure for the HEXACO-60
As noted previously, although the 60- and 100-item versions of the HEXACO measure are similar, there are sufficient differences such that it cannot be assumed that the same profiles will necessarily replicate across versions. Most notably, the two measures differ in (a) the number of items used to measure traits and (b) the inclusion of an interstitial scale for Altruism in the 100-item version, which contributes to Honesty-Humility, Emotionality, and Agreeableness (Ashton & Lee, 2009). These differences might have implications for the number and structure of the profiles that are recovered from each version.
The 60-item measure of the HEXACO (Ashton & Lee, 2009) comprises a subset of the items found in the 100-item version (Lee & Ashton, 2018) and assesses each trait with 10 rather than 16 items. Fewer items per subscale could have implications for the content coverage of each trait and engender differences in the reliability of the shorter version of the measure (Credé et al., 2012). However, according to the authors of the HEXACO-PI-R, the mean convergent correlation between the 100- and 60-item versions of the HEXACO-PI-R is .95, suggesting any differences in content validity may be small. Moreover, large-scale studies indicate that the average difference in reliability across the 60- and 100-item versions of the measure may be as little as Δα = .10 (Lee & Ashton, 2018). Nevertheless, considering the structural differences, it is difficult to determine a priori what effect the differences might have on profile structure across the two versions.
The replicability of a profile solution over time or across samples is essential to establishing its validity (Morin et al., 2020). We propose that replicability across measures of the same constructs is also critical. Accordingly, an essential first step in this research was to determine whether the same five profiles identified with the 100-item HEXACO can be identified in the 60-item HEXACO-PI-R:
Importantly, previous research on personality profiles has raised the issue of whether the use of small samples can have implications for the recoverability of profiles (Herzberg & Roth, 2006). As previously noted, Espinoza et al. (2020) demonstrated they could not adequately recover the optimal 5-profile solution with < 750 participants using the HEXACO-100. Given the differences between the 60- and 100-item measures, we believe it is important to revisit the issue of sample size and recoverability and ask the following research question:
Methods
Participants
For this study, we obtained access to the same large dataset collected by Lee and Ashton (2018) and used by Espinoza et al. (2020). This dataset was collected online by the original authors of the HEXACO measures between 2014 and 2018. Importantly, consistent with best practice recommendations (see Ward & Meade, 2023) only participants who successfully completed three directed response style attention check items (e.g., please respond ‘neutral’ to this item) and did not present aberrant response patterns (long string, or random responding) were included in the dataset we received for analyses. Additional information regarding data collection, and the psychometric properties of the HEXACO-PI-R are reported in Lee and Ashton (2018). The data that support the findings of this study were obtained directly from Dr. Kibeom Lee and Dr. Michael Ashton. Interested parties should contact Drs. Lee and Ashton for access to these data.
A total of 370,857 participants were included in the dataset, and they had been partitioned into 4 samples of ∼90,000, referred to here as samples S90.1, S90.2, S90.3, and S90.4 (cf. Espinoza et al., 2020). The sample size was not determined a priori, and the entirety of the provided data set was used in the analyses. Men and Women made up 57.3% and 41.5% of the sample, respectively (the remainder did not indicate gender), and the average age of participants was 30.22 years old (S.D. = 12.71 years). Participants were of European descent (53.8%), Latin American (5.4%), South Asian (5.1%), East Asian (4.4%), Southeast Asian (3.5%), African (3.1%), Arab (2.1%), North or South American, or Australian Aboriginal/Native (1.3%), Pacific Islander (0.04%), and ‘Other’ (6.6%), two or more of the above (6.0%), or chose not to answer (8.4%). A substantial proportion of the sample indicated they had completed university/college (39.70%), followed by high school (28.90%), and professional or graduate school (21.1%). Additionally, 3.3% did not complete high school and 7.1% chose not to answer. Note, this study and its analyses were not pre-registered.
Measures
Personality
Personality was measured using the subset of 60 items from the 100-item HEXACO-PI-R that constitute the HEXACO-60 (Ashton & Lee, 2009). In this version of the HEXACO-60, six 10-item subscales are used to measure Honesty-Humility, Emotionality, Extraversion, Agreeableness, Conscientiousness, and Openness. Participants responded using a Likert-type scale ranging from 1 (Strongly Disagree) to 5 (Strongly Agree). The internal consistency reliability is reported to be between .73 and .80 and the authors provide evidence of its validity.
Analyses
We first conducted exploratory structural equation modeling (ESEM; Morin et al., 2013) analyses with oblique target rotation, using the items as the indicators for the six factors in the HEXACO model, for each of the four samples. We used the resulting factor scores as input for latent profile analyses (LPA) and evaluated the fit of the resulting 2- through 10-profile solutions. All analyses were conducted using the robust maximum likelihood (MLR) estimator in Mplus (version 8.0). To determine the best fitting profile solution, we examined the Akaïke Information Criterion (AIC), Consistent AIC (CAIC), Bayesian Information Criterion (BIC), and the sample-size adjusted BIC (SABIC). In large samples, these statistics are typically plotted and examined for an elbow, or ‘break’, in the values which indicates the optimal number of profiles for the data (Morin et al., 2020). We also inspected the distribution of respondents across profiles to identify small profiles that might not be robust. In accordance with recommendations by Nylund et al. (2007), we also examined the final classifications based on most likely class membership to determine whether each profile in a solution ‘contained’ at least 5% of the sample. This guideline aids in the identification of small profiles (i.e., less than 5% of the sample) which might not be robust and allows for the description of the estimated distribution of respondents across profiles. Lastly although we examined the entropy of the various solutions (see supplemental materials), consistent with best practices we do not incorporate entropy into our profile decision-making process (Daljeet et al., 2017; Lubke & Muthén, 2007).
To address Research Question 1, we compared the best fitting HEXACO-60 profile solution for each sample to the optimal 5-profile solution for the HEXACO-100. First, we conducted a visual inspection of the HEXACO-60 profiles for each sample and matched them to the corresponding profiles for the optimal HEXACO-100 solution.
Second, we calculated the average parameter deviation between the model parameters from the best-fitting profile solutions for each of our samples in relation to the model parameters from the optimal HEXACO-100 solution. Parameter deviations were calculated as the absolute difference between each trait mean in a profile in each HEXACO-60 solution and the corresponding trait mean for the matching profile in the HEXACO-100 solution. Because the profiles are estimated using factor scores, with a mean of 0 and standard deviation of 1, parameter deviations can be interpreted as the difference in standard deviations between the corresponding profiles for a given trait mean. We then calculated the average parameter deviation across all samples to index the degree to which the HEXACO-60 solutions replicated the optimal HEXACO-100 profile structure.
We determined that the HEXACO-100 solution was adequately replicated if the average parameter deviation was equal to or less than .08. This .08 guideline was established by Espinoza et al. (2020) as part of their analyses examining the replicability of their optimal HEXACO-100 profile solution. They reasoned that the average parameter deviation of .08 for their replications using large independent samples (n = ∼90,000) was sufficiently similar to the highest level of recoverability achieved in analyses testing recoverability in decreasing sample sizes. Specifically, they found that samples demonstrating high recoverability (n = 5,000–2500) had average parameter deviations of .05 to .06. Therefore, an average parameter deviation of .08 was indicative of adequate replication in independent samples. This value represents a conservative benchmark because final profile solutions in our analyses were derived using sample-specific factor scores allowing for greater potential variation. Deviations in profile structures may have been smaller had we imposed the same factor structure on the data prior to conducting LPA.
To examine the recoverability of the optimal profile solution for the HEXACO-60, we conducted analyses using a holdout sample of approximately 10,000 participants that were not included in our other analyses. This holdout sample was randomly subdivided into increasingly smaller sample sizes, generating two subsamples of 5,000 participants, four of 2,500, eight of 1,250, 13 of 750, 20 of 500, and 40 of 250. Creation of these subsamples was conducted without replacement within sample size category, such that each subsample was fully independent of all others of the same size. After the construction of the subsamples within a specific sample size category, the complete holdout sample was then resampled again for the next sample size category.
Because we were concerned with examining the recoverability of the best-fitting HEXACO-60 profile solution, we imposed the ESEM parameters from the S90.1 sample to ensure consistency across subsamples. Factor scores were then extracted and used to estimate 5-profile solutions in each subsample using the parameters for the 5-profile solution drawn from the S90.1 sample as start values. Then, we calculated parameter deviation values for the solutions in each subsample from the optimal HEXACO-60 profile solution. Parameter deviation values were then averaged within sample size category to index the recoverability of the HEXACO-60 solution in increasing smaller samples. Notably, the independent nature of the subsamples within each sample size category allows a test of the recoverability of the HEXACO-60 solution in conditions that approximate a series of independent studies. For example, the average parameter deviations values calculated with subsamples of 250 are akin to investigating the degree to which the HEXACO-60 solution was recovered from 40 independent samples using the same measure.
Results
The fit statistics for the 2- through 10-profile solutions for sample S90.1-S90.4 are depicted in Figure 1 (See Table S1 and Figures S1-S4 in the Supplemental Materials for individual values and figures). Examining the fit statistics revealed that the fit indicators continued to decrease as the number of profiles increased preventing the use of a break in the plot to identify the best-fitting profile. Considering previous findings, we visually inspected the 4-, 5-, and 6-profile solutions and found that the 5-profile solution corresponded closely to Espinoza et al.’s (2020) 5-profile solution. In addition to its visual correspondence with previous research, this solution also presented adequate fit statistics, therefore, we selected the 5-profile solution as the optimal solution for computation of average parameter deviations. See Figure 2 for a composite of the 5-profile solution across samples (see Figures S5-S8 for individual depictions of each solution). This analysis revealed an average absolute parameter deviation of 0.08 across samples, which is within the threshold indicating replication used by Espinoza et al., (2020) (see Table S2 for the average parameter deviations across samples by trait). Model Fit Indices for Latent Profile Analysis of the S90.1-S90.4 Samples. Note. Statistical indicators for the two- to ten-profile solutions in the S90.1–S90.4 samples used to identify the optimal profile solution. AIC = Akaïke Information Criterion; CAIC = Consistent AIC; BIC = Bayesian Information Criterion; SABIC = Sample-size Adjusted BIC Means of the Six HEXACO Factors for the Five-Profile Solution in the S90.1–S90.4 Samples. Note. Optimal five-profile solution scores for the S90.1–S90.4 samples. HH = Honesty-Humility; Emot = Emotionality; Extra = Extraversion; Agree = Agreeableness; Con = Conscientiousness; Open = Openness. Values in parentheses provide ranges for the estimated proportion of the sample in each profile across the S90.1–S90.4 samples

In light of these findings, and in answer to Research Question 1, we conclude that the same 5-profile solution for the 100-item HEXACO-PI-R can be identified using the HEXACO-60. This finding contributes to the accumulation of evidence in favor of a unified 5-profile solution across the two authentic measures of the HEXACO and suggests that future research can indeed use the shorter and more popular 60-item HEXACO-PI-R to investigate these profiles.
In response to Research Question 2 on the recoverability of the optimal solution, we found that the mean parameter deviation across profiles increased dramatically as sample size decreased. Notably, we found that the mean absolute parameter deviation across profiles reached .18 for 1,250. This finding suggests that, although the unified 5-profile solution can be identified using the HEXACO-60 in large samples, the ability to do so decays rapidly beginning as early as sample sizes of 1,250 (see Figure 3 and Table S3). Mean Absolute Parameter Deviations from the Five-Profile HEXACO-60 Solution by Trait. Note. Graph depicts the relation between mean absolute parameter deviation from the optimal five-profile solution on a per-trait basis from the holdout sample analyses. HH = Honesty-Humility; Emot = Emotionality; Extra = Extraversion; Agree = Agreeableness; Con = Conscientiousness; Open = Openness to Experience. Mean values by profile can be found in Table S3 in the Supplemental Materials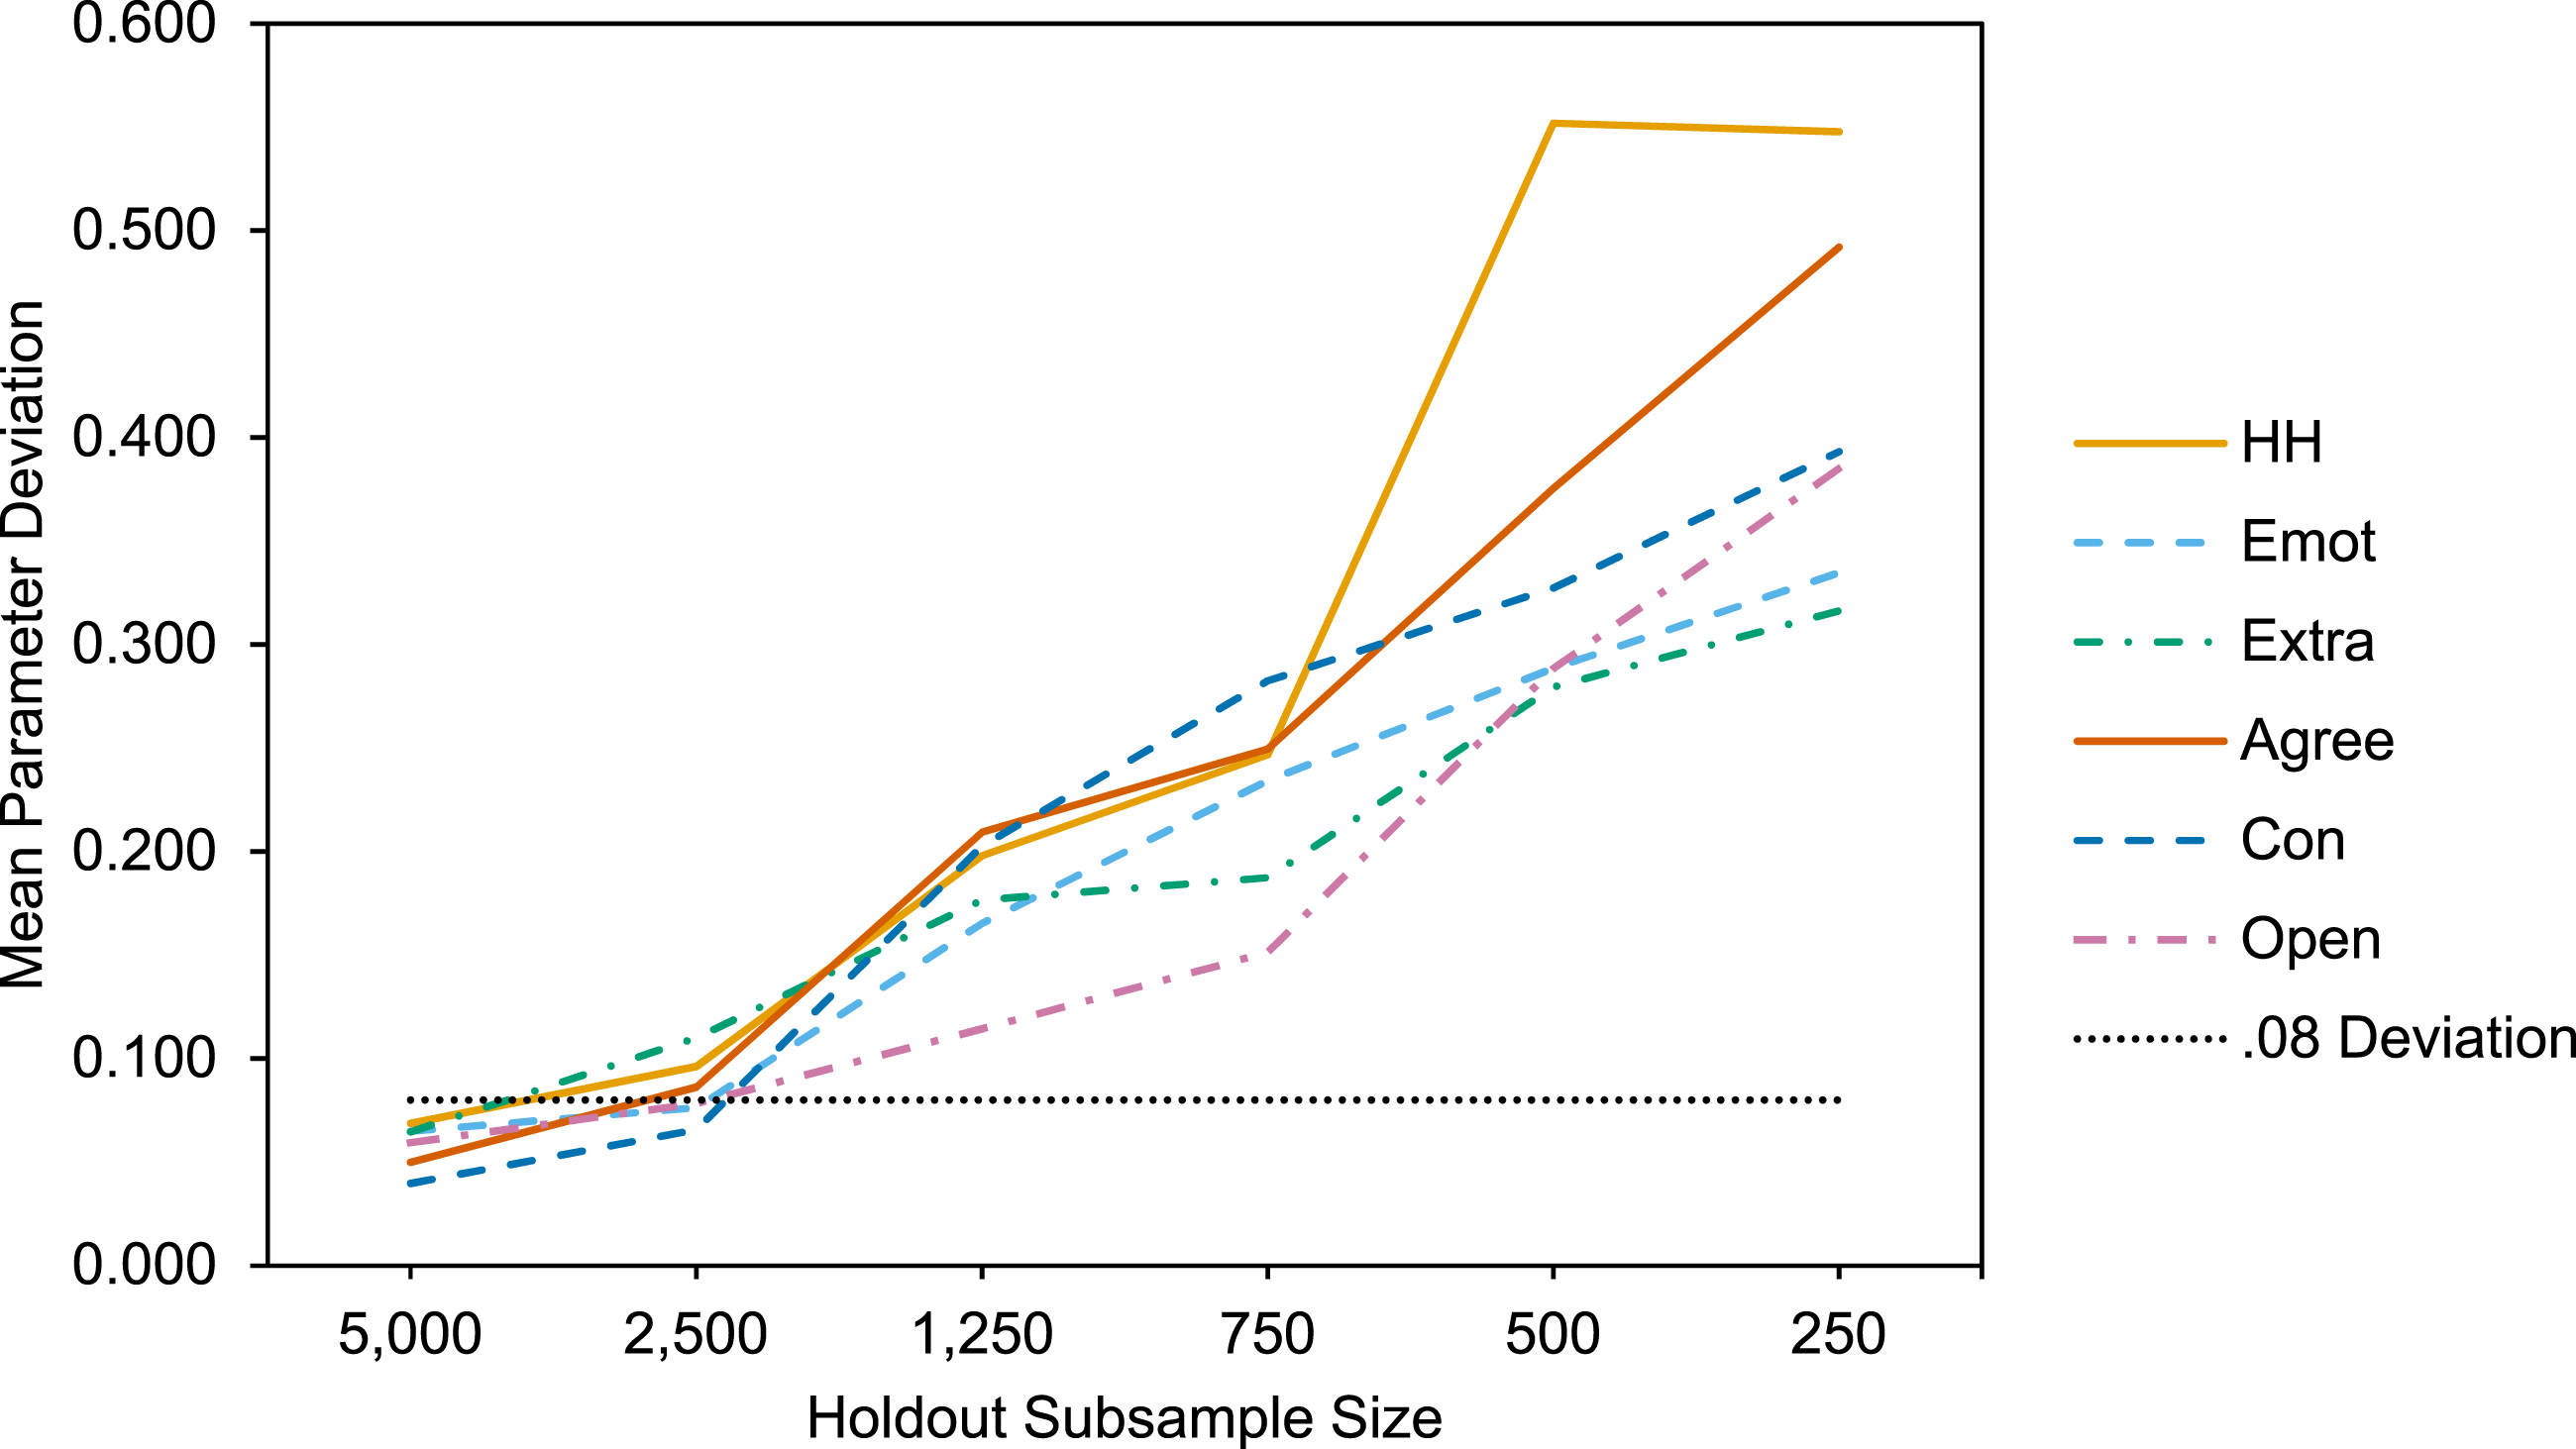
Summary
The purpose of the present study was to evaluate whether the 5-profile solution identified using the 100-item HEXACO by Espinoza et al. (2020) could be recovered using the 60-item HEXACO. The results of our study indeed demonstrate that the same 5-profile solution can be identified in both the 60- and 100-item versions of the measure. Consequently, we join Espinoza et al. (2020) in recommending that researchers and practitioners interested in the unified profile solution should consider applying the parameters for the unified profile solution to their data. However, it may not always be appropriate to apply the parameters for the unified profile solution. In the following section, we provide a tutorial that includes guidance on determining when it may be appropriate to apply the parameters and a demonstration of how to do so using a sample of independent data.
Tutorial: Applying the Unified 5-Profile Solution
The goal of this tutorial is to provide recommendations and a step-by-step guide for how and when researchers should apply the HEXACO-60 parameters for the unified 5-profile solution from this study, to recover the profiles in their own data. The step-by-step process is depicted in Figure 4 to serve as a visual aid. Subsequently, using a small archival sample, we demonstrate an application of this resource, including an example of how the profiles can be studied subsequently with respect to an auxiliary variable of interest. All syntax and data for this tutorial are available via the OSF: https://osf.io/aqdfp/ Flowchart for Recommended Decision Process for Applying the Unified 5-Profile Solution. Note. Main steps in recommended progression are depicted in ovals and sub-steps are depicted in rectangles. Solid arrows indicate recommended progression through steps and broken arrows indicate potential branching of progression based on researcher decision
Throughout the following discussion, we refer to syntax included as Supplemental Software to this paper. For illustration, this syntax may be executed with a sample dataset labelled ‘demonstration-data.csv’ and included in the Supplemental Software. Please note that the syntax and parameters provided are designed for use with Mplus (starting with version 7.0; Muthén & Muthén, 2017). To our knowledge, this is the only currently available software capable of key functions required for this procedure (e.g., extracting factor scores from an ESEM model; outputting and applying parameters associated with an LPA solution).
Throughout this discussion, we refer to how the process can be applied with data obtained with the HEXACO-60. Note that the same procedures can be applied to data from the HEXACO-100 using the parameters provided by Espinoza et al. (2020). We also briefly identify the steps that can be used following the LPA to investigate relations between the profiles and another variable (antecedent or outcome) if available. For more detailed discussion of how profiles can be investigated within a broader network of variables for purposes of validation or theory testing, see McLarnon and O’Neill (2018) and Morin, McLarnon et al. (2020). A necessary pre-condition for this process is to collect or obtain access to data using the HEXACO-60 and, optionally, at least one variable of interest (e.g., potential predictor or outcome).
Step 1: Exploratory Analyses
The goal in Step 1 is to identify the optimal profile solution for the data and can be conducted using new or archival HEXACO-60 data.
Step 1a: Conduct ESEM
For reasons stated above, we recommend conducting ESEM with HEXACO-60 items to model the theorized 6-factor structure, and outputting factor scores. For more detailed instructions on how to conduct ESEM, see Morin et al., 2020. The use of factor scores as input to the LPA is recommended because it provides some degree of control for measurement error, such that the profiles reflect levels on the underlying HEXACO trait constructs (Meyer & Morin, 2016).
Step 1b: Conduct LPA
Using the resulting factor scores as input, researchers should conduct LPA to generate solutions varying from 2 to 10 profiles. For an introduction to LPA and practical guidance on execution and profile extraction, see Spurk et al. (2020) and Woo et al. (2024). For each solution, a careful inspection of the fit statistics, profile size, and the configuration of the profiles should be conducted to select the optimal exploratory solution for the data to carry forward to Step 2. However, if the identification of an optimal exploratory solution is not possible, due to nonconvergence or other computational roadblocks, researchers may consider skipping Step 3 to fix the parameters for the unified solution to their data.
Step 1c: Retain the Optimal Exploratory Solution
Researchers with evidence in favor of the optimal exploratory solution, typically as a result of evaluations in Step 2b or Step 3c, can choose to retain this solution and proceed to Step 4.
Step 2: Comparison of the Exploratory and Unified 5-Profile Solutions
The goal of Step 2 is to determine whether the exploratory analyses have independently recovered the unified profile solution. Our findings suggest that with large and heterogeneous samples, an optimal exploratory profile solution should resemble the unified profile solution, but this might not always be the case. Differences between the optimal and unified solutions will be most likely when using a relatively small sample. Comparison of the exploratory and unified solutions should be conducted as follows.
Step 2a: Visual Match to Unified Solution
A first step is to establish whether there is a visual match between the optimal exploratory and the unified profile solutions. Researchers can use Supplemental Software 1 to facilitate this process. Entering the parameter values for the optimal exploratory solution into Supplemental Software 1 will produce a series of graphs that can be used for visual comparison with the unified solution reported here. Note that Mplus may not output the profiles in the same order as the unified solution. Therefore, the values corresponding to each profile entered in Supplemental Software 1 may need to be re-ordered before proceeding to Step 2b.
Step 2b: Deviation From Unified Solution
To complement the visual match, researchers should calculate the absolute average deviations for the corresponding parameters. This process can also be automated via the use of Supplemental Software 1.
Average absolute parameter deviation can be used as a metric to evaluate independent recovery of a given profile solution. Based on the results of Study 1, we recommend an average parameter deviation of 0.08 as a useful heuristic. Solutions with an average deviation of 0.08 or less can be taken as indicating good recovery of the unified solution. Solutions with average deviations well above 0.08 suggest poor recovery. In either case, the average absolute parameter deviation should be considered in conjunction with the visual match in Step 2a. In some cases, a high average parameter deviation can occur even when profiles are of similar shape but the indicators within profiles differ in level. In such cases, similarity in profile shape may be sufficient to indicate recovery.
Good Recovery of Unified Solution
If the researchers judge that the exploratory solution is a good match based on visual inspection and presents adequate parameter deviations, it can be assumed that the unified solution has been sufficiently reproduced. In this case, researchers may decide to retain the exploratory solution and move to Step 4 to conduct auxiliary analyses.
Poor Recovery of Unified Solution
If the visual inspection and average deviations suggest poor recovery, researchers must consider potential explanations. Our findings in Study 1 suggest that the likelihood of recovering the unified solution is difficult, even for heterogeneous samples as large as 1,250, and becomes increasingly difficult below this sample size. If sample size is an issue, researchers should consider moving to Step 3 to apply the parameters generated in our study.
If sample size is not an issue, researchers should consider whether their sample might deviate in important ways from the general population. This may occur if the researchers have drawn a sample from a unique population that is homogeneous with respect to specific characteristics such as shared demographics, biography, epigenetic history, location, language, occupation, among others. Critically, in these situations, researchers should consider whether the population reflected in their sample is unique such that the configuration of their personality traits (i.e., profiles) may be systematically different from that of the general population. Fundamentally, this allows for the possibility that substantively different and meaningful profile solutions exist beyond the unified profile solution and prevents these from being prematurely dismissed on the basis of their dissimilarity to the unified solution.
Although we do not provide strict recommendations as to how to evaluate whether a sample is sufficiently unique to generate a distinct and meaningful profile structure, researchers might compare the distribution of basic demographic characteristics (e.g., age, gender, ethnicity, and education) of their sample to those reported in Study 1. They might also consider whether their sample differs from the general population with regard to other characteristics such as shared biography (e.g., parenting status, criminal conviction), occupation (e.g., lawyers, soldiers, CEOs), group identity (e.g., extreme sports enthusiasts), or values (e.g., high universalism, high conformity).
If evaluation of the sample suggests that it is drawn from a unique population, researchers might consider returning to Step 1c and retaining the optimal exploratory solution. Note that, although suspicion or evidence that a sample is in some way unique might warrant moving to Step 1c and retaining the optimal exploratory solution, researchers might consider delaying the decision by moving to Step 3 first and retaining the exploratory solution only if there is clear evidence that the unified solution cannot be adequately reproduced.
Step 3: Fixing Parameters to Generate the Unified 5-Profile Solution
The objective in Step 3 is to apply the parameters generated in the current study to the data in an effort to reproduce the unified 5-profile solution. If at Step 2b, the exploratory analyses do not independently recover the unified solution, but there is sufficient reason to believe the deviation is a result of sample size rather than a meaningful difference in sample characteristics requiring a unique profile solution, researchers can apply the parameters provided from the present study in the following steps.
Step 3a: Fix ESEM Parameters to the Data
Using the file provided (see Supplemental Software 2 for the HEXACO-60 ESEM parameters), conduct an ESEM of the HEXACO scores applying the relevant parameters to output the factor scores required for the LPA (Step 3b). The Supplemental Software for Steps 3a-3c in this paper include commentary on the function of each section of code included in the syntax.
Step 3b: Fix LPA Parameters to the Data
Using the file output in Step 3a containing factor scores for the HEXACO traits and, potentially, scores on auxiliary variables of interest, execute an LPA specifying parameters for the unified profile solution (see Supplemental Software 3 for HEXACO-60 parameters).
Step 3c: Examine Representation of Profiles in the Data
When applying the parameters for the unified solution, it is possible to encounter a scenario in which one or more of the profiles are represented by less than 5% of the sample according to final class counts. This means that less than 5% of the sample has been probabilistically identified as most likely to belong to a specific profile. Profiles represented by less than 5% of the sample may not be robust (Marsh et al., 2009; Nylund et al., 2007). Importantly, this guideline does not indicate that participants are exclusively classified into a specific profile as a result of applying the parameters for the unified solution. As with an exploratory profile solution, the probability of membership in all profiles based on their pattern of scores on the indicators is still calculated for each participant. Therefore, the final class counts, which reflect the profile each participant is most likely to be assigned to, are only used to estimate the robustness of the profiles. Subsequent analyses using the model based on the parameters for the unified solution retain individual class probabilities for each participant allowing for their use in analyses that account for classification uncertainty (see Masyn, 2013 additional details). Researchers can evaluate the representation of each profile by reviewing the output file generated in Step 3b and examine the table labeled “Final Class Counts And Proportions For The Latent Classes Based On Their Most Likely Latent Class Membership”. If the profiles are sufficiently represented in the sample, researchers can proceed to Step 3d.
Removing Insufficiently Represented Profiles
If researchers determine that one or more profiles are not well represented in the sample, it may be necessary to remove these profiles. Importantly, removing insufficiently represented profiles from the model syntax will not affect the estimation of the remaining profiles, as the syntax in the Supplemental Software holds them constant. However, with the removal of profiles from the syntax, class probabilities for participants will be recalculated to indicate their potential membership in the remaining profiles in the solution.
To remove a profile from the syntax, add an exclamation mark “!” to the lines of code that specify the insufficiently represented profile, this will prevent Mplus from including it in the analyses (Muthén & Muthén, 2017). It was determined this procedure was necessary in the example application we provide below and interested readers can consult the Supplemental Software 4 associated with the Example Application for an explicit example of how to achieve this in their own syntax. After removing insufficiently represented profiles, proceed to Step 3d.
Reconsidering Optimal Exploratory Solution
Importantly, if, as a result of the aforementioned process, multiple profiles need to be removed from the syntax, researchers should reconsider whether the unified profile solution is sufficiently well represented overall in their data. That is, the need to remove multiple profiles might be evidence that the unified profile solution does not adequately represent the underlying subgroups in the data. This could indicate that the researchers are working with a sample that may warrant its own profile solution. In such a scenario, researchers should consider working with the optimal exploratory solution obtained in Step 1 for purposes of subsequent auxiliary analyses in Step 4.
Step 3d: Retaining Final Unified Solution
Following the application of the unified profile solution and the removal of any insufficiently represented profiles, researchers can proceed to Step 4 if interested in conducting auxiliary analyses.
Step 4: Auxiliary Analyses
One approach to investigating the relationship(s) between the profiles and other variables is to compare the means associated with each of the profiles for a given auxiliary variable. For example, when examining potential ‘outcomes’, we recommend the use of the BCH approach. The BCH approach is the preferred method for analyzing the relationship between profiles and continuous distal outcome variables because it adequately accounts for uncertainty in classification embedded in latent profile solutions (Bakk & Vermunt, 2016). The BCH approach conducts an omnibus test of whether there are significant differences in the means of the auxiliary variable associated with each profile, then conducts pair-wise chi-square significance tests of the differences between the means, at which point these differences can be interpreted in the context of the study (see Asparouhov & Muthén, 2021, for additional details). Additionally, the auxiliary variables can be treated as predictors, moderators, or mediators of relationships involving the specified profiles (see McLarnon & O’Neill, 2018; Morin, McLarnon et al., 2020 for detailed explanations and documentation).
In the following section, we illustrate the application of the steps identified in this Tutorial using a small sample of archival data. We chose to conduct this demonstration with a sample from archival data because the retroactive examination of data is one way in which this resource can be employed to advance person-centered research on the HEXACO profiles via the re-examination of data originally intended for variable-centered research purposes. Importantly, as this is a procedural application, we do not make any specific or theoretically grounded predictions about the nature of the relationships between the various personality profiles and the auxiliary variable.
Example Application: Differences in the Anger Subscale of the VAVS in the Unified 5-Profile Solution
Previous research has investigated the relationship between personality and socially malevolent behavior (Furnham et al., 2013; Lee & Ashton, 2014; Howard & Van Zandt, 2020). Accordingly, researchers may be interested in examining the relationship between the unified 5-profile solution for the HEXACO model and individual differences captured by a relevant measure of interest. For example, the Vices and Virtues Assessment Scale (VAVS) is a measure of individual differences in the tendency to engage in seven socially aversive behaviors (Veselka et al., 2014). For the purposes of demonstrating an application of the Tutorial, we obtained access to archival data containing responses to the HEXACO-60 (Ashton & Lee, 2009) and the VAVS (Veselka et al., 2014). In the interest of brevity, for the following analyses, we have arbitrarily selected to focus on the Anger subscale from the VAVS, as it is the first subscale in the measure when it is arranged in alphabetical order.
Analyses and Results
As outlined above, we obtained data from participants who completed the HEXACO-60 and an auxiliary variable of interest (i.e., Anger subscale of the VAVS). Given that our interests were (1) identifying the profiles in our own data, and (2) understanding how the profiles within the unified profile solution relate to a given outcome, we started at the beginning with Step 1.
For Step 1a, we conducted a freely estimated ESEM for our HEXACO-60 data. Next, in Step 1b we used the resulting factor scores as input to generate LPA solutions for 2-10 profiles, and based on a series of fit statistics consistent with best practices (e.g., AIC, BIC, CAIC; see Daljeet et al., 2017 for review) it was determined that a 3-profile solution fit the data best and was used for the comparisons carried out in Step 2 (see Figure S9).
For Step 2a, we evaluated the visual match between the 3-profile solution and that of the unified profile solution. During the visual inspection of the profiles, it was determined that the overall profile solution was dissimilar (in quantity of profiles and shape) to the unified profile solution (see Figure S10 for depiction). This was supported by evidence from Step 2b wherein the average absolute parameter deviation was examined and found to be substantially greater than .08. In relation to Research Question 1, we were unable to independently recover the unified profile solution in our data. Importantly, our sample was relatively small (n = 239) and not intended to reflect a unique and homogeneous group within the population. That is, we have no expectation that this sample might yield a theoretically meaningful solution that is also distinct from the unified profile solution, therefore we moved on to Step 3.
For Step 3a, we proceeded to apply the provided ESEM parameters for the HEXACO-60 to the data and used the subsequent factor scores as input for Step 3b, where we applied the LPA parameters for the unified profile solution based on the HEXACO-60 to the data.
For Step 3c, we then examined the extent to which the participants in our study were distributed among the unified profiles by examining the final class counts for each profile: Achievement-Oriented Agentic (4%; n = 9); Ego-Oriented Agentic (34%; n = 82); Insecure (13%; n = 31); Communal (34%; n = 82); Socially Adjusted (15%; n = 35). Notably, only 4% of participants were identified in the Achievement-Oriented Agentic profile indicating that this profile was insufficiently represented in the sample for the purposes of auxiliary analyses. Consequently, we removed this profile from our syntax to facilitate subsequent outcome analyses (see Supplemental Software 4 for the modified syntax). After removal of the Achievement-Oriented Agentic profile, final class counts were as follows: 36% in Ego-oriented Agentic (n = 87), 15% in Insecure (n = 35), 34% in Communal (n = 82), and 15% in Socially Adjusted (n = 35). Finally, we landed in Step 3d, retaining the final 4-profile solution adapted from the unified solution and moved on to Step 4 where we conducted auxiliary analyses using the BCH approach.
To investigate Research Question 2, we used the automatic BCH method to evaluate the extent to which each of the profiles may be associated with different levels of Anger. Syntax for these analyses which includes the removal of the insufficiently represented profile and BCH analyses for Anger can be found in Supplemental Software 4. The results of the omnibus chi-square test revealed that the mean level of Anger associated with the four profiles significantly differ from one another (χ2 = 67.269, p < .001; see Figure 5). Subsequently, pairwise comparisons were conducted to evaluate which profiles were associated with higher, or lower, levels of Anger. Estimated Anger Means for BCH Tests of the Unified Profile Solution in the Example Application. Note. Estimated mean scores on the anger scale for each profile used in BCH tests of means. All profiles significantly different at p < .05. Error bars indicate 95% confidence intervals. Values in parentheses indicate estimated proportion of the sample in each profile
We found that the Insecure profile (Manger3 = 3.57) was associated with the highest level of Anger, and this was significantly greater than the Communal (Manger4 = 2.96; χ2 = 13.104, p < .001), Ego-oriented Agentic (Manger2 = 2.63; χ2 = 36.213, p < .001), , and Socially Adjusted profiles (Manger5 = 1.88; χ2 = 58.237, p < .001). The Communal profile had the second highest level of Anger and this was significantly greater than levels for the Ego-oriented Agentic (χ2 = 4.890, p = .027) and the Socially Adjusted profiles (χ2 = 26.447, p < .001). Finally, the Ego-oriented Agentic profile presented greater Anger than the Socially Adjusted profile (χ2 = 13.665, p < .001). Accordingly, these results indicate that the unified profiles are indeed differentially associated with individual levels of Anger in this sample. Outside the bounds of the present demonstration, these findings might be interpreted via a range of theories to increase our understanding of the cognitions, affect, and behaviors that characterize the profiles.
Discussion
The purpose of the present study was to evaluate whether the 5-profile solution identified using the 100-item HEXACO by Espinoza et al. (2020) could be recovered using the 60-item HEXACO. The results of our study indeed demonstrate that the same 5-profile solution can be identified in both the 60 and 100-item versions of the measure. However, it may be necessary to use larger samples to accurately identify the profiles using the HEXACO-60 as the recoverability of the unified 5-profile solution suffered when sample size fell below 1,250, compared to the minimum sample size of n = 750 recommended for the 100-item HEXACO as reported by Espinoza et al. (2020). Lastly, we provide a resource in the form of a Tutorial and an example demonstrating the application of the parameters for other researchers to use. This recommended set of procedures helps researchers evaluate the appropriateness of applying the parameters from the unified profile solution to their data and leverage the results of the present study to expedite future research into the nature and utility of the HEXACO personality profiles.
Implications
The results of our study have two primary implications. First, we propose that research on personality profiles within the HEXACO model can safely proceed using either the 100-item or 60-item measures and expect to obtain similar results so long as the samples being used are sufficiently large. This is important because, as previously mentioned, the 60-item HEXACO is a markedly more popular measure due to it being more efficient to administer in both research and applied settings.
A second implication of our study is that researchers can apply the parameters we provide for the 60-item HEXACO or the 100-item HEXACO (see Espinoza et al., 2020), to identify the unified profile solution within their data for substantive study. That is, researchers can expedite the LPA process and avoid incorrectly interpreting the presence and meaningfulness of potentially spurious profiles that may not themselves be the target focus of the research. However, it must be noted that there may be good theoretical rationale to study the number and nature of profiles that can be identified within specific subpopulations. It may be the case that some segments of the population could be expected to have meaningfully unique characteristics that might be reflected in their personality. This could manifest in a unique profile structure or large variations in representation within the general profiles. For example, repeat criminal offenders, extreme sports fanatics, mental health populations, and those in specific occupations (e.g., firefighters, police officers) or organizational roles (e.g., executive leadership). Researchers interested in the potentially unique personality profiles of these subpopulations can follow various existing guidelines for using LPA (e.g., Spurk et al., 2020; Ferguson & Hull, 2018) but might find the general structure of the recommended procedure presented here a useful, if brief, summary.
Limitations and Future Directions
A first limitation of our study is in relation to our procedure for deciding when to apply the parameters for the unified profile solution. In this procedure we include a step where researchers are asked to consider whether they should favor their exploratory solution. We propose that one reason for doing so is that they may be using a sample from a unique population that may be best represented by a unique profile solution. One way this can be inferred is via comparison between the characteristics of our large, population-like samples and the sample of interest being examined. However, we do not provide an explicit process for such comparisons because we do not know the extent to which any one sample characteristic, on its own or in combination with others, matters in determining dissimilarity from the population-like samples used to establish the unified solution. To address this limitation, we argue that future research is needed to demonstrate the extent to which sample characteristics (e.g., specific group identities, singular occupational role, or shared set of values) affect the recovery of the unified profile solution so this can be accounted for in future research into personality profiles.
Indeed, our results are based on samples that are large and heterogeneous across a range of demographic variables (age, gender, ethnicity), therefore we propose that the results drawn from these samples are likely normative in nature. However, evidence supporting these claims must be drawn from other equally large and diverse samples in order to ensure replicability and generalizability. Therefore, a critical mandate for future researchers will be to take on the herculean task of collecting diverse samples of ideally equal or greater size than those used this study and to test whether the unified 5-profile solution we identified in this work can continue to be recovered in these samples. Additionally, research of this nature will contribute to the capacity to evaluate whether a given sample is drawn from a population that is sufficiently distinct such that it may yield its own unique profile solution.
Similarly, an important future test of the validity of the unified profile solution would be to determine whether the solution can be recovered using alternative operationalizations of the HEXACO model. For example, the IPIP-HEXACO (Ashton et al., 2007), the Brief-HEXACO-Inventory (De Vries, 2013), the HEXACO Adjective Scale (Romano et al., 2023), the Big Six Questionnaire (Thalmayer & Saucier, 2014), or even a combined measure of the Five-Factor Model (Digman, 1990) accompanied by stand-alone scales of Honesty-Humility. Research on personality profiles in the HEXACO model (Lee & Ashton, 2004) is still in its infancy, and there is much we do not know about the affective, behavioral, and cognitive characteristics of the people associated with the profiles identified in this and other work, nor their potential utility in applied settings. In the example application, we provide comparisons of the unified profiles on the Anger subscale of the VAVS (Veselka et al., 2014) but these analyses were not pre-planned and, therefore, we did not make theory-informed hypotheses about potential differences. Studies that use new or archival data but provide a theoretical rationale across potential differences, however, have the potential to significantly advance our understanding of the meaning and potential utility of these profiles.
Studies seeking to apply our parameters and examine the criterion-related validity of the profiles are important in light of existing debates about whether profiles represent meaningful configurations of their indicators (Bauer & Curran, 2003a, 2003b; Muthén, 2003; Rindskopf, 2003), notably there has been some research on this in the context of personality research (e.g., Bojanić & Čolović, 2025; Ashton & Lee, 2009b). Importantly, beyond replication across samples (Morin et al., 2016; Morin et al., 2020), a necessary step in addressing the validity of a given profile solution is to conduct further research examining substantive questions that would either support or refute its construct validity (Meyer & Morin, 2016). We believe this underscores the potential value of the current research as it seeks to facilitate future studies by allowing researchers to investigate substantive questions about a particular set of seemingly robust and replicable profiles. If these profiles are indeed meaningful, we expect that researchers will find theoretically interpretable relations with key cognitive, affective, and behavioral correlates.
In summation, we argue that the present study provides evidence that, not only can the 60-item HEXACO be used for research on personality profiles, but that a unified set of profiles can be identified across the two dominant measures of the model. Accordingly, we call on other researchers to leverage existing datasets or collect new data and make use of the parameters and processes we present in this paper to evaluate and understand the nomological network and theoretical implications of these profiles, and conduct further tests of generalizability and replicability. In doing so we hope to encourage research on personality profiles and facilitate the exploration of substantive research questions in domains such as personality in the workplace, life satisfaction, interpersonal relationships, clinical and health contexts, and many more.
Supplemental Material
Supplemental Material - Examining the Replicability of the Five HEXACO Personality Profiles Using the 60-Item HEXACO-PI-R: A Tutorial and Guidelines for Their Future Application
Supplemental Material for Examining the Replicability of the Five HEXACO Personality Profiles Using the 60-Item HEXACO-PI-R: A Tutorial and Guidelines for Their Future Application by Kabir N. Daljeet, Jose Espinoza, John Meyer, & Erica Sutherland in Personality Science
Footnotes
Author’s Note
Kabir N. Daljeet and Jose A. Espinoza contributed equally to this article, and both should be considered first authors. The Handling Editor for this paper was Dr. Jenny Wagner.
Acknowledgements
The authors would like to thank Dr. Sydney Reichen for her comments on an earlier draft of this paper.
Author Contributions
Kabir Daljeet: Conceptualization, Data Curation, Formal Analysis, Investigation, Methodology, Writing – Original. Draft, Writing - Review & Editing. Jose Espinoza: Conceptualization, Formal Analysis, Methodology, Writing – Original Draft, Writing - Review & Editing. John Meyer: Conceptualization, Writing – Original Draft, Writing - Review & Editing. Erica Sutherland: Data Curation, Investigation, Writing – Reviewing & Editing.
Funding
The authors disclosed receipt of the following financial support for the research, authorship, and/or publication of this article: This research was supported by funding from the Social Sciences and Humanities Research Council of Canada, Grant Number: 430-2025-00312.
Declaration of Conflicting Interests
The authors declared no potential conflicts of interest with respect to the research, authorship, and/or publication of this article.
Data Accessibility Statement
Supplemental Material
Supplemental material for this article is available online. Depending on the article type, these usually include a Transparency Checklist, a Transparent Peer Review File, and optional materials from the authors.