
Abstract
Dynamic characteristics like intraindividual means (iMs) and standard deviations (iSDs) reliably provide insight into the level and variability of emotions people experience within a given window of time. However, it is unclear the extent to which these measures characterize capture stable individual differences rather than transient states and, if so, how many observations are necessary to ensure reliable measurement. In the current study, we use data from two experience sampling studies that use burst designs to test the effect that the number of within-person observations has on the one-week and one-year stability of iMs and iSDs for various measures of emotion. We find that a modest one-year of stability of r = .50 could be reached for iMs with an average of 14 observations per person, while for iSDs an average of 42 observations were necessary, with many items failing to reach r = .50 at the maximum number of observations available. These findings suggest that in typical experience sampling designs iMs capture stable individual differences but iSDs may not, even with many within-person observations.
Introduction
Experience sampling studies – which involve repeated assessments of affect and behavior – are thought to capture people’s lives with greater ecological validity and precision than typical, single time point surveys (Trull & Ebner-Priemer, 2013). Repeated assessments are often summarized with statistics like intraindividual means (iM) and standard deviations (iSD), providing insight into the typical level and variability, respectively, of a given emotion or behavior that a person experiences (Dejonckheere et al., 2019; Ram & Gerstorf, 2009); these summary statistics are referred to as dynamic characteristics. Researchers often assume that dynamic characteristics accurately reflect relatively stable, trait-like features of people (Ram & Gerstorf, 2009). However, it is unclear to what extent these estimates capture stable individual differences that persist across time periods of months or years. If dynamic characteristics are sufficiently stable, researchers need to know how many repeated assessments are necessary to collect, given the cost of these studies to both participants and scientists (Hopwood et al., 2022). In the current study, we investigate the one-week and one-year stability of affective and personality iMs and iSDs as a function of the number of assessments administered.
Why use dynamics?
While cross-sectional surveys have long been used to capture individual differences in affect and behavior, repeated assessments are thought to better capture these constructs because they reduce memory biases and allow for the study of within-person variation (Ram & Gerstorf, 2009; Colombo et al., 2020). Repeated assessments can be summarized into dynamic characteristics using both simple equations (e.g., a variance) or more complex calculations (e.g., mean squares of successive difference) to estimate different theoretical person-level properties (e.g., variability and momentary instability, respectively) (Dejonckheere et al., 2019). Researchers often use these dynamic characteristics to summarize the states people experience across a short period of time. Moreover, these dynamic characteristics are often assumed to capture trait-like properties (Ram & Gerstorf, 2009; Scott et al., 2020). It is this latter construal of dynamic characteristics that are the focus of the current paper.
The current paper will focus on two commonly studied dynamic characteristics: intraindividual means (iMs) and standard deviations (iSDs). Intraindividual means are typically construed as corresponding with the trait level of a construct someone experiences. For example, the iM of positive affect is thought to capture a person’s trait positive affect. iSDs, on the other hand, are typically construed as trait variability, or how variably a person experiences positive affect, for example. The variability of emotions is of direct and unique interest in understanding the emotional experience of people with and without mental illness (Ong & Ram, 2017; Bosley et al., 2019).
Experience sampling studies are typically limited in the number of items assessed at each timepoint and it is commonplace to aggregate across items of positive and negative affect to decrease measurement error (Epstein, 1983). However, it is also important to assess single items, which have been shown to be stable, heritable, and predict important life outcomes (Allen et al., 2022; Mõttus et al., 2017, 2019). Additionally, single-item and aggregated measures of momentary affect have shown comparable correspondence with retrospective reports, reliability, and concurrent and predictive validity (Dejonckheere et al., 2022; Ganzach & Yaor, 2019; Song et al., 2023).
Dynamic characteristics like iMs and iSDs of positive affect are relevant to many important outcomes, including mental health and socioemotional well-being (Houben et al., 2015; Heininga et al., 2019; Houben & Kuppens, 2020). Dynamic characteristics have been posited to describe trait-like tendencies and abilities (Ram & Gerstorf, 2009), and there is evidence that dynamic characteristics correspond with trait measures and are heritable (Colombo et al., 2020; Schneider et al., 2020; Zheng et al., 2016).
Are measures of dynamics reliable?
While the utility of complex affect dynamics (including the autocorrelations and the mean square of successive differences) has been questioned (Dejonckheere et al., 2019), research has demonstrated the power of simple dynamics like iM and iSD to predict outcomes like psychological well-being and mental health diagnoses (Wendt et al., 2020; Dejonckheere et al., 2019; Bosley et al., 2019; Schuler et al., 2021). However, the validity of measures is dependent on their reliability. Measures with low reliability have inconsistent or spurious relationships with outcomes, limiting the validity of inferences that can be made from either significant or null results (John & Soto, 2007; McCrae et al., 2011).
A substantial amount of research has assessed the reliability of momentary measures of affect and dynamic indices (Dejonckheere et al., 2022; Scott et al., 2020; Wendt et al., 2020; Wilhelm & Schoebi, 2007). Broadly speaking, this work provides evidence for the good reliability of momentary measures of affect and intraindividual means. For example, Wendt and colleagues (2020) found acceptable split-half reliabilities of intraindividual means (r’s > .9) and standard deviations (r’s between .67 and .95), whereas more complex dynamics were largely redundant with iMs and iSDs. However, other research has found that iSDs have lower reliability and are particularly sensitive to the number of observations (Estabrook et al., 2012; Wang & Grimm, 2012).
Are measures of dynamics stable?
Similar to but distinct from construct reliability is construct stability. Stability can be assessed in many ways (e.g., Aldridge et al., 2017; Parsons et al., 2019; Revelle & Condon, 2019) but is typically assessed through test-retest correlations. Test-retest correlations contain information both about how reliable a measure is (i.e., how consistently a measure captures the underlying construct) and how stable it is (i.e., the degree to which that underlying construct is an enduring, trait-like feature of people; Fraley & Roberts, 2005). When researchers attempt to measure known traits, low test-retest correlations are typically construed as a problem of measurement. On the other hand, in the context of stability, low test-retest correlations are typically construed as countervailing evidence for the trait-like nature of the construct.
The time frame between retests is an important consideration for distinguishing reliability from stability. Reliability is broadly considered to be the consistency of a measure across shorter time frames. For example, Dejonckeere and colleagues (2022) provide a demonstration of this decay across a time scale of minutes in their recent investigation of the reliability of single items of momentary affective measures. Stability, on the other hand, is this consistency of a measure across longer periods of time. For example, the degree to which test-retest correlations decay over long periods of time provides insight into the extent to which the construct is stable (Fraley & Roberts, 2005).
What constitutes an adequate to assess stability, however, depends on the purposes for which these measures are intended. For researchers intending to characterize the emotional dynamics of a single period of time, such as one day or one week, extant research demonstrates the reliability of dynamic indices (Mejía et al., 2014). However, longer time intervals are necessary to determine whether these measures capture stable individual differences (Caspi & Roberts, 2001; Roberts & DelVecchio, 2000). Intervals of a year or longer are typical for assessing the stability of measures of personality (Fraley & Roberts, 2005; Specht et al., 2011). This is an unfortunate gap in the literature: most research on the psychometrics of momentary assessments and dynamic characteristics focus on the (short-term) reliability of these measures (Mejía et al., 2014) but not the extent to these measures capture (long-term) stable individual differences. For example, Scott and colleagues (2020) found adequate to good reliability at both the within- and between-person levels across multiple datasets utilizing a single burst of data collection. However, it is important to recognize that the individual study bursts ranged from 7 to 14 days. Therefore, it is unclear whether the constructs measured during this window capture something about each participant that will remain stable across a longer period. Nonetheless, this work provides evidence that these measures reliably capture meaningful within- and between-person differences within a given period.
Prior research on the stability of affect dynamics utilizes simulations to estimate their reliability and stability under various assumptions (Estabrook et al., 2012; Wang & Grimm, 2012). This research is valuable in that it provides insight into the likely effect of the number within-person observations on the stability of these dynamics (Wang & Grimm, 2012). However, the extent to which these assumptions hold in real-world data collection scenarios is currently unclear (Wrzus & Neubauer, 2023). A goal of the current research is to build on this work using data from studies that more closely resemble the data that most researchers will utilize.
How stable is stable enough?
The optimal stability of measures depends on the purposes of the measures. For measures that are intended to capture transient states, lower levels of stability are to be expected and unproblematic. However, measures that are intended to characterize enduring patterns of experience or behavior (i.e., traits), stability is crucial. Prospective prediction is impeded when measures contain more state variance than trait variance, whereas contemporaneous relationships will not be impacted (Clark et al., 2003).
What constitutes sufficient stability, then, will vary across research goals. Extant research on the stability of personality traits can help contextualize the degree to which affect dynamics are stable. For example, single-timepoint, global measures of neuroticism show a one-year stability between .49 and .67 for young adults (Fraley & Roberts, 2005). Hudson and colleagues (2017a) find that day to day affect using a daily reconstruction method show a one-year stability of ∼ .50 for positive affect and ∼.35 for negative affect. Further, they show that global measures of positive affect are comparably stable, but global negative affect shows increased stability relative to the daily reconstruction method (rs = .60–.73). If affect dynamics capture enduring patterns of emotional experience, we would expect to find comparable stability.
Both reliability and stability need to be established
Reliability is necessary, but not sufficient, for stability (Heise, 1969; Watson & Walker, 1996; Wheaton et al., 1977). Reliability without stability would indicate that dynamic indices capture short-term emotional states but not enduring person-level traits. Possibly – perhaps probably –dynamic characteristics capture both states and traits. Nonetheless, demonstrating that dynamic indices reliably characterize state emotional experience is not the same as demonstrating that these dynamic indices provide useful information about traits (Revelle & Condon, 2019). Understanding whether these constructs are stable measures of individual difference across longer periods of time is, therefore, a separate but important question that addresses the degree to which dynamic characteristics estimate traits (Parsons et al., 2019).
A typical repeated-measures study – such as an ecological momentary assessment or daily diary study – captures participants for many days over a single period of assessment, such as one week or one month. This is an impediment to establishing the stability of dynamic characteristics, as these summary statistics are estimated for each participant only once during the study. Alternatively, burst designs – wherein multiple bursts of repeated assessments are separated by a period of time – provide an opportunity to investigate the test-retest correlations of iMs and iSDs derived from repeated assessments (Gerstorf et al., 2014; Ram et al., 2014). For example, a burst design may assess participants several times a day for one week, then pause data collection for a month, then assess participants for a second week.
How many assessments are sufficient?
The use of repeated assessments assumes that multiple measures produce better estimates of means and variances than a single assessment (Epstein, 1980a; 1980b). More is presumably better, but a practical question is how many assessments are needed to capture something enduring about a person rather than merely summarizing their emotional experience during a short period of time? Wrzus and Neubauer (2023) find that on average, EMA studies scheduled six assessments per day for seven days with a 79% compliance rate, or 33 within person observations. However, there is currently limited evidence regarding the sufficient number of repeated assessments to produce stable dynamics.
Because collecting repeated assessments is burdensome to both participants and researchers, identifying the minimum number of assessments to produce stable dynamics is an important practical goal for researchers. Moreover, such information is essential for a priori power analyses (e.g., Lafit et al., 2021). Simulations suggest that iMs achieve good stability with a smaller number of assessments than iSDs, which rarely achieved a stability of .60 even after 150 assessments (Wang & Grimm, 2012). To our knowledge, there has been no investigation of the effect of burst spacing on dynamic characteristic stability.
In the current study, we utilize data from two studies using a burst design to assess the one-week and one-year stability of affect dynamics. We examine the impact that the number of within-person assessments has on reliability to provide insight into the question: how many assessments need to be included in an experience sampling study to attain stable affect dynamics?
Methods
Participants and procedures
Sample demographics. Gender and race are presented as N (% of full sample).

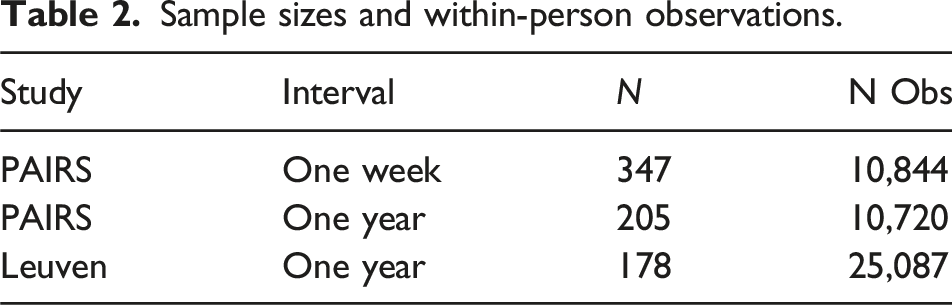
Sample sizes and within-person observations.
Measures
The PAIRS study included thirteen emotion and behavior items asking participants to rate on a scale from 1 (Not at All) to 5 (A lot) “In the last hour, how _____ were you” and two items asking “How much positive/negative emotion did you experience” on the same scale. The Leuven study included ten items asking participants to rate on a slider scale from 0 to 100 “How ____ do you feel at the moment?” and a valence-arousal grid asking people to rate how passive/active and unpleasant/pleasant they felt on a scale from 0 to 8. To maximize the comparability of results from both studies, we present results using items that were either assessed in both studies (depressed, lonely, happy, relaxed) or had close counterparts across these two studies (positive/negative in PAIRS and unpleasant/pleasant in Leuven) are presented in the main analyses. Additionally, we aggregated the items Happy and Relaxed to create a positive affect scale and Depressed and Lonely for a negative affect scale. Results using the full set of items can be found in the supplemental file. 1
Analyses
How stable are iMs across one year and one week?
We tested the one-year stability of dynamic indices by calculating each person’s mean and standard deviation using all their responses to each item (a maximum of 60 responses per person in the PAIRS sample and 80 in the Leuven sample) at each burst. Stability was operationalized as the Pearson test-retest correlation between iM or iSD of each item at each burst. This provided a point estimate for the stability of the iM and iSD of each item. For example, the stability of iM of Positive Emotion was the Pearson correlation between iM of Positive Emotion of burst 1 and iM of Positive Emotion at burst 2. We include the one-year stability for both the PAIRS and Leuven studies to enable comparisons between the findings, but also test the one-week stability of the PAIRS study by dividing the data from the first wave of the study into week 1 and week 2 and repeat all analyses using these data. Additionally, we include stability estimates from all possible time intervals in the supplemental file. 2
We then used a bootstrapping approach to quantify the robustness of this point estimate (Efron, 1994). For each bootstrap sample, we sampled N participants with replacement; N was equal to the full sample size for each interval. Then, within-participant, we sampled O i observations from each burst with replacement; O i is the number of observations for each participant. In other words, each bootstrapped sample yields the same number of people, N, as the original sample and, for each person, the same number of observations, O i . We calculated the iM and iSD for each person at each burst and calculated the Pearson correlation between these estimates. This procedure was repeated 500 times, resulting in 500 bootstrapped test-retest estimates for each item and index. Empirical means and 99% confidence intervals were calculated from the bootstrapped distributions of test-retest correlations.
How many assessments are needed for stable iMs?
To test the impact that the number of within-person observations has on the one-year stability of intraindividual means, we calculated a series of bootstrapped Pearson test-retest correlations, increasing the number of observations O i selected from 1 to the maximum possible (i.e., 60 for the PAIRS sample and 80 for the Leuven sample) for each person. As before, for each of the 500 bootstrap samples we sampled N participants with replacement; then, within-individual, sampled O i observations from each burst with replacement. We calculated the iM for each person at each burst and calculated the Pearson correlation (and 99% confidence interval) between these estimates.
One-week stabilities were then identified using data from the PAIRS study comparing the first and second weeks of the first burst of the study. We repeated the bootstrapping procedure described above, increasing the number of observations O i selected from 1 to the maximum possible (i.e., 30 observations) for 500 bootstrap samples.
How stable are iSDs across one-week and one-year, and how many assessments are necessary?
We then investigated the stability of iSDs across one-week and -year, as well as the impact that the number of within-person observations has on that stability. We repeated the analyses described in the previous sections, substituting the calculation of the iSD for the iM in each bootstrap sample, and calculating the test-retest correlations between iSD at each timepoint.
Results
How stable are iMs across one year and one week?
For each study, duration, and item, we computed the average correlation among the bootstrap samples at each number of observations from one to the maximum possible. These results are presented in Figure 1. The average one-year stability of iMs across all items achieved at the maximum number of observations was 0.57. This ranged from a low of 0.39, 99% CI [0.38, 0.40] for Relaxed in the PAIRS study to 0.68 [0.68, 0.69] for the Positive Composite in the Leuven study. The Leuven study had higher maximum reliabilities across shared measures with an average of 0.63 for Leuven and 0.52 for PAIRS. There was a notable difference for Relaxed, which showed a difference of 0.26 across studies. See Supplemental Table 8 for the maximum correlations for each item, study and duration. Stability of iMeans as a function of the number of observations. Each curve depicts the 99% confidence interval around the mean retest-correlation at each number of observations.
The average one-week stability of iMs achieved at the maximum number of observations for the PAIRS study was 0.55 with a minimum of 0.40 [0.39, 0.41] for Relaxed to 0.62 [0.62, 0.63] for Depressed. While one-week stability for most items in the PAIRS sample were comparable to one-year stability, a notable exception was for Negative Emotion, with a maximum average stability of 0.55 [0.54, 0.55] at one week and 0.41 [0.40, 0.42] at one year.
How many assessments are needed for stable iMs?
We estimate the minimum number of observations required to achieve an average stability of .50 (an intentionally low threshold for determining when a measure is stable) by taking the average stability across all bootstrap samples for each potential number of observations. Across items and studies, the average number of observations required to reach .50 was 14 with a range of 7–42.
How stable are iSDs across one-week and one-year, and how many assessments are necessary?
As with iMs, for each study, time duration, and item, we computed the average correlation among the bootstrap samples at each number of observations from one to the maximum possible. These results are presented in Figure 2. The average one-year stability of iSDs achieved at the maximum number of observations for each study was 0.36 with a minimum of 0.14 [0.13, 0.15] for Relaxed in the PAIRS study and a maximum of 0.60 [0.58, 0.60] for Positive Emotion in the Leuven study. The Leuven study had higher maximum stability across shared measures, with an average stability of 0.52 for Leuven and 0.20 for PAIRS. Again, these differences persisted when comparing each study at the same number of observations. Stability of iSDs as a function of the number of observations. Each curve depicts the 99% confidence interval around the mean retest-correlation at each number of observations.
The average one-week stability of iSDs achieved at the maximum number of observations for the PAIRS study was 0.33 with a minimum of 0.22 for Negative Emotion to a maximum of 0.41 for Depressed, notably higher than the one-year stability for iSDs in the PAIRS sample.
For items that achieved a stability of .50, the average number of observations required to reach a one-year stability of .50 was 42 with a range of 26–55. Notably, the only items that achieved a stability of .50 were from the Leuven study.
Discussion
The current study attempted to estimate the one-week and one-year stability of dynamic characteristics (intraindividual means and standard deviations) commonly extracted from ESM studies. Intraindividual means were moderately stable across both one week and one year, providing justification for their use and interpretation as stable individual differences. Indeed, the current results are comparable to estimates by extant research on the stability of measures of neuroticism and daily emotion (i.e., one-year stabilities between .35 and .67) (Fraley & Roberts, 2005; Hudson et al., 2017a). On the other hand, intraindividual standard deviations showed poor to moderate stability across either window of time, limiting their interpretation as stable traits.
While iMs were largely stable, there were some discrepancies in the stability of single items between the samples. For example, Relaxed showed the lowest stability of all items in the PAIRS sample, which was not the case for the Leuven sample. It is possible that the greater number of daily observations in the Leuven sample increased the likelihood of assessing participants during a time when they were able to be relaxed (i.e., multiple assessments in the evenings), but this was not explicitly tested. Accordingly, future work should examine the impact of assessment frequency and timing on the reliability and stability of these measures.
The single item measures of positive and negative affect showed divergent stability at longer-and comparable stability at shorter-timescales. Intraindividual means of the Positive Affect Composite across one year showed stability that was comparable to most other constructs, while the iM of the Negative Affect Composite showed lower stability than most other constructs. However, the iM of the Negative Affect Composite showed comparable stability across one week showed stability that was comparable to most other constructs. This is consistent with previous findings that daily positive emotion is more strongly related to trait- than state-dynamics compared to negative emotion, though both are moderately stable (Hudson et al., 2017b).
Across both studies, a one-year iM stability of .50 was achieved using an average of 14 observations (Leuven = 12, PAIRS = 16). In the PAIRS sample, a one-week stability of .50 was achieved using an average of 10 observations. These findings are concordant with those from Wang and Grimm’s (2012) simulation. This has direct implications for researchers who use ESM to assess intraindividual means: stable measures can be achieved with a relatively small number of observations per participant. Notably, the average study that collects 33 within person observations (e.g., Wrzus & Neubauer, 2023) should provide useful information about how much positive and negative affect people typically experience.
Intraindividual variability (iSDs) were less stable across one week and one year than iMs. iSDs from the Leuven study demonstrated moderate stability across one year, with an average test-retest correlation of .52 (using 80 observations); in the PAIRS sample, average one-year stability was substantially lower (.20 using 60 observations). The average one-week stability of iSDs in the PAIRS sample was slightly higher (.33). As in Wang and Grimm (2012), iSDs show consistently lower stability than iMs. However, in the current study, we find substantially lower stability for iSDs than in Wang and Grimm (2012).
These results shed some doubt on the notion that iSDs exhibit the qualities of stable, trait-like individual differences without careful attention to measurement. At the very least, iSDs should not be assumed to be characteristic of people, rather than merely descriptions of states, without further evidence that the stable component has been captured. Given that the standard errors of standard deviations are larger than the standard deviation of the mean, it is to be expected that iSDs would show lower stability than iMs at the same sample size (McNemar, 1962; Schmiedek et al., 2009).
Despite this, it may be the case that intraindividual variability is not a stable individual difference or that it is unrealistic to capture the stable component in a typical ESM study, and that it clarifies mechanisms of well-being and mood dysregulation (Houben et al., 2015). However, if measures of intraindividual variability characterize the moment more than the person, it will limit their predictive potential across time and attenuate relationships with future outcomes (McCrae et al., 2011). If researchers fail to find prospective relations between iSDs and future outcomes, it will be unclear whether those findings are evidence that intraindividual variability is not predictive of those outcomes or whether the measures captured mostly state-like fluctuations in affect that are not predictive across time because of features of the study the impacted measurement (Clark et al., 2003). They may falsely conclude that intraindividual variability doesn’t have predictive power, when the truth may be that they did not capture enough of the stable component to adequately test whether variability is related to distal outcomes due to insufficient sampling. In short, assuming that these measures capture stable characteristics of people when they more closely reflect people-during-a-specific-timeframe can lead researchers to draw false inferences about their results.
The studies differ in multiple ways, some of which may help explain their divergent results. While we did not systematically evaluate the impact of study differences on the stability of these measures, researchers may find it useful to evaluate their study plans to determine whether the data they expect to collect may be closer to the Leuven or PAIRS studies. Indeed, the Leuven and PAIRS study diverge in the one-year stability of the variability of the same items at the same number of observations, suggesting that the overall number of observations is not sufficient to explain differences in the average maximum stability. The Leuven study had notably higher adherence than the typical ESM study (Wrzus & Neubauer, 2023), and less attrition across waves than the PAIRS study. The PAIRS study, however, included more within-person observations over a longer period than the typical study (Wrzus & Neubauer, 2023). Additionally, the sampling intensity of the Leuven study (10 times per day) may have captured more meaningful variability in emotions than the PAIRS study (4 times per day). A limitation is that the current study does not address the impact that sampling frequency has on the stability of these measures but focuses on the total number of within person observations (Hopwood et al., 2022). For example, it may be the case that meaningful variability occurs over a shorter timescale and therefore benefits more from intensive sampling in a short window rather than sparse sampling over a longer time, whereas stable means can be obtained simply with a sufficient number of observations. Future research should examine the impacts of different sampling designs and study features on the stability of dynamic indices. Nonetheless, these results provide insight into the stability of emotion dynamics with similar items and sampling designs (Wrzus & Neubauer, 2023).
Conclusions
We find that intraindividual means derived from repeated measures of affect and personality show acceptable stability across one week and one year with relatively few within-person observations. However, intraindividual standard deviations show less consistent stability and may be more sensitive to factors like study design.
Supplemental Material
Supplemental Material - The stability of intraindividual means and standard deviations of affect
Supplemental Material for The stability of intraindividual means and standard deviations of affect by Ian Shryock, David M Condon and Sara J Weston in Personality Science
Footnotes
Author note
The handling editor was Dr Carolyn MacCann.
Acknowledgements
Data for the Leuven study were provided by the EMOTE Database.
Author contributions
Declaration of conflicting interests
The author(s) declared no potential conflicts of interest with respect to the research, authorship, and/or publication of this article.
Funding
The author(s) disclosed receipt of the following financial support for the research, authorship, and/or publication of this article: This work was funded by the National Science Foundation Grant BCS-1125553 (to Simine Vazire).
Data accessibility statement
Data from study 1 are available from the corresponding author upon request and data from study 2 are available at the EMOTE database.
Supplemental material
Notes
References
Supplementary Material
Please find the following supplemental material available below.
For Open Access articles published under a Creative Commons License, all supplemental material carries the same license as the article it is associated with.
For non-Open Access articles published, all supplemental material carries a non-exclusive license, and permission requests for re-use of supplemental material or any part of supplemental material shall be sent directly to the copyright owner as specified in the copyright notice associated with the article.