
Abstract
Background:
Primary fallopian tube carcinoma (PFTC) is a rare and poorly studied disease. Given its low incidence and evolving diagnostic classification, population-based data are essential to improve understanding of its prognostic determinants. This study aims to identify the clinical prognostic factors of patients with PFTC.
Materials and Methods:
Patients diagnosed with PFTC between 2010 and 2015 were selected from the Surveillance, Epidemiology, and End Results database. Univariate and multivariate Cox regression analyses were conducted to identify independent prognostic factors. Based on these factors, prognostic nomograms were developed to estimate 3- and 5-year overall survival (OS) and cancer-specific survival at the population level.
Results:
A total of 1241 patients were randomly assigned to the training cohort (n = 869) and the test group (n = 372). In the multivariate Cox regression, age (22–56, 57–71 and 72–92), race (White, Black, and Other), the International Federation of Gynecology and Obstetrics (FIGO) staging (I, II, III, and IV), and laterality (lateral and bilateral) were identified as independent prognostic factors for patients with PFTC. Finally, nomograms consisting of age, race, FIGO stage, surgery type, and lymphadenectomy were constructed. The area under the time-dependent receiver operating characteristic curve values for the 3-year/5-year OS were 0.730/0.750 in the training cohort and 0.726/0.803 in the test cohort.
Conclusions:
Nomograms derived from a large population-based cohort provide prognostic insight and risk stratification for patients with PFTC within a defined historical context. The identified prognostic factors serve as a reference for studies and warrant validation in contemporary cohorts and clinical trials.
Keywords
Introduction
Primary fallopian tube carcinoma (PFTC) is an uncommon gynecological tumor, accounting for 0.14%–1.8% of genital malignancies. 1 However, due to recent evidence suggesting that ovarian cancer and other pelvic cancers may originate from the fallopian tube, the actual incidence of PFTC might be underestimated.2–4 As a result, the true incidence of PFTC has likely been underestimated in earlier reports. A study analyzing United States Cancer Statistics data from 2001 to 2005, 2006 to 2010, and 2011 to 2014 revealed an increase in PFTC rates from 0.19 to 0.35 to 0.63 (per 100,000 women). 5 This trend likely reflects evolving diagnostic concepts and classification practices rather than a true epidemiological surge, further supporting the fallopian tube as a primary site of extrauterine pelvic serous carcinoma.5–7
However, the low incidence of PFTC means that only very limited data can be generated from a single institution. The available data describing PFTC often came from small case reports or series involving a limited number of patients treated over an extended period. 8 The lack of sufficient evidence makes it difficult to draw credible conclusions regarding the survival and prognosis of PFTC. 9 While most studies agree that the International Federation of Gynecology and Obstetrics (FIGO) staging is a powerful predictor, the impact of factors such as race, histology, histological grade, and laterality on the prognosis of PFTC remains controversial. Additionally, no study has yet evaluated the predictive performance of the new FIGO staging system (8th ed, 2017) on overall survival (OS) and cancer-specific survival (CSS) of patients with PFTC.
The linked Surveillance, Epidemiology, and End Results (SEER) database, a comprehensive population-based cancer registry, encompasses around 34.6% of the US population. Patient data from 17 diverse geographic regions across the United States help mitigate potential selection biases.
10
Importantly, SEER provides a unique opportunity to investigate rare malignancies such as PFTC within a defined diagnostic period using standardized coding and long-term follow-up. In this article, we assessed patients with PFTC who were diagnosed between 2010 and 2015 in the SEER database. This time frame was selected to ensure methodological consistency and sufficient follow-up for long-term survival analyses. Our objectives were to identify prognostic factors associated with OS and CSS and to develop and internally validate prognostic nomograms to provide population-level risk stratification and prognostic insight for patients with PFTC. These findings may inform future research and serve as a foundation for validation studies using more recent cohorts and prospective clinical trials
Materials and Methods
Patient selection
Patients of PFTC between 2010 and 2015 were identified from the SEER database using the SEER*Stat software (version 8.3.8). Cases diagnosed after 2015 were not included to ensure adequate follow-up duration and consistency with staging and treatment coding across the study period. The inclusion criteria were as follows: (1) the primary site label was “C57.0-Fallopian tube”; (2) confirmation of the first primary tumor through pathological biopsy; and (3) active follow-up. The exclusion criteria were: (1) lack of information on race, marital status, histology, histological grade, Laterality, the American Joint Committee on Cancer (AJCC) TNM staging system, lymph node metastasis, surgery type, lymphadenectomy, or chemotherapy; (2) unknown cause of death; and (3) patients died within 1 month or were followed up less than 1 month.
Patient enrollment and variable recode
Patients diagnosed between 2010 and 2015 were randomly assigned to the training and test cohorts in a 7:3 ratio. The training group was used to screen variables and construct the prognostic nomograms. The test group was used to validate the statistical results.
The data collected from the SEER database included age, marital status, race, histology, histological grade, FIGO staging, Laterality, lymph node metastasis, surgery type, lymphadenectomy, and chemotherapy. The surgery types were categorized as follows: (1) None, (2) Partial surgical resection, (3) Total surgical resection, (4) Surgery stated as “debulking,” and (5) Radical surgery resection (removal of the primary site along with other organs). The FIGO staging system was based on the AJCC cancer staging system (8th edition): (1) Stage I:T1a/1b/1c-N0-M0, (2) Stage Ⅱ: T2a/2b-N0-M0, (3) Stage III: T1/T2-N1-M0 or T3a/3b/3c-NX/N0/N1-M0, and (4) Stage IV: TX-NX-M1.
Statistical analysis
X-tile software (Yale University) was utilized to determine the optimal cutoff values. A chi-square test with a significance level of p < 0.05 indicated statistical significance between the groups. Univariate and multivariate Cox regression analyses were conducted to identify independent prognostic factors for PFTC. Variables with a p value <0.1 in the univariate Cox regression were selected for inclusion in the multivariate Cox regression, and variables with a value p < 0.05 in the multivariate Cox regression were considered as independent prognostic factors. Cox regression analyses, along with 95% confidence interval (CI) and hazard ratios (HRs), and chi-square test were calculated using SPSS software (version 22.0).
Nomograms were developed based on the clinical and statistically significant factors determined through multivariate analysis using R software (version 4.0.3). OS and CSS served as the endpoints for this study, calculated from the time of diagnosis to either death or the date of the last follow-up in November 2018. The prognostic nomograms were utilized to estimate the 3- and 5-year OS and CSS rates. These nomograms underwent both internal and external validation. The area under the time-dependent receiver operating characteristic curve (AUC) was used to assess the calibration accuracy of the nomograms. Generally, an AUC value greater than 0.7 is considered indicative of an accurate estimation. Calibration plots were employed to evaluate the calibration accuracy of the nomograms. To assess the clinical benefits and practicality, Decision Curve Analysis (DCA) was performed, comparing the nomograms with the FIGO staging system. Additionally, Kaplan–Meier curves and log-rank tests were employed to analyze survival differences among the variables.
Results
Clinical characteristics of patients
A total of 1241 patients of PFTC were randomly divided into the training cohort (n = 869) and the test cohort (n = 372). The clinical characteristics of patients are summarized in Table 1. The training, test, and total cohorts had no significant difference (p > 0.05). Patients aged 22–56, 57–71, and 72–92 years constituted 302 (24.3%), 662 (50.1%), and 317 (25.5%) of the total, respectively. Among them, there were 1050 (84.6%) individuals of White ethnicity, 75 (6.0%) individuals of Black ethnicity, and 116 (9.3%) individuals of Other races. In terms of marital status, there were 188 (15.1%) single individuals, 725 (58.4%) married individuals, 156 (12.6%) divorced or separated individuals, and 172 (13.9%) widowed individuals. The patient distribution by histological subtype revealed 1005 (81.0%) cases of serous carcinoma and 236 (19.0%) cases of nonserous carcinoma. Histological grading was as follows: 28 (2.3%) cases were Grade I, 70 (5.6%) were Grade II, 575 (46.3%) were Grade III, and 568 (45.8%) were Grade IV. The distribution of patients according to FIGO staging showed 193 (15.6%) cases in Stage I, 191 (15.4%) in Stage II, 661 (53.3%) in Stage III, and 196 (15.8%) in Stage IV. The distribution based on laterality revealed that 506 (40.8%) cases were left-sided, 580 (46.7%) were right-sided, and 155 (12.5%) were bilateral. The numbers of individuals with and without lymph node metastasis were 922 (74.3%) and 319 (25.7%), respectively. Among those, 526 (42.4%) did not undergo lymphadenectomy, while 154 (12.4%) had 1–3 lymph nodes dissected, and 561 (45.2%) had four or more lymph nodes dissected. The distribution based on surgical intervention was as follows: 4 (0.3%) individuals without surgery, 39 (3.1%) with partial surgery, 258 (20.8%) with total surgery, 455 (36.7%) with debulking surgery, and 485 (39.1%) with radical surgery. The distribution based on chemotherapy was 206 (16.6%) individuals with chemotherapy and 1035 (83.4%) without. In the univariate Cox regression analysis for OS and CSS, variables other than histology and chemotherapy had an overall p value <0.1 (Table 2). In the multivariate Cox regression analysis for OS, variables including age (22–56, 57–71, and 72–92), race (White, Black, and Other), FIGO staging (I, II, III, and IV), and laterality (lateral and bilateral) were statistically significant (p < 0.05) and identified as independent prognostic factors (Table 3).
Clinical Characteristics of Patients with PFTC

FIGO, the International Federation of Gynecology and Obstetrics; PFTC, primary fallopian tube carcinoma.
Univariate Cox Regression Analysis of OS and CSS in the Training Cohort

p < 0.05.
CI, confidence interval; HR, hazard ratio; OS, overall survival; CSS, cancer-specific survival; FIGO, Federation Internationale of Gynecologie and Obstetrigue.
The term "Reference" in these tables refers to the control or reference values used for comparison in our study.
Multivariate Cox Regression Analysis of OS and CSS in the Training Cohort

*p < 0.05.
CI, confidence interval; HR, hazard ratio; OS, overall survival; CSS, cancer-specific survival; FIGO, Federation Internationale of Gynecologie and Obstetrigue.
Development and validation of nomograms
Based on the forward stepwise (Likelihood Ratio) results from the multivariate Cox regression analysis, the model comprising age, race, and FIGO staging exhibited the lowest −2 Log Likelihood value within the training cohort. Nevertheless, it remains crucial to consider and discuss both clinical and statistical significance while screening variables for inclusion. 11 Therefore, we incorporated surgery type and lymphadenectomy into the prediction model, as they were the primary treatments associated with prognosis in clinical practice for patients with PFTC. As depicted in the nomograms (Fig. 1), each variable corresponds to a respective nomogram score, as listed in Supplementary Table S1. The total score corresponding to 3-year and 5-year OS and CSS of a patient was calculated using the nomograms. The AUC values for the 3-year/5-year OS were 0.730/0.750 in the training cohort and 0.726/0.803 in the test cohort. The AUC values of 3-year/5-year CSS were 0.725/0.748 in the training cohort and 0.732/0.799 in the test cohort (Fig. 2), indicating a high level of discrimination by the nomograms. Moreover, the calibration curves for both nomograms demonstrated good consistency between predicted and observed outcomes (Fig. 3). As mentioned earlier, the survival nomograms for predicting outcomes in patients with PFTC exhibited significant discriminative and calibrating capabilities. Furthermore, DCA curves illustrated that both nomograms provided greater net benefits compared with the FIGO staging system (Fig. 4).

Nomograms for predicting 3-year and 5-year overall survival

Time-dependent receiver operating characteristic curves for predicting the 3- and 5-year overall survival in the training

Calibration curves of 3-year
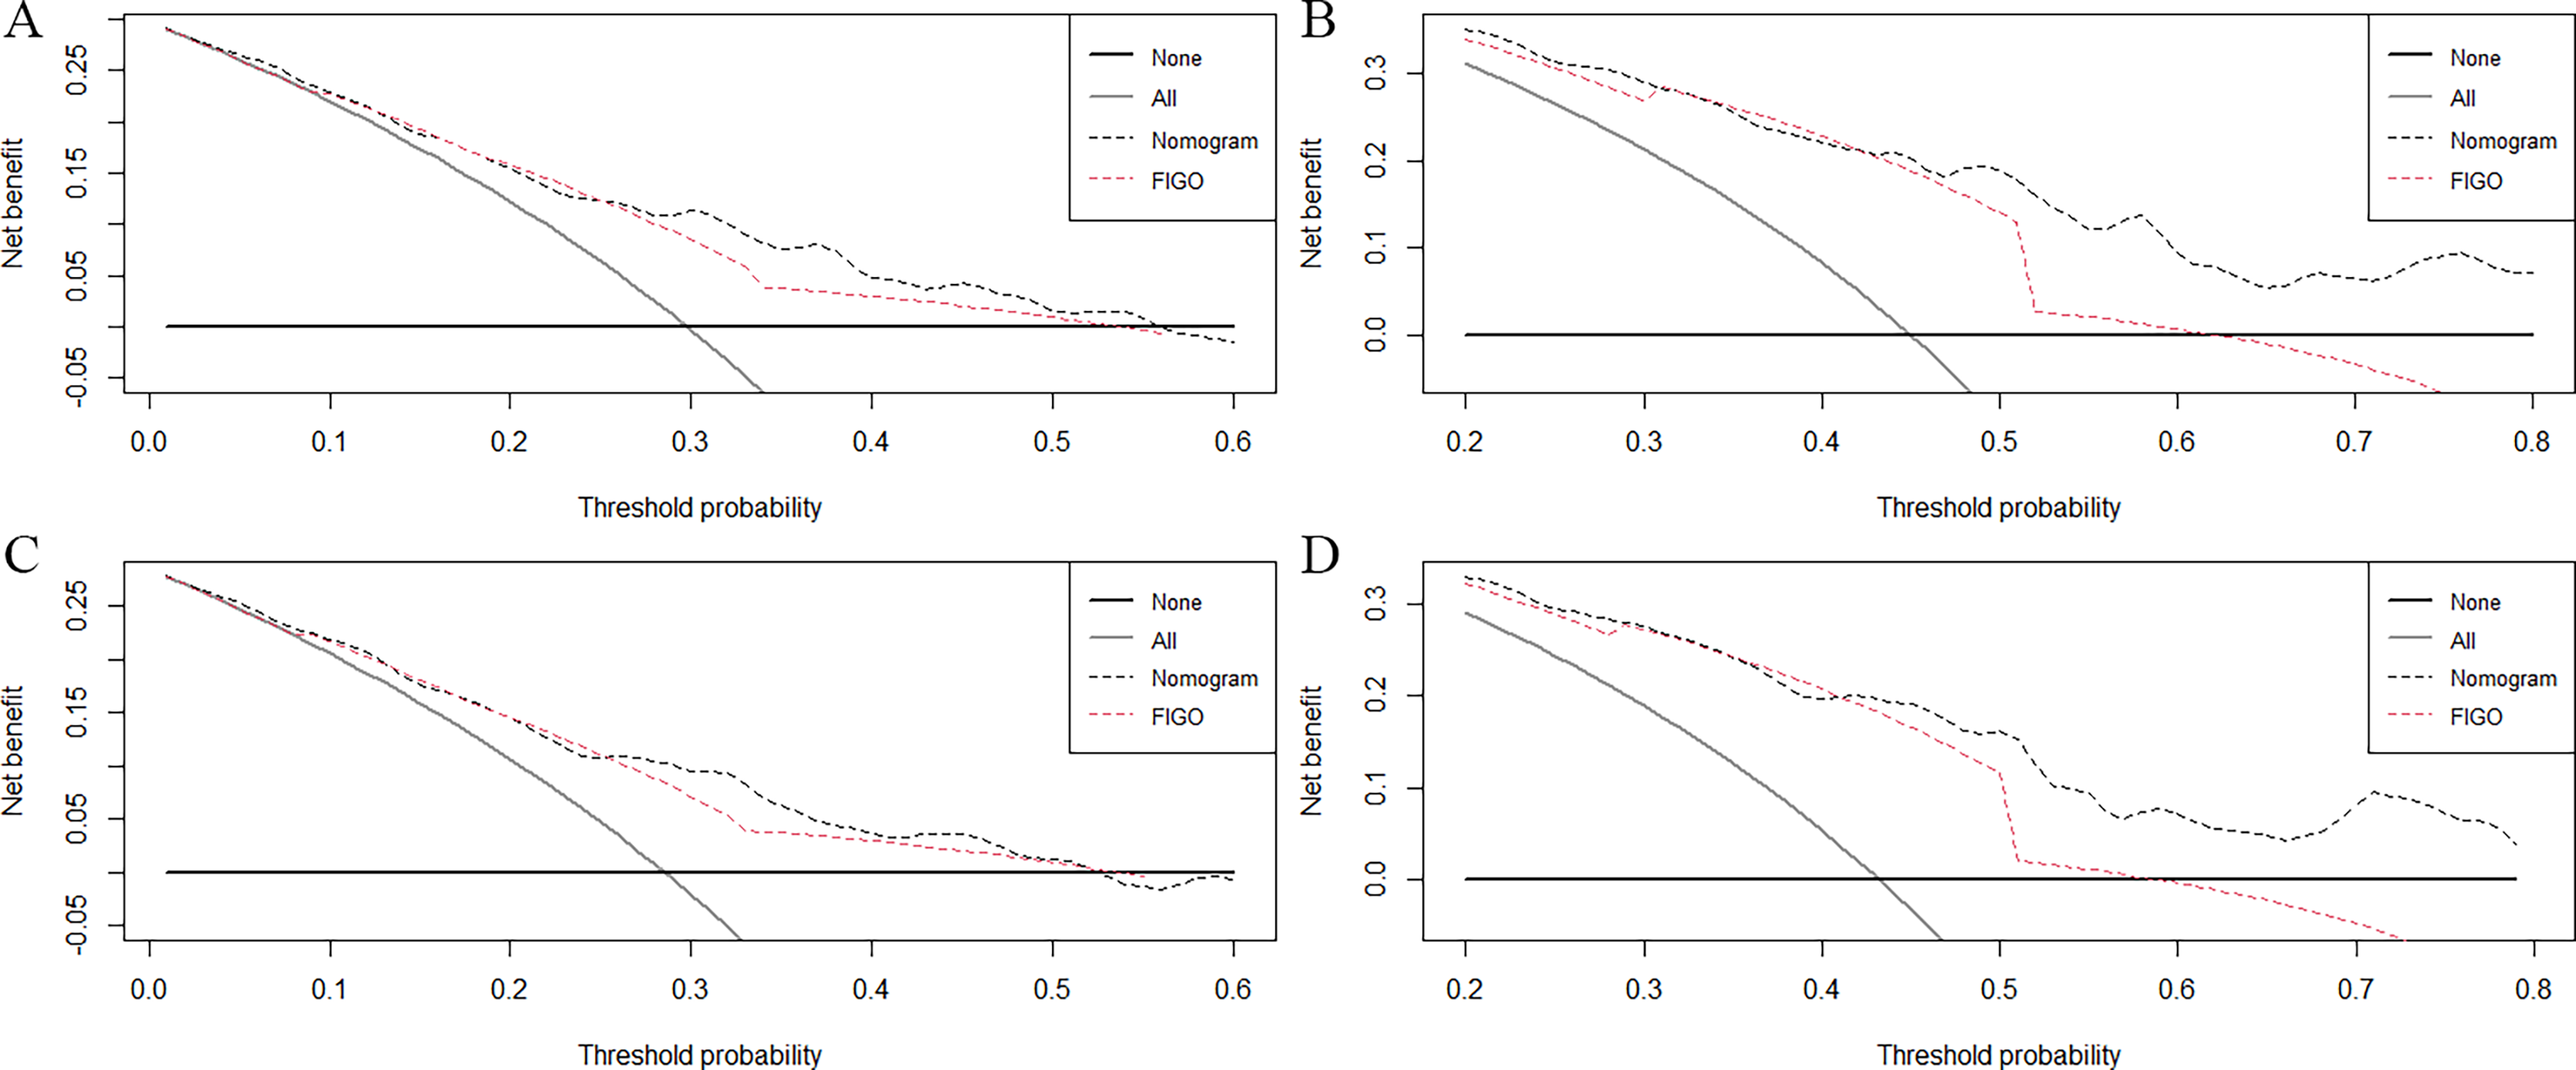
Decision curves analysis of 3-year
Kaplan–Meier OS curves
Kaplan–Meier analysis revealed significantly worse OS for patients with advanced FIGO stages (III–IV) compared with those with early-stage (I–II) disease (p < 0.001) (Fig. 5A). Patients undergoing radical surgery exhibited a markedly higher OS rate than those receiving debulking surgery (p < 0.05) (Fig. 5B). In terms of lymph node dissection, only the removal of more than three lymph nodes was associated with a significant improvement in OS (p < 0.05) (Fig. 5C). Age stratification based on Kaplan–Meier analysis identified 56 and 71 years as optimal cutoff values, with significant differences in OS across these age groups (p < 0.001) (Fig. 5D). Bilateral tumor laterality was correlated with significantly reduced OS compared with either left- or right-sided tumors (p < 0.001) (Fig. 5E). Additionally, White patients demonstrated a statistically significant lower OS compared with patients of other racial backgrounds (p < 0.05) (Fig. 5F).
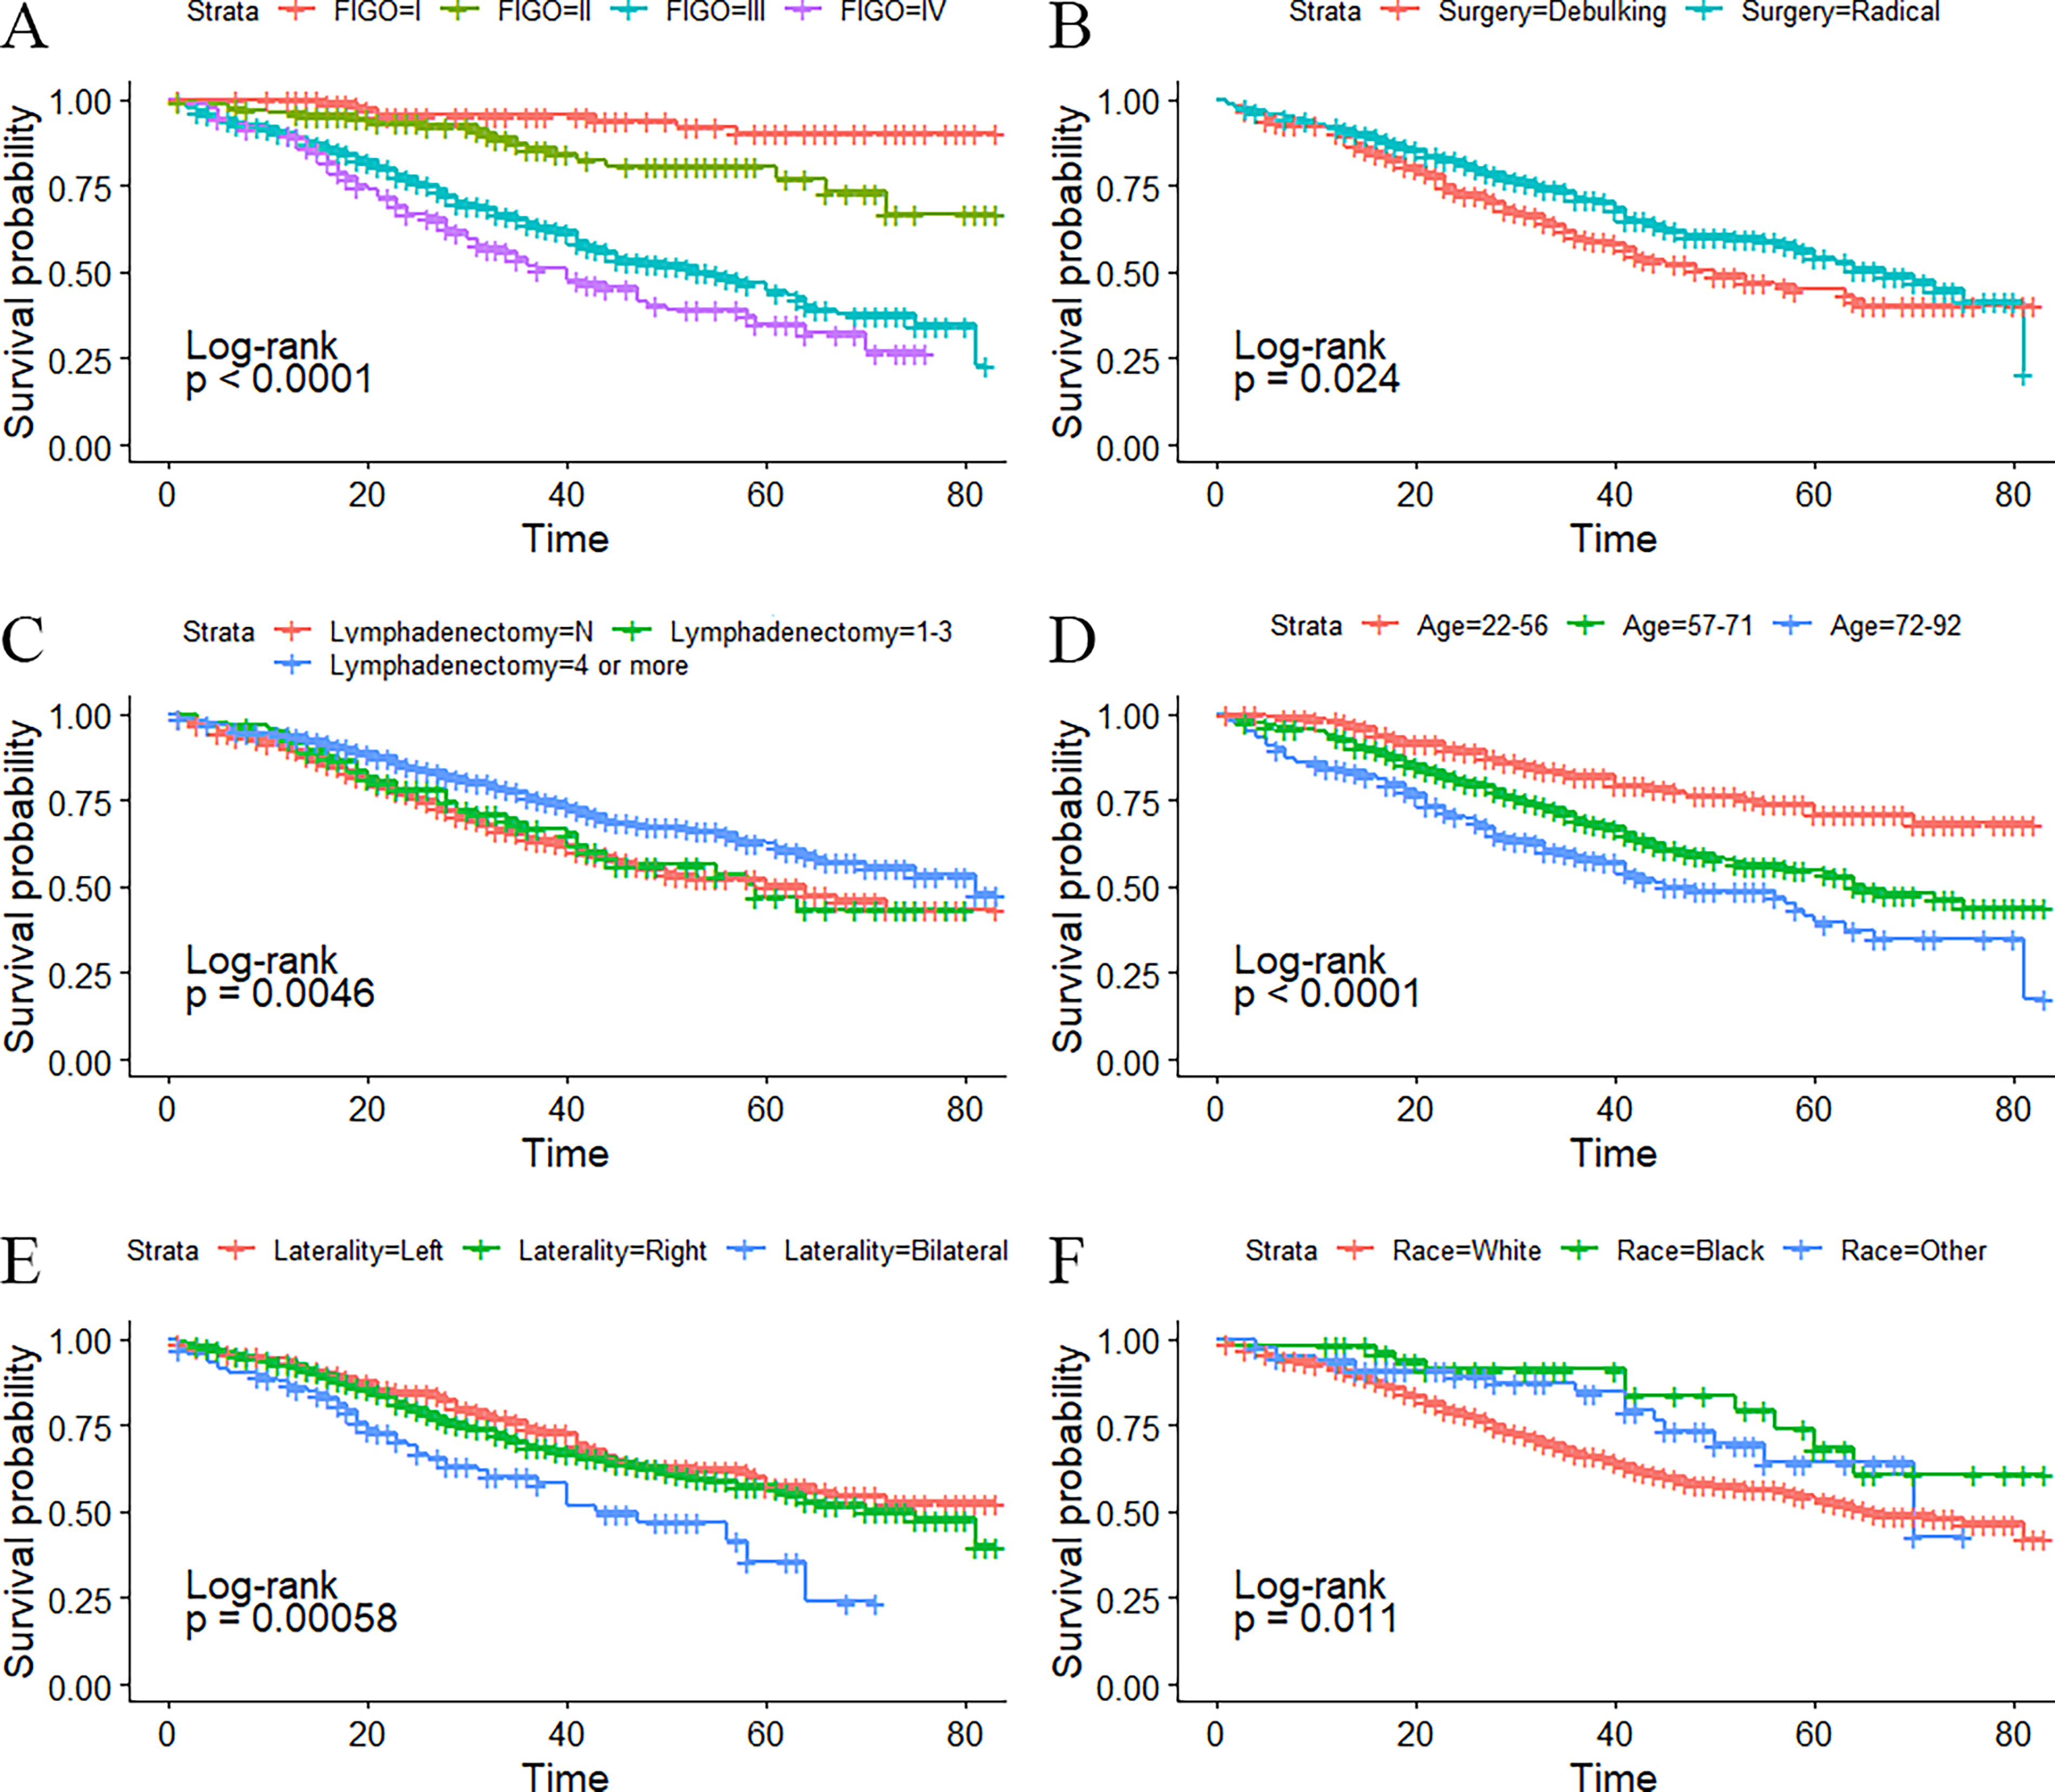
Kaplan–Meier overall survival curves of FIGO staging
Discussion
Due to the rare incidence of PFTC, few studies have investigated OS and CSS outcomes. This rarity may partly stem from historical diagnostic challenges and evolving understanding of the disease origin. Notably, a significant shift in diagnosing the primary site of high-grade serous tubo-ovarian carcinoma (HGSTOC) has occurred, with an increasing proportion being attributed to fallopian tube origin (PFTC) following the serous tubal intraepithelial carcinoma hypothesis and the implementation of College of American Pathologists criteria. 12 A large Commission-on-Cancer’s National Cancer Database study (2004–2021) documented a 6.1-fold increase in the proportional diagnosis of high-grade serous fallopian tube carcinoma (from 4.5% to 27.6%) within HGSTOC cases between 2004 and 2018, plateauing thereafter at approximately 28%. 12 This suggests that under contemporary diagnostic standards, up to 1 in 3–4 HGSTOC cases may be classified as PFTC. These evolving diagnostic practices imply that patients diagnosed with PFTC in more recent years may represent a broader and more heterogeneous disease spectrum than those diagnosed in earlier periods. Consequently, prognostic patterns derived from historical cohorts should be interpreted within their specific temporal and diagnostic context. To our knowledge, this is the first study to develop prognostic nomograms for predicting 3-year and 5-year OS and CSS in patients with PFTC based on a large population-based cohort. Rather than serving as definitive individualized prediction tools for contemporary clinical decision-making, these nomograms are intended to provide population-level prognostic insight and risk stratification within a clearly defined and methodologically stable historical cohort.
Our study demonstrated that age (22–56, 57–71, and 72–92), race (White, Black, and Other), FIGO staging (I, II, III, and IV), and laterality (lateral and bilateral) were independent prognostic factors for both OS and CSS in patients with PFTC. In published nomograms, variable selection is often based on clinical evidence and data availability rather than solely on statistical significance. 11 In our study, based on forward stepwise results from the multivariate Cox regression and considering clinical significance, the predictive model for OS and CSS includes age, race, FIGO staging, surgery type, and lymphadenectomy. As shown in Figure 1 and measured by standard deviation along with the nomogram scales, the top three prognostic factors were FIGO staging system, surgery type, and age, followed by race and lymphadenectomy. This is consistent with the results of most previous studies, where the most significant prognostic factors for PFTC were found to be FIGO staging and the extent of residual lesions after surgery.1,13–19
Kaplan–Meier analysis revealed that the 3-year/5-year OS and CSS of PFTC were similar, at 70.1%/55.4% and 71.7%/57.2%, respectively. Out of the total study participants, 369/396 (93.2%) patients died due to PFTC, emphasizing the paramount importance of addressing the cancer itself as the highest treatment priority for patients with PFTC. Similar to most studies, our investigation underscores that FIGO staging remains the most influential prognostic factor for patient outcomes.20,21 Specifically, the 3-year/5-year OS rates for patients with PFTC at stage I, II, III, and IV were 95.5%/90.4%, 85.9%/77.2%, 64.2%/44.3%, and 51.9%/35.2%, respectively. Additionally, the 3-year/5-year CSS rates for patients with PFTC of stage I, II, III, and IV were 96.4%/91.1%, 85.9%/77.2%, 66.0%/46.6%, and 54.6%/37.0%, respectively. Notably, the OS and CSS rates for advanced PFTC (stages III and IV) were significantly lower compared with those of early-stage PFTC (stages I and II) (p < 0.001) (Fig. 5A). After adjusting for the remaining confounding factors, the HR for stage III and IV compared with stage I was 7.104 (95% CI, 3.340–15.110) and 8.87 (95% CI, 4.056–19.409), respectively (Table 3). In a retrospective analysis involving 1576 PFTC patients diagnosed between 1988 and 2004, the 5-year OS rates for stages I, II, III, and IV were reported as 81%, 65%, 54%, and 36%, respectively. 8 Notably, the survival of patients with early-stage PFTC appeared to have improved, while the survival of patients with advanced-stage PFTC seemed to have decreased. Enhancing the survival rate of patients with advanced PFTC remains a challenging issue that needs to be addressed.
Numerous studies have indicated that achieving optimal cytoreduction and minimizing residual disease are pivotal prognostic factors for advanced PFTC.13,22 Notably, the definition of optimal cytoreduction has evolved over recent years, leaning toward a more radical surgical approach.23–25 This approach encompasses extensive upper abdominal procedures, such as diaphragm stripping and/or resection, partial liver resection, distal pancreatectomy, splenectomy, resection of tumors from the porta hepatis, and cholecystectomy. 26 In our study, the Kaplan–Meier analysis illustrated a significantly higher OS rate among patients with PFTC who underwent radical surgery compared with those who had debulking surgery (p < 0.05) (Fig. 5B). This effect may stem from the reduction of residual disease achieved through radical surgery. Peiretti et al. verified that employing more extensive surgical approaches correlates with an improved disease-free interval and extended survival in patients with advanced PFTC. 24 Nevertheless, it remains crucial to evaluate the patient’s suitability for radical surgery, taking into consideration quality of life concerns and striking a balance between oncological benefits and surgical interventions.27,28 Notably, Chi et al. discovered that the inclusion of extensive upper abdominal surgery in treatment strategies could significantly enhance the rate of primary optimal cytoreduction without considerably elevating perioperative morbidity and mortality.26,29 These studies collectively suggest that the fundamental principle of primary surgery for patients with PFTC revolves around achieving maximal macroscopic disease eradication. 24
PFTC is thought to exhibit a higher propensity for lymph node metastasis, attributed to its dense lymphatic network. 30 Klein et al. observed that patients with PFTC who underwent lymphadenectomy had a median survival time of 43 months, compared with 21 months for those who did not. 31 Furthermore, Kim et al. reported that lymphadenectomy could lead to increased OS and disease-free survival among advanced patients with PFTC. 24 Importantly, a recent large SEER-based study focusing specifically on early-stage PFTC confirmed that lymphadenectomy itself is an independent protective prognostic factor for both CSS and OS. 32 Crucially, this study employed X-tile analysis to determine the optimal threshold for the number of excised lymph nodes (ELNs) associated with improved survival. They identified ELNs > 11 as the significant cutoff point for adequate lymphadenectomy, with patients receiving ELNs > 11 (adequate lymphadenectomy group) demonstrating significantly longer mean CSS (p = 0.001) and OS (p = 0.002) compared with those with ELNs ≤ 11 (inadequate lymphadenectomy group). 32 Previous studies have reported the positive lymph node detection rates to range from 33% to 59%.1,14,30 In our current study, only 25.3% of patients exhibited positive lymph nodes, while 57.6% of patients underwent lymphadenectomy. A recent retrospective study of 61 patients with PFTC showed that the mean progression-free survival was 60.4 months in the lymphadenectomy group and 37.8 months in the no-lymphadenectomy group (HR, 0.374; 95% CI, 0.145–0.966; p = 0.042). 33 Kaplan–Meier analysis indicated that only the removal of more than three lymph nodes could significantly enhance the OS of patients with PFTC (p < 0.05) (Fig. 5C). However, in the multivariate Cox regression analysis, this difference did not attain statistical significance. This divergence most likely indicates the presence of confounding factors and selection bias. Patients who undergo more extensive lymphadenectomy may inherently have a better performance status, earlier-stage disease, or be treated at high-volume centers with more comprehensive surgical expertise—factors not fully captured or adjustable for in the SEER database. Therefore, the apparent survival advantage seen on univariate analysis may be attributable to these underlying patient and provider characteristics rather than the lymphadenectomy itself. Nevertheless, we continue to advocate for lymphadenectomy, as routine lymph node sampling and dissection are essential for accurate staging. 31 Additionally, Semrad et al. discovered that many patients with initially uncertain lymph node status later experienced relapse, possibly due to lingering lymphatic disease. 34
In a population-based study conducted by Stewart et al., a similar distribution was observed between left-sided disease (45.4%) and right-sided disease (42%), with bilateral involvement accounting for 7.7%. 35 In our study, we also observed a comparable distribution between left-sided disease (40.8%) and right-sided disease (46.7%), while bilateral involvement accounted for 12.5%. Limited research has explored the influence of laterality on the prognosis of PFTC. A retrospective study involving 36 PFTC patients reported that tumor laterality was a significant prognostic factor for predicting disease-free survival. Specifically, a diagnosis of left-sided disease was associated with a significantly increased risk of death (HR, 4.236; 95% CI, 1.37–13.10; p < 0.05). 15 However, our study findings indicated that while a diagnosis of bilateral disease significantly increased the risk of death (HR, 1.543; 95% CI, 1.084–2.195; p < 0.05) (Fig. 5E), there was no statistical difference between left and right involvement in predicting OS and CSS for patients with PFTC.
The prognostic significance of histology and histological grade for PFTC remains a subject of controversy. While some studies, including those by Rosen et al., Cabrero et al., and Hellstrom et al., argue that histological grade holds significant prognostic value, other research contradicts this finding.9,18,36–38 Although the majority of studies have not identified a prognostic significance linked to histology,1,8,14 Riska et al. demonstrated that the 5-year OS rate for patients with serous carcinoma was 37%, compared with 17% for those with nonserous carcinoma. 16 Moreover, Kietpeerakool et al. reported in their multivariate Cox regression analysis that patients with serous carcinoma had an approximately 7.5-fold higher likelihood of developing recurrent disease compared with patients with nonserous carcinoma. 39 However, our study did not reveal any association between histology and histological grade with the survival of patients with PFTC.
In our study, the optimal age cutoff points were identified as 56 and 71, which better stratified the OS of PFTC patients (Fig. 5D). The mean age at diagnosis in this study was 64 years, consistent with previous reports that indicate an average age of 64 years old.18,40 Age was determined to be an independent prognostic factor for both OS and CSS in patients with PFTC. The HR for death in women aged 57–71 years and 72–92 years, compared with those aged 22–56 years, was calculated as 1.525 (95% CI, 1.064–2.185) and 2.110 (95% CI, 1.416–3.144), respectively. Wethington et al. demonstrated that advanced age was an independent predictor of decreased survival in patients with PFTC, with an HR for death in patients older than 65 years of 1.78 (95% CI, 1.51–2.11). Additionally, Gadducci et al. found that older age (>58.5 years) was independently associated with poorer survival, with a HR of 2.3 (95% CI, 1.1–4.7). 14
As far as we know, this is the first study that incorporated race into the survival analysis and found that race was an independent prognostic factor for patients with PFTC. In this study, 84.6% of women with PFTC were White, and 6% were Black, which is similar with the results of Wethington’s study that 87% were White and 7% were Black. 8 The Kaplan–Meier analysis suggested that the OS of White patients is significantly lower than that of patients of other races (p < 0.05) (Fig. 5F). In the multivariate Cox regression, the HR for death of black women and other racial women compared with White women was 0.508 (95% CI, 0.266–0.972) and 0.598 (95% CI, 0.362–0.987), respectively. Our analysis identified race as an independent prognostic factor. However, we interpret this finding with caution. Race in epidemiological databases is likely a proxy for a multitude of underlying socioeconomic disparities, including differences in access to specialized health care, insurance status, cultural beliefs, timely diagnosis, adherence to treatment, and overall quality of care, rather than a biological determinant. The SEER database does not contain detailed variables to adequately adjust for these complex socioeconomic constructs. Therefore, the observed racial disparities in survival likely reflect systemic and health care inequities rather than innate biological differences. This highlights an urgent area for public health intervention to ensure equitable cancer care for all racial and ethnic groups. More research is needed to explore the impact of race on the prognosis of PFTC.
Although this study is strengthened by including a large number of patients, there are several limitations. As a retrospective study, it is prone to information bias, and directly deleting the missing data may increase bias. We employed a complete-case analysis, excluding records with any missing values for the variables of interest. While this is a common approach, it can potentially introduce selection bias if the excluded cases are not missing completely at random. This may limit the generalizability of our findings if the analyzed cohort is not fully representative of the entire patient population. Although sensitivity analyses using multiple imputation were considered, the pattern of missingness across multiple key variables made reliable imputation challenging. This potential for bias should be considered when interpreting our results. However, the population-based data can be seen as randomly distributed, which reduces bias to some extent. Furthermore, as the SEER database lacks information about chemotherapy regimens, recurrence, and cytoreductive status, we did not further analyze the effect of chemotherapy and recurrence on the prognosis. The volume of residual disease following primary surgery is arguably one of the most powerful prognostic factors in advanced-stage tubo-ovarian cancers. This omission likely introduces residual confounding and may alter the perceived importance of other included variables. The prognostic value of the factors we identified should therefore be interpreted within this context, and future models would be greatly strengthened by the inclusion of data on residual disease. Additionally, using different types of surgery to assess the cell cytoreductive status may introduce bias. Finally, it is important to note a key limitation of our study: the prognostic nomograms were developed and validated internally using data solely from the SEER database. Consequently, the generalizability of our models to populations from different geographic regions, health care systems, or with divergent ethnic distributions remains uncertain and warrants external validation. Nevertheless, the SEER registries, covering approximately 34.6% of the US population, are reasonably representative. The data of patients from a wide geographic distribution of 17 US regions minimize the potential selection biases. 10 However, our analysis is restricted to patients diagnosed between 2010 and 2015, a period chosen to ensure sufficient 5-year follow-up and methodological consistency. As the diagnostic classification of PFTC continues to evolve, our findings primarily characterize prognostic patterns within this specific historical context. External validation using more recent cohorts, including post-2016 SEER data as follow-up matures, will be essential to assess contemporary applicability.
Conclusion
In conclusion, age (22–56, 57–71, and 72–92), race (White, Black, and Other), FIGO staging (I, II, III, and IV), and laterality (lateral and bilateral) were identified as independent prognostic factors for PFTC in this population-based study. Using SEER data from a well-defined historical cohort, we developed nomograms to estimate 3- and 5-year OS and CSS, providing population-level prognostic insight and risk stratification. While these models enhance understanding of survival patterns in PFTC, their application to contemporary patients should be undertaken cautiously, and future validation using more recent datasets is warranted.
Authors’ Contributions
D.C.: Conceptualization (equal), methodology (equal), investigation (equal), formal analysis, and writing—original draft (equal); contributed to the study’s planning and design (equal), participated in fieldwork (equal), analyzed and interpreted the data (equal), and drafted the research article (equal). M.C.: Conceptualization (lead), methodology (lead), data curation (lead), formal analysis (lead), writing—review and editing (supporting), and supervision (lead); led the planning and design of the study, developed the data collection tool (lead), analyzed and interpreted the data (lead), and reviewed and revised the research article (lead).
Data Availability Statement
Publicly available datasets from the Surveillance, Epidemiology, and End Results (SEER) database were analyzed in this study. This data can be found here: https://seer.cancer.gov/data/.
Footnotes
Acknowledgment
The authors thank all the staff of the National Cancer Institute for their contributions to the SEER program.
Author Disclosure Statement
No competing financial interests exist.
Funding Information
This work was supported by Liu Liping Beilun District Famous Doctor of Traditional Chinese Medicine Heritage Studio and the Youth Project of Beilun District Health Technology Program, Ningbo, China (Grant No. 2025BLWSQN002).