
Abstract
The goal of this article was to integrate finite element analysis (FEA), multi-layer perception (MLP) and transfer learning based convolutional neural network (CNN) for predicting stiffness and strength of woven carbon-glass/epoxy pseudo ductile hybrid composites (PDHCs). To minimize the cost of experimental campaigns, research trends have shifted toward optimizing flight range, speed and battery capacity optimization of electric vertical take-off and landing (eVTOL) structure, as well as utilization of computational frameworks in mechanical property prediction and crashworthiness analysis. However, due to complex failure mechanisms of composites, it was very challenging to predict mechanical properties of PDHCs using conventional FEA. As such, it was very essential to train accurate machine learning model to reduce the hassle of computationally intensive FEA. The CNN model was trained using FEA geometric image dataset, achieving an accuracy of 89.77% and 90.91% sensitivity. The MLP model was trained to map CNN predicted images to detailed numerical outcomes demonstrating excellent convergence with validation and training losses of 0.060 and 0.062, respectively, using a 15-layer architecture with swish activation and regularization. The pseudo-ductile hybrid material developed had showed better performance with large plastic deformation resembling ductile materials. The stress strain response was dominated by carbon plies in linear elastic zone followed by gradual fragmentation, matrix cracking, fiber pull out and debonding with the outer glass plies arresting crack. The numerical comparison of FEM predictions were closely matched with the experimental data in the literature with absolute error less than 5% for tensile strength, tensile modulus, flexural strength and impact strength. The proposed approach gives an insight to overcome the limitations of conventional models for woven hybrids, enabling optimized PDHC design for electric vertical take-off and landing aircraft (eVTOL) applications.
Keywords
1. Introduction
Light weight high strength materials, especially fiber reinforced polymer composites (FRPCs) have found a wider acceptance in engineering applications 1 such as aerospace structures 2 like eVTOL as a primary and secondary load bearing structure. 3 Typical example of most commonly mentioned aircrafts in these area were Boeing 787 4 and Airbus 350 5 which utilize more than 50% composites in their structures advocating fuel efficiency. In fact, cost and manufacturing complexities were the critical hindering factors to fully apply these materials in conventional commercial aircrafts. Recent publications and technological news focused on a trend of optimal design, cost and manufacturing complexities. Beach craft starship was a fully functional business aircraft entirely built from composites. 6 Another demanding design concept of composite application has been in the development of eVTOL 7 so that flight range, speed and battery capacity can be optimized over with structural weight and integrity. This is because the emergence of urban air mobility (UAM), 8 also called air taxi, necessitates eVTOL design concepts as a practical and effective solution to address urban traffic congestion. 9 Some of already developed eVTOL design concepts include ZURI (Czech Republic), ATEA (France), CAVORITE X5 (Canada), CYCLOCAR (Russia), Starling Jet (UK), SOAR, ODYS and VIMANA (USA). 7 The major construction material in these eVTOL structure, including landing gear, were carbon fiber reinforced polymer composites and their hybrids. 7 To reduce cost and brittleness, it is required to develop a sustainable design and operation blending other composites with carbon fibers with comparable mechanical properties. Improving ductility nature of composites was one strategy to reduce brittleness. Pseudo ductility can be demonstrated using different carbon glass hybrid configurations. 10 These different configurations necessitate understanding material, mechanical and failure behavior. Furthermore, the focus of recent research trends in eVTOL relies on concept designs, battery life optimization and propulsion system instead of predictive models for mechanical property and failure of PDHC. The existing mechanical property prediction models mainly emphasize on analytical, numerical and experimental approaches. For instance, Hill developed a micro-mechanical semi-empirical model called Halpin-Tsai to estimate the composite modulus of different composite geometries assuming that the composite is a single fiber surrounded by a cylinder. 11 Halpin-Tsai model was modified by Nielsen to represent the maximum packing fraction of the inclusion material. The elastic modulus of two phase isotropic material based on the change in strain energy was predicted by Hashin and Shtrikman analytical model using upper and lower theoretical bounds. 11 These analytical models were meant to be considered for solid particles laminated unidirectional (UD) composite and Nielsen introduced a correction factor for hollow particles. In-plane properties of traditional FRPC UD laminates impregnated with matrix material were better than those properties in the thickness direction. 12 However, conventional analytical models have limitations on woven architecture. 13 For instance, Halpin-Tsai, Hashin-Shtrikman, and Nielsen models have shortcomings for woven architecture even if they are efficient for UD composites. Uniform fiber distribution and idealized cylindrical inclusion assumptions in Halpin-Tsai, Hashin-Shtrikman oversimplify micro-geometry which did not consider crimp induced stress concentrations in woven fabrics. 14 Out-of-plane stresses in woven architecture cannot also be addressed by Halpin-Tsai, Hashin-Shtrikman models. However, 3D shear lag-theory explicitly quantifies fiber-matrix interfacial shear and fiber breakage. 15 Woven composites show orthotropic property but Hashin-Shtrikman model only works for isotropic materials. 16 Shear-lag model was suitable for damage simulation, fiber fracture and matrix cracking overcoming the aforementioned limitations. Furthermore, shear-lag analytical model resolves 3D stress recovery which calculate load transfer between warp/weft yarns and matrix. 17 In addition to analytical models, finite element method (FEM) simulations represent a cost-effective approach to investigate the performance of composite materials. 18 FEM serves as a powerful tool to comprehend material behavior aiding optimal, advanced and efficient composite structure. 19 However, it is important to note that FEM can also entail significant computational expense. In this study, FEM and machine learning frameworks were integrated to address the limitation of each individual framework. Therefore, in this paper, woven carbon and glass fiber reinforced epoxy composite was studied, as this configuration offer a 3D reinforcement in a single layer and provide better mechanical properties in-plane and thickness direction, using computational approach. In fact, computational approaches refer to a broader concept encompassing mechanics-based and data-driven methods. 20 Mechanics based approaches involve continuum damage mechanics and discrete element methods which utilize analytical, numerical and experimental approaches. Whereas data driven methods involve machine learning and other statistical approaches. However, in this paper, computational approaches intended to refer to classical finite element based modeling (Abaqus/Ansys) and data driven machine learning models (CNN and MLP). Furthermore, the nobility of this paper lies not merely in the application of machine learning to composite modeling but in the coupling of material configurations, finite element simulations and deep learning surrogates to solve a long standing problems: accurate, efficient, and mechanically interpretable prediction of woven pseudo ductile hybrid response that provides both immediate engineering value and a new computational paradigm for the design of damage-tolerant, lightweight eVTOL structures.
2. Materials design
Woven composite material designs follows three different architectures: interlayer, intra-layer and intra-yarn.
21
Inter-layer hybridization is the simplest and lowest cost material design in which different types of layers alternatively stacked.
21
Modern manufacturing industries use conventional orthogonal inter-layer hybridization weave fabrics as they provide dual directional reinforcement in a single layer. In addition, inter-layer hybridization woven layers provide a more balanced properties in the fabric plane than UD laminate. Woven inter-layer hybridizations also showed better impact resistance than UD laminate.
22
The most common woven fabric weave architecture are twill, satin and plain weaves.
23
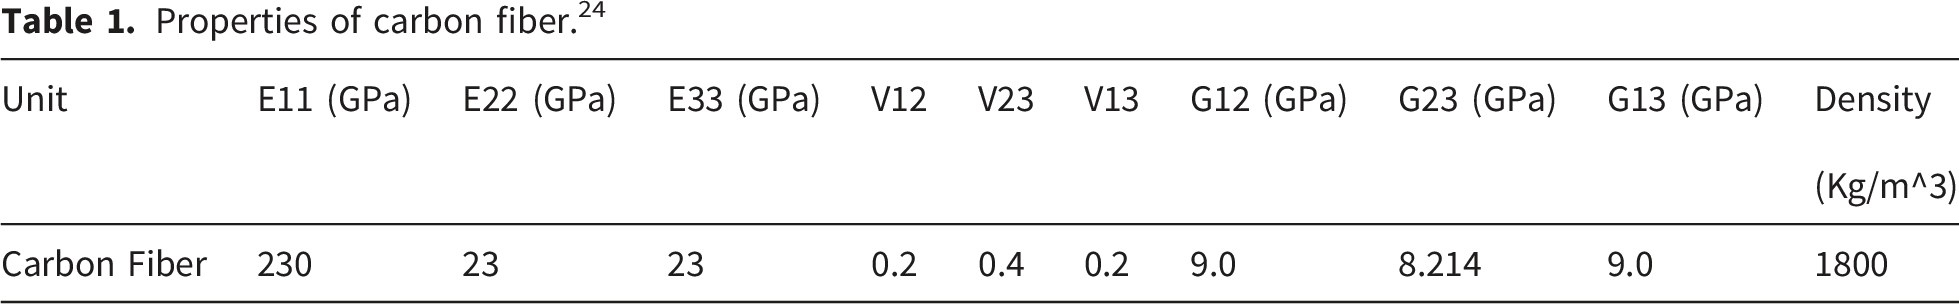
In this study, representative volume element (RVE) of twill woven carbon epoxy (TWCE) of 0/90° and ±45° orientation and plain woven glass epoxy (PWGE) of 0/90° and ±45° plies, Figure 1, and the stack of these plies, Figure 2, were used. Properties of carbon fiber, glass fiber and epoxy resin was taken from Tables 1–3, respectively. RVE of woven fabric weave architecture: (a) 0/90° TWCE ply, (b) ±45° TWCE ply, (c) ±45° PWGE ply and (d) 0/90° PWGE pre-impregnated ply. Schematic of 3D RVE. Properties of carbon fiber.
24
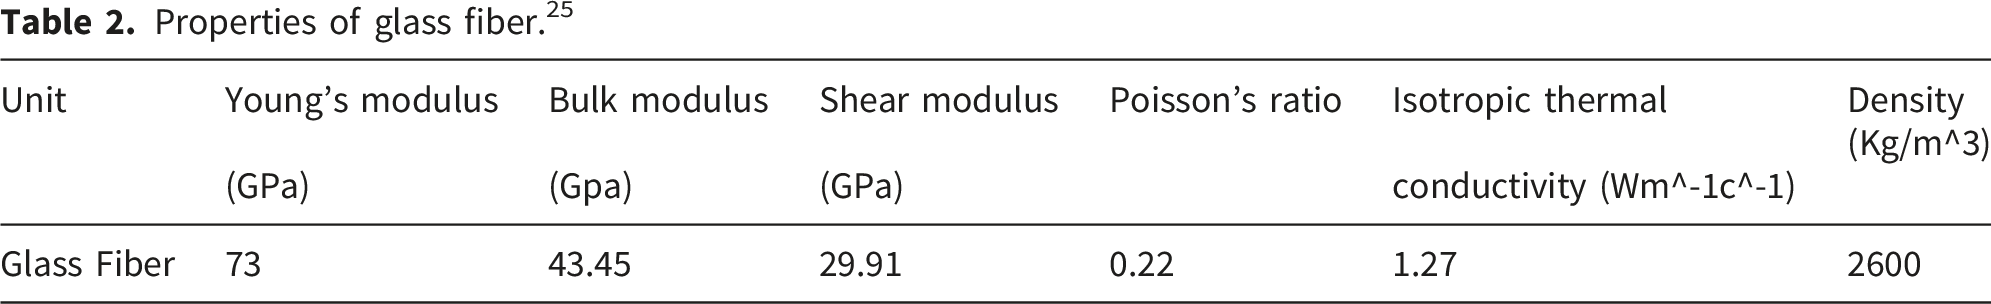
Properties of glass fiber.
25
Properties of epoxy resin.
25


In both carbon and glass epoxy plies, different fiber volume fractions were used. The in-plane stiffness (E1 and E2) has showed a direct relation with fiber volume fraction because load is transferred along a straight yarn paths. Crimp effect was induced in ±45° plies because of a further increase in fiber volume fraction than 0/90° plies which results in a reduction to shear modulus (G12 and G23). Thus, here, fiber volume fraction in the range of industry standards meeting ASTM D3171 requirements were used. Keeping this range in this pseudo ductility concept helps to control matrix yielding so that stiffness and ductility can be compromised.
3. Estimation of stiffness and strength properties
Predicting mechanical properties in PDHCs demand the use of micro-mechanical models, which bridge constituent and macroscopic properties. 26 Combining FEA and machine learning approaches enabled to attain computational efficiency of analytical models and complex image capturing attribute of numerical approaches.
3.1. Analytical models
Conventional micro-mechanical models fails to accurately predict the mechanical properties (e.g., elastic moduli) of woven composites as these models neglect crimp-induced stress concentrations. 27 For instance, those models that work based on the rule of mixture, like Voigt model assumes longitudinal loading conditions of composites 27 without considering transverse loading. Similarly, Reuss model considers only transverse loading scenario. Fiber undulation, bridging and Mosaic models were also used to predict the mechanical properties of woven composite. 22 However, Mosaic model idealizes assemblage of pieces of asymmetric cross-laminates assuming constant stress and strain conditions. 22 Using parallel and series models, the Mosaic model removed crimp and simplified 2D laminate stiffness. It utilized Hook’s law to generalize stress-strain conditions for orthotropic woven composites. The mean and covariance of the stiffness matrix were calculated by splitting the composite into two off-axis sub-composite. 28 Okabe 29 predicted the ultimate tensile strength of macro-composite using shear-lag model by examining the micro-mechanical behavior of UD composites and weak link scaling technique. The 3D shear-lag model studied by 29 and 30 ignores axial matrix stiffness and focused on isotropic materials. Therefore, in this paper, the existing study of 29 was extended using RVE numerical example addressing orthotropic composite. This RVE numerical example contains orthotropic woven composite in which shear loading was applied in XY, YZ and XZ planes so that longitudinal, transverse and thickness direction of RVE model can be evaluated. In this RVE model the longitudinal and transverse model represent fiber element whereas the thickness direction represent matrix element, Figure 2. Woven material design configuration was selected for this study because it provides better mechanical properties in longitudinal, transverse and thickness directions. 12 The top layer of RVE was 0/90° plain woven pre-impregnated glass epoxy ply in which the warp and weft fibers were aligned in the x and y direction, respectively. In the second top layer of 3D RVE, a ±45° twill woven pre-impregnated carbon epoxy ply was designed in which warp and weft fibers were aligned to x and y axes at ±45°, respectively. In the second bottom layer of RVE, a 0/90° pre-impregnated twill woven carbon epoxy ply was configured in which the warp and weft were aligned along x and y axes, respectively. The bottom layer of RVE element was ±45° plain woven pre-impregnated glass-epoxy ply in which the warp and weft fibers were aligned at ±45° to x and y axes, respectively, Figure 2. In this 3D RVE woven element, carbon fiber provides majorly stiffness and glass fiber provides majorly ductility. For instance, the dual role of carbon and glass fibers were presented by 31 highlighting carbon fibers predominantly contribute to stiffness and glass fibers enhance ductility. The stiffness matrix can be calculated for layers of 3D spring element designed in this study, Figure 2. For a similar spring element, Okabe has calculated the stress of broken fiber at the interface of slip region. 30 In addition, the slip length was calculated by Kelly-Tyson 32 and modified Cox 33 analytical models. Stresses of fiber elements can be estimated applying geometric boundary conditions due to tensile loading composite strain. Localized stress concentration on broken fibers adjacent to matrix cracks is the product of stress concentration and average stress of adjacent fibers 34 in which tensile strength distribution was determined using Bimodal Weibull distribution (BWD). In this study, 3D shear lag finite element analysis was used considering the RVE model as an orthogonal spring network to overcome the limitation of conventional models and integrated with machine leaning models to resolve stress transfer between yarns and interfacial shear elements addressing both thickness direction stresses and stochastic fiber breaks.
3.2. Numerical models
Numerical method is a powerful tool to understand properties of materials in aerospace, marine and renewable energy applications.
11
Because, it reduces the need for costly experimental tests as it simulates the performance and failure of structures as it appears to be in real working environment. It also speeds up material development process by investigating the relationship between structures and their material properties. For instance, a user defined numerical model was implemented by Zhu et al. on ABAQUS/Explicit platform to simulate the damage evolution in carbon glass hybrid composite based on micromechanics failure criteria.
21
However, the study considered bending stress. In fact, the real structural application could face a multitude of tri-axial loads. This is because, due to crimp induced stress concentrations, woven composites exhibit tri-axial stress fields.
35
Interfacial bonds between layers controls the thickness direction stress and delamination initiation.
36
To address this limitations, 3D orthogonal woven carbon/glass hybrid epoxy composite was used, Figure 3, because conventional models fail to capture thickness direction stress fields as described by.
37
The RVE has a significance in simulating the microstructure of engineering materials aiding the predictive performance of microstructural composites.
38
For instance, the RVE of carbon Nano-tube (CNT) reinforced epoxy composite was used to investigate the equivalent elastic properties using MATLAB and ANSYS finite element simulations.
39
In this study, ANSYS numerical model was used to create material designs and estimate stiffness and strength. ABAQUS numerical model was also used considering a mesoscale discretization of 100586 C3D10 elements. The constituent elements of stacked plies, were plain glass fibers (PGF) and twill carbon fibers (TCF), cured epoxy, and pre-impregnated plies, Figure 3. RVE of constituent elements: (a) Fibers (b) Epoxy after cure (c) Pre-impregnated plies (d) RVE of stacked plies.
3.3. Machine learning models
Machine learning models were the hottest topic in current mechanical property prediction research trends.
40
This is because machine learning models are highly reproducible rapidly uncovering data relationships.
41
For instance, Mengze et al.
40
used CNN-MLP model to predict mechanical properties of carbon fiber. The necessity of large dataset for accurate mechanical property prediction was the challenge for these models. Recent studies have used dataset created from FEA. For instance, a 1401 lattice structure were generated from finite element analysis by
42
to investigate, analyze and predict mechanical properties of auxetic double arrow head lattice structures. However, training machine learning model over heterogeneous data is the limitation in most of the current research studies. To address this limitation, integrated transfer learning based CNN model trained on 120 number of elements in the dataset for each class and MLP deep neural network trained over 141 number of elements in the dataset were used to predict the geometric mode supposed to go for further structural analysis and linear and non-linear structural analysis result, respectively. The dataset for training CNN model can be generated from numerical simulations, Figure 4. For instance, Yang et al.
43
has used dataset obtained from numerical simulations to train back propagation artificial neural network. Chen et al.
44
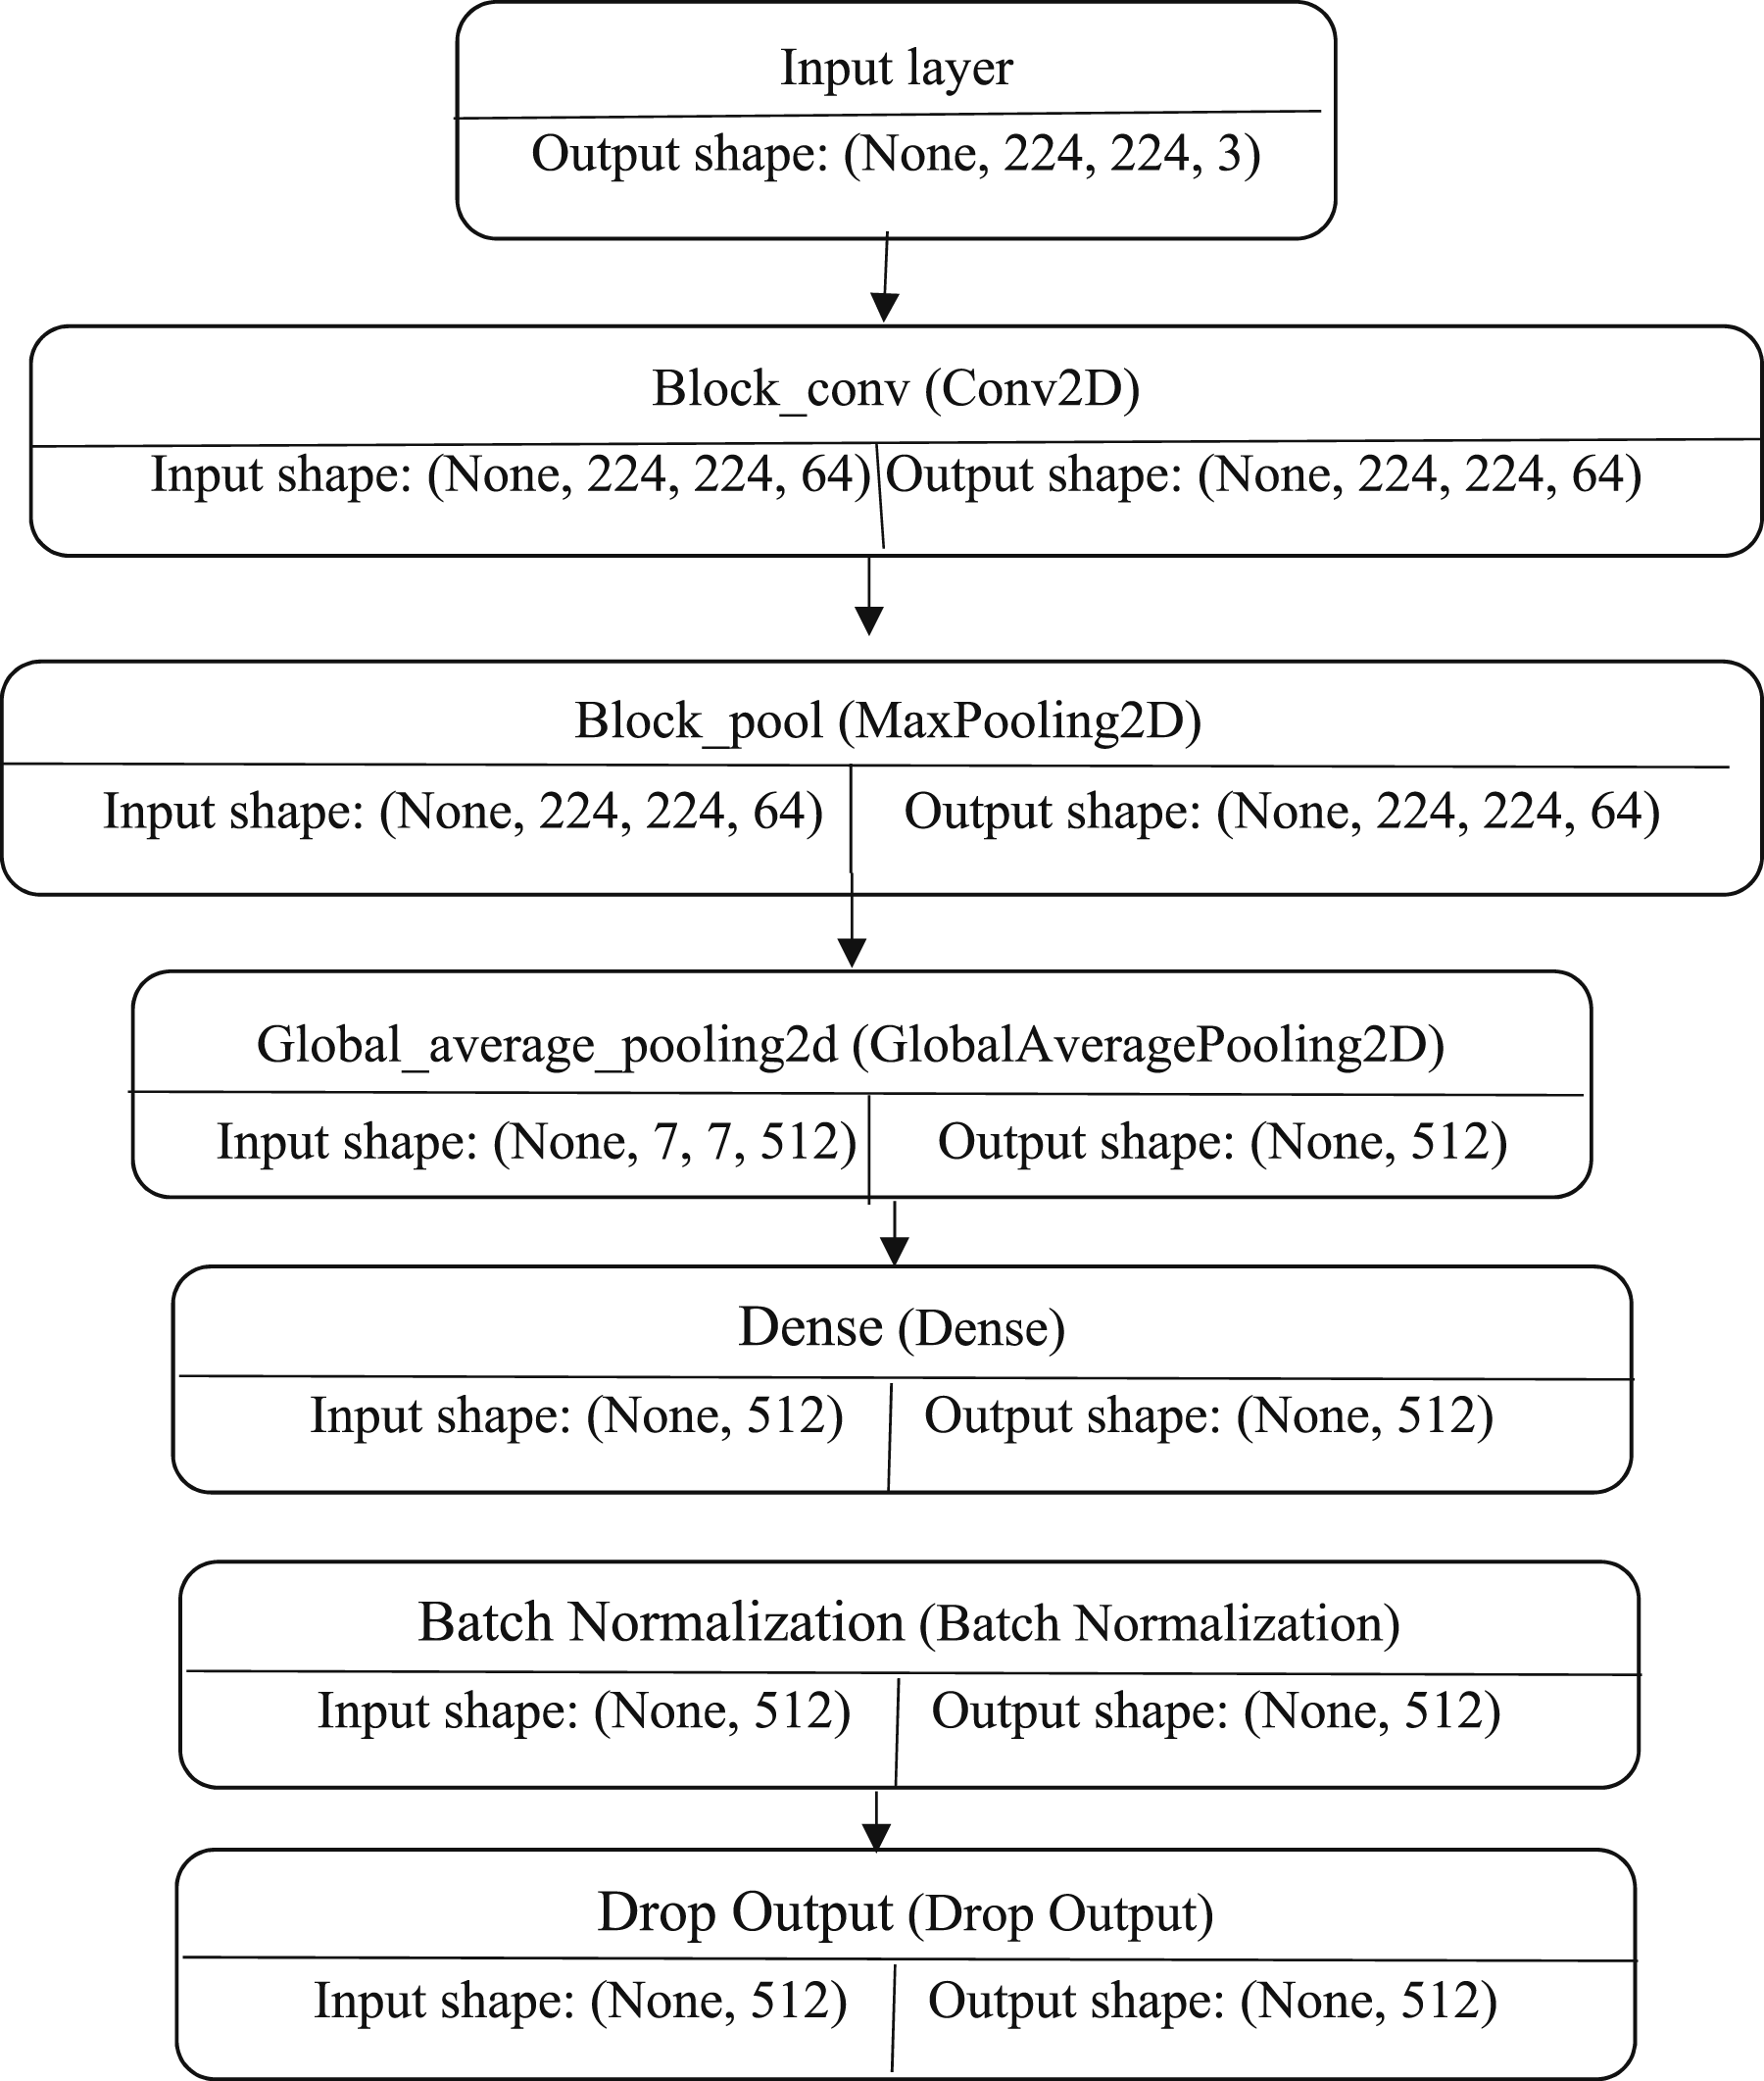
has also used dataset generated from simulation model for training machine learning and optimization. The architecture of CNN model developed has input layers, convolutional hidden layers, pooling layers, batch normalization and dense drop out layers, Figure 5. The visual geometry group (VGG16)
45
was initialized in the beginning of CNN architecture to preprocess the geometric model. Hidden layers were included in the CNN program using ReLU activation and softmax, Table 4. Rectified linear unit (ReLU) is an affine linear function used in each hidden layer to construct a linear logical graph
46
and at last softmax function was used to convert prediction scores into probablities. The pseudo code, Table 4, showed VGG16 has used a number of convolutional 2D block layers, pooling layers, ReLU and softmax. A similar CNN architecture was used by Simonyan et al.
47
and Chakrabarti et al.
48
The VGG16 image classification algorithm was used to achieve the accuracy of about 96.8%.
49
Sample of geometric models used for training and validating CNN model: (a) ±45° PWGEC, (b) ±45° PWGEC of higher Vf, (c) 0/90° PWGEC, (d) PWGF, (e) 0/90° PWGEC of higher Vf, (f) ±45° TWCEC, (g) 0/90° TWCEC, (h) Stacked plies, (i) 0/90° PWGEC of lower Vf. Architecture of CNN model. Pseudo code for CNN model.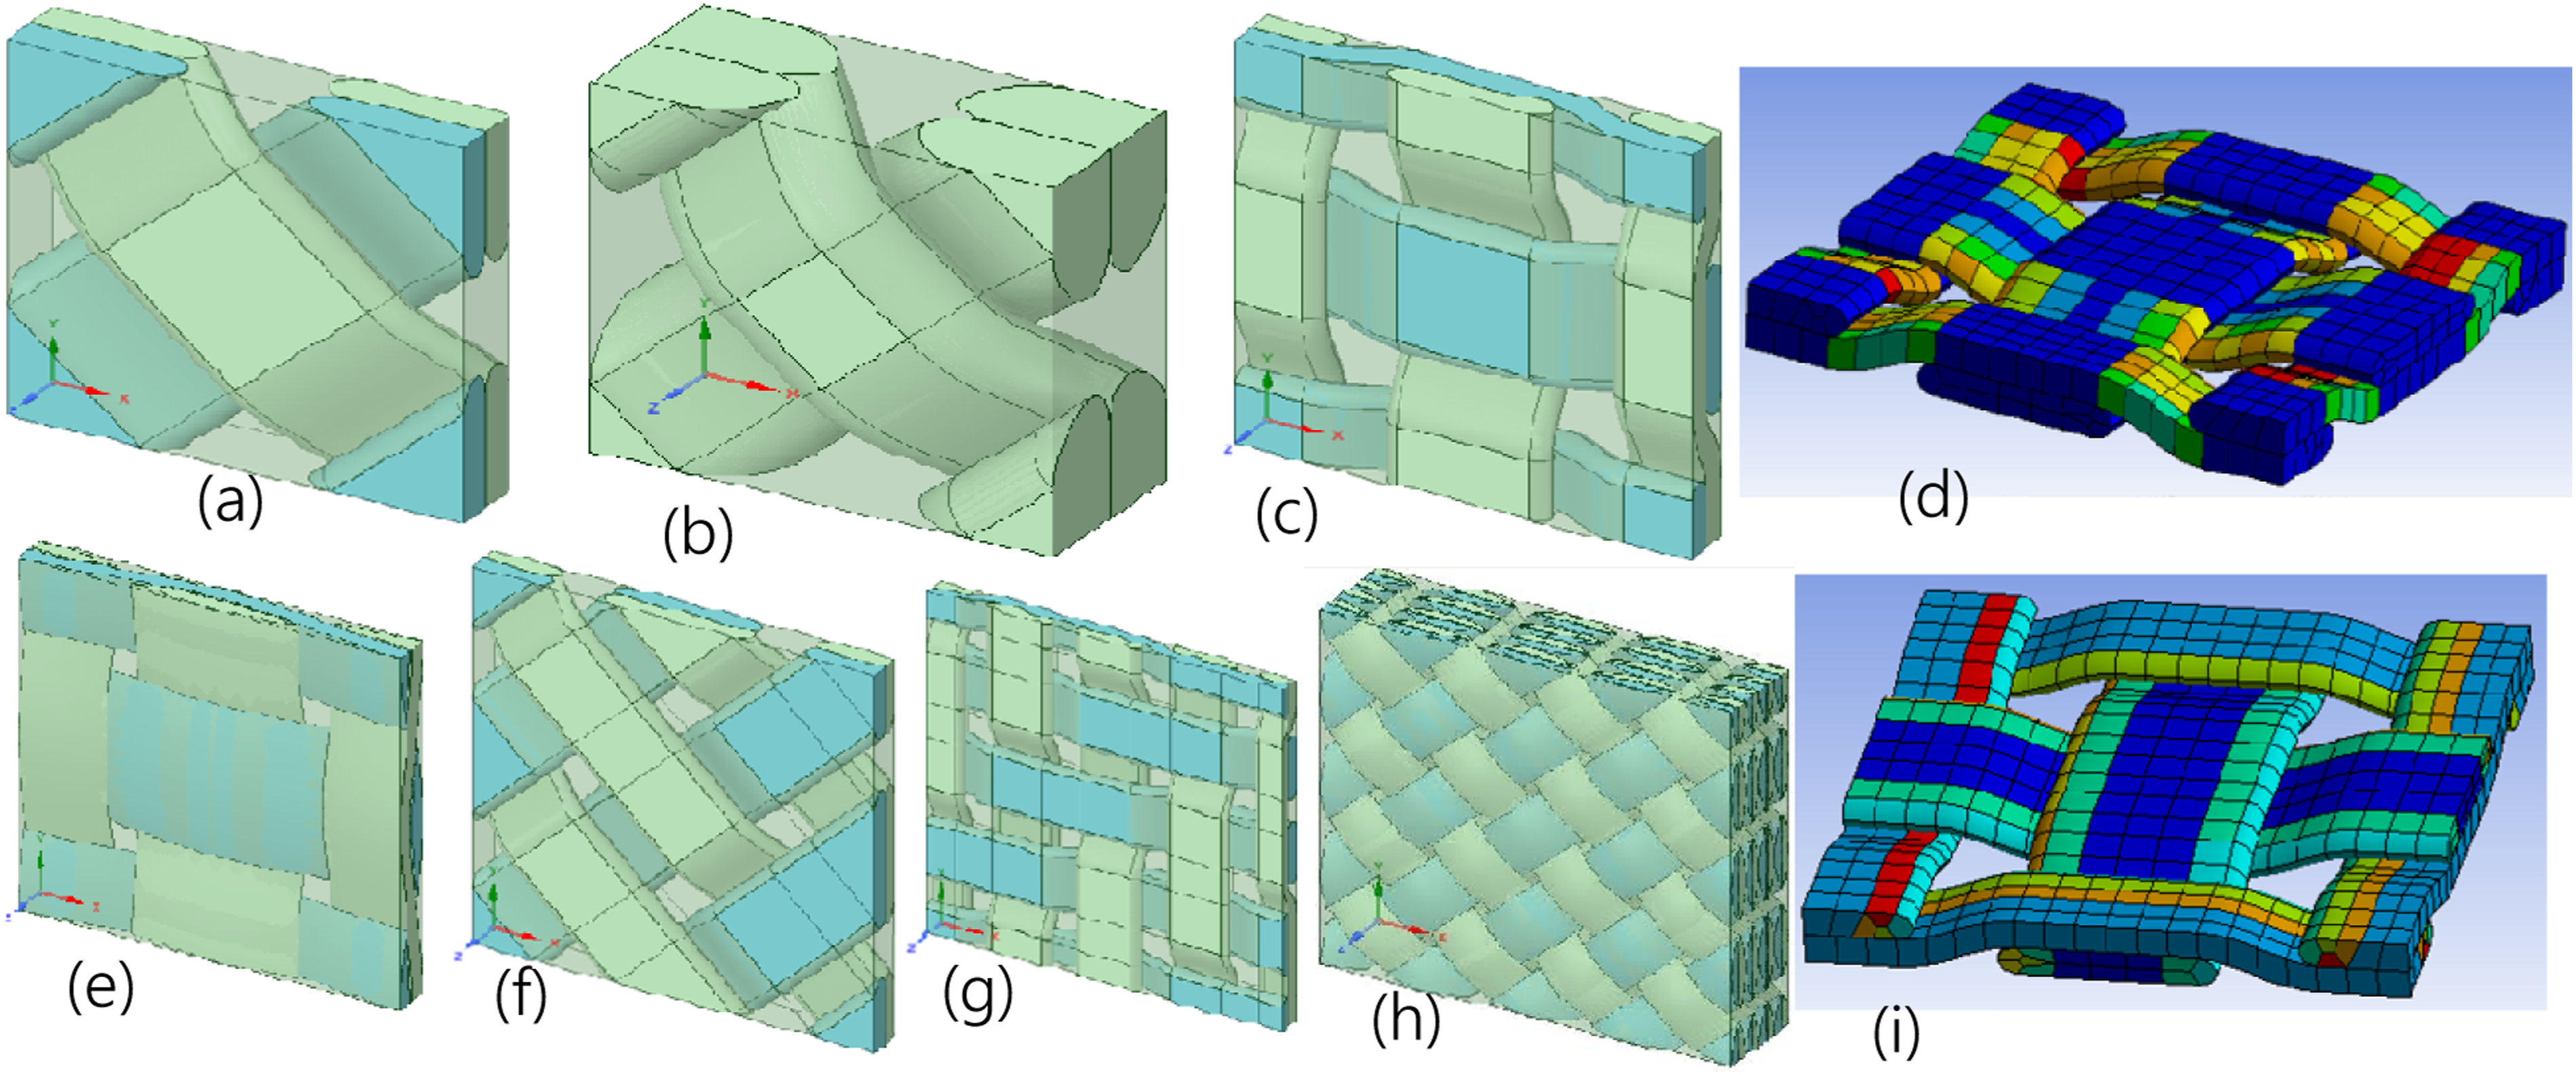

Flask app was integrated in the CNN architecture to develop GUI, Figure 6. The GUI helped to test the trained model by browsing the files ready for testing the model. This GUI was opened on web page using local servers created by integrating flask app with html files. For instance, Rybarova et al.
50
has demonstrated the capabilities and extensions of flask frame work in deploying python web apps. Flask app graphical user interface (GUI) opened in local server.
The sequential feedforward multi-layer perception (MLP) neural network has input layer, dense layer, regularization and normalization, model configuration, data preprocessing, training and flask integration, Figure 7. Adaptive moment estimation (Adam) optimizer was used to train the MLP model. In the literature, the most effective algorithms for deep neural networks training is Adam optimizer.
51
In MLP model architecture, early stopping was used to avoid overfitting, Table 5. Early stopping was proven to be superior regularization method and is being widely used and implemented as it is simple to understand.
52
The model learning rate was dynamically adjusted using ReducedLROnPlateau. It is a hyper parameter fine tuning scheduler adjusting the learning rate.
53
Furthermore, model check points were used to evaluate prediction scores. For instance, Titsias et al.
54
has used check points to detect distributional changes on future data predictions. The flask app integration to model architecture was also carried out to develop GUI so that the trained MLP model can be tested, Figure 8. MLP model architecture. Pseudo code for MLP model. GUI of MLP model created on local server using flask app integration.


4. Results and discussions
All results consider RVE created in the materials design process and stiffness and other mechanical properties (including shear strength and reaction force) were discussed in the following sub-sections.
4.1. Results
ply level properties of carbon epoxy and glass epoxy woven composites.

The warp and weft yarns were oriented at a ±45° angle to the direction of global loading in a ±45° glass woven fabric. However, the orientation of the yarns regarding the global axes slightly changes when a small shear angle (in-plane rotation) was applied. The angle between the loading direction and fiber direction was among the major factors that impact the elastic moduli of UD composite. For instance, Bhuiyan et al. 56 showed the variability of strengths at different loading angles considering stochastic fiber morphology.
When the global loading direction and fiber direction were different, stress tensor transformation was crucial to obtain elastic properties in the rotated coordinate system.
57
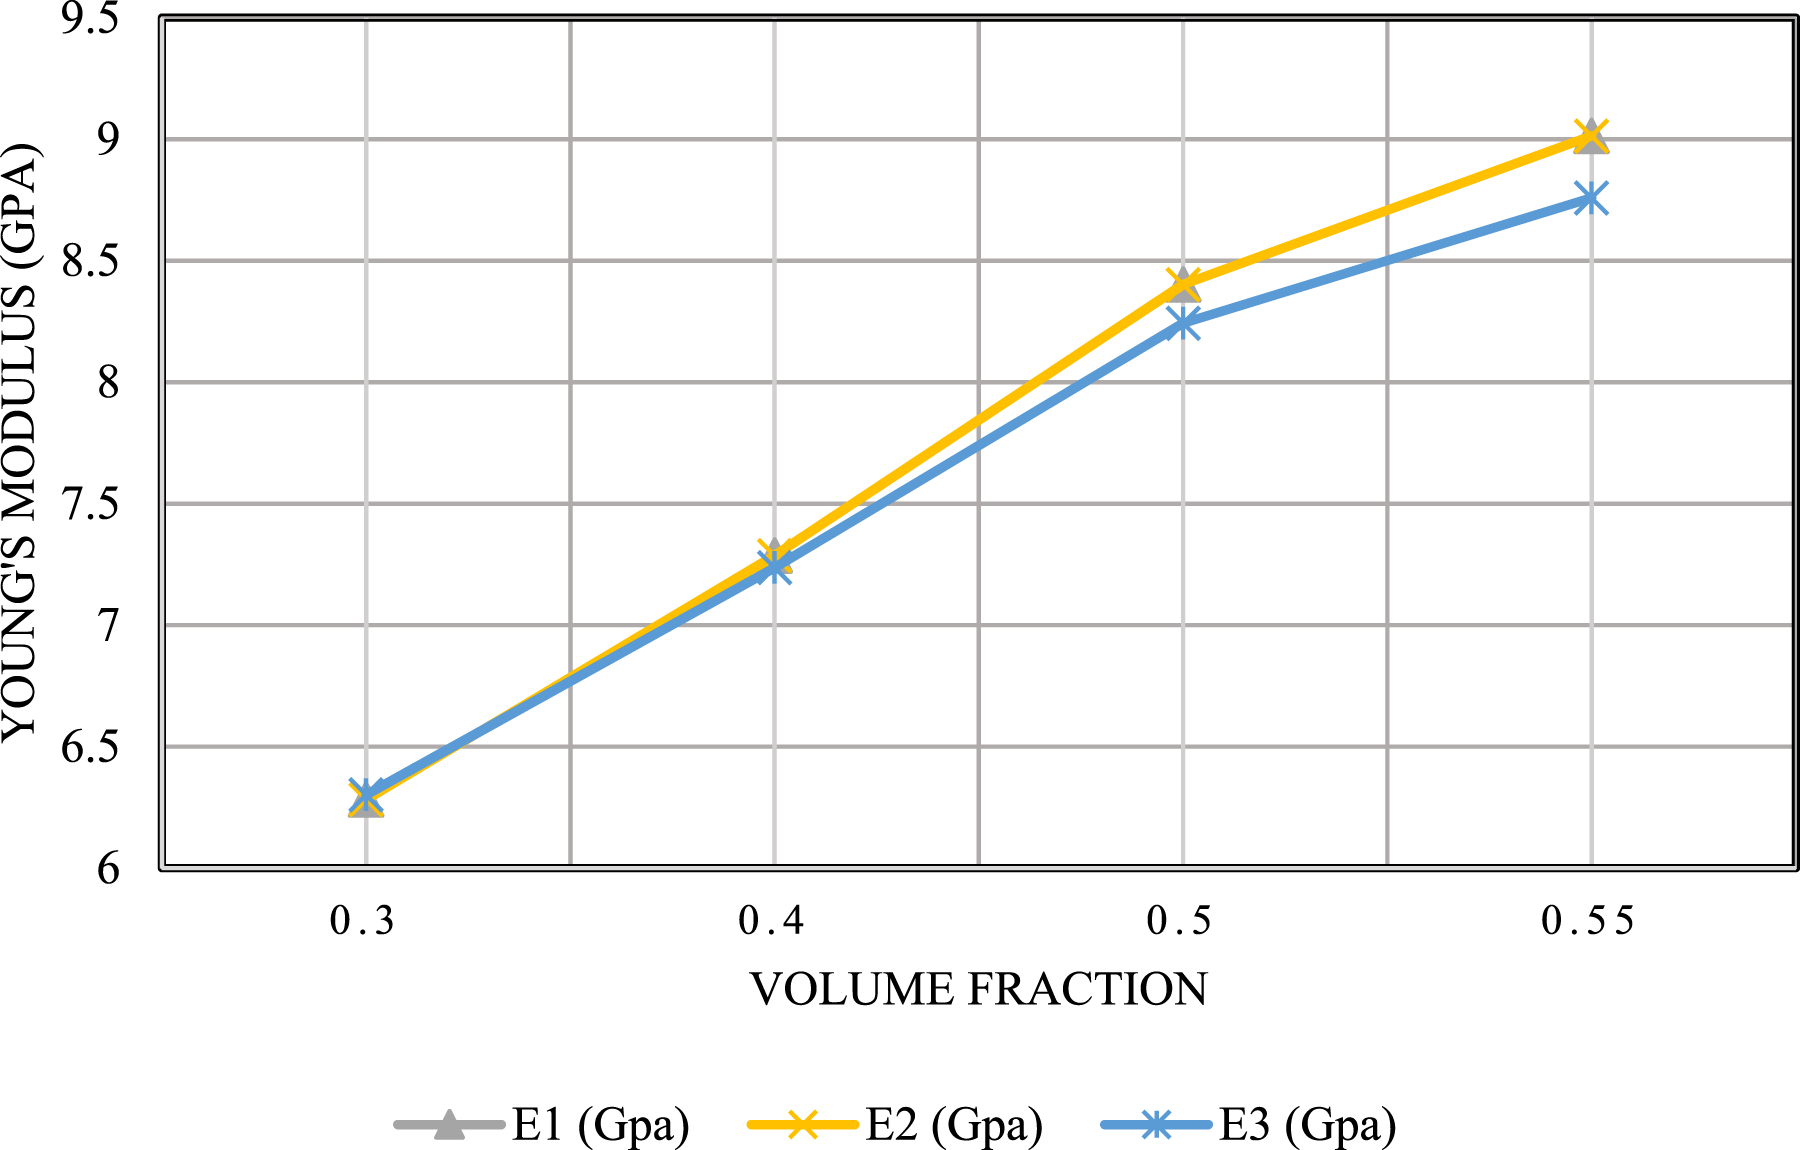
The elastic modulus E1 has increased when the shear angle slightly increased from 0 to 0.7°, Figure 9, in which the fiber angle regarding the global axes was at 44.65° when shear angle was 0.7°. When there was a misalignment between fibers and loading direction, transverse modulus decreases. That is why E2 was decreasing when shear angle varies from 0 to 0.7°, Figure 9. The thickness direction stiffness, E3, was less sensitive to in-plane orientation of yarns in the fabric so that E3 remains constant, Figure 9. When the fabric fiber angle reduces by 0.35° from ±45°, the shear angle was 0.7°. When the fiber direction was aligned with the loading direction, the load transfer efficiency was high. Bending stresses can be reduced at yarn crossovers when crimp undulation amplitude decreased. The fibers had symmetric orientation at ±45° with regard to global axes. Due to this, E1 and E2 had the same magnitude at 0.4 and 0.5 fiber volume fractions, Figure 10. Whereas the through thickness E3 has also shown an increasing trend like E1 and E2 when fiber volume increased from 0.4 to 0.5. This is because E3 was also influenced by fiber content even if it was dominated by matrix content. However, its magnitude was relatively lower than E1 and E2, Figure 10. In general, stiffness increases as fiber volume fraction increased with in the industry range because fibers, even though off-axis, carry significant amount of load in the fiber direction. The shear moduli G12, G23 and G31 remained constant for a slight change in shear angle. Although G12 was greatly affected by the fiber and loading direction, it showed negligible change for a minimal change in shear angle. The out of plane shear moduli G23 and G31 were related to the thickness direction. As a result, they were less affected by in plane rotations. The other reason why G12, G23 and G31 were constant across a slight change in shear angle is that shear angle was below the critical reorientation limit. Unless otherwise, shear moduli was affected by matrix type and content, fiber type and content and the interface between them. For instance, Huang et al.
58
has investigated that fibers, matrix and fiber-matrix interface could affect shear moduli. As volume fraction increased from 0.4 to 0.5, G12, G23 and G31 increased, Figure 11. Increasing fiber volume fraction creates stiffer fabric as far as it was in the optimum range (industry range), which increase the overall shear moduli. The in-plane shear moduli G12 had a relatively higher magnitude because the fibers were oriented at ±45° to the loading axes. Effect of shear angle on young’s modulus of ±45° PWGE ply. Effect of volume fraction on young’s modulus of ±45° PWGE ply. Effect of volume fraction on shear moduli of ±45° PWGE ply.

In 0/90° plain woven glass epoxy, a small change in shear angle (from 0 to 0.7°) has not changed the fiber angle with respect to the global axis (loading direction). As a result, elastic young’s moduli remains constant. This is because, stress tensor does not show a change for a small shear deformation. Small shear deformations does not change fiber orientation relative to global axes. When there was a small change in shear angle (≤0.7°), the shear moduli (G12, G23 and G31) remains the same. The reason behind this is that the fiber orientation remains the same. The loading direction and the fiber direction has a minimal angle change (≤0.35°).
Homogenization approach was used to mix the proper ratio of fiber and matrix in the development of RVE, Figure 3. As fiber volume fraction increased from 0.4 to 0.5, E1, E2 and E3 increases for 0/90° plain woven glass epoxy composites, Figure 12. As the loading direction almost aligns with the fiber direction in the longitudinal and transverse direction, E1 and E2 have nearly the same magnitude. Effect of volume fraction on young’s moduli of 0/90° PWGE ply.
The increase in fiber volume fraction has contributed comparatively smaller influence on the thickness direction elastic moduli, Figure 12. Increasing volume fraction reduces the matrix contribution to G12. As a result, G12 showed an increasing trend in the graph, Figure 13, as volume fraction increases from 0.4 to 0.5. This is because increasing fiber volume fraction reduces matrix volume fraction and makes a stiffer fabric. For instance, Annika et al.
59
showed an increased shear moduli with increased fiber volume fraction. Shear deformation causes asymmetric fiber reorientation, according to the basic mechanics of twill woven ±45° glass epoxy composite. Shear deformation creates rotational symmetry and directional stiffness effects.
60
As the fibers get the warp direction, E1 increases. As the fibers become less aligned with the weft direction, E2 falls, Figure 14. The in-plane reorientation does not show any effect on E3 in the z-direction. The effect on shear moduli is negligible for a small rotation from ±45°. Because the shear moduli is a function of deviation from ±45°. The shear moduli (G12. G23 and G31) are relatively insensitive to small deviations from ±45° and the graph shows constant shear moduli. Effect of volume fraction on shear moduli of 0/90° PWGE ply. Effect of shear angle on young’s moduli of ±45° TWCE ply.

Due to increased fiber content as fiber volume fraction increased from 0.4 to 0.5 in a twill woven carbon epoxy composite, E1, E2, and E3 increases, Figure 15. As volume fraction increases, shear moduli increases, Figure 16. The fiber volume fraction increment contributes more to G12. Because as volume fraction increases, the fabric become tighter. For instance, Toll et al.
61
showed high volume fraction weaves and mats are stiffer. In another study, volume fraction was used to estimate elastic moduli and to create stiffer fabric using the rule of mixture.
62
It has been also investigated by different scholars that increasing fiber volume fraction from 30% to 60% increases mechanical properties of polymer composites. Effect of volume fraction on young’s moduli of ±45° TWCE ply. Effect of volume fraction on shear moduli of ±45° TWCE ply.

For instance, Yang et al. 63 has studied that the mechanical properties was improved when fiber fraction increased from 30% to 60%. Fiber volume fraction not only influence stiffness and strength but also fatigue. 64 Barnett et al. 65 has showed the significance of fiber volume fraction on the properties of composite materials.
Composite strength remains independent of fiber volume fraction when it falls below 30%. For 0/90° twill woven carbon epoxy ply composite, elastic moduli E1, E2 and E3 remains constant for a small variation of shear angle (≤0.7°). This is because the fiber and loading direction in the warp and weft direction has a minimal misalignment. The warp and weft in 0/90° twill woven carbon epoxy remains fixed resisting rotation under small shear strains. As a result, the shear moduli G12, G23 and G31 remains almost constant as shear angle increased from 0.0 to 0.4°. As volume fraction increases, elastic moduli (E1, E2 and E3) showed a significant improvement for 0/90° twill carbon epoxy composite, Figure 17. The increase in moduli could be due to twill rib effect and crimp constraint as presented by.
66
Effect of volume fraction on young’s moduli of 0/90° TWCE ply.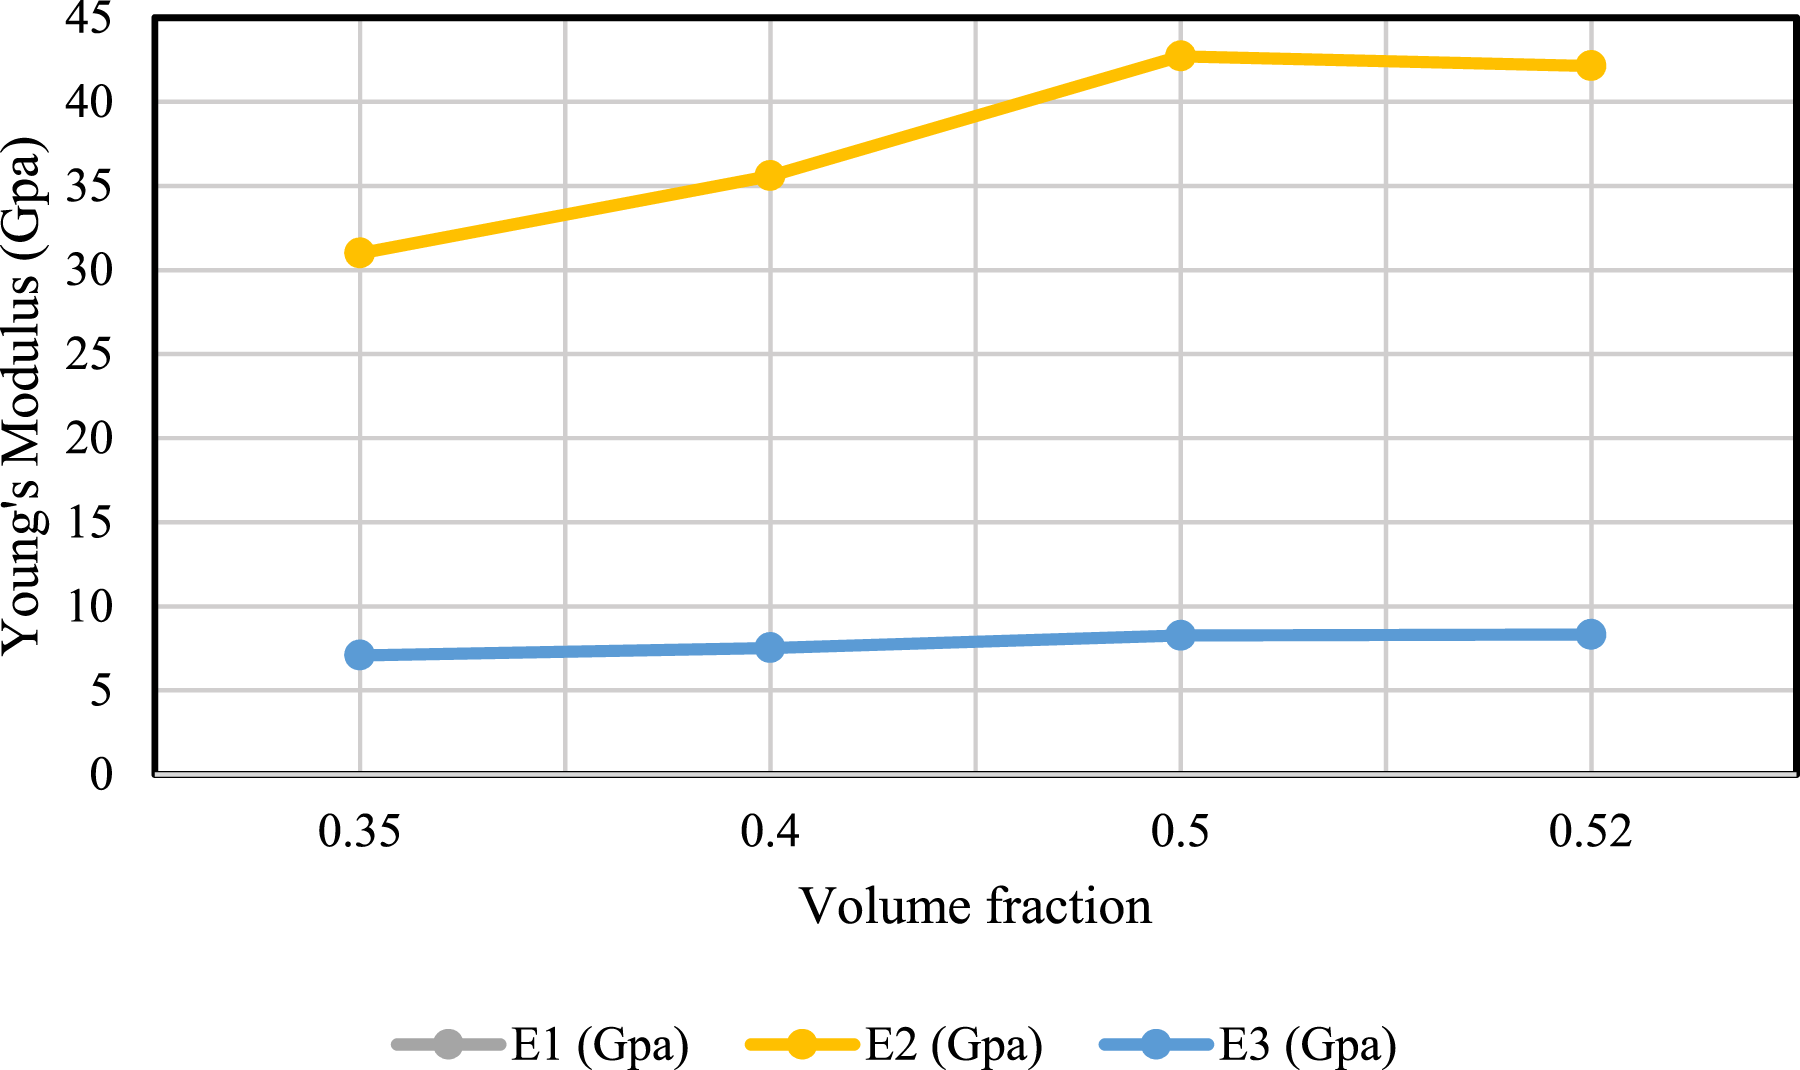
Zou et al.
67
has also investigated that elastic moduli varies with fabric type and lower crimp ratio which results higher elastic modulus and strength. The constraint effect often dominates for high modulus composite fibers. The increased fiber content leads to stiffer fabric which restricts matrix deformation, Figure 18. Also, the twill weave’s crossing pattern (with slanting ribs) might provide more resistance to shear as Vf rises
68
since the contact points between fibers increase, forming a more connected network that helps prevent shear. The in-plane and out of planes shear moduli G12, G23 and G31 are also influenced the fiber content in the fabric. Within the optimum range, Vf increment acts as a rigid inclusion. It could also be due to enhanced fiber-matrix interaction. Assuming stochastic behavior in in-plane fabric, the stiffness of carbon epoxy and glass epoxy plies can be determined analytically using shear lag model, homogenization approach
69
or the rule of mixture
70
like Voigt and Reuss, Figure 19. Effect of volume fraction on shear moduli of 0/90° TWCE ply. Stress vs strain in elastic region of UD composite assuming random waviness.

Transversely isotropic UD composite material with random waviness show varying elastic moduli, shear moduli and Poisson’s ratio when standard deviation of deflection angle varies. 28 Fiber waviness severely affects the effective elastic moduli. 28 The in-plane shear modulus G12 increases as waviness increases but it has negligible effect on G23 and G31. Although woven configuration fiber reinforced polymer composite (FRPC) has better mechanical properties than UD FRPC, the waviness created between warp and weft yarn layout configurations has a slight negative effect on some of mechanical properties. 71 For instance, Wu et al. 72 has investigated the effect of waviness on mechanical properties including tensile strength, compressive strength and bending behavior. Wang et al. 73 has discussed that defects such as fiber waviness reduce the mechanical performance such as compressive strength. Kassa et al. 2022 74 has also discussed that straight CNTs with no waviness provide maximum stiffness and higher waviness improved bending resistance by redistributing stresses.
The RVE of Glass-Carbon-Carbon-Glass (GCCG) PDHC, Figure 2, has dimensions: thickness = 0.9 mm, length (x-direction) = 1.418836 mm, and width (y-direction) = 1.418836 mm which gives volume of 1.8178e-9 m^3. Shear loading was applied on RVE in XY, YZ and XZ planes. The reaction forces generated as a result of shear loading were different even if the same amount of shear loading were applied on the three planes. The main reason for this is that the plane areas were different, Figure 20. The effective shear modulus were different due to area variation across planes and material anisotropy. In-plane shear moduli in XY plane were lower both in carbon and glass 0/90° plies because matrix and fiber-matrix interface carry the shear loading as the fibers were aligned with the loading axes. The behavior of RVE element developed, in Figure 2, can be interpreted using hybrid concept. The high stain effect of glass fiber contributes to the ductility of the laminate whereas carbon fiber contributes to the higher stiffness and strength of the laminate. Patel et al. 7
75
has discussed the low strain of carbon and the high strain of glass fiber. Thakur et al. has also reported that glass fibers have comparatively lower strength and stiffness.
76
When RVE of GCCG was loaded tri-axially, carbon fibers take initial stiffness and both carbon and glass fibers deform linearly, Figure 21 in their elastic zone. Force vs Displacement of Woven carbon-glass epoxy PDHC. Stress vs strain of woven GCCG PDHC.

Maximum normal stress were demonstrated when loaded along wrap and weft in X and Y directions, respectively. Normal stress developed in the thickness direction (Z) is minimum. The Y-direction loading has faced the highest internal resistance of the material and the stress strain curve was plotted using Y-direction normal stress, Figure 21. The strain value for X and Y direction loading is less than the strain value in the Z-direction loading. This is because the internal resistance of the material is higher in wrap and weft direction than the thickness direction. When failure strain of both carbon and glass fiber were approximated to two decimal places, the failure strain at yielding point falls to 0.01, Figure 21. However, the literature showed that the failure strain of glass fiber range up to 5.2% and the failure strain of carbon fiber ranges up to 2.4%. 77 The higher failure strain of glass fiber indicates the more ductility of the fiber. 78 This means that failure strain of hybrid becomes higher than the individual failure strain of carbon fiber and lower than the failure strain of glass fiber as it scarifies itself by hindering carbon fiber breakage.
The residual is defined as the difference between test data and predicted data.
79
The residual plot in Figure 22 showed the error distribution as a result of the difference of predicted force and actual force. Figure 22 demonstrated the models accuracy as it is discussed in Mojumder et al. 2025
80
stating that the accuracy of the model can be inferred by comparing the homogenized predicted stress with experimental applied stress. The absence of systematic pattern and randomness in Figure 22 showed that the model accurately predicts the underlying relationship. The small or constrained residuals in Figure 22 showed the good fidelity of MLP model. Residual plot of actual vs predicted for MLP model prediction.
In another study, the failure strain of 0.25% were also observed for discontinuous fiber pseudo ductile composite.
81
The failure strain deviation of this study from the literature needs further experimental investigation to validate the hypothesis. This validation will be conducted in the next phase of the research. When the failure strain of carbon fibers reaches, first drop occurs indicating carbon fiber failure. The stress drops because no load is carried by carbon fiber any longer. However, glass fibers takeover and remain intact. As the load increases, the GCCG laminate goes a certain degree of plasticity (pseudo-ductility). Final stress drop occurs due to glass fiber failure and matrix cracking, fiber pull-out and interfacial debonding. Within the elastic zone, RVE of GCCG laminate showed a linear relationship between force (RF1,RF2) and displacement (U1,U2) obeying Hook’s law, Figure 23. The multi-layer perception deep neural network (MLP) was trained over the dataset created from a tabulated numerical data of RF1 vs U1 and RF2 vs U2. The training loss and validation loss were 0.062 and 0.060, respectively. Validation mean absolute error (VMAE) and mean absolute error (MAE), Figure 24, of MLP were 0.121 and 0.146, respectively. Force vs displacement of GCCG PDHC due to tri-axil loading in elastic zone. Accuracy of MLP prediction model: (a) Training and validation loss; (b) Training and validation mean absolute error (MAE).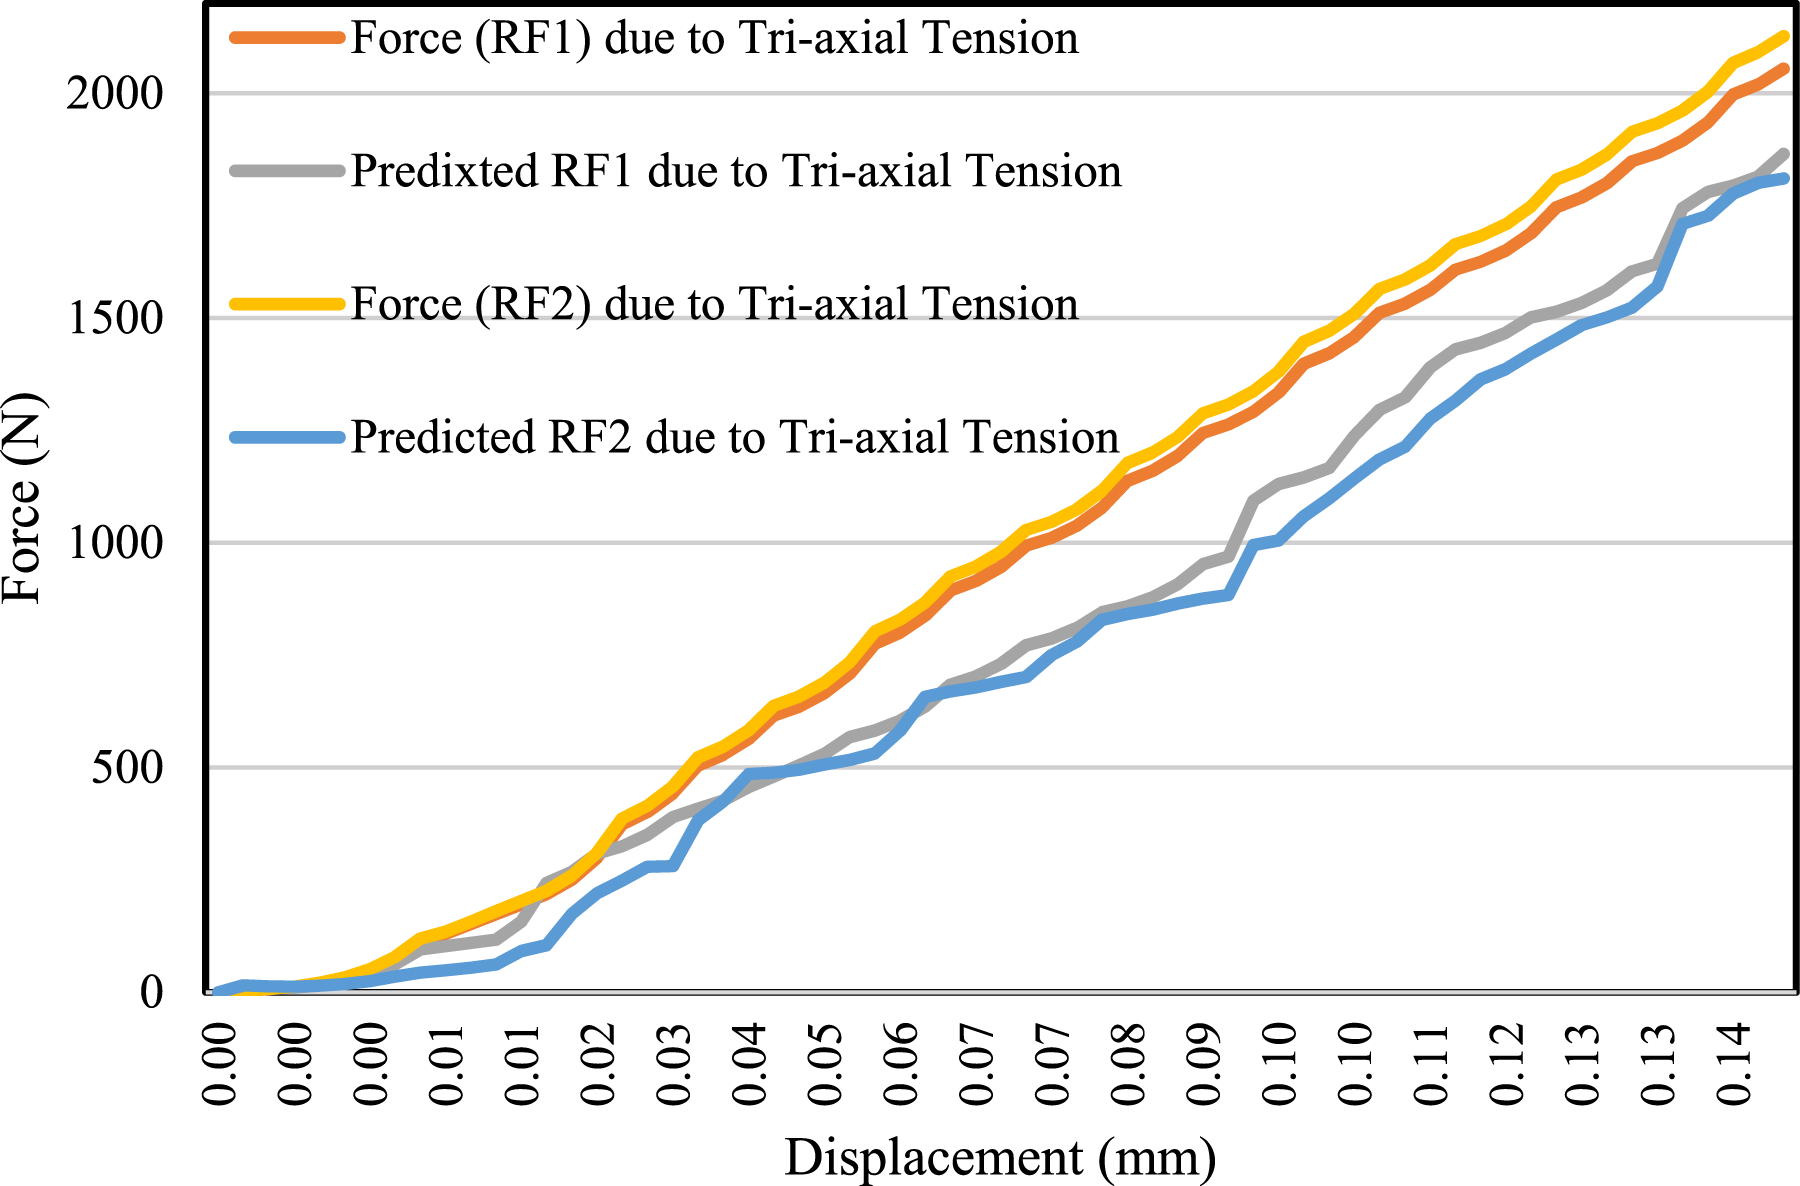

MLP was trained deeply with 13 hidden and 2 output layers so that it can capture non-linear relationship. Computationally efficient feedforward surrogate model was created in the 15-layer MLP architecture using Swish activation and regularization to conduct tri-axial RVE simulations. The deep MLP with Huber loss effectively predicts force-displacement relationship in RVE of GCCG laminate. The transfer learning based convolutional neural network (CNN) was used to predict the geometric model of woven composite so that MLP model proceeds predicting results of typical analysis based on a certain loading scenario for CNN predicted model. When GCCG laminate subjected to explicit dynamic impact, Figure 2, the 0/90° carbon ply initial load and fracture. Then, the ±45° carbon ply absorb energy though matrix cracking, fiber pull-out and delamination. The 0/90° and ±45° glass outer layers are used to arrest crack. The GCCG stacking optimally combines stiffness of carbon, orientation mixing and toughness of glass fiber for initial resistance, pseudo-ductility and final energy absorption, respectively. The GCCG laminate performs best as it was indicated in external work vs time graph in Figure 25. More energy is stored in carbon fiber due to its higher modulus and catastrophically releases it as it fails in a brittle manner. The ±45° carbon ply encourages shear failure which uses more energy than tensile failure in 0/90°, Figure 25. However, the ±45° glass ply fails too soon due to matrix-dominated modes since they are weaker in shear. Kinetic energy graph shows the efficiency which the impact energy moves though the GCCG laminate prior to dissipation. This hypothesis is supported by Haq et al.
82
indicating that less stiff plies transfer kinetic energy quickly. Because, less stiff plies deform easily dissipating the kinetic energy though deformation. However, stiffer carbon ply requires higher kinetic energy to deform, Figure 26. Sutcliffe et al.
83
has tailored carbon content, in studying braided glass-carbon composite, to achieve energy absorption capabilities highlighting that resonant frequency is a crucial factor for energy absorption of the composite. External work vs time of woven GCCG PDHC due to explicit dynamic loading. Kinetic energy vs time of woven GCCG PDHC due to explicit dynamic loading.

4.2. Confusion matrix of CNN model
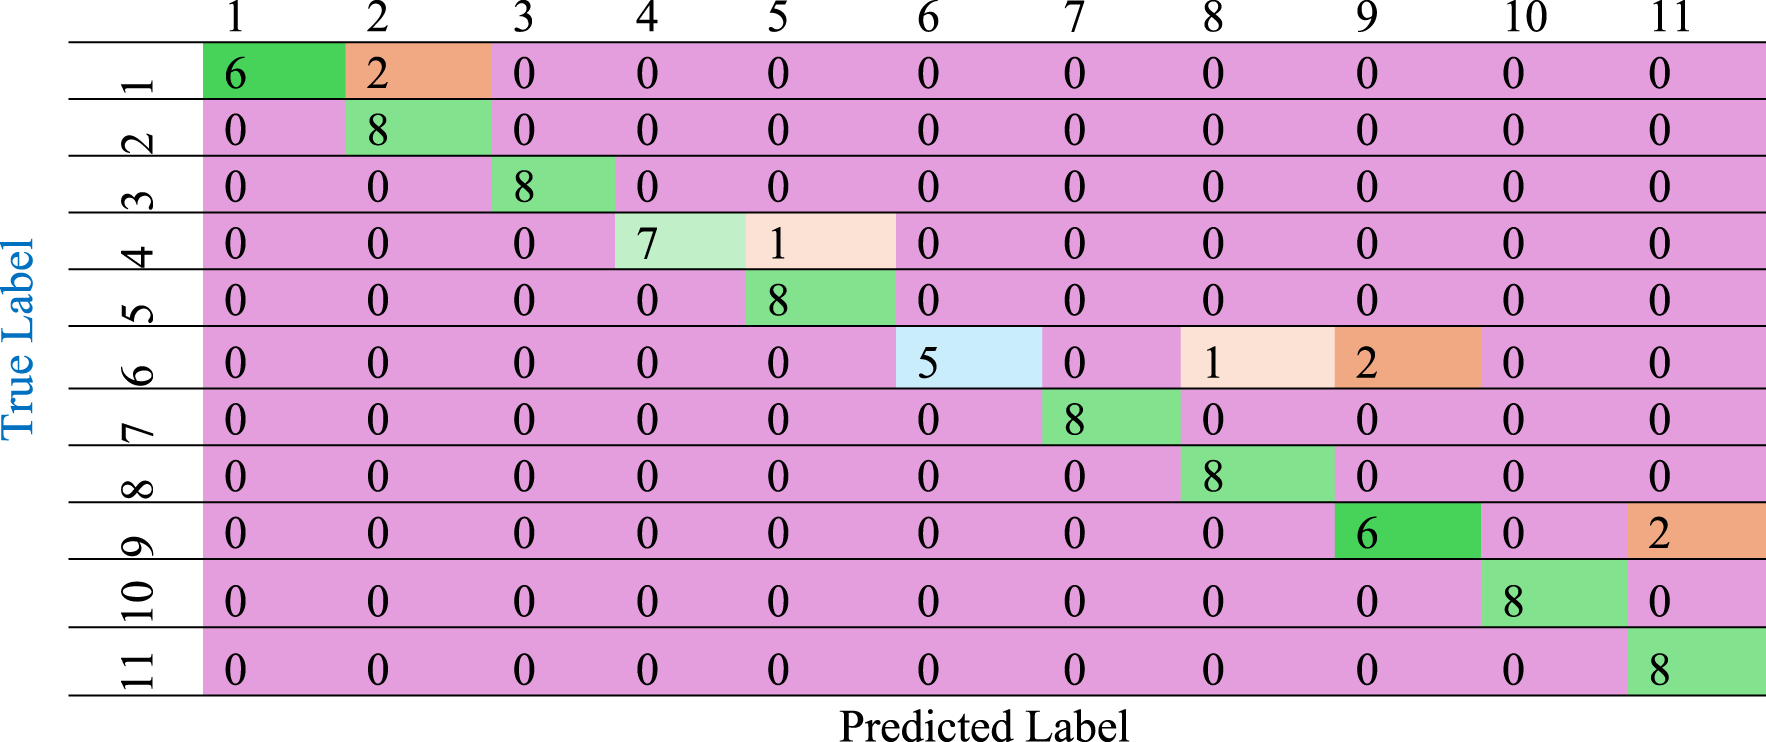
Confusion matrix of CNN classification result.

Calculation of per-class metrics like precision, recall, and specificity.

The multi-class average of recalls could be obtained from the sum of per-class recalls divided by total number of classes giving a percentage value of 90.91%. Thus, the model was 90.91% sensitive to changes like an increased volume fraction in the composite. Because, fiber volume fraction, hybridization structure and woven configurations were the input parameter of machine learning to obtain stiffness and strength output properties. In another study, weight fraction of fiber, ply configuration and delamination size and location were used as input parameters of machine learning to obtain dynamic response outputs. 87 The analysis of these performance metrics indicated that the model can be used for damage detection of multi-class tasks in the same ways as Yessoufou et al. 2023 88 used classification and regression model.
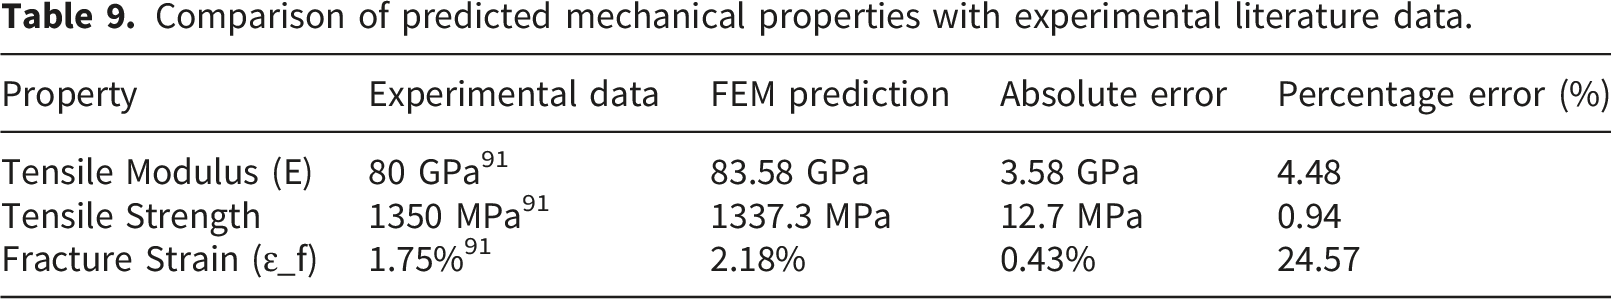
4.3. Quantitative comparison of results with experimental data in the literature
Comparison of predicted mechanical properties with experimental literature data.
FEM validation with experimental data in the literature.

4.4. Discussions and findings
In the following sections, discussions were made and major findings were highlighted.
4.4.1. Discussions
Carbon-glass PDHC light-weight materials are becoming a promising structure, especially in the context of upcoming eVTOL applications. 100 These materials alleviate the intrinsic brittleness of conventional carbon fiber reinforced polymers integrating the superior stiffness of carbon fiber with the improved toughness (pseudo-ductility) of glass fibers. 101 Nevertheless, precisely forecasting their mechanical properties grants a considerable challenge owing to their complex failure mechanisms under intricate tri-axial loading conditions. 102 To resolve this issue, a multi-scale framework that integrates FEA, MLP and transfer learning based CNN was studied to surmount the limitations of both analytical and purely numerical methods, thereby optimizing PDHC applications. For UD laminates, conventional micro-mechanical models like Halpin-Tsai, Hashin-Shtrikman and Voigt-Reuss have demonstrated computational efficiency. 27 However, their applicability to woven composites have some limitations. By presuming uniform fiber distribution and idealized cylindrical inclusions, these models simplify micro-geometry while ignoring important details like stress concentrations caused by fiber crimp and the intrinsic orthotropic nature of woven materials. These oversimplifications result in errors, especially when it comes to capturing out-of-plane stresses, which are essential for the integrity and functionality of woven hybrids. For example, strongly anisotropic woven composites were inherently incompatible with Hashin-Shtrikman’s constraints, which were exclusively applicable to isotropic materials. Shear-lag theory, on the other hand, provides a more reliable and precise method, particularly when combined with Monte-Carlo simulations (MCS). 103 It simulates fiber breaks stochastically and explicitly quantifies fiber matrix interfacial shear, which are the key processes affecting pseudo-ductile failure. Furthermore, 3D shear-lag models successfully resolve 3D stress recovery by explicitly modeling load transfer between warp and weft yarns and the matrix which address the thickness direction deficiencies frequently seen in UD laminates. 17 Although analytical models provide the basic understanding, they have limitations for complex and non-linear problems calling for the use of numerical methods. To develop and facilitate sophisticated light-weight composites, FEA is a crucial computational framework that helps to reduce expensive experimental campaigns. 104 Nevertheless, traditional FEA is computationally demanding for intricate 3D woven architectures. To address this, the suggested framework seamlessly combines CNN, MLP and FEA. This framework builds on each methodology’s advantages: FEA offers high fidelity simulations that accurately depict complex tri-axial stress fields (such as those resulting from yarn crimp and resin-rich zones); CNN effectively learn on micro-structure images and MLP effectively learn complicated correlations from numerical data. This cohesive paradigm provides a thorough approach to PDHC design by directly addressing woven-specific phenomena like crimp and orthotropy. The interlayer hybridization emphasizing on 0/90° and ±45° orthogonal weaves of twill and plain architecture gives a variety of design possibilities as woven fabrics offer built-in 3D reinforcement in a single layer, improving in-plane and transverse mechanical properties. The effect of Vf and shear angle on these fabrics elastic and shear moduli were thoroughly investigated. The findings consistently show that Vf and in-plane stiffness are directly related because load transfer mostly occurs along straight thread routes. Nevertheless, when Vf increases beyond the optimal or industrial range, it has a negative effect on shear moduli. The basic idea behind pseudo-ductility in these composites, in addition to carbon glass hybridization, was controlled matrix yielding, which calls for optimal resin content in the fabric so that fiber volume fraction (0.5) falls in the industry range. A slight change in shear angle (0≤0.7°), variation was observed in ±45° plain woven glass-epoxy ply. It’s interesting to note that the through-thickness modulus is essentially insensitive to in-plane reorientation and is mostly determined by matrix characteristics and fiber volume fraction. Under minor shear deformations, the moduli for 0/90° plain woven composites showed exceptional stability. This is due to the resistance of orthogonal designs for minimal deformations due to diagonal rib structure or mechanical interlocking. The thorough understanding of these complex interactions via integrated analytical, numerical and machine learning framework is critically important for optimal design of PDHCs. It is also important to remember that fiber waviness has a big impact on the mechanical behavior of UD composites, especially on the longitudinal elastic moduli. 105 Waviness is usually created by warp and weft fiber configurations of woven composites which slightly affect mechanical performance even if woven FRPCs offer better performance than UD composites.
Examining how a carbon-glass PDHC, specifically a GCCG stacking sequence, under the same magnitude of shear stress showed that a distinct reaction forces in different planes (XY, YZ and XZ). This is because the cross-sectional area where the shear load applied was different. The GCCG hybrid laminate demonstrated pseudo-ductile behavior by its stress strain response. Both carbon and glass plies deform elastically in the linear elastic zone where high stiffness of carbon predominates. For instance, Beetz et al.
106
has discussed supporting the hypothesis that carbon fiber takes the initial load in elastic section and then stress drops as carbon fiber fails. As the glass fibers deform within their elastic limit, the curve tends to increase in the second linear zone and yet glass fibers continue to support the load. The observed pseudo-ductility is a result of incremental degradation to the stacked plies caused by increasing load, which includes matrix cracking, fiber pull-out and interface debonding, Figure 27. The first drop of stress in the stress strain curve of PDHC GCCG occurred as a result of carbon fiber breakage, pull out or delamination, Figure 27(a). Aranda et al.
107
has demonstrated a similar hypothesis indicating that carbon fiber breakage occurs taking the initial load. Nevertheless, when glass fibers cannot be able to support the remaining load any longer, the stress finally drops. Czel et al.
10
demonstrated a sharp drop of stress strain curve at the end of elastic region indicating failure of carbon fiber. Czel and Wisnom
10
has also explained that the stress strain curve linearly rises again indicating that glass fiber takes the remaining load. Stress strain curve: (a) Delamination, (b) fiber breakage and fiber pullout, (c) interfacial debonding.
Then, a sharp drop of the curve was presented. Later in 2015, Jalalvand and Wisnom 108 demonstrated the damage mode map indicating that loss of structural integrity occurs at the first drop of load/stress due to delamination, fiber breakage or pull out. The hypothesis in Jalalvand et al. 108 mainly asserted that the load drop after yielding point is due to carbon fiber fragmentation/catastrophic delamination. The stress strain curve in Figure 27 showed a nearly similar pattern. However, when studying the PDHC failure, Abdellahi et al. 109 developed a stress strain curve resembling that of ductile materials, going a large plastic deformation after yield point, using a multi-scale numerical model. Yu et al. 31 has also studied the pseudo-ductility of low strain carbon and high strain glass hybrids highlighting that numerical prediction asymptotes the experimental prediction of stress-strain curve along the elastic zone.
Additionally, in accordance with Hooke’s law, the RVE shows a linear relationship between force and displacement in the elastic zone. An MLP deep neural network was created and thoroughly trained on tabulated numerical data that represent analysis result in order to predict this relationship with validation and training loss. With the help of Swish activation and regularization, the 15-layer MLP demonstrated remarkable low MAEs and training and validation losses (0.060 and 0.062, respectively), making it an effective surrogate model for intricate tri-axial RVE simulations. Transfer learning based CNN model has also successfully trained on the geometric model. The confusion matrix revealed that the CNN model had an accuracy of 89.77%. The model was 90.91% sensitive to changes such as a higher volume fraction in the composite. The GCCG staking sequence performs best in terms of energy absorption under explicit dynamic impact. The ±45° layers delaminate after breaking, efficiently absorbing energy through matrix cracking, fiber pull-out and Indentation, while the 0/90° carbon ply offer initial resistance, Figure 28. The outer layers of glass serve as effective crack arresters.
110
Although carbon fibers have a larger modulus, which enables them to store more energy, their brittle collapse can result in a catastrophic release.
111
Shear-dominated responses that cause more wave scattering provide the ±45° carbon-epoxy ply a higher kinetic energy, which is momentarily stored kinetically before to brittle fracture. On the other hand, the pseudo-ductility of the hybrid effect, which considerably slows down KE dissipation, and impedance mismatches at the carbon-glass interface, which efficiently trap KE through reflections, are responsible for the GCCG laminate higher performance. Explicit dynamic impact of GCCG PDHC.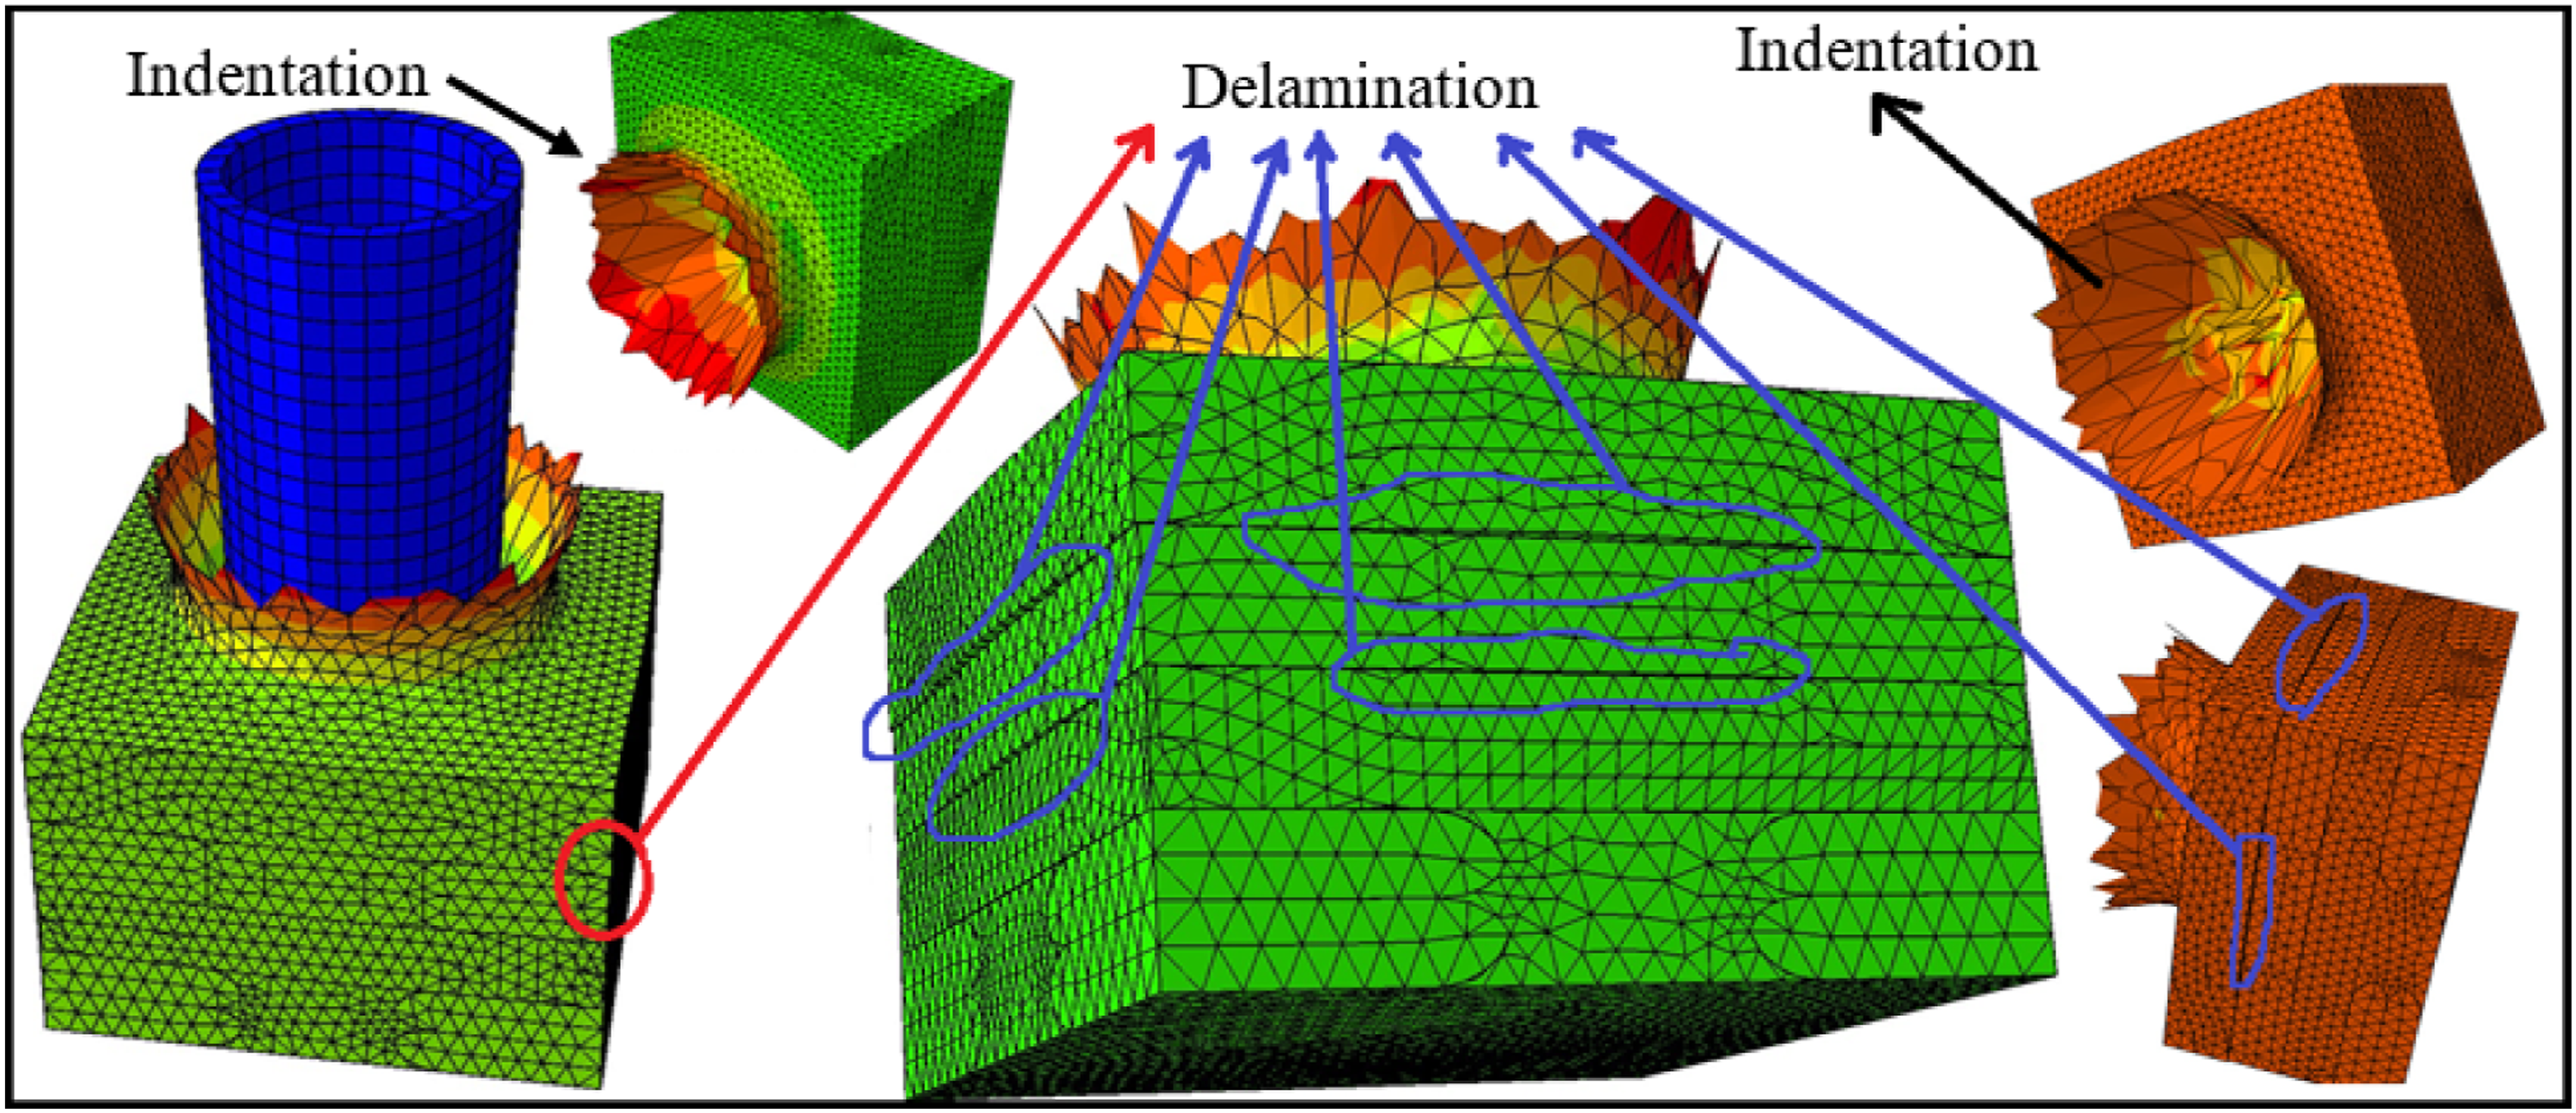
Hashin defines the damage initiation and propagation criterial which the Abaqus explicit solver implements it to model inter-laminar and intra-laminar failure including matrix cracking and fiber rupture.
112
The progression of matrix cracking is governed by an energy release rate that considers element characteristic length. Over a certain magnitude of RVE thickness, the time dependent energy release rate is approximately proportional to the infinitesimal difference of change of internal and strain energy per unit element characteristic length. As a result, the product of element characteristic length and energy release rate over time grows proportionally with internal and strain energy, Figure 29. It is essential to demonstrate the relationship and pattern of strain energy, internal energy and energy release rate as in Figure 29 to understand the damage progression. Li et al.
113
discussed the significance of energy release rates in understanding damage propagation highlighting a threshold beyond which damage initiates and propagates. Under mixed mode conditions, Singh et al.
114
discussed that energy release rates including critical energy release rates are important for predicting failure under normal and shear modes. The strain energy drop, Figure 29, correlates with the release of elastic energy in the form of fiber/matrix failure. Durressa et al.
115
supported this hypothesis by assessing how energy absorbed during impact translates into strain energy within the damaged structure. Strain and internal energy plot of GCCG laminate.
The strain energy computed at each time step, Figure 29, shows the non-negative energy absorption. Shi et al.
116
computed the strain energy at each time step emphasizing that the final failure strain should be greater than the initial failure strain to avoid zero or negative energy absorption. Koricho et al.
117
discussed that the energy absorbed during material deformation and damage dissipation energy as a result of energy lost due to damage processes is crucial to characterize the performance of material under impact. Koricho et al.
117
demonstrated that, the degree of damage, the ratio of absorbed energy and impact energy,
118
is higher in Nano modified composite laminates and improved energy absorption capabilities in hybrid composite laminates. Damage can be dissipated through different failure modes of composite laminate. Gama et al.
119
demonstrated energy can be dissipated in the form of short-time penetration phase due to shock compression and long-time deeper penetration damage forms. The study has also highlighted that damage dissipation energy is related to various mechanisms of energy dissipation including energy release rate. Energy release rate can be related as the slop of damage dissipation curve, Figure 30. Energy release rate plays a significant role for damage initiation around notches.
120
Damage dissipation energy is directly proportional to the extent of impact energy.
121
It can also integrated from the area of stress-strain curve,
122
Figure 21. Dissipation energy plot of GCCG laminate over time.
The numerical comparison of FEM predictions were closely matched with the experimental data in the literature. The absolute error of tensile strength and tensile modulus were 4.48% and 0.94% (Table 9), respectively when compared with experimental data. This validated the model’s ability to predict stiffness and strength. However, the over prediction of fracture strain could stem from homogenous stacking and linear elastic assumptions. In Table 10, the FEM models were effective in predicting flexural strength, impact strength and tensile strength with errors 0.96%, 4.21% and 3.81% respectively. These findings confirmed the predictive power of proposed models.
4.4.2. Findings
The findings of this paper highlights material performance, computational and modeling breakthroughs and fiber volume fraction optimizations. In general, the findings are summarized as follows: 1. The hybridization of carbon and glass fibers successfully overcome the intrinsic brittleness of carbon fiber achieving pseudo ductility. These was achieved through a controlled failure process where carbon fibers fail first, causing an initial stress drop, while glass fibers continue to carry the load, creating a second linear elastic zone. 2. The GCCG (glass-carbon-carbon-glass) stacked pseudo ductile hybrid composite was effective with regard to energy absorption under dynamic impact. The outer glass fiber layers act as crack arresters while the middle layers store kinetic energy through wave scattering and impedance mismatching at the interface, slowing down energy dissipation. Plain woven 0/90° composites showed structural stability under minor shear deformations due to mechanical interlocking and the diagonal rib structure. 3. This paper successfully integrated FEA, MLP and CNN to predict complex tri-axial stresses. FEA models predicted tensile modulus with an error as low as 0.94% error. The CNN model achieved an accuracy of 89.77% in identifying microstructural changes. The MLP was functioned as an effective surrogate model for RVE simulations with very low mean absolute error. 4. An optimal Vf of 0.5 was identified. While increasing Vf correlates directly with increased in-plane stiffness, exceeding industrial ranges negatively impacts the shear moduli. The through-thickness modulus was found to be largely insensitive to fiber reorientation, instead being dominated by the matrix characteristics and volume fraction. 5. Damage progression was governed by the energy release rate. The paper showed that strain energy drops correlate directly with the release of elastic energy during fiber/matrix failure.
Although this paper discussed the above findings, achieving pseudo ductility and superior energy absorption, significant limitations persist specifically regarding the over-prediction of fracture strain due to simplified linear elastic assumptions.
5. Conclusions
In this study, a finite element analysis (FEA), multi-layer perception (MLP) and transfer learning based convolutional neural network (CNN) were integrated to predict stiffness and strength of woven carbon-glass/epoxy pseudo ductile hybrid composites (PDHCs) over a certain range of loadings. The CNN model was trained using FEA geometric image dataset and MLP model was trained to predict the numerical results of a typical analysis class. The CNN model achieved 89.77% accuracy in generating FEM image classification results. The sensitivity of the model to changes such as fiber volume fraction was 90.91%. The MLP deep neural network, trained to map CNN predicted images to numerical outcomes, demonstrated low validation and training loss of 0.060 and 0.062, respectively with 15-layer architecture, swish activation and regularization. Damage initiation and propagation model was implemented using Ansys and Abaqus commercial software. The relationship between internal energy, energy release rate and strain energy highlights the damage progression mechanisms, with the strain energy drop correlating to elastic energy release during fiber-matrix failure. The energy release rate governs the characteristics length and progression of matrix cracking. Key findings of this paper highlights better performance of GCCG stacked hybrid composite exhibiting optimal energy absorption with ±45° layers delaying delamination after carbon fiber breakage and 0/90° carbon plies offering initial resistance. The stress-strain curve was dominated by carbon ply in linear elastic zone, followed by carbon fiber fragmentation, matrix cracking, and fiber pullout and debonding. The numerical comparison of FEM predictions were closely matched with the experimental data in the literature with absolute error less than 5% for tensile strength, tensile modulus, flexural strength and impact strength. However, the over prediction of fracture strain could stem from homogenous stacking and linear elastic assumptions. The proposed approach gives an insight to overcome the limitations of conventional models for woven hybrids, enabling optimized PDHC design for light weight engineering applications such as electric vertical take-off and landing aircraft (eVTOL) application. However, it is required to improve the accuracy of the study and validate it against experimental findings in the future studies. The limitation of this paper is that it relies on homogenized linear elastic assumptions in tensile predictions leading to over-prediction of fracture strain. Furthermore, perfect bonding was also assumed without explicit cohesive zone modeling for delamination and lacks direct experimental validation. Future studies should experimentally validate tensile, impact, flexural, tri-axial and fracture surface analysis. Cohesive elements for precise delamination modeling, enhanced interface properties with Nano-modifiers, and optimization of hybrid ratio/stacking sequences for specific eVTOL structural component could be possible extensions.
Footnotes
Acknowledgement
There is no funding for the study, authorship and/or publication of this paper.
Author contributions
Funding
The authors received no financial support for the research, authorship, and/or publication of this article.
Declaration of conflicting interests
The authors declared no potential conflicts of interest with respect to the research, authorship, and/or publication of this article.
Data Availability Statement
Authors declare that data will be available on a request.