
Abstract
Magnesium silicofluoride (MgSiF6), a byproduct of phosphate fertilizer production, serves as an effective retarder of sulfoaluminate cementitious grouting materials (SAGMs). The incorporation of triethanolamine (TEA) at concentrations ranging from 0.15 to 0.85 g/L results in a reduction of the slurry’s setting time and an increase in its compressive strength. Conversely, when the concentration is increased to 1.5–8.5 g/L, a decline in compressive strength is observed. The underlying mechanism for this phenomenon requires further investigation. The results show that when the concentration of MgSiF6 is 1.5 g/L, a TEA concentration of 0.15–8.5 g/L promotes the dissolution of CaSO4 and C4A3
Introduction
Deep mining of coal mineral resources urgently requires the integration of traditional support methods with grouting technology. Grouting can greatly improve the stability, waterproofing, integrity, and bearing capacity of deep roadway rock mass, hence improving the safety and sustainability of such roadways.1–3
Cementitious grout materials are a kind of inorganic grouting materials and have received increasing attention from scholars due to their convenient material sources, non-flammability, and low cost. The properties of sulfoaluminate cementitious grouting materials (SAGMs) consisting of sulfoaluminate cement (SAC) clinker, anhydrite, and quicklime include fast hydration, short setting times, and high mechanical properties, which have the potential advantages for use in the application of roadway rock mass.
For the hydration reaction of SAGMs, when calcium sulfate is present, ye’elimite hydrates to form ettringite and aluminum hydroxide. However, when calcium sulfate is insufficient, ye’elimite reacts to form monosulfate, ettringite, and aluminum hydroxide. 1 SAGMs require the use of retarders to decrease the setting time and accelerators to improve early strength in order to function properly during construction.
Scholars from domestic and foreign countries have conducted extensive research to modify the hydration of sulfoaluminate cementitious materials.4–8 Sodium citrate and sodium gluconate 9 are commonly used retarders for sulfoaluminate cementitious materials because they can adsorb on the surface of cement particles on one hand and, as another, by bonding hydrogen atoms with hydrophilic groups, form a water film layer around cement particles, thereby retarding hydration. Hu et al. 10 combined borax and citric acid in a mass ratio of 1:1, and when the compound was added to 0.6% of the cementitious material, cement setting times were extended from 21 to 32 minutes to 57 and 66 minutes, respectively, with considerable retardation effects. The 1-day strength of the cement was decreased, while the 3-day and 28-day strengths increased. According to Zou et al., 11 citric acid prolonged the setting time of sulfoaluminate cement slurry, but it expedited calcium sulfoaluminate cement hydration, resulting in larger and finer ettringite crystals.
The production process of phosphate fertilizer generates amounts of fluorine-containing waste gas,12,13 a very cheap fluorine source. Water is commonly used to absorb fluorine-containing mixed gases, which can then be further processed into fluorosilicic acid and salts to help reduce air pollution. In recent years, due to the surplus of fluorosilicic acid salt products and the declining price, waste fluorosilicic acid liquid has been left unsold in large quantities. Phosphate fertilizer factories have discharged cheap fluorosilicic acid waste liquid directly into rivers, causing irreparable damage to soil and plants. 14 Fluorine pollution of the environment can be reduced effectively by increasing the utilization rate of fluorosilicic acid salts. Up to now, the influence of magnesium fluorosilicate on the hydration and hardening of sulfoaluminate cementitious grouting materials are still not clear.
Triethanolamine (TEA) is commonly used to strengthen cementitious materials. Wang et al. 15 found that increasing the TEA content to 0.5% can stimulate the aluminum phase, thereby shortening the setting time of steel slag-cement composite materials. Triethanolamine (TEA) has been shown to enhance the early compressive strength of volcanic ash silicate cement mortars in a study by Aliakbar et al. 16 Adding 0.01 wt% of TEA enhanced the sample’s 1-day and 3-day compressive strength by 62% and 39%, respectively. According to Liu et al., 17 TEA affects cement mortar strength. Cement mortar strengthened at 1 day with 0.05% and 0.10% TEA, whereas it weakened with 0.50% TEA. A compressive strength decreased at 28 days as well as 56 days after adding 0.05%, 0.10%, and 0.50% of TEA. It has been reported 18 that high doses of TEA (0.5%) accelerate the aluminum reaction while delaying the tricalcium silicate reaction. In addition, TEA promoted the initial dissolution of C3S, C3A, and C4AF in the present study.
Many scholars' research has shown that in cement-based material systems containing retardant substances, the addition of early-strength agents can promote paste hydration and enhance mechanical properties. The research conducted by Xu et al. 19 indicates that lithium carbonate, sodium carbonate, and triethanolamine can all effectively enhance the mechanical properties of the mortar containing retardant lead-zinc tailings. Moreover, compared to lithium carbonate and triethanolamine, sodium carbonate has a better effect in promoting the hydration of the mortar containing lead-zinc tailings. According to the research by Souza et al., 20 it was found that setting accelerators play a significant role in rapidly increasing the structuration rate of cement pastes. However, they require significantly higher contents when co-assembled with substances that have retardant properties to compensate for their retarding and repulsive effects.
Our previous experimental exploration revealed that in the presence of MgSiF6, low concentrations (0.15 to 0.85 g/L) of TEA could shorten the setting time and enhance compressive strength, while high concentrations (1.5–8.5 g/L) of TEA would prolong the setting time and reduce compressive strength. The cause of these experimental phenomena remains unclear. Up to now, the effect of MgSiF6 on the properties of SAGMs in the presence of TEA has not been reported.
In this paper, a magnesium fluorosilicate-based grouting material was investigated for its effect on setting time and compressive strength in the presence of TEA, and changes in the solid-liquid phase composition to determine the impact of magnesium fluorosilicate in the presence of different TEA doses on mineral dissolution, and main hydration product formation. As a last step, an investigation of magnesium fluorosilicate’s influence on SAGMs was conducted in the presence of TEA.
Materials and methods
Materials
Chemical composition of SAC clinker and anhydrite /wt.%.

-- Loss on ignition.
Mineral composition of SAC clinker/wt.%.

Preparation of SAGMs
The SAGMs consist of two components: A and B. SAC clinker (component A) weighs 100 g, anhydrite (component B) weighs 80 g, and quicklime (component B) weighs 20 g. To make slurry A and slurry B, mix the two components with water for 1 minute. In both slurries, the water-to-cement ratios are 0.6. The concentration of magnesium fluorosilicate (MgSiF6) is set at 1.5 g/L, and the concentrations of TEA are (0 g/L, 0.15 g/L, 0.85 g/L, 1.5 g/L, and 8.5 g/L) added to slurry A. The grouting material is obtained by mixing slurry A and B and stirring for 3 min. The final mass ratio of C4A3
Preparation and characterization methods
Sample preparation methods
Hydration of major minerals
5 g of C4A3
Dissolution of CaSO4
The saturated Ca(OH)2 solution was weighed and added with 0.1 g of CaSO4. Different concentrations of TEA (0 g/L, 0.15 g/L, 0.85 g/L, 1.5 g/L, and 8.5 g/L) and 1.5 g/L of MgSiF6 were added, and stirring was carried out in a water bath at 30°C at 400 r/min. A nitrogen flow was employed to prevent carbonation. Ca, S, Mg, and Si elements were analyzed using the ICP-OES technique in samples taken at 0, 5, 10, 20, 30, 60, 90, and 120 min.
Dissolution of anhydrous calcium sulfoaluminate
250 ml of saturated Ca(OH)2 solution was mixed with 0.01 g of anhydrous calcium sulfoaluminate. Different concentrations of TEA (0 g/L, 0.15 g/L, 0.85 g/L, 1.5 g/L, and 8.5 g/L) and 1.5 g/L of MgSiF6 were added, and the mixture was agitated at 400 r/min in water bath at 30°C. A nitrogen flow was employed to prevent carbonation. The concentrations of Ca, S, Al, Mg, and Si ions in the solution were measured by using ICP-OES after 0 to 5, 10, 20, 30, 60, 90, and 120 minutes.
Synthesis of hydration product ettringite (AFt)
0.06 mol/L Ca(NO3)2•4H2O, 0.01 mol/L Al2(SO4)3•18H2O, and 0.12 mol/L NaOH solutions were prepared by dissolving 100 ml of each solution in deionized water. The three solutions were mixed in equal volumes and pumped into a three-necked flask using a peristaltic pump at a rate of 1.25 ml/min. Stirring was performed in a water bath at 30°C while nitrogen gas was protected. A vacuum drying oven at 50°C at low pressure was used to dry the precipitate after it had been dropped for 40 minutes. The precipitate was rinsed multiple times with deionized water until the pH was around 7.
Synthesis of hydration product aluminum hydroxide
In a 250 ml solution of 0.2 mol/L Al(NO3)3•9H2O, add 30 wt% ammonia water dropwise and adjust the pH to 6. After 24 hours of aging, the product is rinsed with ultrapure water several times until the pH reaches about 7, dried at 50°C in a vacuum dryer, and the final product is obtained.
Sample characterization methods
Physical and mechanical property testing
Hydration exothermic processes of SAGM slurries were characterized with an eight-channel isothermal calorimeter from the American manufacturer (TA/TAM air). Before testing, 0.83 g of cement clinker, 0.66 g of anhydrite, and 0.16 g of lime were uniformly mixed and poured into a 20 ml ampoule. A needle syringe was used to inject 1 ml of deionized water, and the cement’s hydration was monitored at 20°C temperature. The Vicat apparatus was used to measure the setting time of SAGMs cement paste per the guidelines of GB/T 1346–2011. The mixture consisted of SAC clinker, anhydrite, and quicklime in a ratio of 5:4:1, with a water-to-cement ratio of 0.6. The stirring was done at a low speed for 120 seconds, followed by a 15-second break, and then rapid stirring for another 120 s. Tests were conducted by GB/T 7897–2008, following the national standards. A 20 mm × 20 mm × 20 mm mold with a 0.6 water-to-cement ratio was used for the experiment. The specimen’s strength values at different ages (4 h, 1 day, 7 days, and 28 days) were ascertained, and six samples were taken at each age to calculate the average value.
Microstructure analysis of hardened paste
The pore structure of hardened paste at 4 h was examined using low-field nuclear magnetic resonance (LF-NMR) and the MesoMR12-060V model from Suzhou Niumag Analytical Instruments Co. The test comprised immersing cement specimens (20 mm × 20 mm × 20 mm) in water until they reached their age, and then placing them in a vacuum chamber for 24 h at 40°C. The test was conducted in a vacuum chamber.
TG and XRD
TG and XRD were used to characterize the composition of the solid phase material during the main mineral dissolution and product formation process. To evaluate the samples, a Bruker D8 Advance X-ray diffractometer (=0.154 nm) was employed. It covered a range of 5 to 80° and scanned at 10°/minute. PerkinElmer STA 8000 synchronous thermal analyzers with 50°C–1000°C heating ranges and 10°C/min heating rates were used for the thermal analysis.
Ionic concentration in slurry solution
Dilute 1 ml of the solution tenfold with dilute nitric acid and then tenfold again with deionized water after filtering it through a 0.25 μm membrane. An inductively coupled plasma emission spectrometer (ProXICP-OES) was used to determine the concentrations of Ca, Mg, Al, S, and Si elements in the slurry solution. Refer to GB/T 7484–1987 to test the concentration of F ion. Take 1 mL of the sample with a pipette at 25°C, fill a volumetric flask with 50 mL of the solution and stir, add 10 mL of total ion strength adjuster (TISAB), dilute it with deionized water to 50 mL, shake it uniformly, and then inject it into a 100 mL polyethylene beaker. Insert a plastic stirring rod into the beaker followed by an electrode. Continuously stir the solution while it is being electrolyzed and read the electrode potential. Once it has stabilized, based on the measured millivolts, calculate the fluoride ion content on the calibration curve.
Results and discussion
Setting time
Figure 1 shows the setting time of SAGMs slurry with 1.5 g/L MgSiF6 as a function of TEA concentration. It takes 10 minutes for SAGMs slurry to start setting and 16 minutes to finish setting. Both the initial and final setting times of slurry in the presence of 1.5 g/L MgSiF6 are extended to 25 minutes and 30 minutes, respectively, indicating that the above concentration of magnesium silicofluoride retards the setting time of SAGMs slurry; when the concentration of MgSiF6 is kept constant, setting times, both initial and final are 13 minutes and 23 minutes, respectively, when TEA concentration is 0.15 g/L; setting times, both initial and final are 12 minutes and 20 minutes, respectively, when TEA concentration is 0.85 g/L; setting times, both initial and final are 13 minutes and 26 minutes, respectively, when TEA concentration is 1.5 g/L; initial and final setting times are 15 minutes and 27 minutes, respectively, when TEA concentration is 8.5 g/L. Figure 1 illustrates that as TEA concentration increases, the setting time of SAGMs slurry decreases and subsequently increases in the presence of MgSiF6, and the cause of this phenomenon remains unclear. Effect of MgSiF6 on the setting time of SAGMs in the presence of different concentrations of TEA.
Hydration heat
Figure 2(a) shows the rate at which hydration heat is released under the conditions of MgSiF6 for slurry with different concentrations of TEA. Compared to SAGMs, the heat generated by the slurry during hydration was reduced by 1.5 g/L of MgSiF6. When 0.15 g/L and 0.85 g/L of TEA were added, the heat released by the slurry during hydration was increased. Among these, more hydration heat was released when adding 0.85 g/L of TEA. The hydration heat release rate of the slurry gradually decreased with increasing TEA concentrations of 1.5 and 8.5 g/L. Effect of MgSiF6 on the hydration rate and heat release of SAGMs in the presence of different concentrations of TEA: (a) Hydration heat release rate; (b) total heat release of hydration.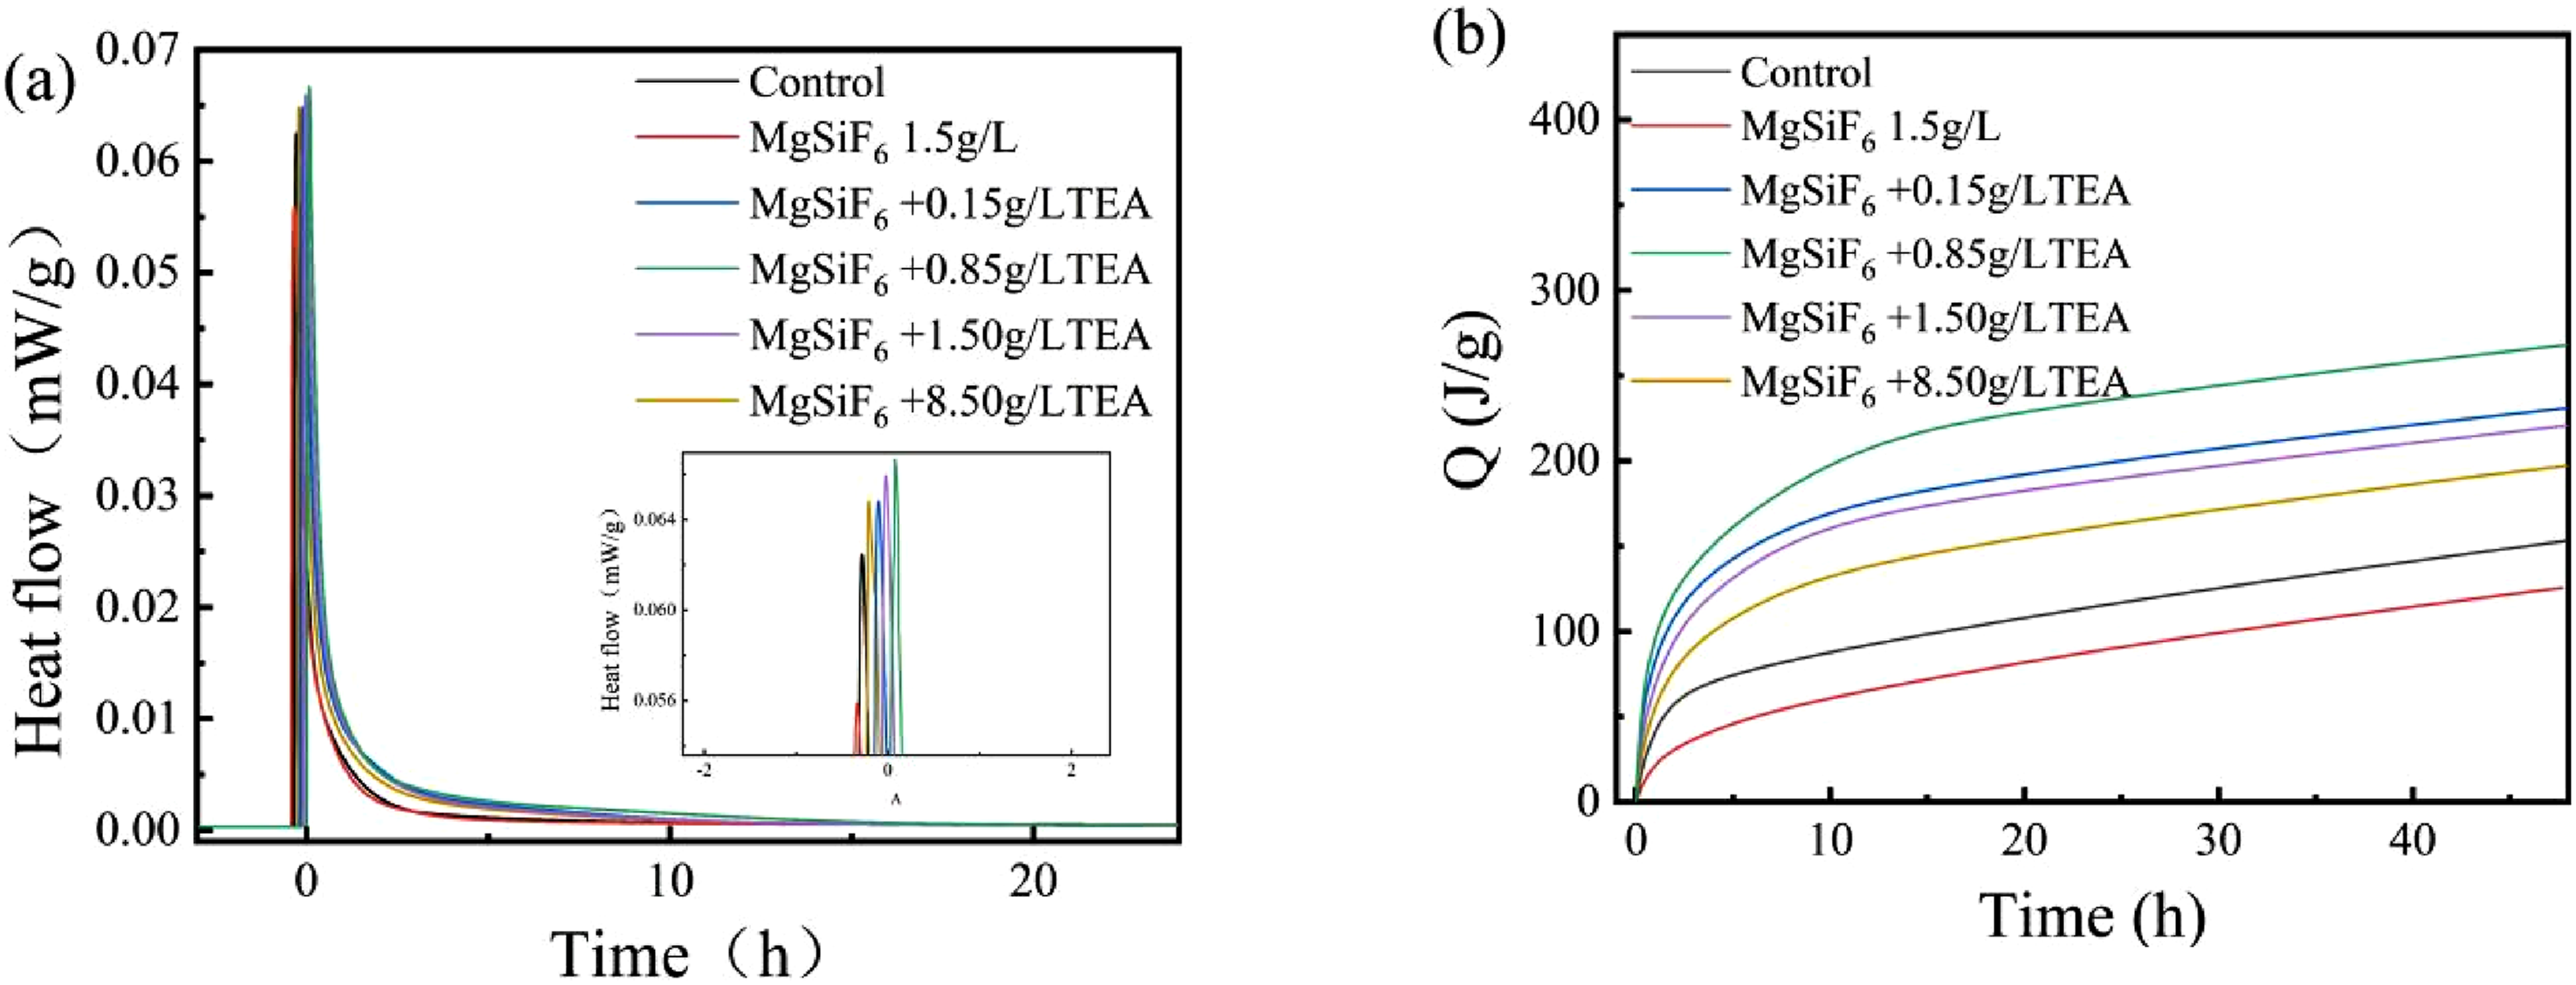
The effect of MgSiF6 on the total heat of hydration release of the slurry under different TEA concentrations is illustrated in Figure 2(b). Compared with the reference slurry, the total heat of hydration release was significantly reduced by 1.5 g/L MgSiF6. As shown in Figure 2(b), TEA significantly increased the heat of hydration in the SAGMs slurry. Heat total of hydration release increases with the increase of TEA concentration from 0.15 to 0.85 g/L, with the maximum increase in heat released by hydration occurring at 0.85 g/L TEA concentration. However, as the TEA concentration is further increased, the total heat of hydration release gradually decreases when TEA concentrations are 8.5 g/L, the heat of hydration is released with the least rise. It is unclear how MgSiF6 influences the hydration of SAGMs containing TEA.
Composition of hardened SAGMs
Figure 3 shows the XRD patterns of hardened SAGMs pastes. At 12 h, the diffraction peak of ettringite, anhydrite, and anhydrous calcium sulfoaluminate (ye’elimite) appears in the reference samples indicating that ettringite is the main hydration product in the reference sample, while aluminum gel was not detected by XRD, possibly due to its amorphous nature. When 1.5 g/L MgSiF6 was added, the diffraction peaks of ettringite disappeared, and then the sample mainly contained calcium fluoride, anhydrite, and ye’elimite, indicating that the generation of ettringite was prevented. When magnesium fluosilicate is present, 0.15 g TEA is added, the diffraction peak of anhydrite decreased while the diffraction peak of ettringite appeared, indicating that the addition of 0.15 TEA promoted the formation of ettringite. When TEA is added at a concentration of 0.85 g /L, the diffraction peak of ettringite is further increased, and the diffraction peak of ye’elimite and anhydrite is further decreased, indicating that 0.85 g /L TEA can further promote the hydration of slurry. When TEA dose was increased to 1.5 and 8.5 g /L, the diffraction peaks of ettringite decreased, while those of anhydrous calcium sulfoaluminate and anhydrite increased, indicating that 1.5 and 8.5 g /L TEA further inhibited the hydration of SAGMs. Overall, 1.5 g/L of MgSiF6 inhibited the hydration of the slurry, whereas 0.15 and 0.85 g/L of TEA in the presence of MgSiF6 promoted SAGMs hydration, while further increasing the concentration of TEA to 1.5 and 8.5 g/L inhibited SAGMs hydration. The cause of this phenomenon is not clear. Effect of MgSiF6 on the composition of SAGMs hardened pastes in presence of different concentrations of TEA.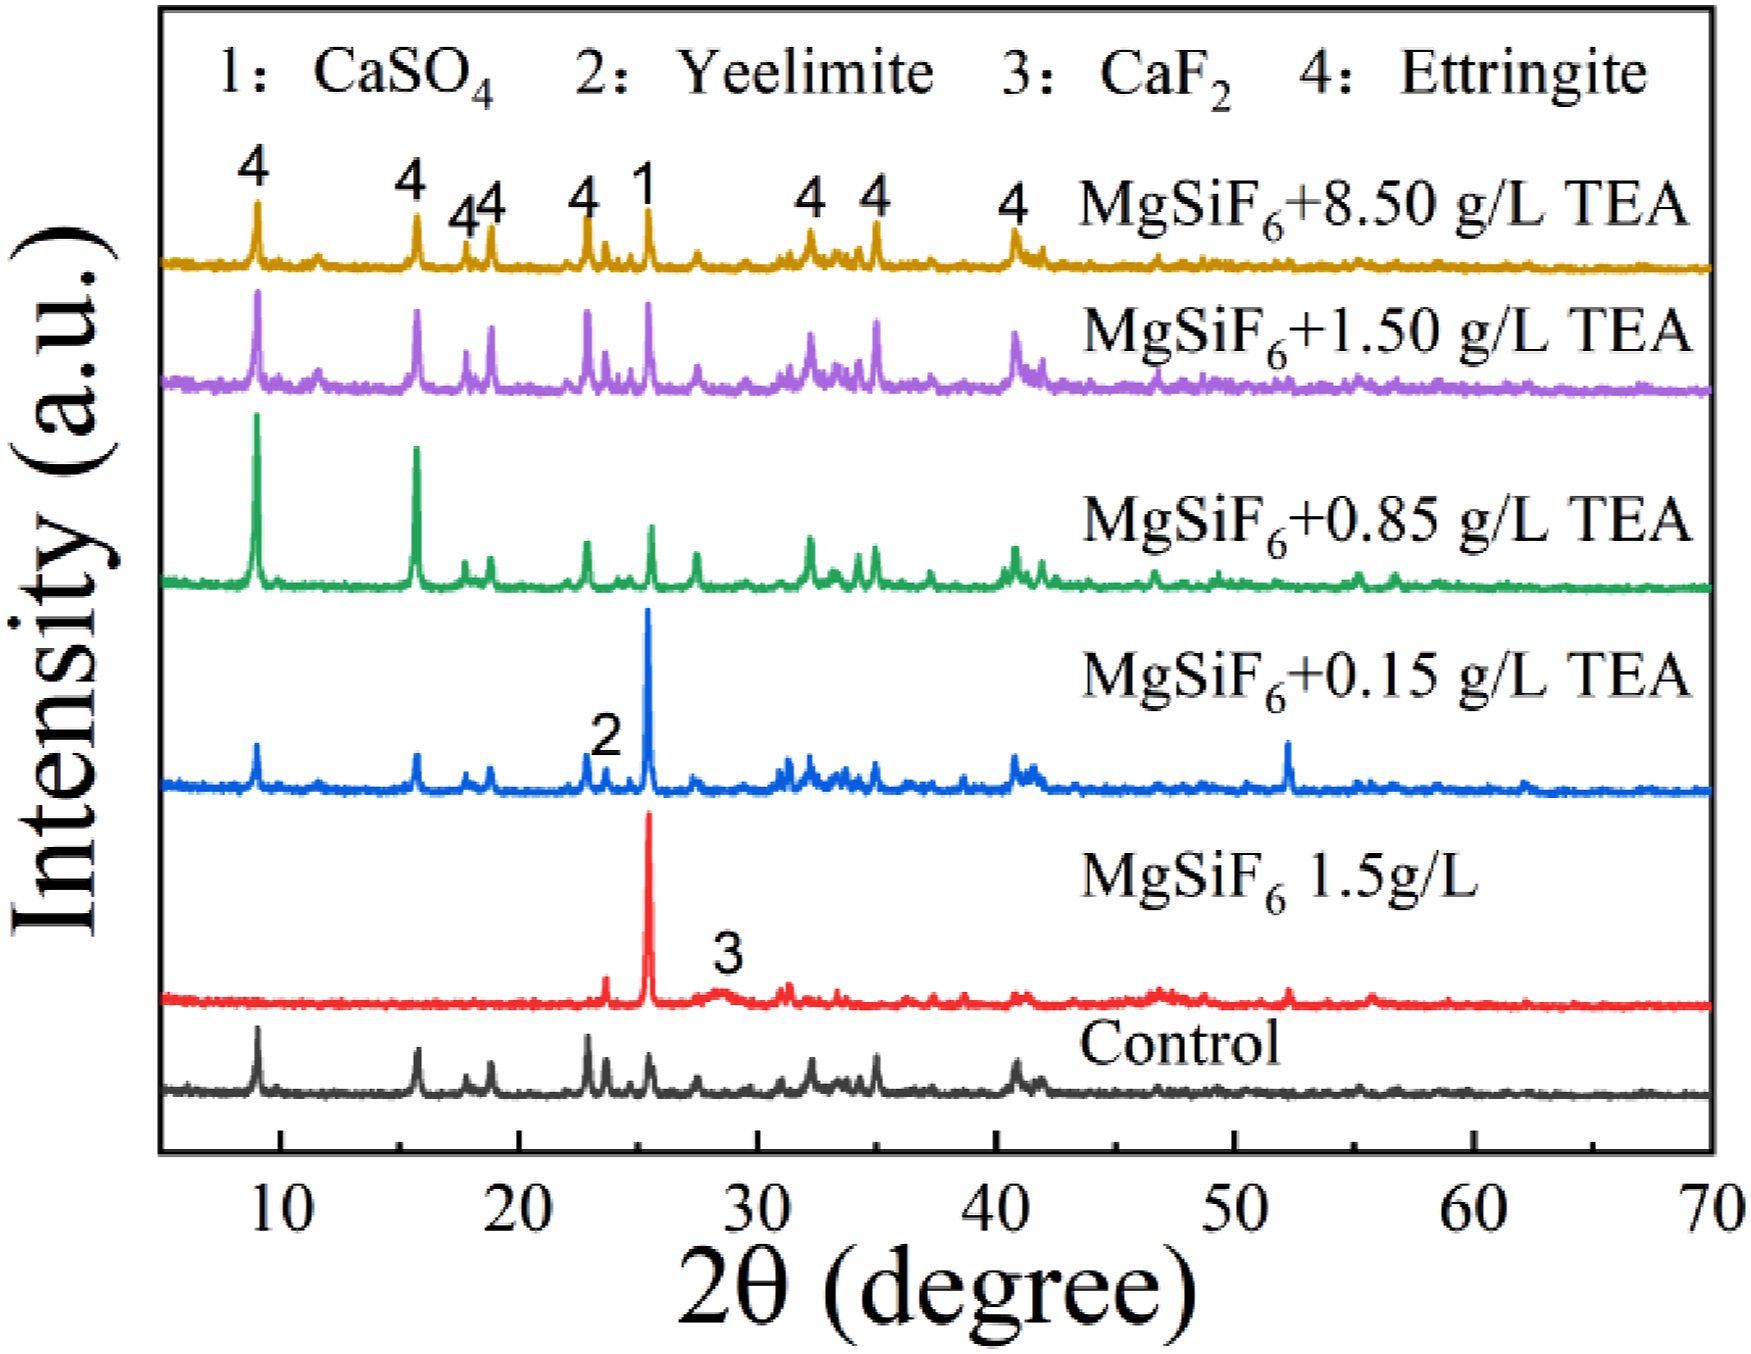
Dissolution of major minerals
Dissolution of CaSO4
According toFigure 4(a), the calcium ion concentration increased gradually during the first 10 min of CaSO4 dissolution and then changed little after that, which is due to the common-ion effect in a 12.5 pH calcium hydroxide solution. When 1.5 g/L MgSiF6 was added, the calcium ion concentration was compared with the reference group: lower in all cases, and the calcium ion concentration hardly changed with the extension of dissolution time after dissolution for 10 min, indicating that this concentration of MgSiF6 inhibited the dissolution of calcium sulfate. When MgSiF6 was 1.5 g/L and TEA was added in the range of 0.85–8.5 g/L, calcium ions released very fast. A solution containing 1.5 g/L MgSiF6 and TEA ranging from 0.85 to 8.5 g/L showed similar trends with the increase of TEA concentrations, as did the sulfate ion concentrations and electrical conductivity. These results indicate that 1.5 g/L MgSiF6 inhibits the dissolution of CaSO4, and adding 0.85–8.5 g/L TEA promotes the dissolution of CaSO4, and the promotion effect increases with the increase of TEA concentration. Effect of MgSiF6 on the dissolution of CaSO4 in the presence of different concentrations of TEA: (a) Ca2+ ions; (b)SO42- ions; (c) conductivity.
Dissolution of anhydrous calcium sulfoaluminate
Figure 5(a) shows the effect of MgSiF6 on the dissolution of anhydrous calcium sulfoaluminate in the presence of different concentrations of TEA. For the SAGMs slurry, the calcium ion concentration increased gradually during the first 10 min of the dissolution of anhydrous calcium sulfoaluminate, and then changed little after that, possibly due to the common-ion effect. MgSiF6 added at 1.5 g/L resulted in lower calcium ion concentrations in all cases when compared to the reference group, and the calcium ion concentration hardly changed with the extension of dissolution time after 10 min, indicating that the above concentration of MgSiF6 inhibited the dissolution of anhydrous calcium sulfoaluminate. When MgSiF6 was 1.5 g/L and TEA was 0.85–8.5 g/L, the calcium ion concentration rose, indicating that TEA promoted the release of calcium ions. However, the ability of different concentrations of TEA to increase calcium ion concentration varied, and the calcium ion concentration was higher when the concentration of TEA was 0.85 g/L. As shown in Figure 4(b)–(d), the addition of TEA also increased the concentration of sulfate ions, and aluminum ion, and a solution containing 0.85 g/L of TEA exhibited electrical conductivity, sulfate ions, and aluminum ion, than a solution without TEA. Effect of MgSiF6 on the dissolution of anhydrous calcium sulfoaluminate in the presence of different concentrations of TEA: (a) Ca2+ ions; (b)SO42- ions; (c) AlO2-; (d) conductivity.
In summary, MgSiF6 at a concentration of 1.5 g/L inhibited the dissolution of anhydrous calcium sulfoaluminate. Compared to the sample only containing MgSiF6, adding 0.85–8.5 g/L TEA promoted the dissolution of anhydrous calcium sulfoaluminate, and with increasing concentrations of TEA, dissolution of anhydrous calcium sulfoaluminate was promoted, but the trend of promotion was first increasing and then decreasing.
Formation of main hydrate products
Aluminum gel
The XRD patterns of Al(OH)3 synthesized with MgSiF6 and different TEA concentrations are shown in Figure 6(a). The XRD curves all exhibit diffuse and non-crystalline diffraction peaks, making it hard to determine the synthesized product. TG-DTG curves of Al(OH)3 synthesized with MgSiF6 and various TEA concentrations are shown in Figure 6(b). There are two stages of weight loss: the initial weight decrease around 100°C is most likely caused by the removal of absorbed water. The majority of hydroxyl groups in Al(OH)3 are removed at around 300°C,
22
whereas the remaining hydroxyl groups are removed at 300°C–400°C.
23
With the increase of TEA concentration, Al(OH)3’s weight loss peak at 300°C gradually increases and shifts to low temperatures, indicating an increase in the concentration of Al(OH)3 in the final product and the formation of a compound involving TEA and aluminum hydroxide. Effect of MgSiF6 on the formation process of Al(OH)3 in the presence of different concentrations of TEA : (a) XRD diagram, (b) TG-DTG diagram, (c) FT-IR diagram, and (d) particle size diagram.
Figure 6(c) shows the FT-IR curves of synthesized samples with different concentrations of TEA in the presence of MgSiF6. There is a vibration at 3500 cm-1 that corresponds to the O-H stretching vibration. At 460 cm-1, the vibration is the bending vibration of the Al-O chemical bond in Al(OH)3. 23 The infrared absorption peaks of the synthesized samples with different concentrations of TEA in the presence of MgSiF6 overlap, indicating that the main products generated in the presence of MgSiF6 and TEA are essentially the same.
Figure 6(d) shows the size distribution of synthesized samples with different concentrations of TEA in the presence of MgSiF6, where the concentration of MgSiF6 was 1.5 g/L, and the average particle size of synthesized aluminum hydroxide varied minimally, around 220 nm. In the presence of MgSiF6, the produced material had an average particle size of 135 nm, 84 nm, 135 nm, and 185 nm as TEA concentrations increased from 0.15 to 8.5 g/L, indicating that the average particle size first shrank and then increased. The reason for this phenomenon could be that at low TEA concentrations, TEA can be adsorbed on the surface of aluminum hydroxide, inhibiting the formation of some crystal faces and lowering their size. At high TEA concentrations, several TEA molecules engage with multiple aluminum hydroxide molecules, causing in the size of aluminum hydroxide crystals to grow. This phenomenon has also been reported in the literature. 24
Figure 7 shows the SEM images of synthesized samples with different concentrations of TEA in the presence of MgSiF6. It can be seen from Figure 7(a) that the synthesized aluminum hydroxide presents a plate-like accumulation, which may be caused by agglomeration during the drying process. When 1.5 g/L MgSiF6 is added, the morphology of aluminum hydroxide shows no obvious change, but there is a tendency for the particle size to decrease (Figure 7(b)). Figure 7(c)–(f) show the morphology of the synthesized products when different concentrations of TEA are added in the presence of MgSiF6. It can be seen that TEA has little effect on the morphology of aluminum hydroxide. As the amount of TEA increases from 0.15% to 8.5%, the particle size of aluminum hydroxide first decreases and then increases. When the amount of TEA is 0.85%, the particle size of the synthesized aluminum hydroxide is relatively small, less than 100 nm. SEM images of synthesized samples with different concentrations of TEA in the presence of MgSiF6.
Ettringite formation
XRD patterns of synthesized products with MgSiF6 and different concentrations of TEA are shown in Figure 8(a). The diffraction peak of ettringite was predominantly detected in the reference group. The diffraction peaks of CaF2 appeared when the concentration of MgSiF6 was 1.5 g/L, indicating that F ions competed with aluminum hydroxide and sulfate ions, and CaF2 was preferentially formed; when MgSiF6 was present, AFt diffraction peaks appeared at 0.15–8.5 g/L TEA concentrations, with the highest peak intensity of AFt’s diffraction peaks appearing at 0.85 g/L of TEA concentration. Effect of MgSiF6 on the formation process of AFt in the presence of different concentrations of TEA: (a) XRD diagram, (b) TG-DTG diagram, and (c) particle size diagram.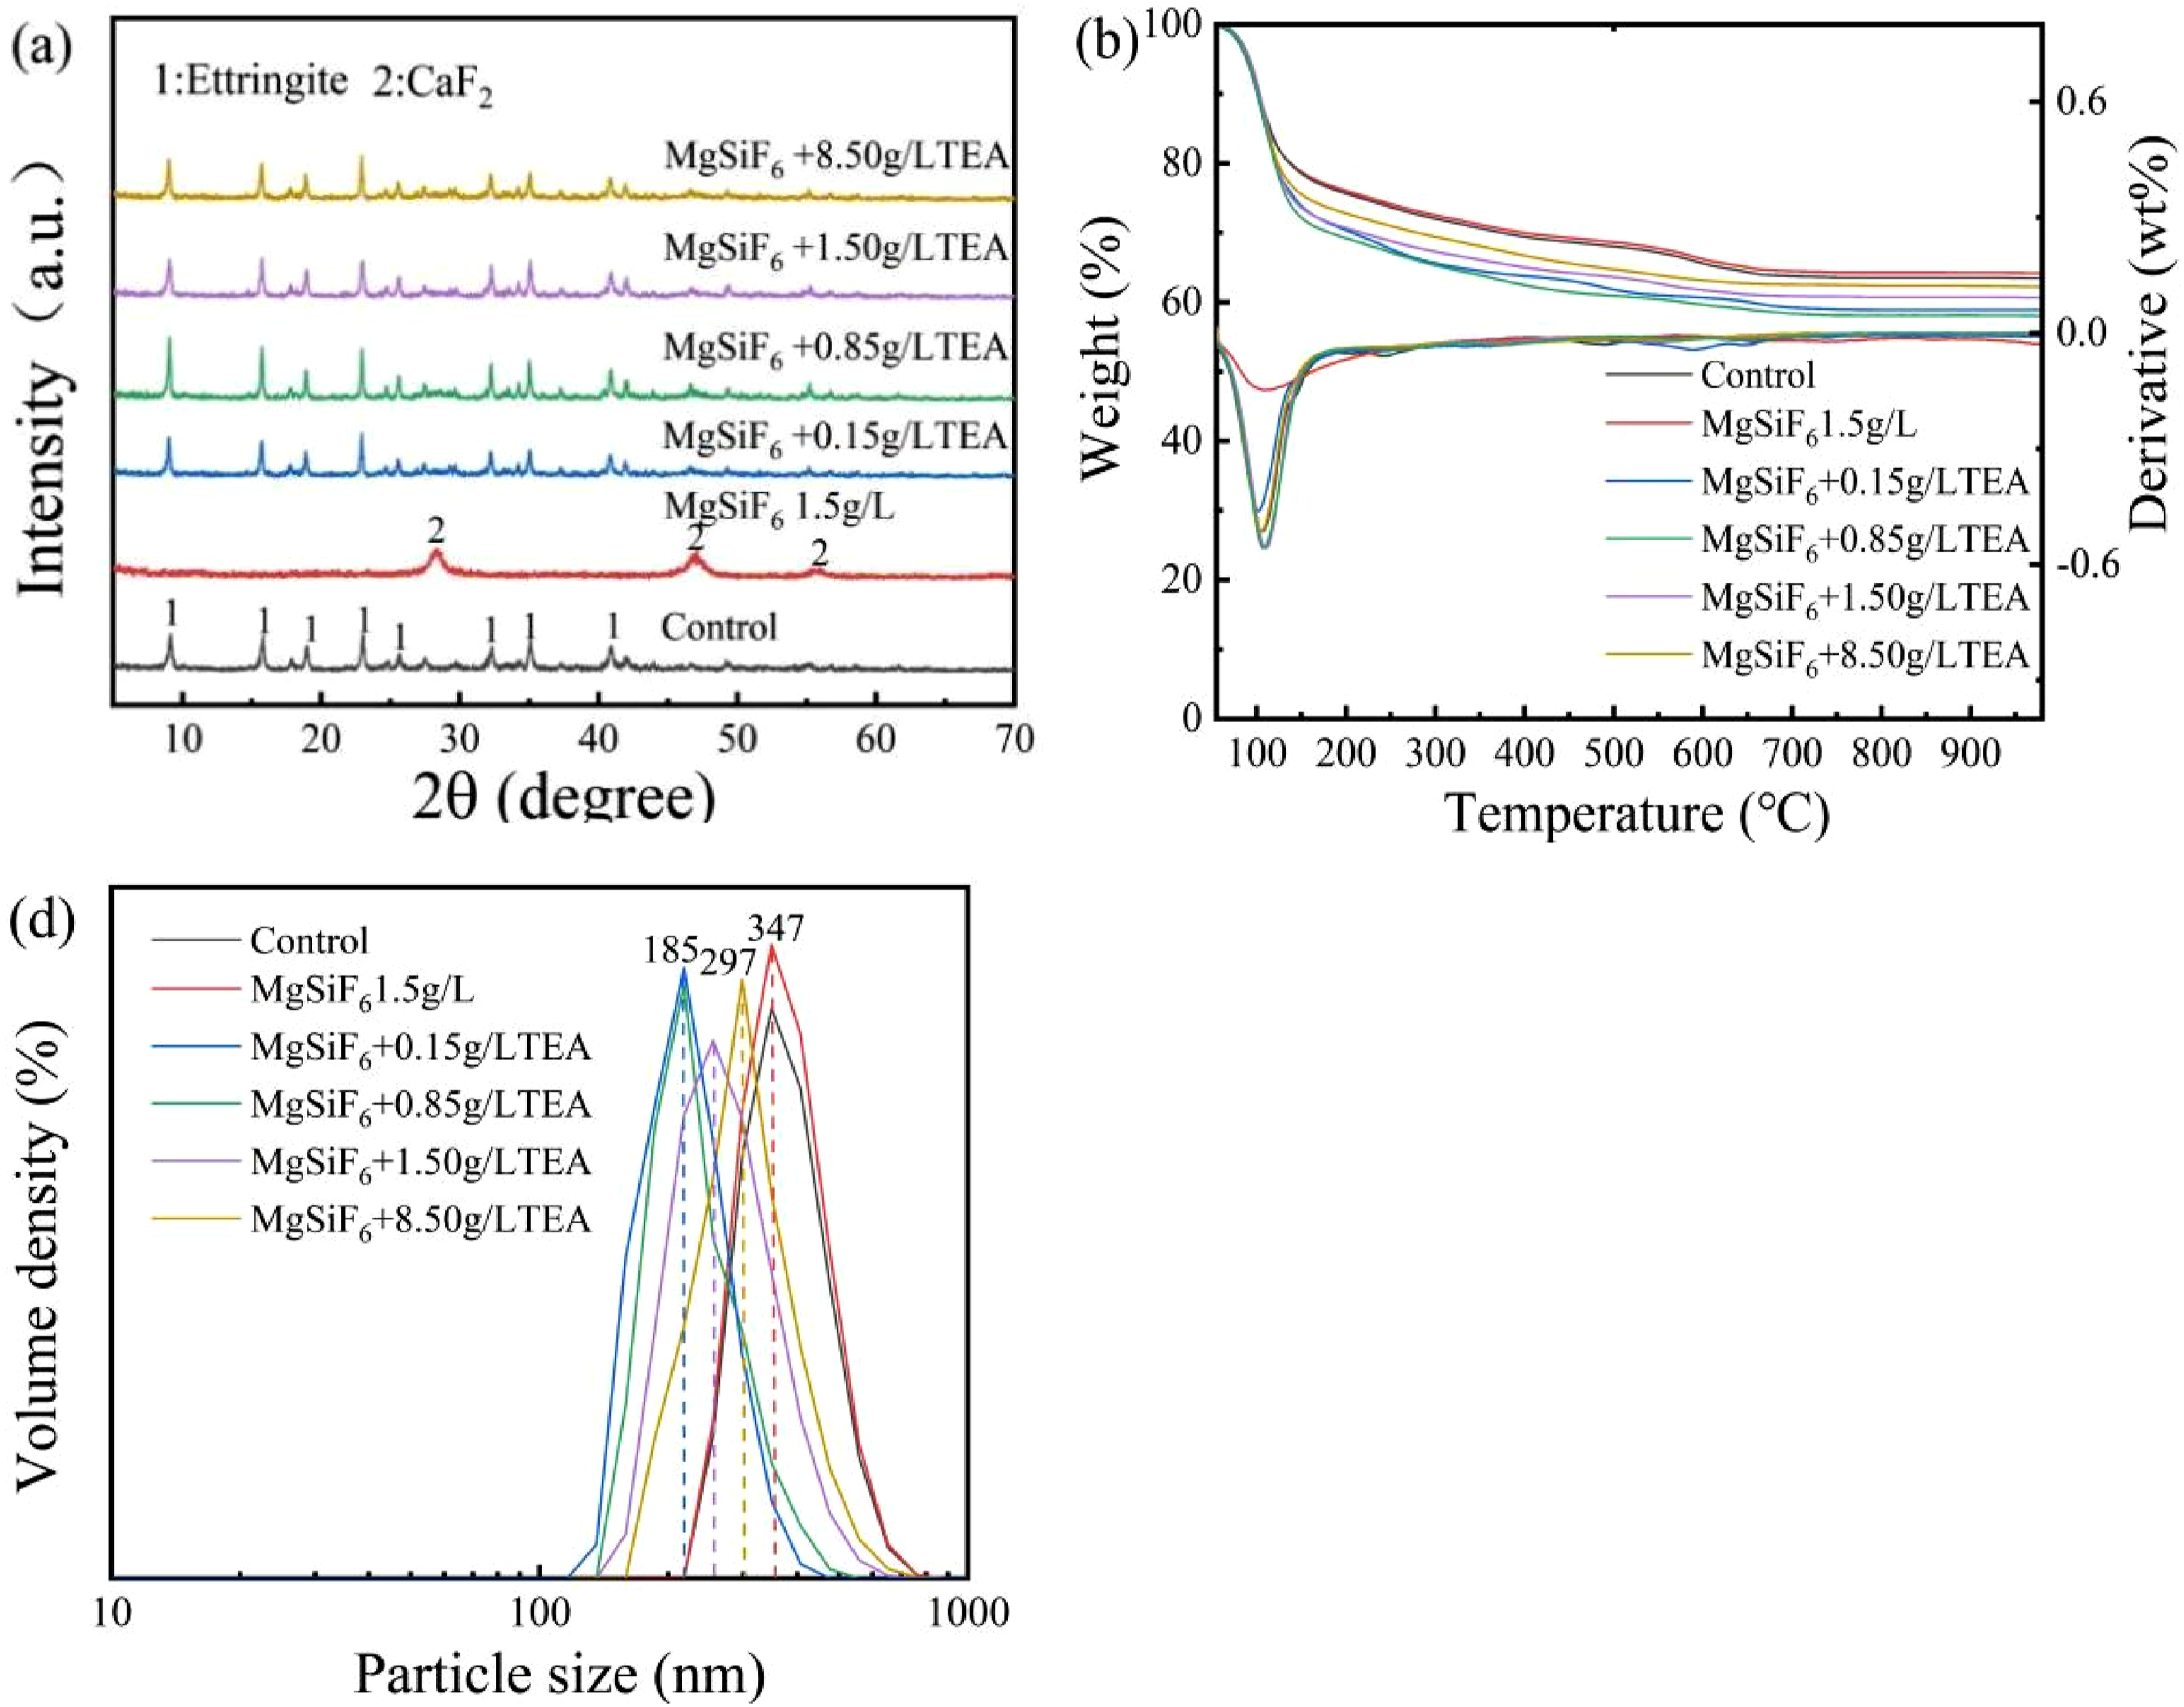
TG-DTG curves of synthesized substances with different concentrations of TEA in the presence of MgSiF6 are shown in Figure 8(b). The reference group lost weight around 100°C, primarily due to the dehydration of AFt, which transformed into a metastable form of AFt. The weight loss at 230°C was caused by the dehydroxylation of the metastable form of AFt. The addition of 1.5 g/L MgSiF6 resulted in the weight loss at 100°C due to the dehydration of calcium magnesium silicate hydrate. As TEA concentration increases, the loss peak area of the AFt increases and then eventually decreases. When the TEA concentration was 0.85 g/L, the amount of AFt generated was relatively high. The reason for this phenomenon could be that excessive amounts of TEA complexed with aluminum ions in the solution reduced the amount of ettringite generated.
Figure 8(d) shows the size distribution of synthesized products with different concentrations of TEA in the presence of MgSiF6. The reference group produces a material of ettringite, which has an average particle size of 347 nm. When 1.5 g/L of MgSiF6 is added, the primary product is calcium fluoride and the average particle size is 347 nm. In the presence of MgSiF6, when the concentration of TEA is between 0.15 and 8.5 g/L, the major product is ettringite with average particle sizes of 185 nm, 185 nm, 235 nm, and 297 nm, respectively. The reason why TEA influences the size of ettringite is the same as its effect on the size of aluminum hydroxide.
Figure 9 shows the SEM images of synthesized samples with different concentrations of TEA in the presence of MgSiF6. It can be seen from Figure 9(a) that the synthesized ettringite is distributed in a columnar shape, with a length of about 200–400 nm. When 1.5 g/L MgSiF6 is added, the morphology of ettringite changes from long columnar to short columnar, with a length of about 200–300 nm (Figure 9(b)). Figure 9(c–f) show the morphology of the synthesized products when different concentrations of TEA are added in the presence of magnesium fluorosilicate. It can be observed that TEA has little effect on the morphology of ettringite. As the amount of TEA increases from 0.15% to 8.5%, the particle size of ettringite first decreases and then increases. When the amount of TEA is 0.85%, the particle size of the synthesized ettringite is relatively small, approximately 150 nm. SEM images of synthesized samples with different concentrations of TEA in the presence of MgSiF6.
Compressive strength
Compressive strengths of SAGMs specimens with different concentrations of TEA in the presence of MgSiF6 are shown in Figure 10. At 4 h, the reference sample had a compressive strength of 18 MPa; when the concentration of MgSiF6 was 1.5 g/L, the compressive strength was 13 MPa, a decrease of 27%; when the concentration of MgSiF6 was kept constant, the compressive strength was 21 MPa, 15 MPa, 21 MPa, and 19 MPa at 0.15 g/L, 0.85 g/L, 1.5 g/L, and 8.5 g/L TEA concentration, respectively, an increase of 16%, 39%, 16%, and 5% compared with that modified by MgSiF6; the TEA addition improved the compressive strength of SAGMs, with 0.85 g/L TEA having the greatest effect. A similar trend was observed at 12 hours, 1 day, 7 days, and 28 days. Compressive strength of SAGMs specimens with different concentrations of TEA in the presence of MgSiF6.
Low-field nuclear magnetic resonance test
The low-field NMR of hardened paste at 4 h in the presence of different concentrations of TEA and MgSiF6 is shown in Figure 11. The relaxation times from left to right are distributed in the ranges of 0.001–0.42 ms, 0.42–4.2 ms, 4.2–44 ms, and 44–1000 ms, corresponding to four different pore types: gel pores in the sample, transition pores for water migration, capillary pores, and voids.
24
Low-field NMR of hardened paste at 4 h in the presence of different concentrations of TEA with MgSiF6.
Cumulative pore volume percentages (%).

When the concentration of MgSiF6 was 1.5 g/L, adding 0.15 and 0.85 g/L of TEA resulted in a shift in relaxation time, a decrease in the proportion of gel pores, and a reduction in the proportion of transition pores. The drop in the proportion of voids indicates that it promoted the transformation of voids into capillary pores and transition pores, resulting in smaller pore sizes.
Keeping the MgSiF6 dose constant, compared with 0.85 g/L TEA, when TEA dose increased to 1.5 g/L and 8.5 g/L, the proportion of the gel pores, transition pores, and voids increased, indicating that capillary pores and transition pores of hardened materials were the smallest in the presence of 0.85 g/L TEA, resulting in higher compressive strength.
The morphology of aluminum gel and ettringite has a significant impact on the mechanical properties of SAGMs. When the TEA concentration was 0.85 g/L, the average particle size of aluminum gel reduced to about 84 nm, and the particle size of ettringite was also small, at about 185 nm. The two products can play a filling role, compacting the hardened slurry structure, and can also act as nanomaterials, serving as the nuclei for the hydration products, which improves the mechanical properties.
Conclusions
(1) By adding 1.5 g/L MgSiF6, the heat release rate of the slurry was significantly reduced; whereas TEA added at 0.15 and 0.85 g/L significantly increased the heat release rate of the slurry in the presence of 1.5 g/L MgSiF6. With higher concentrations of TEA, such as 1.5 g/L and 8.5 g/L, the hydration heat release rate decreased steadily; the setting time of SAGMs was shorter when MgSiF6 was introduced at different TEA concentrations. A TEA concentration of 0.85 g/L resulted in a 52% and 27% reduction in setting times, respectively. (2) In the presence of MgSiF6, all TEA concentrations promote the dissolution of CaSO4 and anhydrous calcium sulfoaluminate. The dissolution rate of CaSO4 increased with the increasing TEA concentration, while the dissolution rate of anhydrous calcium sulfoaluminate first increased and then decreased with the increasing TEA concentration, among which the dissolution rate of anhydrous calcium sulfoaluminate was the fastest when the TEA concentration was 0.85 g/L. (3) In the presence of MgSiF6, AFt production initially increased but decreased with the increasing of TEA concentration. When the TEA concentration was 0.85 g/L, AFt production was the highest and the average particle size was the smallest, 185 nm; in the presence of MgSiF6, as the TEA concentration increases, aluminum hydroxide can complex with TEA and the amount generated gradually increases, but particle size first decreases and then increases. When the TEA concentration is 0.85 g/L, the average particle size is smaller, at 84 nm. (4) Compared with the slurry containing only MgSiF6, TEA significantly increases the compressive strength of SAGMs specimens at 12 hours, 1 day, 7 days, and 28 days. When 1.5 g/L of MgSiF6 exists, adding 0.85 g/L TEA generates ettringite and aluminum hydroxide particles with smaller sizes, as well as a smaller peak area for gel pores, transition pores, and voids. By doing so, the hardened slurry’s pore size is optimized, resulting in improved mechanical properties.
Footnotes
Funding
The authors gratefully acknowledge the National Natural Science Foundation of China (52208243).
Declaration of conflicting interests
The authors declared no potential conflicts of interest with respect to the research, authorship, and/or publication of this article.
Data Availability Statement
The published article contains all of the data, models, and code developed or used during the study.