
Abstract
In this study, the effects of core topologies, relative density of the triply periodic minimal surface (TPMS) core, and graded relative density on the bending properties and energy absorption capacity of the TPMS wood-plastic composite sandwich structures were numerically investigated. The results indicated that, the sandwich structures with a Neovius core had better performance compared to other core topologies. With the relative density increasing from 15% to 30%, the bending stiffness of uniform sandwich structures with Primitive, Gyroid, and Neovius cores increased by 2.23, 1.17, and 2.71 times, respectively. Compared to uniform TPMS beams, graded structures showed decreased bending strength and toughness but increased bending stiffness. Based on these results, this paper proposed a method for calculating the bending stiffness of the graded sandwich structures. In this study, wood-plastic composite sandwich structures with a TPMS core exhibited higher bending stiffness and energy absorption than those with a traditional Honeycomb or Re-entrant honeycomb core. The calculation and test results indicated that TPMS sandwich structures can achieve ideal bending performance through graded design, and the calculation model can be used to select the best TPMS sandwich structure.
Keywords
Introduction
Sandwich structures are widely recognized for their unique design, which consists of a low-density core and facesheets. This arrangement creates a structure with high strength-to-weight ratio, excellent stiffness, and superior energy absorption characteristics. 1 Hence, these structures are widely used in aerospace,2,3 automotive,4,5 marine 6 and building7–10 applications. In sandwich composite materials, panels are typically designed to be simple, while the core is relatively complex. The core is intended to achieve maximum weight reduction through geometric mass distribution, material selection, or a combination of both, while maintaining the structural integrity of the sandwich structure. The mechanical performance of sandwich structures is determined by their constitutive materials, geometric design, and the topology of the core, with the panels bearing in-plane loads and bending, while the honeycomb core transmits transverse shear and compression loads. 1 Foam core materials are considered conventional designs for sandwich structures and have been tested under bending load conditions.11–13 With the development of additive manufacturing technology(AM), it has become possible to manufacture honeycomb structures with complex topologies that are difficult to achieve using traditional methods.
Recently, porous materials based on triply periodic minimal surfaces, particularly their sheet-like counterparts, have garnered widespread attention for exhibiting superior mechanical properties compared to foam structures. TPMS is a type of periodic implicit surface with zero mean curvature. Therefore, compared to other types of structures, TPMS porous structures have two significant advantages. (a) The entire structure can be precisely represented by mathematical functions. Basic properties, such as porosity or specific surface area, can be directly controlled by adjusting the function parameters. (b) The surface of TPMS is extremely smooth, without sharp edges or junctions typical of lattice structures. In addition, TPMS porous structures have highly connected, non-twisted channels, which provide significant advantages for applications. 14 Their compressive mechanical properties have been extensively studied through experiments and calculations.15–18 However, there is limited knowledge regarding their behavior under bending loads. Pelanconi and Ortona investigated the bending behavior of sandwich structures based on uniform Gyroid cores, revealing that these structures offer higher bending stiffness with lower weight. 19 Novak et al. studied the energy absorption of uniform Diamond-type triply periodic minimal surface (TPMS) filled tubes under three-point bending loads, revealing a 46% increase in energy absorption compared to empty tubes. 20 They found that the bending performance of TPMS core structures can be adjusted by varying the relative density. Structures subjected to bending loads experience both shear stress and uniaxial stress within the structure. In simply supported beams, shear stress peaks in the support region, while axial stress reaches its maximum at the through-thickness boundaries within the mid-span of the beam length. 21 Considering that each type of lattice structure responds differently to shear and axial stresses, adopting relative density grading is effective in withstanding these stresses and further optimizing the bending performance of lightweight beams. Al-Ketan et al. investigated the effect of linear functionally graded additive manufacturing on the compressive properties of sheet-based TPMS lattices, and found a transition in the failure mechanism from shear band-dominated failure to layer-by-layer collapse. 22 Yang et al. investigated the mechanical response of graded Gyroid structures in compression, analyzing the mechanical effects of gradient structures on Gyroid structures and developing a mathematical model to obtain customized mechanical properties for graded structures. 23 It is also important to note that the literature has not considered the graded design of TPMS beams based on bending stress states to enhance their bending properties. This is the primary objective of our work.
Wood plastic composite (WPC) is a biocomposite material reinforced with wood fibers and polymers, known for its low raw material costs, excellent stability, recyclability, and environmental friendliness. The tensile and compressive strength of WPC can reach 21.3 MPa and 34.7 MPa, 24 respectively, surpassing the mechanical strength design values specified for the highest grade of wood in Chinese and European wood structure standards. The physical properties of WPC are sensitive to temperature changes, with its strength and modulus of elasticity decreasing significantly with increasing temperature. 25 Moreover, the creep performance of wood-plastic composite materials should not be overlooked under long-term loading conditions. Therefore, most of the mechanical properties of wood-plastic composites currently available on the market do not meet the requirements of structural materials for buildings, necessitating reinforcement. Borah et al. and Vaisanen et al. summarized the latest techniques of improving the mechanical properties of wood-plastic composites by combining thermoplastic composite materials such as polyethylene, polypropylene, and polyvinyl chloride with wood fibers.26,27 Gao Xun et al. investigated the influence of wood fiber with different diameters and aspect ratios on the physical properties of wood-plastic composite materials. 28 Wood-plastic composites and aluminum were pressed together to form aluminum-reinforced wood-plastic composite (A-WPC). The experiments showed that the ultimate stress-strain and elastic modulus of A-WPC were much higher than those of WPC, and the elongation at break was 10.13 times that of WPC, significantly improving its ductility. 29 Zhao and Fei Xi further designed A-WPC for application in beam structures and conducted bending tests on A-WPC beams with different spans. The experiments showed that the average ultimate load of samples with a span-to-depth ratio of 12 was 66.75% higher than that of samples with a span-to-depth ratio of 18, with an average deflection at failure of 38.03% lower. The average ultimate load of samples with a span-to-depth ratio of 6 was 65.97% higher than that of samples with a span-to-depth ratio of 12, with an average deflection at failure of 43.86% lower. The strength utilization rate of A-WPC was 4.46%–9.36% higher than that of various engineered wood beams. 30
Currently, research on wood-plastic composite materials mainly focuses on improving the mechanical strength of the materials, but their overall performance has not yet reached the level for commercial production. The bonding of wood-plastic composite materials with aluminum alloys can not only improve the mechanical properties of lightweight aluminum materials but also protect and enhance the surface and aesthetics of composite materials. TPMS structures have various cross-sectional shapes and sizes, thereby meeting the requirements for applications in building beam frameworks. By designing TPMS-WPC structures and incorporating them into beam structures, it is possible to overcome the limitations of solely focusing on the mechanical strength of wood-plastic composite materials. Simultaneously considering the impact of structural types on the overall mechanical performance of beams can promote their application in the field of building structures. In this paper, we focused on the bending properties and the energy absorption of sandwich structures with Primitive, Gyroid, and Neovius cores and proposed a method for calculating the bending stiffness of the graded sandwich beams.
Design of sandwich structures
Theoretical model
Implicit function design methods can be used to generate triply periodic minimal surfaces, such as Primitive (P), Gyroid (G), and Neovius (N), which can then be utilized to create solid structures via thickening processes. 31 We defined these surfaces as follows:
Primitive

Gyroid

Neovius

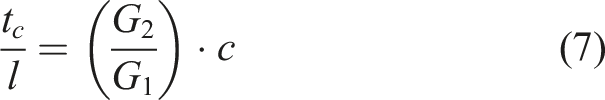
The efficiency of TPMS structures in practical applications relies on comprehending their topological structure and the capability to adjust shape and mechanical properties by tuning their relevant parameters. Shell-like TPMS lattice structures are characterized by three key parameters: unit cell size (l), cell thickness (t
c
), and horizontal constant set (c), as shown in Figure 1. The relative density ρ in lattice structures has a significant impact on mechanical performance, where relative density is determined by the volume of the lattice structure occupied within a cubic volume, as illustrated in equation (4) Diagram of parameters affecting the unit cell structure of shell-like TPMS.


G1 and G2 constants for each sheet-TPMS geometry.


Quantitative diagrams of the following: (a) relative density to the level-set constant c, (b) relative density to the t c /l ratio.
According to the semi-empirical formula proposed by Gibson and Ashby. For the uniform TPMS sandwich structures studied in this work, the fitted Gibson–Ashby equations are as follows
The relationships between the elastic modulus E
t
of TPMS lattice structures and the ratios t
c
/l and level-set constant c are shown in equations (9) and (10)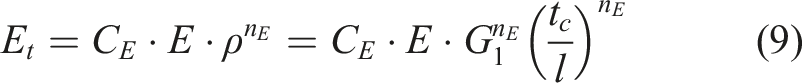

The bending obtained stiffness is based on the equivalent bending stiffness (EI)
eq
. According to the parallel axis theorem, the equivalent flexural rigidity of a sandwich structure with a rectangular cross-section, as shown in Figure 3, is given by equation (11) as follows Computer-aided design models of the shell type Primitive wood-plastic sandwich structures.


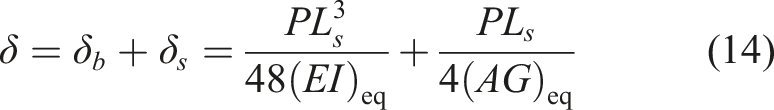

Substituting equation (11) into equation (12) yields the theoretical bending stiffness of wood-plastic composite sandwich structures, as follows in equation (15)
Due to the non-uniformity of density and structural gradient in TPMS structures and the uncertainty in loading direction, determining the bending stiffness of gradient structures solely by changing the relative density of the structure is not accurate, as shown in Figure 4. This problem can typically be addressed using composite material models, where the stiffness of the structure was influenced by all layers of composite materials, and the elastic modulus can be calculated using the following formula The model diagram of a stack of n different materials or lattice cell types.

The bending stiffness of TPMS wood-plastic composite beam components is calculated based on the slope of the linear portion of the load-displacement curve, and the energy absorption is calculated based on the area under the load-displacement curve. According to equations (1)–(15), the bending stiffness of wood-plastic composite sandwich structures is directly related to the aspect ratio t c /l and the level-set constant c of TPMS structures. After conducting three-point bending experiments, understanding the relationship between t c /l, level-set constant c, and the bending stiffness and energy absorption performance of sandwich structures, adjustments to the relative density of TPMS structures can be made according to different bending stiffness requirements. Further adjustments to TPMS structures can be made by considering the functional relationship between the level-set constant c, t c /l, and relative density.
TPMS–wood–plastic composite sandwich structures design strategies
Design parameters of sandwich structure (Units: mm).


CAD models of USS at different relative densities.
The relative density of graded TPMS wood-plastic sandwich structures decreases gradually along the z-axis, where there is an almost linear relationship between the relative density of lattice cells and the horizontal constant c and thickness ratio t
c
/l, as illustrated in Figure 2. To generate graded TPMS structures, the level-set constant c and lattice cell thickness t
c
are continuously varied along the z-axis to construct lattice structures with continuous changes in relative density. The design process of the Primitive wood-plastic composite sandwich structure is illustrated in Figure 6(a). The P-GSS consists of three unit cells along the z-axis, with the relative density gradually increasing along the z-axis. The graded density Primitive lattices nested in the wood-plastic composite tube form the TPMS wood-plastic composite sandwich structure. The design processes of P-GSS, G-GSS, and N-GSS were similar, as shown in Figure 6(b), where the three types of GSS wood-plastic composite sandwich structures were presented. Figures 7(a)–(c) depicted the sandwich structures of P-GSS, G-GSS, and N-GSS with relative density gradients ranging from 15% to 30%, 17.5% to 30%, 20% to 30%, 22.5% to 30%, and 25% to 30%. Figure 7(d) illustrated the design process of the density gradient of P-GSS unit cells with a gradient density of 15–30%. The geometric features between and within layers are continuously varied in the designed GSS. The average relative density of the top layers is 15%, 17.5%, 20%, 22.5%, and 25% for 15–30, 17.5–30, 20–30, 22.5–30, and 25–30 GSS, respectively, while the average relative density of the bottom layers is all 30% for GSS. Design model of GSS wood-plastic composite sandwich structure: (a) Design process of P-GSS wood-plastic composite sandwich structure, (b) P-GSS, G-GSS, N-GSS wood-plastic composite sandwich structures. CAD models of GSS at different relative densities. (a-c) GSS models, (d) schematic of 15–30% P-GSS.

Numerical simulation
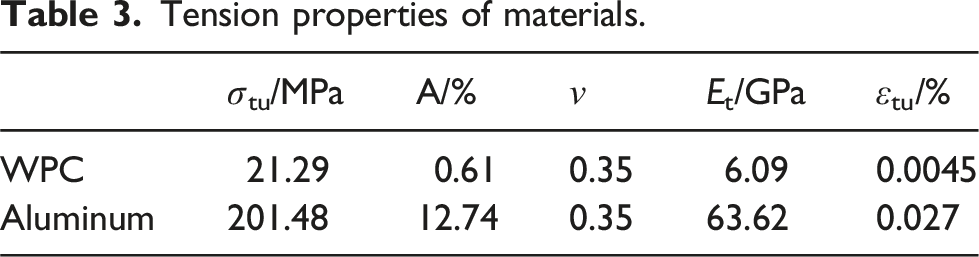
Tension properties of materials.

Numerical model for three-point bending test.
To find the optimal mesh size for the numerical model, a mesh size convergence analysis was carried out. The SHELL181 element was used to mesh the triply periodic minimal surface sandwich structures. Figure 9(a) showed the load-displacement curves for P-USS sandwich structures with a relative density of 20% under a dynamic speed of 5 m/s for different mesh sizes. The figure demonstrated that when the mesh size was reduced from 5 mm to 2 mm, the load decreases, and the load-displacement curves converge as the mesh size decreases from 3 mm to 2 mm. Subsequently, tetrahedral elements are used for meshing the TPMS structure, with element size of 2.5 mm. Three-point bending tests were conducted under quasi-static and dynamic loading conditions using a servo-hydraulic dynamic testing machine (INSTRON 8801). The cross-head rate was set to 0.25 mm/s for quasi-static loading and 284 mm/s for dynamic loading. In computational simulations, the dynamic velocity was increased from 284 mm/s to 5 m/s to accelerate the simulations. This adjustment was validated as acceptable through computational analysis, as illustrated in Figure 9(b). Due to the influence of loading speed, the load-displacement curve at 5 m/s was higher than that at 284 mm/s in the displacement range of 0–10 mm. However, when the displacement exceeded 10 mm, the two curves closely overlapped. Convergence study (a) and the effect of loading velocity (b).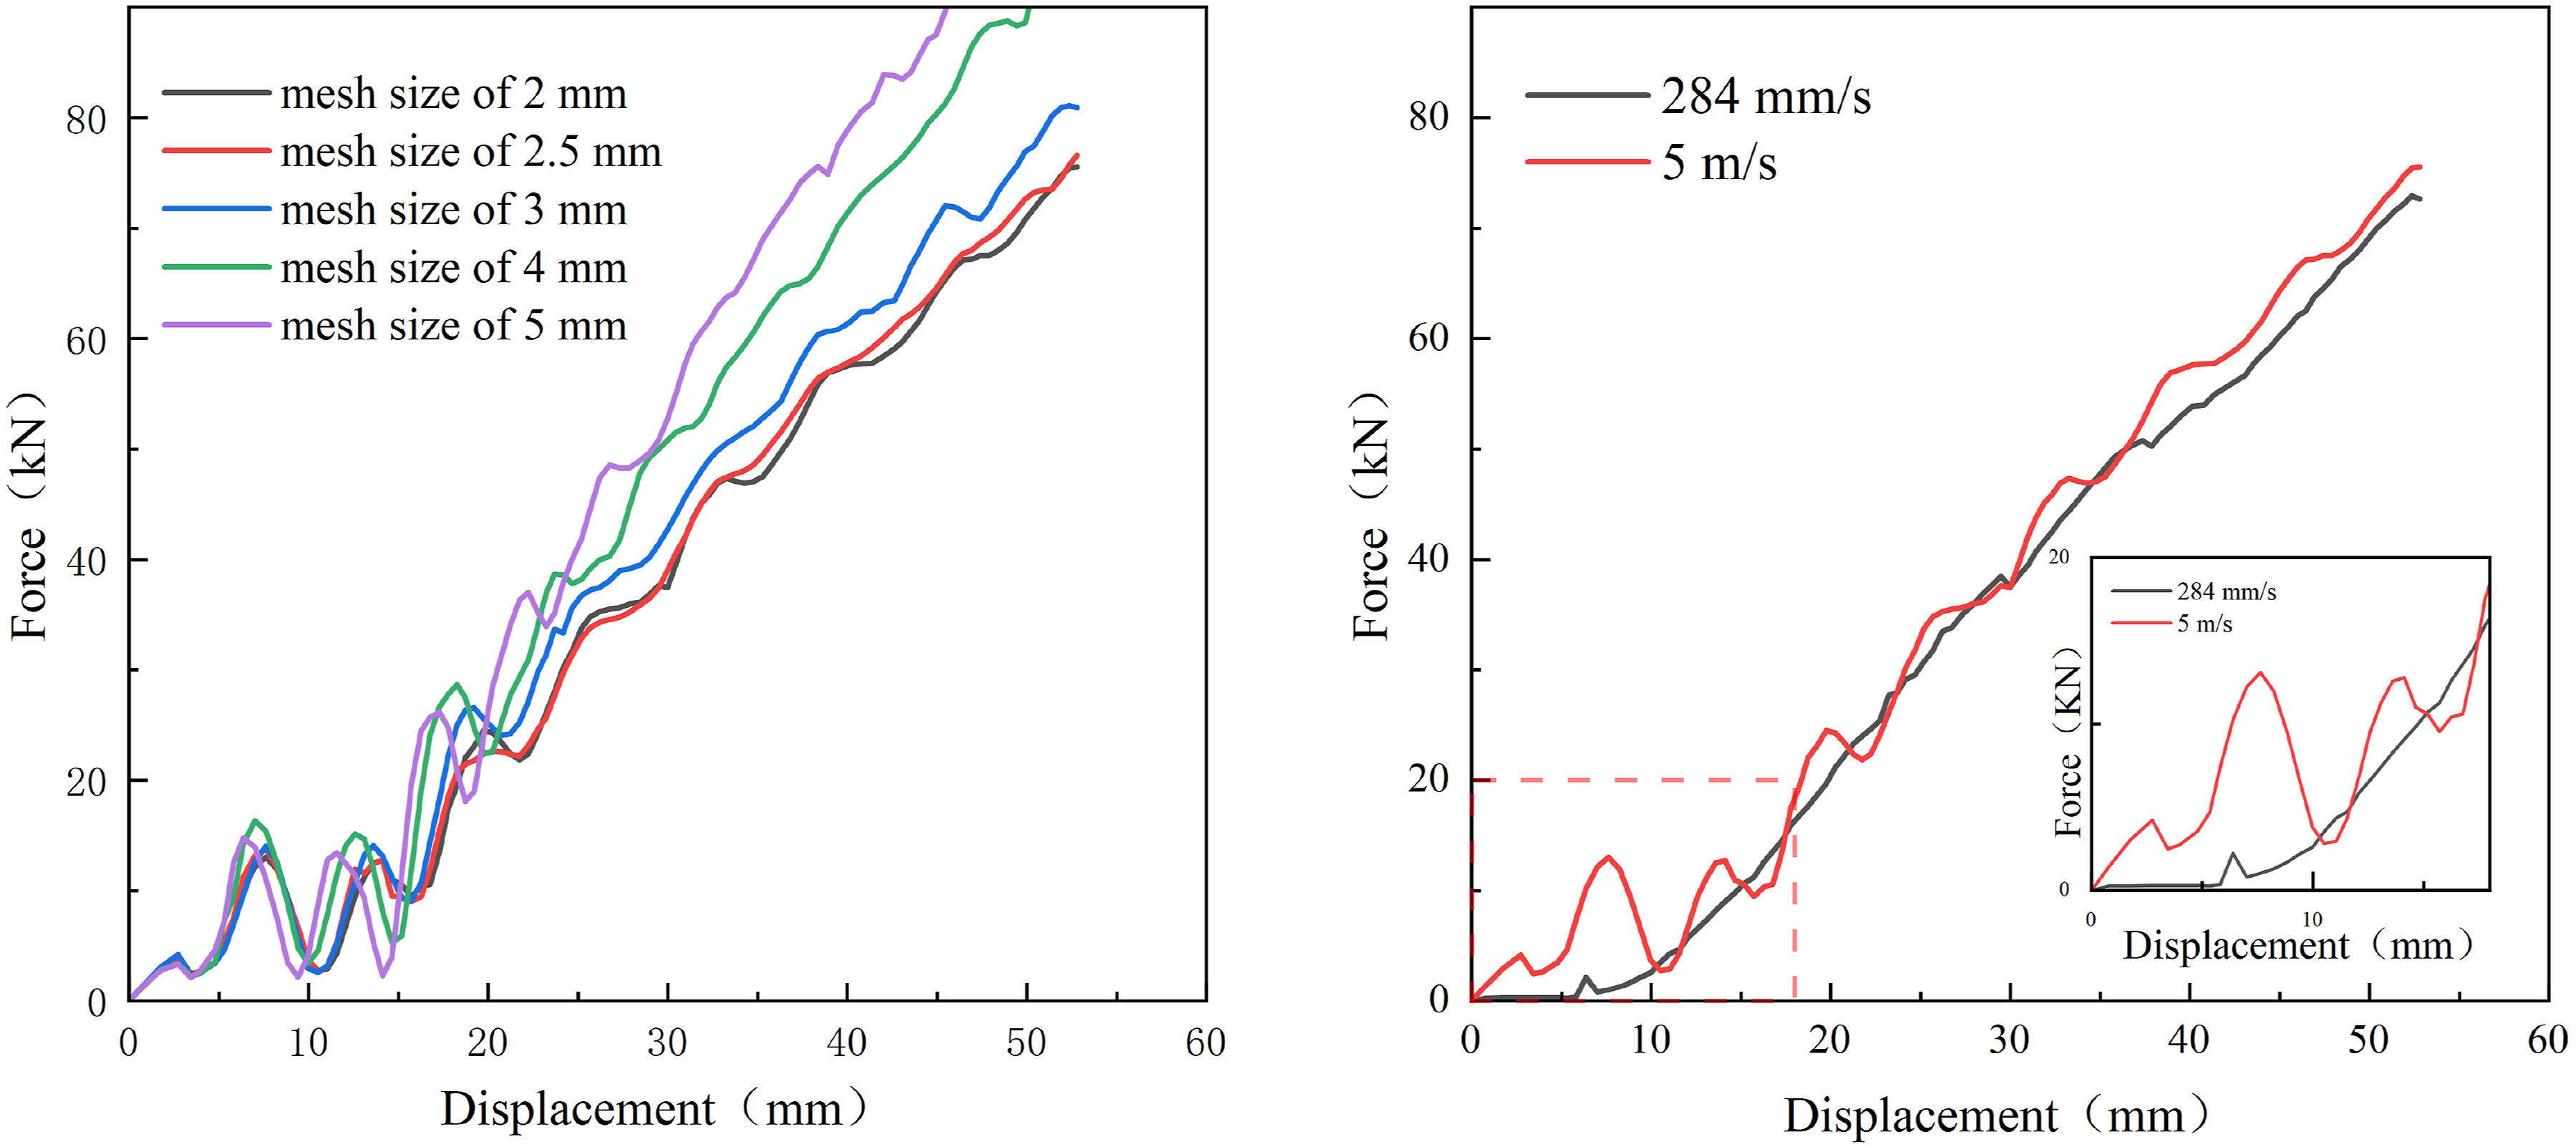
Verification of the FE model
To verify the accuracy of the established finite element model, the bending behavior of the Primitive sandwich structure with a relative density of 20%, obtained from finite element simulations, was compared with experimental data under quasi-static conditions. In this section, the Primitive structure was scaled down to one-third of its original size. It consisted of 54 unit cells (18 × 1 × 3) with a side length of 16.67 mm. The WPC was fabricated by hot pressing at a temperature of 160°C–200°C and pressure of 10 MPa. Using the LPBF technique, the TPMS structural specimens were fabricated through additive manufacturing with the EOS M400-4 3D printer, utilizing AlSi10 Mg powder supplied by EOS with a density of 2.64 × 10⁶ kg/mm3.
21
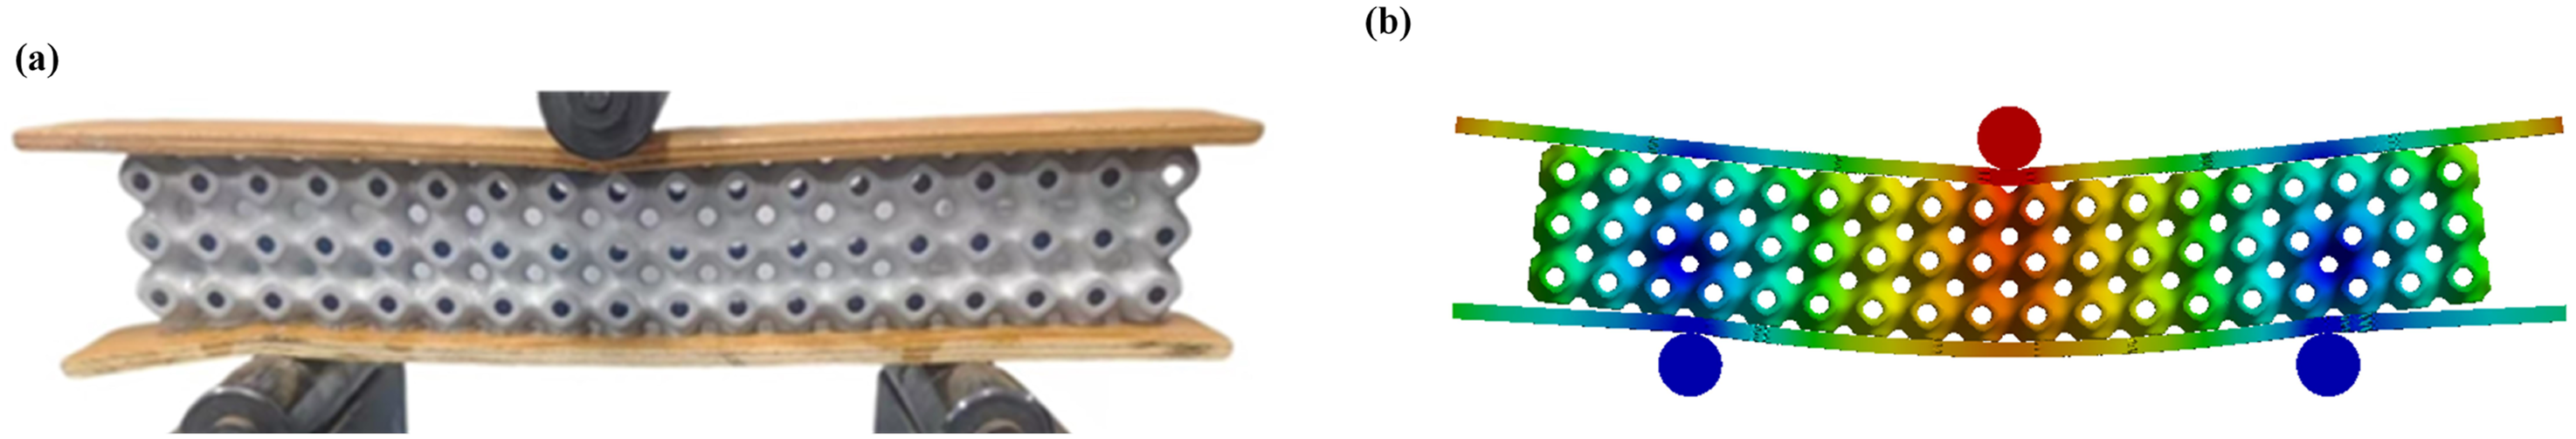
To observe the TPMS structure deformation, the WPC composite panels on both sides were omitted. After the fabrication of the aluminum alloy TPMS and WPC panels, the two panels were bonded to a core structure using epoxy adhesive (E-00NS). The specimens were kept under fixtures for 24 h to ensure firm adhesion. The experiment is conducted using an electronic universal testing machine (INSTRON 8801), as shown in Figure 10. The material properties of the experimental structure were provided in Table 3. Three-point bending test set-up of the 3D-printed sandwich structure.
Figures 11 and 12 showed the comparison between the bending behavior of the Primitive structure from the finite element simulation and the experimental data. The load-displacement curve from the finite element simulation matched well with the experimental results (Figure 11). The slight discrepancy between the experimental and simulation results could be attributed to manufacturing defects and material inhomogeneity.40,41 Beyond the elastic range, a noticeable difference was observed where the experimental load-displacement curve suddenly dropped, while the finite element simulation curve continued to increase. This was primarily because the computational model did not fully account for damage and failure, which resulted in an overestimation of the bending stress. Additionally, the deformation of the Primitive sandwich structure exhibited a good correlation with the experimental structure (Figure 12). In the experiment, the WPC board was damaged, and the Primitive structure underwent bending deformation, both of which were observed in the simulation. Comparison of load–displacement curves between experiment and simulation. Deformation of the Primitive sandwich structure with a relative density of 0.2 under three-point bending load before failure: (a) deformation under experimental conditions, and (b) deformation as predicted by numerical simulation.
Results and discussion
Computational bending properties results of uniform sandwich structures
Figures 13(a)–(c) presented the load-displacement curves of P-USS, G-USS, and N-USS with different core relative densities. A noticeable effect was observed the core topology of TPMS sandwich structures has a significant impact on the load-displacement curves under three-point bending conditions. The sandwich structures with Neovius cores exhibited higher strength at the same core relative densities compared to those with other core topologies. The load-displacement curves of TPMS sandwich structures showed an overall oscillating upward trend, with high repeatability of mechanical curves for multiple samples of the same structure. With the increase in relative density, the bending stiffness of P-USS, G-USS, and N-USS increased. It was worth noting that the load-displacement curves of different types of sandwich structures exhibited the first peak at a displacement of around 5 mm. This was due to the compression failure of the outer wood-plastic composite tube structure, resulting in a sudden decrease in load. At this point, the contribution of the TPMS core layer to the bending performance of the sandwich structure was relatively small. With the increase in displacement, the load was primarily supported by the TPMS structure, leading to an upward oscillation in the load-displacement curve. This oscillating trend can be attributed to the theory of shock wave propagation in porous materials. The stress shock wave was generated by the dynamic compression of the TPMS sandwich structure. The fluctuations in the load-displacement curve were caused by the multiple reflections of stress waves at the critical interfaces between the unit layers. Strong discontinuous shock waves were generated between the compression roller and the fixed rollers. When the density of the layers changes along the direction of the primary wave propagation, a mixture of reflected and propagating waves occured, accompanied by strong discontinuous waves in the adjacent layers and simple waves in the subsequent layers.42–45 Figure 13(d) illustrated the maximum load of TPMS sandwich structures, indicating a substantial increase in maximum load with the rise in relative density of the core TPMS structure. For instance, with the relative density increasing from 15% to 30%, the maximum loads of P-USS, G-USS, and N-USS increased by 3.36, 2.09, and 2.28 times, respectively. Load-displacement curves of TPMS-USS at various relative densities under three-point bending: (a) P-USS, (b)G-USS, (c)N-USS, and (d) maximum load of the TPMS sandwich structures.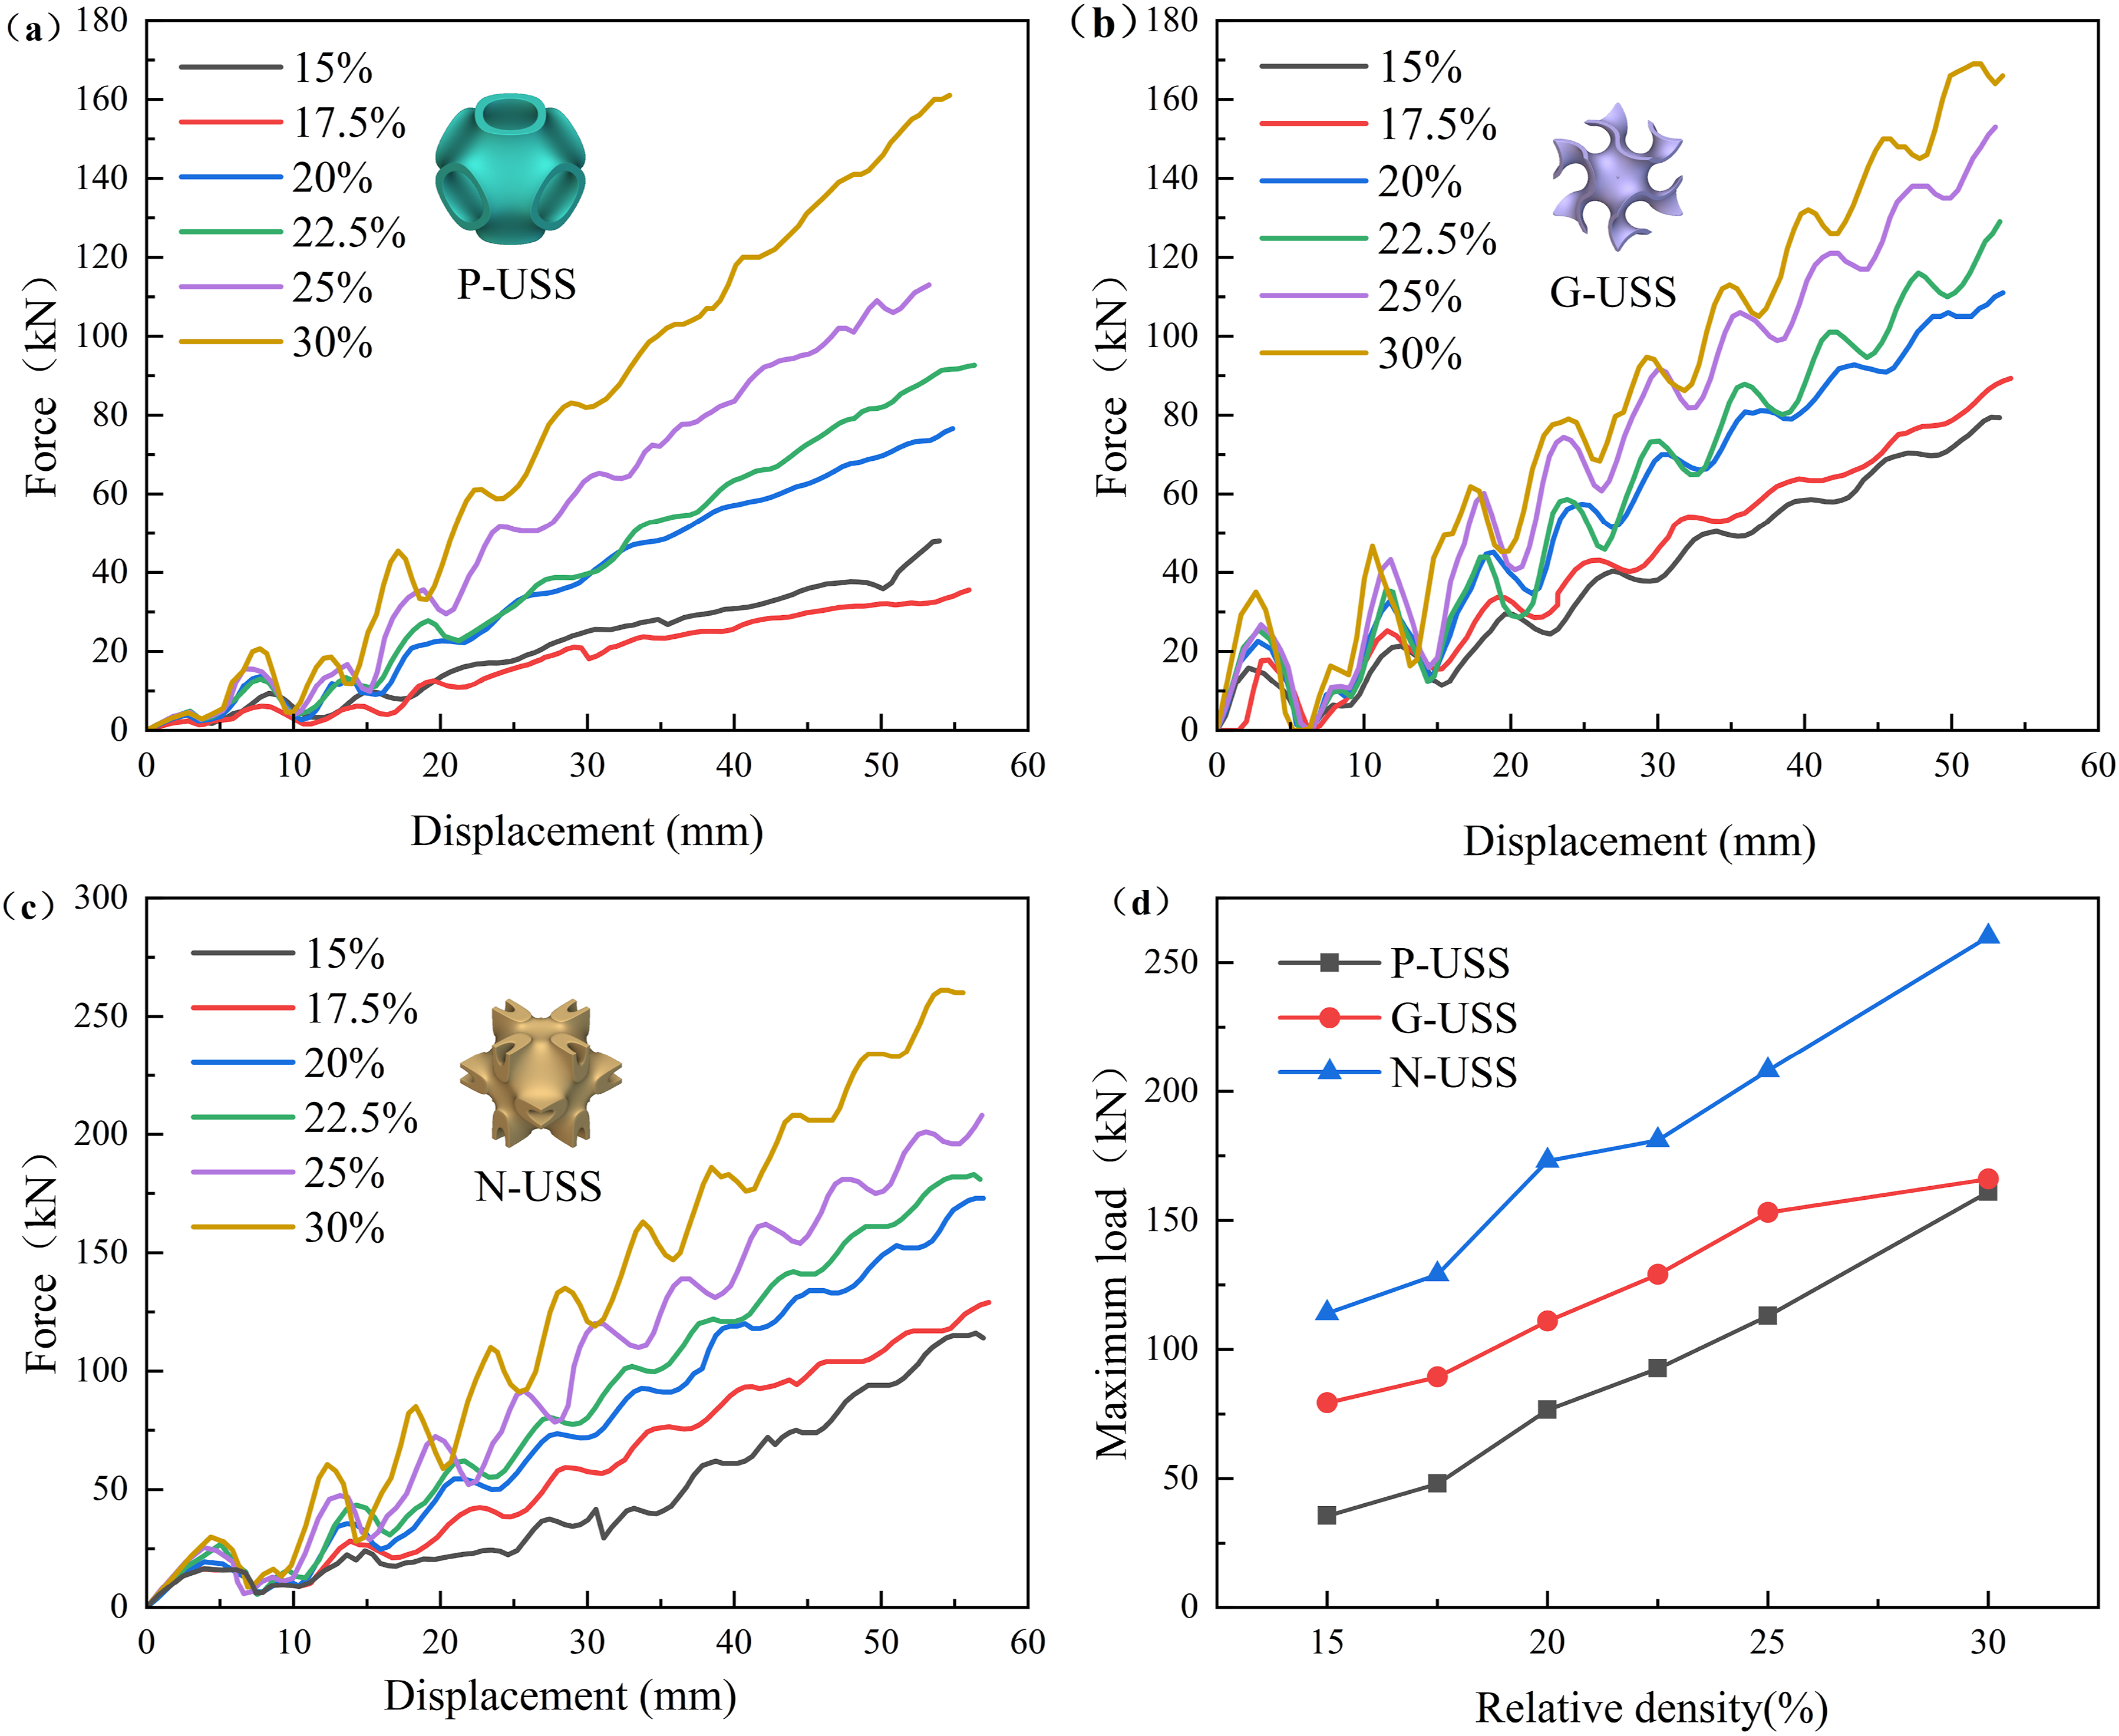
Figure 14 presented the von Mises stress distribution of TPMS sandwich structures with a 20% relative density at the end of three-point bending compression. The results indicated that von Mises stress mainly concentrated on the core TPMS structure. The wood-plastic composite tubes failed at approximately 5 mm of compression. Since no fracture criteria were taken into consideration in the FEA simulation, no significant damage could be observed in the wood-plastic composite tubes and TPMS structures at the end of compression. Similar phenomenon were found in sandwich structures with Primitive, Gyroid, and Neovius core structures, where noticeable core buckling was observed in all structures. Compared to other core structures, the Neovius core structure exhibited higher stress levels than the other two types. At the final stage of compression, the average stress borne by the Primitive, Gyroid, and Neovius structures was 351.33 MPa, 254.47 MPa, and 593.78 MPa. No high-stress regions were observed in the Gyroid structure. This was because that due to the closely connected cells and high surface area-to-volume ratio of Gyroid beams allow for smoother and faster stress transfer between cells compared to the Primitive structure. The bending resistance of the TPMS sandwich structure primarily depended on the relative densities of the core structure. Deformation of sandwich structures including P-USS, Primitive, Gyroid, and Neovius cores with relative densities of 0.2 under three-point bending load at a displacement of 50 mm.
Computational bending properties results of graded sandwich structures
Figures 15(a)–(c) showed the load-displacement curves of P-GSS, G-GSS, and N-GSS under different density gradients. Under the conditions of three-point bending experiments, the load-displacement curve of the graded TPMS structure showed an overall oscillating upward trend with the increase of displacement. Compared to the uniform TPMS sandwich structures, the load-displacement curves of the graded TPMS sandwich structures had a higher oscillation frequency, smaller differences in density gradient curves, and higher load-bearing capacity. This indicated excellent bending performance and stronger designability of the graded TPMS structures. The density gradient had the greatest impact on the bending stiffness of P-GSS. The P-GSS structure with a graded density of 15–30% had a bending stiffness of 1.24 kN/mm, which was 1.82 times that of P-USS with a relative density of 15% (0.68 kN/mm). The maximum load of the G-GSS with a graded density of 25%–30% was 171 kN, which was higher than the maximum load of 166 kN of the uniform structure with a relative density of 30% for G-USS. This result indicated that by graded designing the relative density of the core layer in TPMS sandwich structures, it was possible to increase the load-bearing capacity of TPMS sandwich structures while reducing the weight of the structure, thus achieving the goal of lightweight design. Figure 15(d) depicted the maximum load of TPMS sandwich structures under different graded densities. With the increase in graded density, the maximum load of various types of TPMS sandwich structures significantly increased. The maximum load of N-GSS was higher than that of P-GSS and G-GSS under the same gradient. The maximum load of N-GSS with a graded density of 25–30% was 226 kN, which was 1.66 times the maximum load of P-GSS with a graded density of 25–30% (135.85 kN), and 1.32 times the maximum load of G-GSS with a graded density of 25–30% (171 kN). Load-displacement curves of TPMS-USS at various gradient relative densities under three-point bending:(a) P-GSS, (b) G-GSS, (c)N-GSS, and (d) maximum load of the TPMS sandwich structures.
Figure 16 showed the von Mises stress distribution map of TPMS sandwich structures with graded densities of 20–30% at the end of three-point bending compression. Compared to uniform structures, graded relative density exhibited unique mechanical responses. von Mises stress in TPMS beams started from the cell bending near the compression side roller and propagated along the neutral surface between the two supporting rollers. Grading the relative density through the beam’s thickness resulted in the least material distribution at the top layer, causing higher maximum stress than in uniform structures. At the final stage of compression, the average stress borne by the graded Primitive, Gyroid, and Neovius structures was 388.71 MPa, 465.96 MPa, and 611.13 MPa. The graded relative density design created a relatively weak zone in the top layer. As three-point bending compression progressed, the top compressive strain gradually increased, causing the uniaxial strength near the upper-middle roller to exceed shear strength, while the shear strength between the two lower rollers and the middle roller exceeded uniaxial strength. Compared to uniform TPMS beams, graded structures showed decreased bending strength and toughness but increased bending stiffness. This result was consistent with the phenomenon observed in the article.
21
Although grading the relative density can cause the TPMS structure walls to be relatively thin, the primary benefit of this approach was the enhanced bending stiffness of the TPMS beams while reducing weight. In fact, further design modifications to the relative density grading scheme can improve the bending performance of the structural beams. Under three-point bending loads, the von Mises stress of TPMS beams decreases from the loading side roller along the middle of the beam and then increases. This can be achieved by reversing the relative density grading within the von Mises stress region, making the plate thickness maximum at the top and bottom surfaces of the beam and gradually decreasing towards the neutral surface with the highest equivalent stress. Deformation of sandwich structures including P-GSS, Primitive, Gyroid, and Neovius cores with graded relative densities of 20–30 under three-point bending load at a displacement of 50 mm.
The energy absorption of different sandwich structural designs under three-point bending loading conditions was calculated. The energy absorption of USS and GSS under different relative densities and graded densities was compared in Figure 17. The peak energy absorption of sandwich structures was related to the strain of the core layer structure. The energy absorption of USS mainly depended on the core topology and relative density. As the relative density increased, the energy absorption of USS increased. For example, with the relative density increasing from 15% to 30%, the energy absorption of P-USS, G-USS, and N-USS increased by 4.13, 2.20, and 2.63 times, respectively. Compared to P-USS and G-USS, N-USS with the Neovius core topology were exhibited the highest energy absorption. As shown in Figure 17(b) with an increase in graded relative density, the energy absorption of GSS gradually increased. With the graded relative density increasing from 15–30% to 25–30%, the energy absorption of P-GSS, G-GSS, and N-GSS increased by 1.72, 1.43, and 1.31 times, respectively. Compared to USS with different graded densities, GSS were exhibited smaller fluctuations in energy absorption. This was because the densification strain of GSS mainly depended on the maximum relative density of the core layer, while the bottom layer of the GSS structure had the same relative density of 30%. Graded TPMS energy absorption shows that gradient design decreased the flexural toughness of the TPMS beams but increased their bending stiffness. Overall, sandwich structures with N-USS core topology had higher energy absorption capacity, regardless of whether they were USS or GSS. Energy absorption of sandwich structures with a TPMS core at different relative densities:(a) TPMS-USS, and (b) TPMS-GSS.
The equivalent flexural rigidity and shear rigidity of uniform TPMS cores.

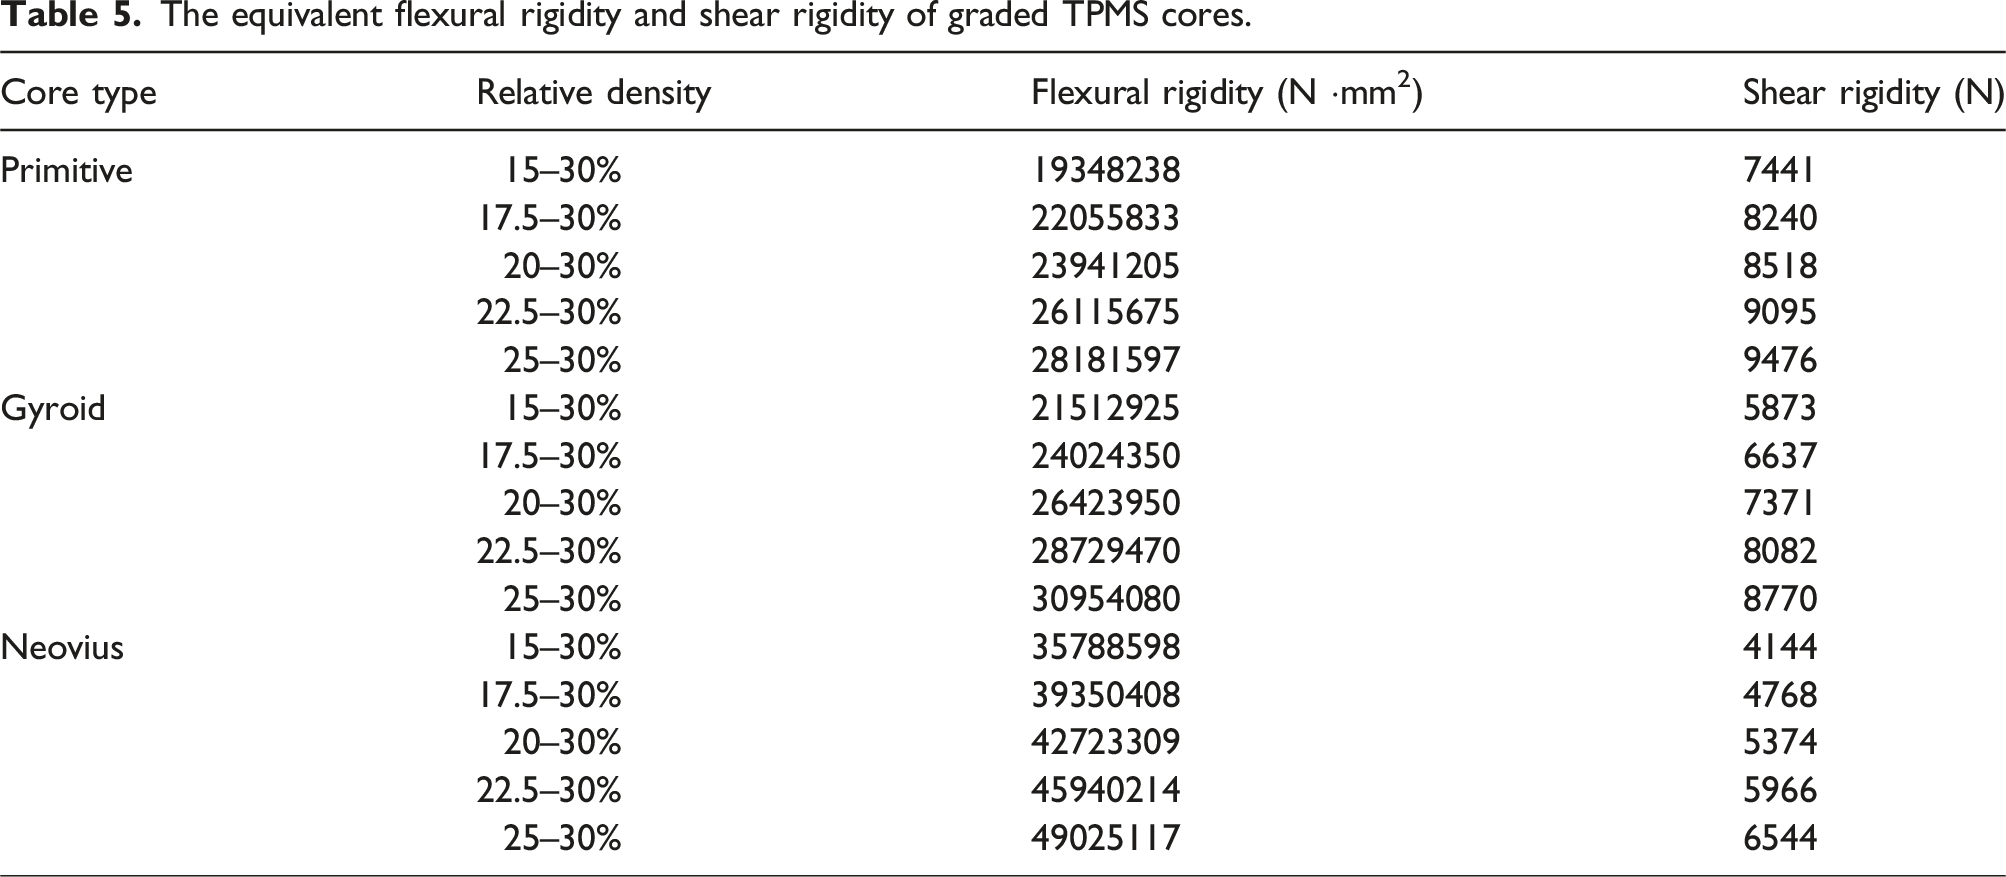
As shown in Figures 18(a), (c), and (e) the bending stiffness of uniform sandwich structures with different relative densities was compared between semi-theoretical formulation and numerical simulations. A small mismatch was observed between the results obtained by the semi-theoretical formulation used in this work and those obtained in the simulation experiments, which may be attributed to the current semi-theoretical formulation not considering the effect of short beams. The short-beam effect could potentially be addressed by incorporating micropolar or coupled stress theories.47,48 For P-USS, the maximum difference between the semi-theoretical formulation calculation and numerical simulation was 36% at a relative density of 15%, but within the relative density range of 20% to 25%, the semi-theoretical formulation calculations closely matched the simulated values. For G-USS and N-USS, the maximum difference between the semi-theoretical formulation calculation and numerical simulation was around 10%, and the predicted results were more accurate within the studied range of relative gradients. As the relative density increased from 15% to 30%, the bending stiffness of P-USS, G-USS, and N-USS increased by 2.23, 1.17, and 2.71 times, respectively. The bending stiffness of graded TPMS sandwich structures was calculated using a semi-empirical formulation combined with a composite material model. The equivalent flexural stiffness and equivalent shear stiffness of the studied graded TPMS cores were presented in Table 5. The GSS had three cells in the z-axis direction, which were divided into three layers according to the composite material model. The calculation of bending stiffness for uniform sandwich structures and graded sandwich structures. The equivalent flexural rigidity and shear rigidity of graded TPMS cores.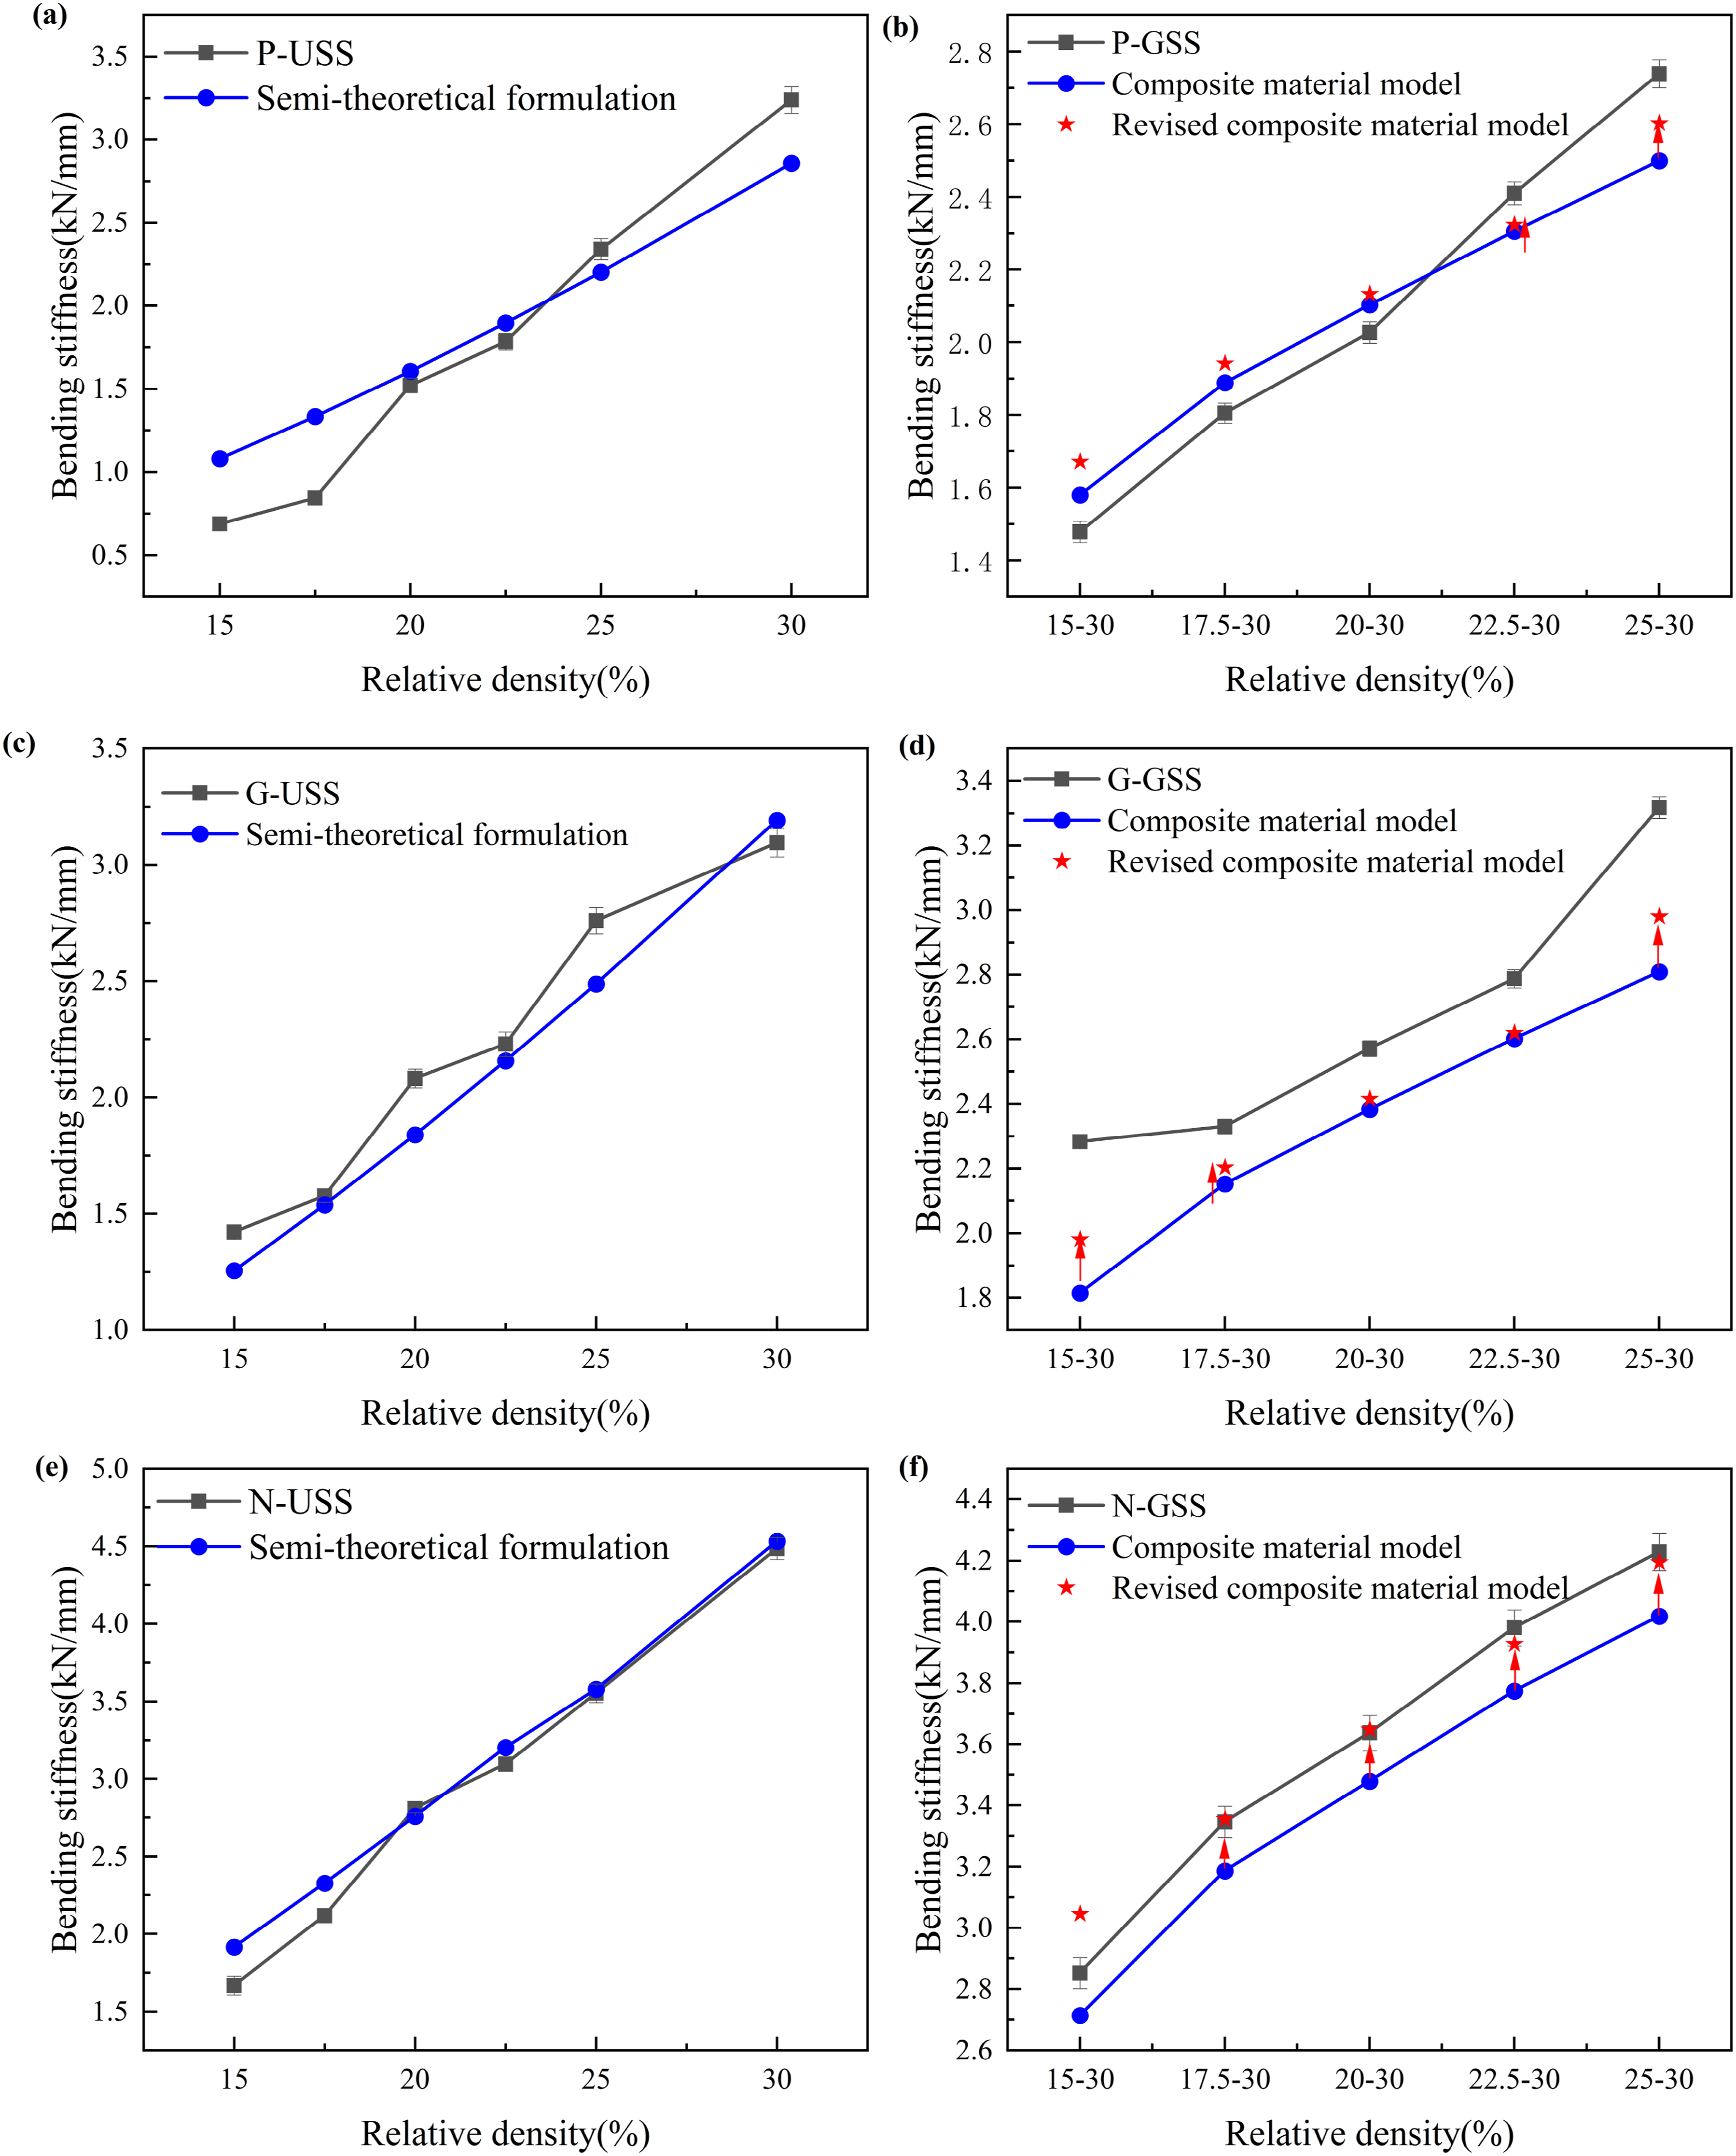
However, as shown in Figures 18(b), (d), and (f) the calculated predictive results from the obtained formulation did not fit well with the simulation experiment results. For example, for the 25-30 P-GSS with a gradient increment of 1.67 per layer, the calculated bending stiffness using the composite material model was 2.4989 kN/mm, while the simulated bending stiffness was 2.7388 kN/mm, resulting in a maximum deviation of 8.75% between the calculated and simulated experimental results. At low-density gradients, the composite material model calculations for P-GSS exceeded simulated values until the density gradient increased to between 20–30 and 22.5–30, where the composite material model calculations for P-GSS started to fall below simulated values. For 15–30 G-GSS, with a gradient increment of 5 for each layer, the maximum difference between the composite material model-calculated flexural stiffness value and the numerical simulation value was observed. The composite material model-calculated bending stiffness value was 1.81516 kN/mm, while the simulation value was 2.20417 kN/mm. The maximum difference between the calculated and experimental results was 21.43%. Similarly, for 15–30 N-GSS, with a gradient increment of 5 for each layer, the maximum difference between the composite material model-calculated bending stiffness value and the numerical simulation value was observed. The composite material model-calculated bending stiffness value was 1.9156 kN/mm, while the simulation value was 1.6771 kN/mm. The difference between the composite material model-calculated results and the numerical simulation results was 14.22%. It is noteworthy that for G-GSS and N-GSS, the calculated values of the formulation were consistently lower than the simulation values in the gradient range studied in this paper. The significant discrepancy between the calculated values from the composite material model and the simulated values may be due to the identical mechanical response of each sub-layer with the same topological structure but varying relative densities, leading to different load-bearing capacities. Due to the unique loading conditions of the three-point bending experiments, each layer of the TPMS sandwich structure experienced different compressive forces and levels of deformation. The influence of different TPMS sub-layers on the overall mechanical performance of the structure varied, and the load-bearing capacity of TPMS structures with identical topological structures depended on the density gradient of specific sub-layers. Simply layering was insufficient to accurately calculate the bending stiffness of gradient structures.
To improve the accuracy of the composite material model calculations, the revised composite material model, as shown in Figure 19, divided each layer of the TPMS structure into four sub-layers, each with an equivalent topological structure having the same mechanical response but differing in relative density, leading to variations in load-bearing capacity. Due to the unique loading conditions of the three-point bending experiments, the specific sub-layers depended on the relative positions of the sub-layers within the overall structure. The required number of sub-layers was determined by the FE results. Figure 16 showed the von Mises stress distribution of GSS at a downward displacement of 50 mm. It was observed that the special sub-layers were mainly concentrated at the top and bottom, while the middle sub-layers bore relatively lower stress. In this work, struts with von Mises stress values above 554.0 MPa were considered yielding.
49
The von Mises stresses of Primitive, Gyroid, and Neovius structures with gradient densities of 20–30 decreased gradually from the top and bottom layers to the middle layers. For instance, for 5–20 GSS, the value of the center of pillars at the 5th and 8th sub-layers were above 554.0 MPa, while the 6th and 7th sub-layers were not. Therefore, the selected sub-layers number was determined to be 10. The revised composite material model divided the top and bottom into four sub-layers and the middle into two sub-layers. As shown in Figures 18(b), (d), and (f), the calculated values of the revised composite material model for P-GSS, G-GSS, and N-GSS showed an overall increase, and the values calculated by the revised composite material model were closer to the simulation values. The revised equivalent stress models for P-GSS, G-GSS, and N-GSS had higher prediction accuracy. The schematic of TPMS layered structure.
Comparison of mechanical properties of different cellular structures
To demonstrate the superior mechanical performance of the wood-plastic composite sandwich structures with triply periodic minimal surfaces (TPMS), a comparison was made with wood-plastic composite sandwich structures featuring Honeycomb and Re-entrant honeycomb cores,
50
as shown in Figure 20. The honeycomb cores have similar overall dimensions to the TPMS structures discussed in this study, with an edge length of approximately 22.6 mm and a relative density of 20%. A CAD model of the honeycomb core structures: (a) Honeycomb core structure; (b) Re-entrant honeycomb core structure.
Figure 21(a) present the typical load-displacement curves for various cell structures with similar densities, including Honeycomb, Re-entrant honeycomb, and TPMS-based sandwich structures (Primitive, Gyroid, and Neovius). Around 8 mm displacement, the high-speed impact causes the first oscillation in the load-displacement curves of all sandwich structures. After resisting this oscillation, the load-displacement curves rise synchronously. Under equivalent displacement, the TPMS sandwich structures bear greater loads than the Honeycomb and Re-entrant honeycomb structures. The Neovius structure reached a peak load of 173 kN, which was 5.21 times higher than the maximum load of the Honeycomb structure (33.15 kN) and 11 times higher than that of the Re-entrant honeycomb structure (15.62 kN). This indicated that TPMS structures with similar relative densities exhibited greater stiffness and strength. As shown in Figure 21(b), the bending stiffness of the Neovius structure was 4.53 times that of the Honeycomb structure and 10.75 times that of the Re-entrant honeycomb structure. Due to the unique design of the TPMS structures, which provided flexible transitions between individual cells, these structures lacked sharp edges and nodes at the cell connections, unlike the Honeycomb and Re-entrant honeycomb structures. Consequently, as shown in Figure 21(b), TPMS structures demonstrated higher energy absorption capacity, with the Neovius structure absorbing 4.81 times the energy of the Honeycomb structure and 16.47 times that of the Re-entrant honeycomb structure. Among the cellular structures studied in this paper, the TPMS core structures (Primitive, Gyroid, and Neovius) exhibited superior bending performance compared to traditional honeycomb structures (Honeycomb and Re-entrant honeycomb). (a) Load-displacement curves; (b) Bending stiffness and energy absorption of the TPMS and honeycomb sandwich structures with relative densities of the core of 0.2.
Conclusions
A novel lightweight sandwich structure with a triply periodic minimal surface (TPMS) core were investigated in this study. Three-point bending experiments were conducted on uniform and graded TPMS wood-plastic composite sandwich structures to compare the bending performance and energy absorption of sandwich structures with Primitive, Gyroid, and Neovius as core layers. The effects of core topology, core relative density, and core graded density on the bending performance of sandwich structures were analyzed in depth using numerical simulation results. Formulas for calculating the bending stiffness of uniform and gradient sandwich structures were developed. A comparison was made between TPMS wood-plastic composite sandwich structures and traditional honeycomb structures. The specific findings of this work were summarized as follows:
The bending stiffness, maximum load, and energy absorption of both uniform and graded sandwich structures were significantly influenced by the core topology. Whether uniform or graded sandwich structures, sandwich structures with a Neovius core exhibited higher bending stiffness and energy absorption capacity compared to other topologies.
As the relative density increased, the bending stiffness of the TPMS sandwich structures increased. When the relative density of the TPMS uniform structure increased from 15% to 30%, the bending stiffness of P-USS, G-USS, and N-USS increased by 2.23, 1.17, and 2.71 times, respectively. When the graded density increased from 15–30 to 25–30, the bending stiffness of P-GSS, G-GSS, and N-GSS increased by 1.85, 1.45, and 1.48 times, respectively.
Calculation models for uniform and graded sandwich structures were established using theoretical formulas and composite material models. Revised mathematical equations were modeled to accurately calculate the bending stiffness of graded sandwich structures.
Compared with traditional honeycomb structures, the three types of TPMS structures with similar relative densities exhibited stronger bending stiffness and energy absorption capabilities. Among them, the Neovius structure demonstrated the best bending stiffness and energy absorption, with a bending stiffness 4.53 times that of the Honeycomb structure and 10.75 times that of the Re-entrant honeycomb structure. The energy absorption of the Neovius structure was 4.81 times that of the Honeycomb structure and 16.47 times that of the Re-entrant honeycomb structure.
Footnotes
Funding
The authors disclosed receipt of the following financial support for the research, authorship, and/or publication of this article: Funded by contract research of non-government funded projects (2022092803003).
Declaration of conflicting interests
The authors declared no potential conflicts of interest with respect to the research, authorship, and/or publication of this article.