
Abstract
Ceramic membrane filters fabricated from local raw materials are excellent for municipal wastewater treatment. This paper studied the fabrication of ceramic membranes using Response Surface Methodology (RSM). It also looked at the influence of clay, palm kernel shell ash, kaolin, and starch on the properties of ceramic membrane filters. Optimal test conditions and procedures were determined by selecting a fitting model based on experimental data. The Box–Behnken design (BBD) was chosen for its ability to reduce the number of experimental trials, thus making it cost-effective. The BBD design was executed using Design-Expert 13 software (Stat-Ease, Inc., Minneapolis, MN, USA), requiring 29 experimental runs. According to the study, responses such as porosity, flow rate, thickness, and density were used in the model. The fabrication of the 29 ceramic membranes includes formulation, shaping (slip casting method), drying, and sintering. Based on RSM, an optimum ceramic membrane design was proposed: Kaolin = 413 g, Clay = 180 g, Starch 147 g, Palm Kernel shell ash = 13 g. Compared with the test results, this combination possesses favorable and reliable accuracy. The addition of kaolin played a role in creating a porous framework within the ceramic membrane. Clay serves as a binding agent, aiding the consolidation of ceramic particles within the membrane matrix. Starch served as a pore-forming agent during the fabrication process. From the study, the palm kernel shell ash served as a binder and a reinforcing agent, bolstering mechanical strength and structural robustness.
Keywords
Introduction
Social productivity and material resources in human life are becoming more abundant and constantly improving. In Ghana, some of these material resources are naturally deposited whilst others are regarded as waste products from other primary activities. With in-depth research, some of these raw material resources can be converted into useful products such as filters for water and wastewater treatment. Some of these raw materials include clay, kaolin, palm kernel shell ash, and starch. These materials possess excellent chemical, mechanical, and thermal resistance, and have a high-pressure application. The importance of clay, kaolin, and starch in the membrane fabrication process has been well-documented by scientists. According to Gong et al., 1 clay significantly contributes to reducing energy consumption, thus enhancing the crack resistance of the membrane material. Son et al. 2 also state that kaolin improves the impact resistance of ceramic membranes. Kaolin contains low concentrations of iron and alkalis and as such it is ideal for use in various forms of ceramics. Porosity in membranes and other ceramic materials is greatly improved by the addition of starch. According to Oti et al., 3 another raw material that is gaining prominence and has had a lot of reviews from research scientists is palm kernel shell ash. It is an eco-friendly substance made from palm kernel shells. It is mostly discarded as waste products during the processing of palm oil from processing plants. In recent years, palm kernel shell ash has been deeply studied because of its environmentally friendly processing process and excellent mechanical properties. According to Baffour-Awuah et al., 4 incorporating palm kernel shell ash into a filtering media can boost its strength and its thermal ability by forming a durable spatial network structure which will lead to overall enhancements in properties.
In this study, four of these local raw materials were combined (clay, kaolin, palm kernel shell ash, and starch) to fabricate a ceramic membrane filter for the treatment of municipal wastewater.
Research by Rani et al., 5 evaluated the influence of clay on the fabrication and characterization of ceramic membranes. The test results showed that the incorporation of clay made the ceramic membrane show excellent chemical resistance. It also increased the thermal stability of the ceramic membrane. Research by Zewdie et al., 6 evaluated the importance of kaolin in the ceramic membrane fabrication process. The results showed that the incorporation of an appropriate amount of kaolin improved pore formation and size control improved the structural integrity of the ceramic membrane and its thermal stability. Lorente-Ayza et al., 7 studied the characteristics of microfiltration membranes and the effect of starch content on their properties. The test results showed that adding an appropriate amount of starch improves pore formation and pore size, it also serves as a binder and a plasticizer, and it also improves the burnout properties and controls the pore size distribution. Reza et al., 8 studied the treatment of greywater using activated carbon from palm kernel shell ash. The test results showed that it enhanced filtration properties and may influence the surface characteristics of the filtering medium. According to Ramlow et al., 9 Palm kernel shell has a high alumina which is a key factor that can boost the strength and thermal stability of the ceramic membrane.
Wang et al. 10 highlighted the increasing utilization of the response surface method (RSM) in membrane fabrication mix design, emphasizing its effectiveness in analyzing and optimizing experimental responses. RSM surpasses traditional experimental design methods on several fronts. It reduces the number of necessary tests, thereby cutting down on test expenses, and can determine optimal input variables based on test results. Cho 11 notes that RSM establishes a scientific mathematical model, elucidating the impact of individual factors and their interactions within predetermined numerical boundaries. This method excels in evaluating non-linear relationships between test variables and response values. Additionally, the depiction of three-dimensional response surfaces between preparation parameters and response indices clarifies the relationship between each factor and response value. Adam et al. 12 investigated adsorptive ammonia removal using the hollow fiber ceramic membrane through the RSM approach, focusing on fabrication, performance, evaluation, and optimization. Similarly, Arzani et al. 13 explored mullite ceramic microfilter membrane preparation using response surface methodology based on central composite design.
In this study, an experimental ceramic membrane mixture scheme was designed based on the response surface mechanism (RSM). Fine aggregates of the local raw materials of sieve sizes of 100 microns were mixed thoroughly. The relationships between the four preparation parameters (clay, kaolin, palm kernel shell ash, and starch) and membrane characteristics such as density, flow rate, and porosity were analyzed. The density, flow rate, and porosity of ceramic membranes were selected as response variables to investigate the ideal mixture ratio for the ceramic membranes. The ceramic membrane mixture ratio optimization was established and validated using experimental findings.
Materials and methods
Specimen preparation
Ceramic membranes were prepared to optimize the mixture design. Based on the methodology of research, the preparation steps of the ceramic membranes are as follows: From Figure 1, the process involved mixing the raw materials (clay, kaolin, palm kernel shell ash, and starch) with distilled water to form a slurry which is then poured into a mold. In each of the mixing, 250 mLs of distilled water was used. The slurry was poured into the mold slowly and carefully until it covered about 3/4 of the mold. The mold is 20 cm in height and 11 cm in diameter. The mold was gently tapped to remove any air bubbles in the slurry. The slurry was allowed to sit in the mold for 5 min to allow the solids to settle and ensure an even distribution of the slurry. Once this time had passed, the excess slurry was poured out of the mold, leaving a hole in the middle of the mold. The mold was then left undisturbed for about 20–40 min. After the ceramic membrane had dried to the touch, it was carefully removed onto a drying rack and oven-dried for 24 h at 105°C. The number of samples produced per mix was one (1). The dried membranes were then sintered for 4 hours in a furnace at 900°C at a heating rate of 5°C/min. They were sintered at that temperature because the membranes exhibit low shrinkage and favorable mechanical and chemical resistances. This process was repeated to get all 29 ceramic membranes as shown in Table 1. The experiments were done in duplicate. Schematic production process of a porous ceramic membrane filter. Mix proportions of the ceramic membrane filters.

Experimental methods
Porosity
According to Guo et al., 14 porosity is a fundamental property that significantly impacts the transport characteristics of a ceramic membrane. The fluid displacement method was used to assess the porosity of the ceramic membrane. Initially, the bulk volume of the membrane was determined by measuring its length and diameter using a Vernier caliper. The volume was then calculated using the formula Vb = πr2L, where r represents the radius and L is the length of the ceramic membrane filter. Subsequently, the pore volume of the membrane filter was determined. This involved measuring the dry weight (Wdry) with an analytical balance and saturating the membrane with water using a vacuum immersion technique to obtain the wet weight (Wsat). The pore volume (Vp) was determined through the formula Vp = Wwater/ℐwater, where Wwater = Wdry − Wsat. Finally, the porosity (ᴓ) of the membrane was computed as ᴓ = Vp / Vbt, where Vbt denotes the bulk membrane volume (Vb) minus the hollow space volume (Vh). The bulk membrane volume (Vb) is given by Vb = π(R)2 L, and the hollow space volume (Vh) is given by Vh = π(r)2 L.
Flowrate
According to Richardson et al., 15 the flow rate is a critical parameter that significantly influences the efficiency of ceramic membranes in separation applications. In this study, a flow rate test was conducted to evaluate the ceramic membrane’s filtration capabilities. A setup consisting of two bowls placed on each other was used. The lower bowl was calibrated, and a cap with a hole was placed over the open area of the ceramic membrane. The top bowl was modified with a dent where the membrane’s cap was securely positioned. Water was poured into the top bowl until the ceramic membrane was completely immersed. Subsequently, the water permeation rate was monitored hourly as it filtered through the membrane into the lower bowl.
Thickness
For this test, a Vernier caliper was used to measure both the outside diameter and inside diameter of the ceramic membrane. To determine the thickness, the value of the inside diameter was subtracted from the outside diameter measurement as stated by Azaman et.al 16
Density
According to Mestre et al.,
17
the density of a ceramic membrane is determined by dividing its dry weight by its volume. The dry weight of the membrane was obtained by measuring it with the analytical balance in grams (g). The membrane volume (Vb) was calculated by subtracting the outer cylinder volume from the hollow space volume. R and r are the radius of the outer cylinder and the inner cylinder, respectively.
The Density was then calculated by dividing the dry weight (mass) by the volume.
Density, porosity, flow rate, and thickness analysis were conducted on all 29 fabricated ceramic membranes. These characteristics were used as responses for the Box–Behnken Design Analysis and the Optimization and Verification analysis.
Characteristics of the optimum ceramic membrane
The Vanta VMR Olympus XRF analyzer by Olympus USA was utilized for the XRF analysis in this study. The FTIR analysis was conducted using the FTIR spectrophotometer, the XRD was conducted using the X-ray diffraction analyzer, and the BET was undertaken using the Quantachrome NOVA4200e Surface Area and Pore Size Analyzer instrument (Japan).
Response surface method
Experimental design for Box–Behnken design.

Results and discussion
Test results based on Box–Behnken design (BBD)
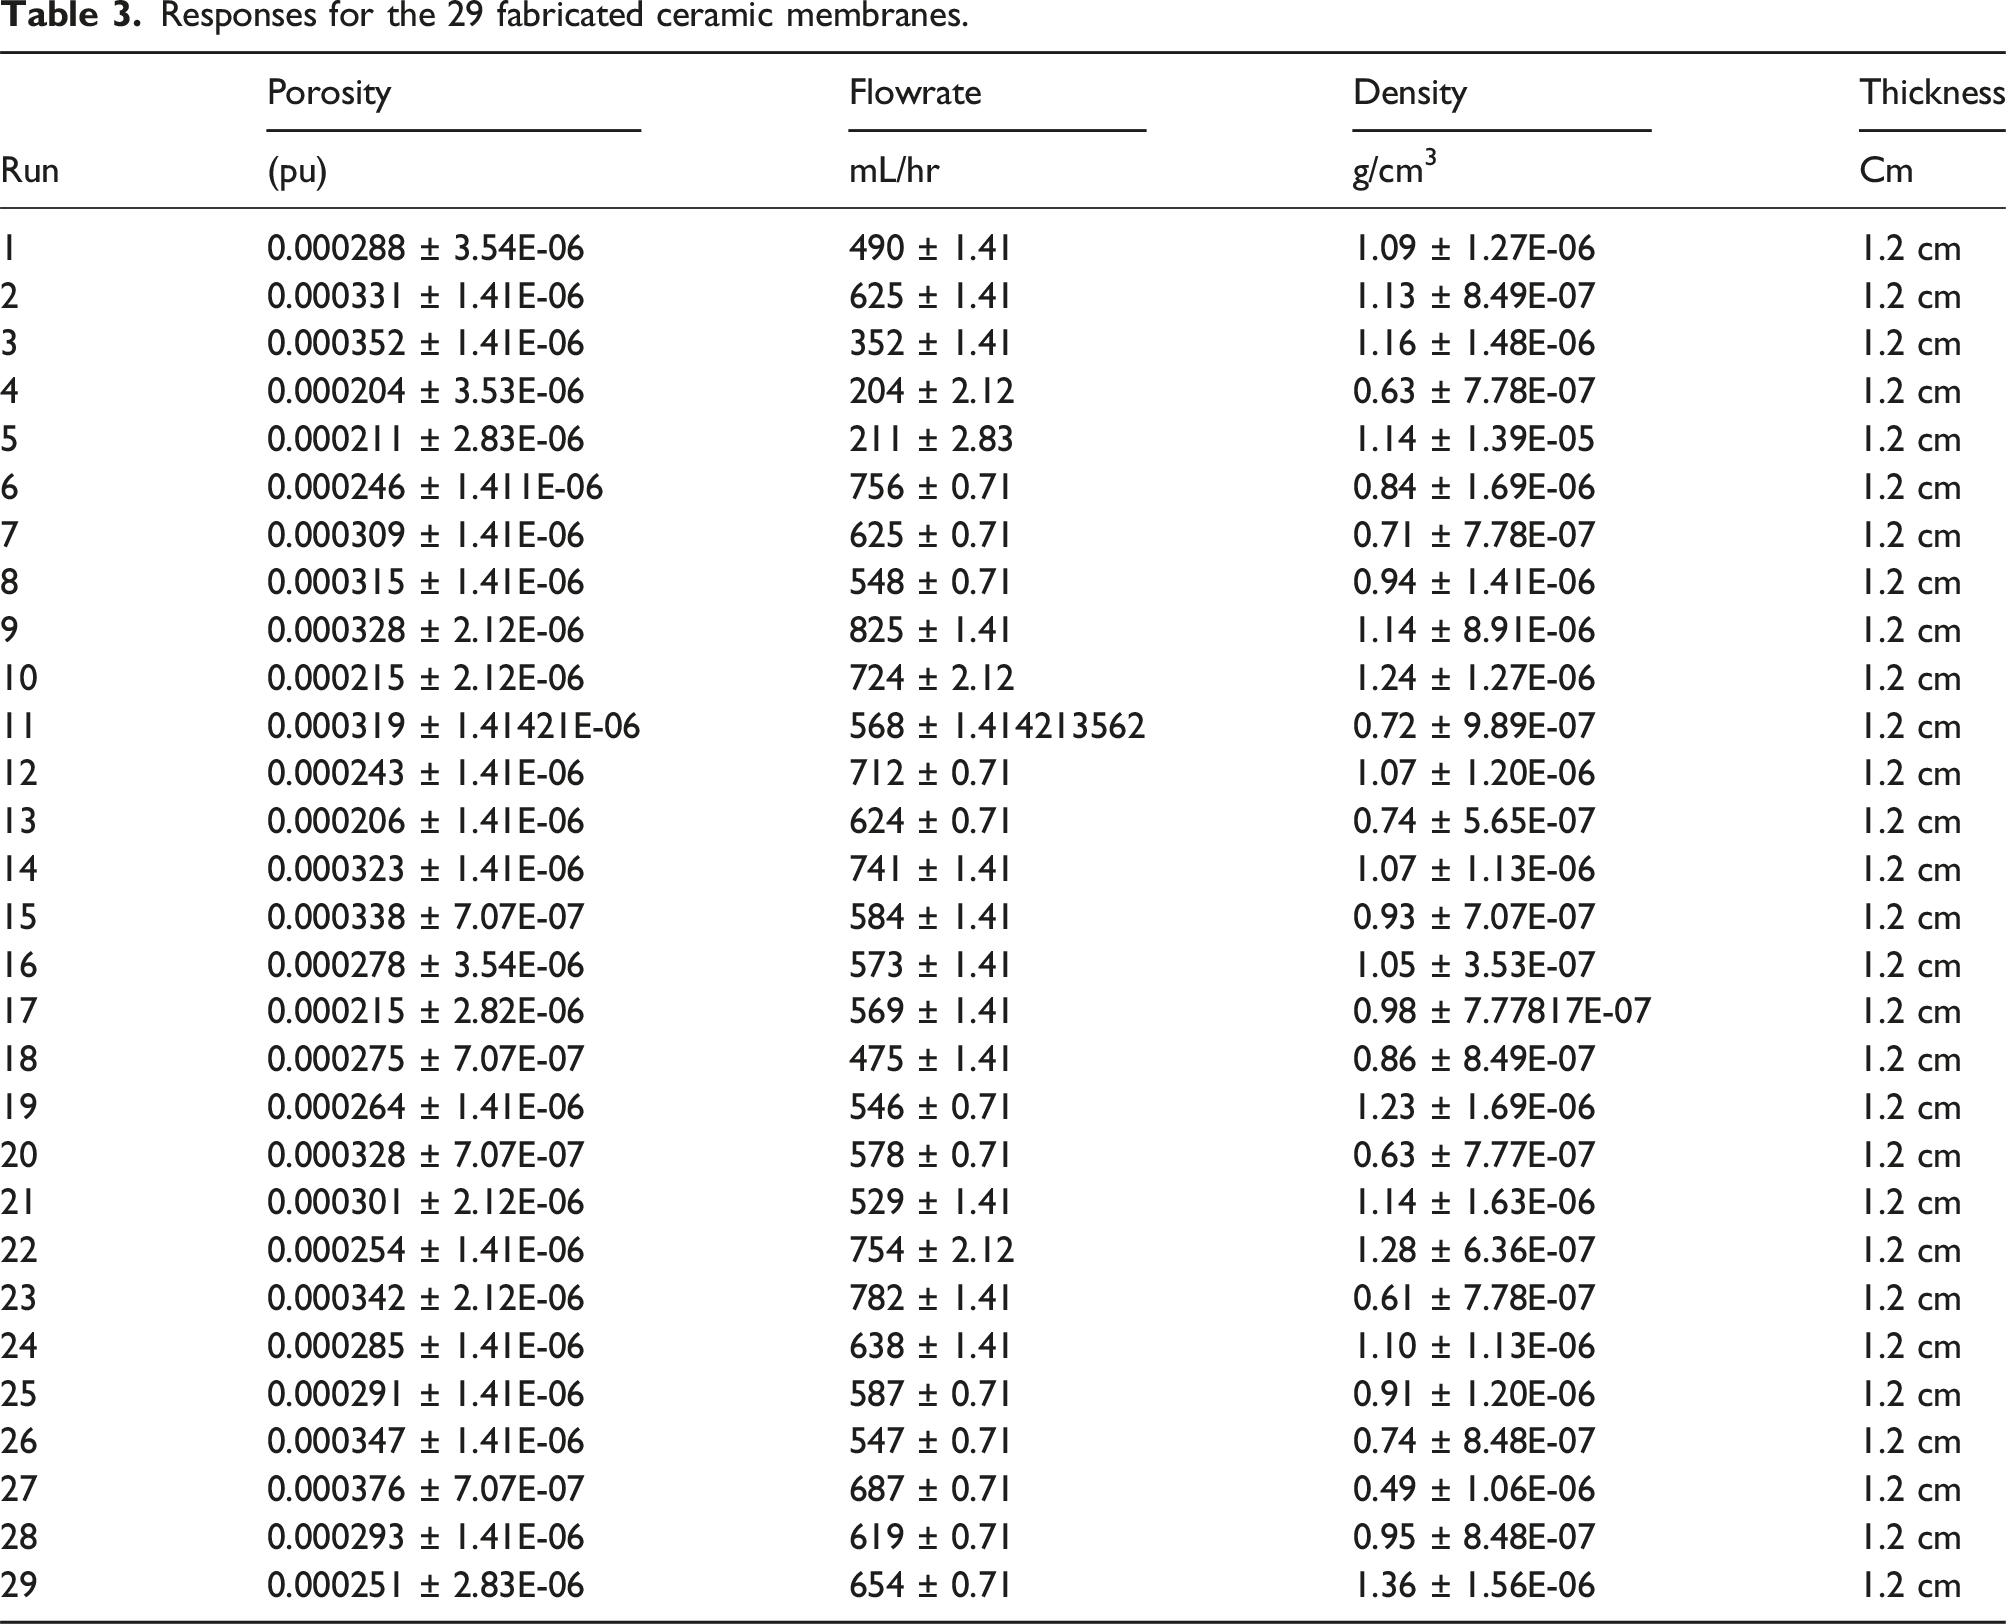
Responses for the 29 fabricated ceramic membranes.
Box–Behnken analysis
ANOVA
Model analysis of variance result.

Response variable analysis of variance results.

Flowrate analysis
The flow rate analysis of variance results is depicted in the second row of Table 4. Both R-squared and Adj. R-squared values are approaching 1, indicating the significance of the fitted model. Moreover, Adequate Precision, which signifies the signal-to-noise ratio, surpasses 4, suggesting a desirable model. Specifically, the Adequate Precision for the flow rate stands at 5.6577, further affirming the model’s desirability. Based on the ANOVA outcomes, factors C, AC, and AD emerge as significant contributors to the flow rate quadratic model.
Following the removal of non-significant factors, the least squares method is employed to fit the quadratic equation below for flow rate.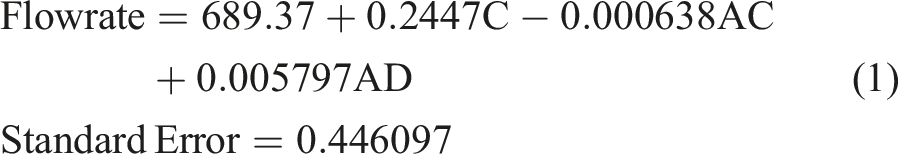
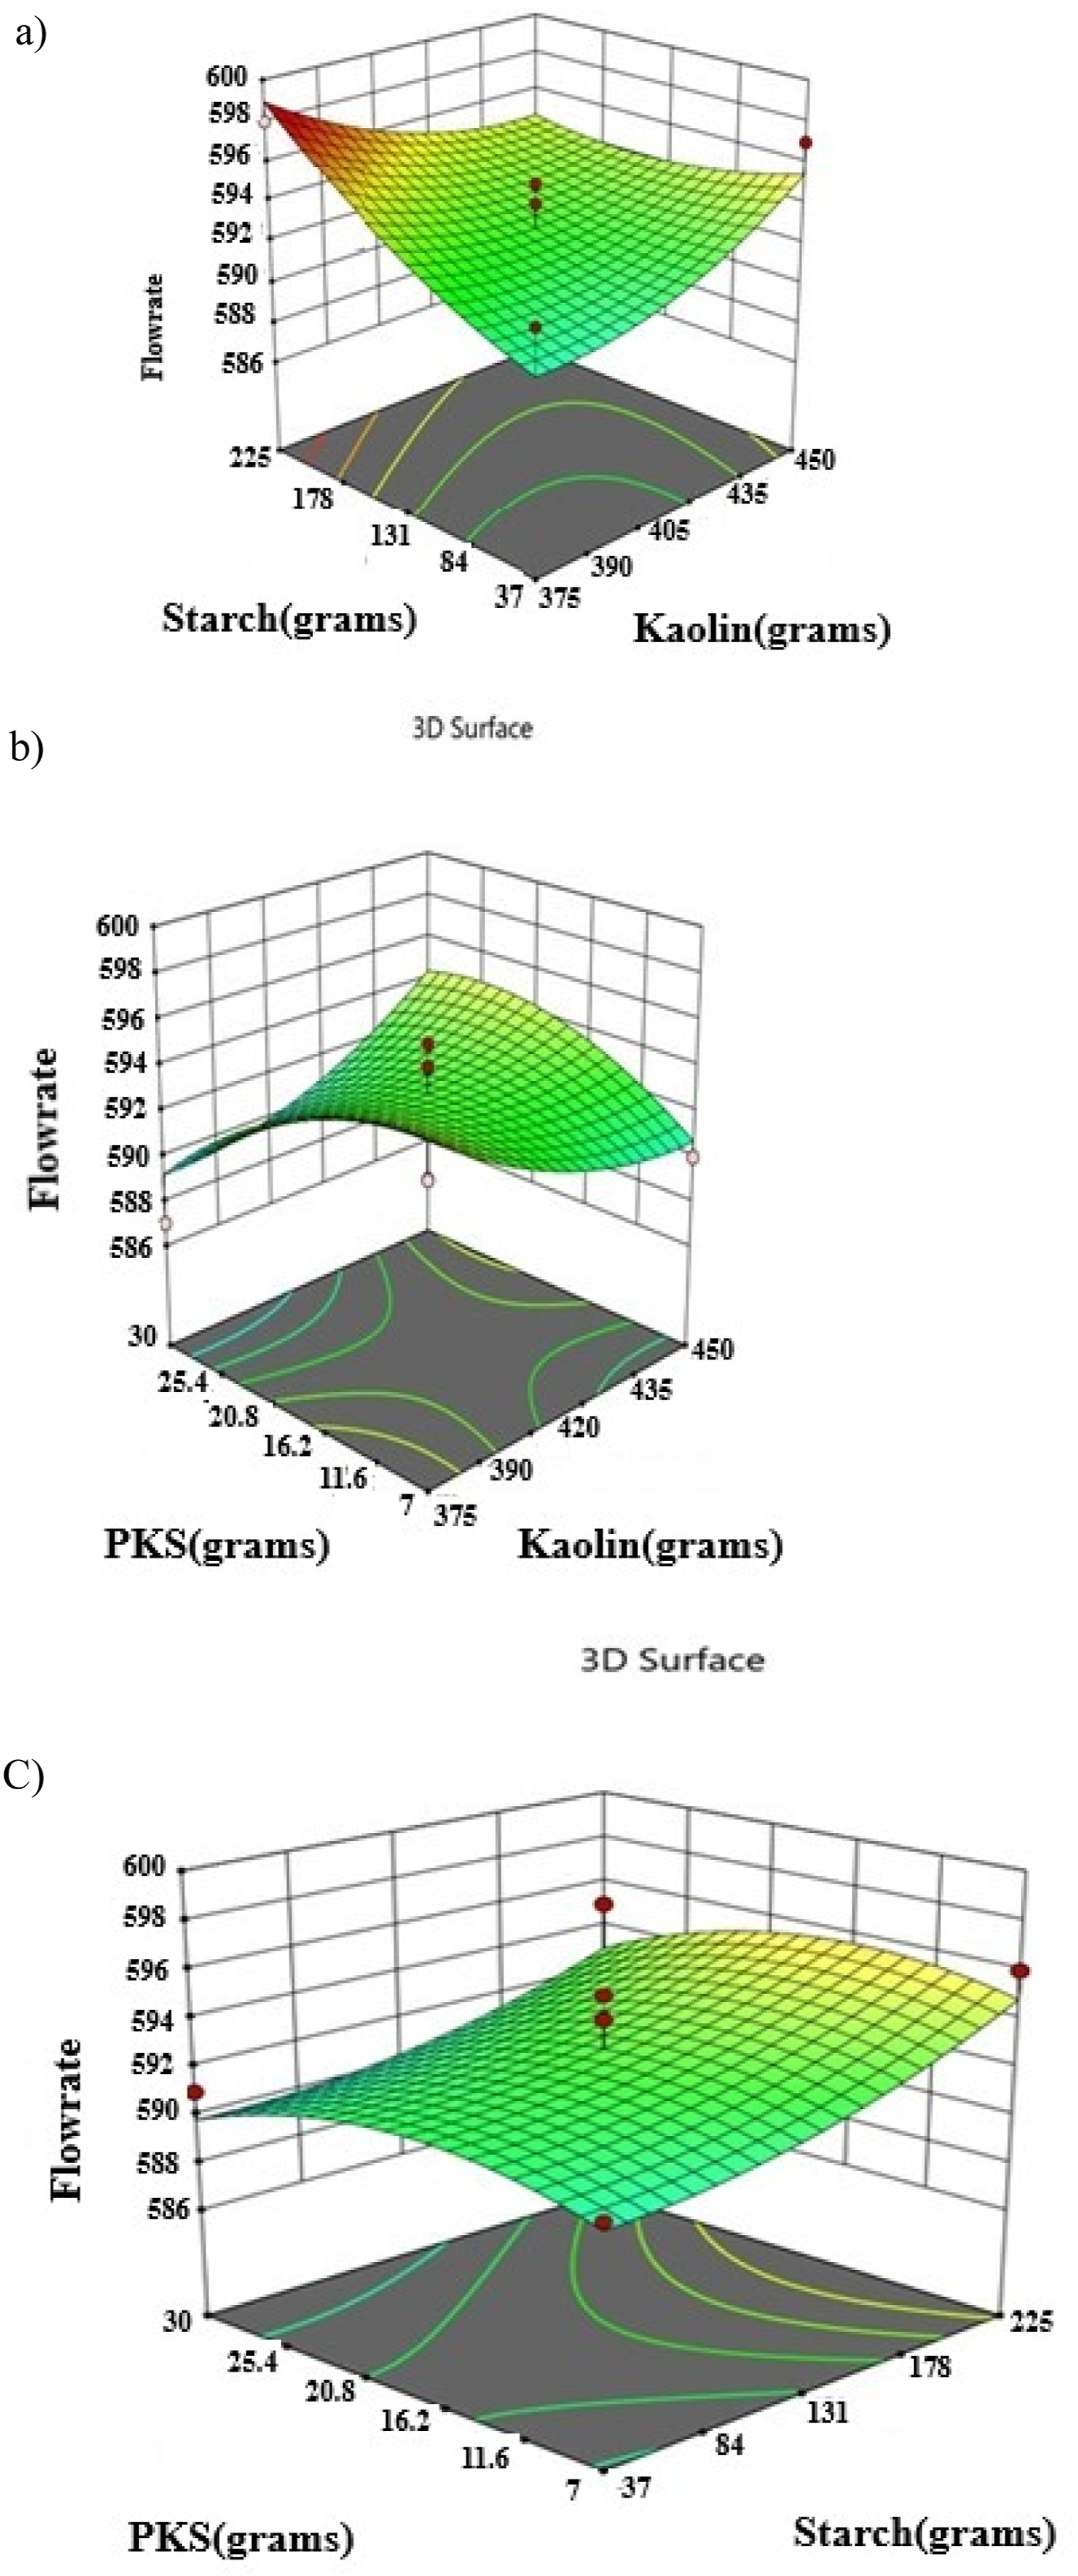
The diagnostic outcomes of the statistical model depicted in Figure 1 indicate that the data points form a nearly linear pattern, signifying the model’s considerable significance. Figures 2–7 illustrate three-dimensional response surface diagrams for flow rate, unveiling the correlation between kaolin, clay, starch, palm kernel shell ash, and flow rate, as well as the interaction among kaolin, clay, starch, and palm kernel shell ash. Normal plot of residuals for flowrate. Residual against predicted of flowrate. Desirability graph of the flowrate. (a) 3D surface plot of the effect of starch and Kaolin on flowrate of the membrane. (b) 3D surface plot on the effect of Palm kernel shell ash and Kaolin on flowrate. (c) 3D surface plot on the effect of Palm kernel shell ash and starch on the flow rate of the ceramic membrane. Normal plot of residuals for porosity. Plot of residual against predicted of the porosity.


This 3D Response Surface Methodology (RSM) plot (Figure 5(a)) represents the relationship between flow rate (the response variable on the Z-axis) and two independent variables: starch (grams) on the X-axis and kaolin (grams) on the Y-axis. The X-Axis (Starch grams): Ranges from 37 to 225 g, showing how different levels of starch affect the flow rate. The Y-Axis (Kaolin grams): Ranges from 375 to 450 g, representing the effect of varying kaolin amounts on the flow rate. The Z-Axis (Flow rate): Represents the flow rate, ranging from 586 to 600. The surface shows a peak flow rate of around 600 at the upper left corner of the plot (high starch 225 g and low kaolin 375 g). This suggests that higher starch levels combine with lower kaolin levels to result in a higher flow rate. The lowest flow rate (586) is observed toward the center and right, where kaolin is higher (435–450 g) and starch is low to moderate (37–84 g). This suggests that high kaolin and low starch levels result in lower flow rates. The surface shows that the interaction between starch and kaolin influences the flow rate. Specifically: Increasing starch generally increases the flow rate, with the effect being more pronounced when kaolin is kept at lower levels. Increasing kaolin hurts the flow rate, with the flow rate decreasing as kaolin increases, especially when starch is low. The contour plot at the base shows lines of equal flow rate. The spacing between the contour lines indicates areas of rapid or slow change in flow rate. The region with the highest flow rate corresponds to higher starch levels and lower kaolin levels. The RSM above plot helps identify the optimal combination of starch and kaolin to maximize the flow rate.
In this 3D Response Surface Methodology (RSM) plot (Figure 5(b)), the response variable is the flow rate (Z-axis). In contrast, the two independent variables are PKS (grams) (X-axis) and kaolin (grams) (Y-axis). The X-Axis (PKS grams): Represents the amount of palm kernel shell (PKS), ranging from 7 g to 30 g. The Y-Axis (Kaolin grams) shows the amount of kaolin, ranging from 375 g to 450 g. The Z-Axis (Flow rate) is the response variable, indicating the flow rate, ranging from 586 to approximately 598. The highest flow rate (598) is achieved at a combination of low PKS (7 g) and moderately high kaolin (430 g). This suggests that reducing the PKS amount while using a moderate amount of kaolin results in higher flow rates. The lowest flow rate (586) occurs when PKS is high (30 g) and kaolin is low (375 g). This shows that higher amounts of PKS, combined with lower kaolin levels, significantly reduce the flow rate. The plot indicates an interaction between PKS and kaolin: Increasing kaolin increases flow rates, especially when PKS is kept at lower levels. Increasing PKS seems to hurt the flow rate beyond a certain point, especially when kaolin levels are low. The contour lines at the base show regions with similar flow rates. The closer lines indicate more rapid changes in flow rate as either PKS or kaolin is adjusted. Low PKS and higher kaolin have the highest flow rates.
In this 3D Response Surface Methodology (RSM) plot (Figure 5(c)), the response variable is flow rate (Z-axis), and the two independent variables are PKS (grams) (X-axis) and starch (grams) (Y-axis). The X-Axis (PKS grams) refers to the amount of palm kernel shell (PKS), ranging from 7 to 30 g. This variable explores how different PKS quantities affect the flow rate. The Y-Axis (Starch grams) represents the amount of starch, ranging from 37 to 225 g. This shows how varying starch affects the flow rate. The Z-Axis (Flow rate) represents the response variable flow rate ranging from approximately 586 to 600. The surface reaches its maximum flow rate (600) at the top-right corner when starch levels are high (225 g) and PKS is moderate (25 g). This suggests that high starch and moderate PKS gives the best flow rate. The lowest flow rate (586) occurs when starch and PKS are at their lowest levels (starch 37 g and PKS 7 g). This suggests that low levels of both ingredients result in a significantly lower flow rate. The plot shows a clear interaction between PKS and starch. Increasing starch improves the flow rate significantly, especially when combined with moderate PKS levels. Increasing PKS improves the flow rate initially, but further increases beyond around 25 g of PKS appear to have less impact, suggesting a leveling off in the effect of PKS. The contour plot at the base shows the equal flow rate regions. Where the contour lines are close together, the flow rate changes rapidly. The highest flow rates correspond to high starch levels and moderate PKS levels.
Porosity
The Porosity (R2) analysis of variance results is displayed in the initial row of Table 4. Both R-squared and Adj. R-squared values are close to 1, at 0.56 and 0.134, respectively, while the Adequate Precision surpasses 4, at 4.6899, indicating the model’s significance. The variance outcomes in Table 4 reveal that AC, BC, and C2 are the significant factors in the porosity quadratic model. Following the exclusion of non-significant factors, the least squares method is employed to fit the second-order polynomial equation for Porosity as written below.
The statistical model’s diagnostic data points are depicted in Figure 3. They form nearly linear patterns, suggesting the model’s high significance Figure 8. Desirability plot of the porosity analysis.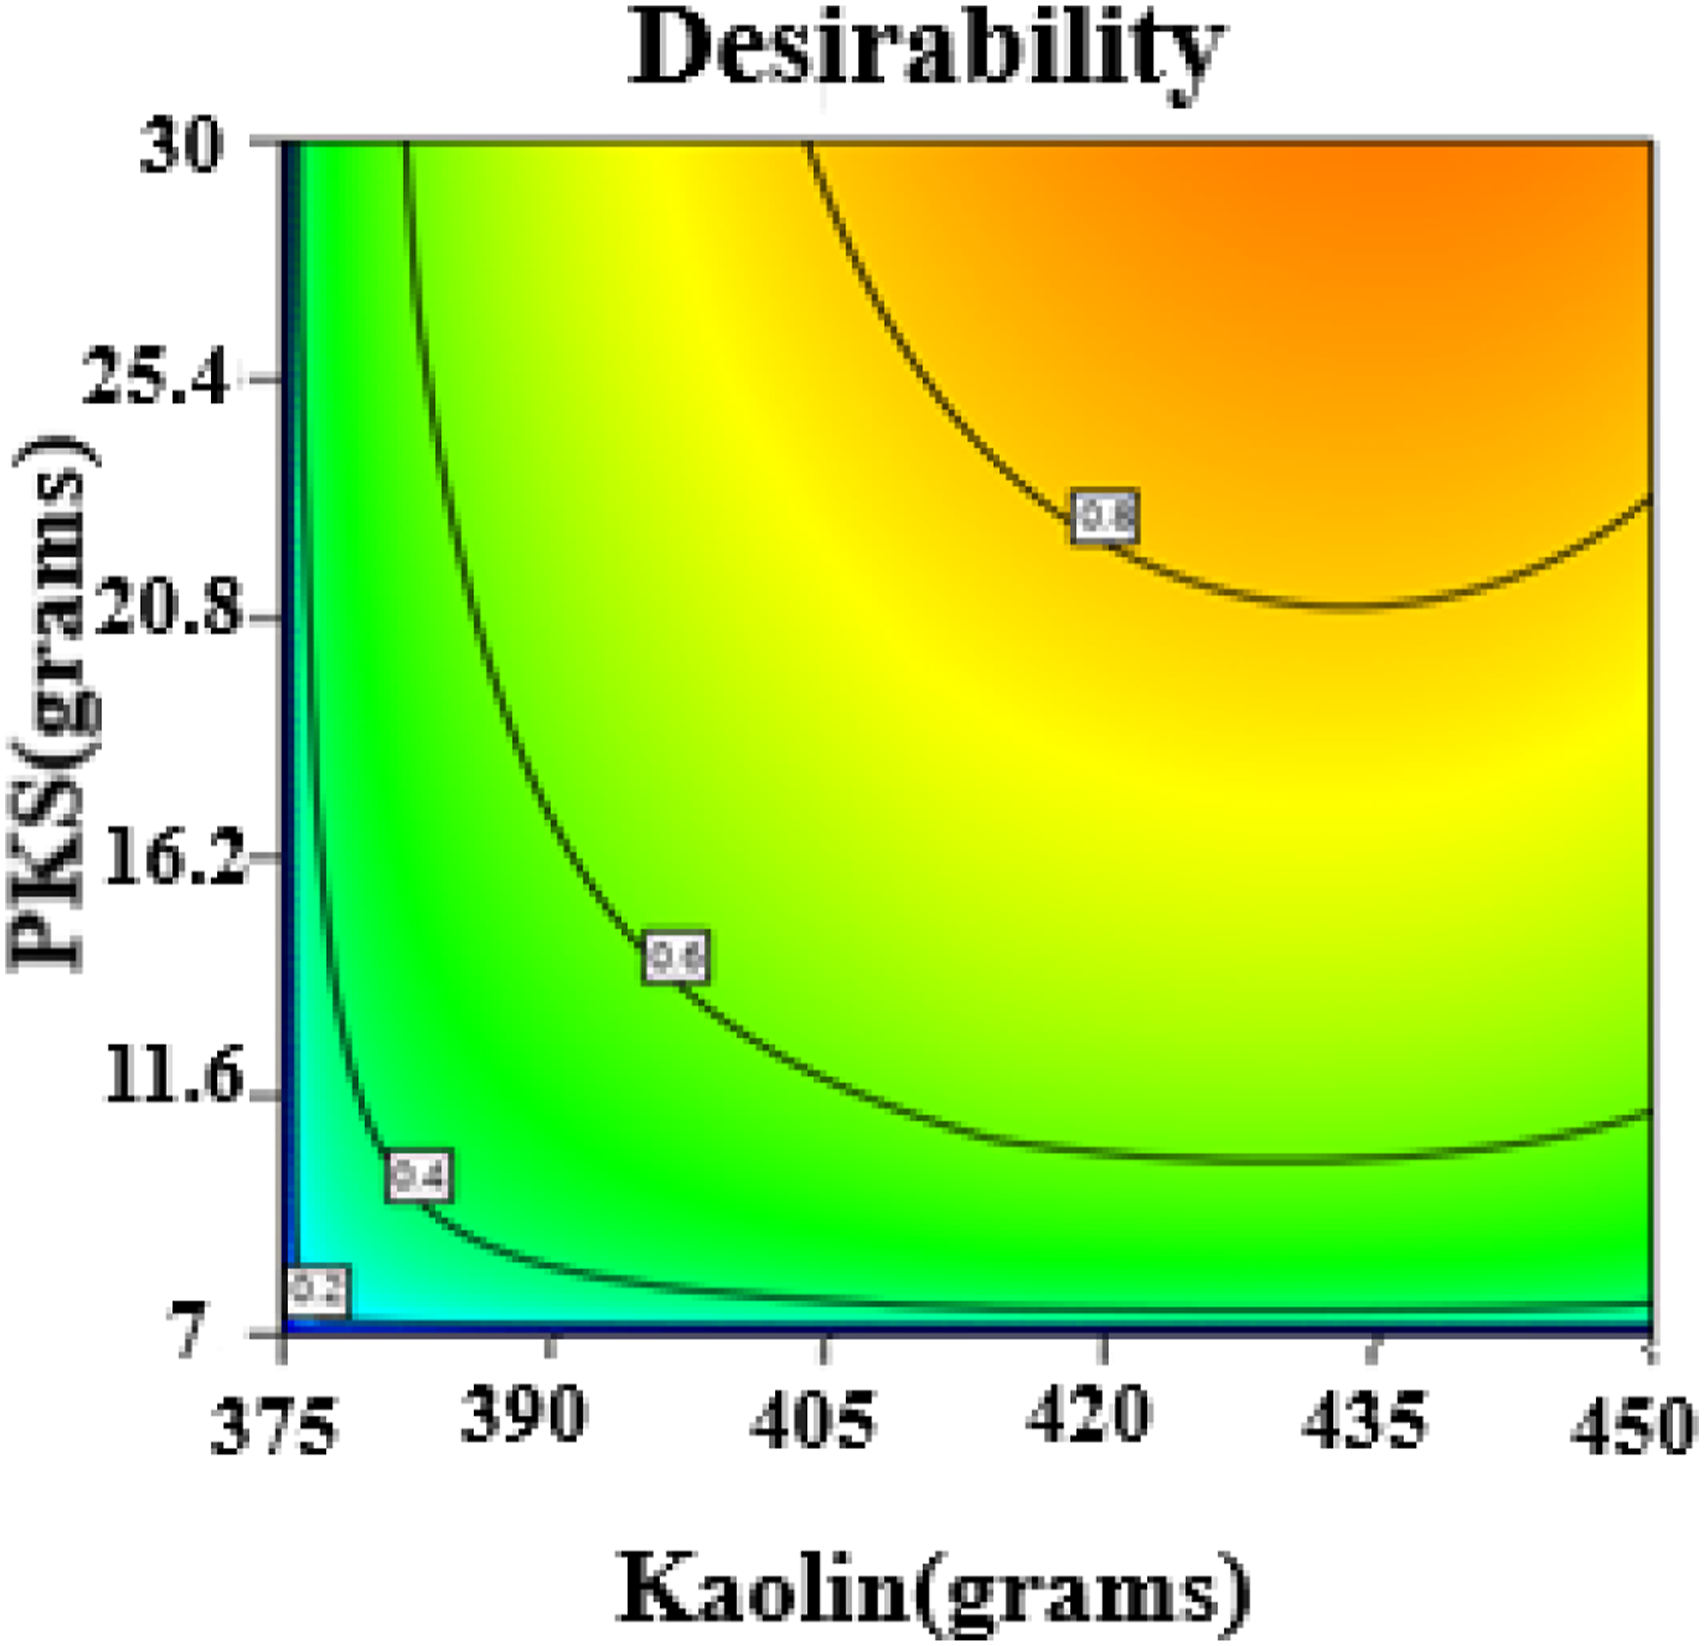
Figures 9(a)–(c), are a three-dimensional response surface of Porosity, showing the relationship between Kaolin, Clay, starch, and Palm kernel shell ash, and the interaction between Kaolin, Clay, Starch, and Palm kernel shell ash. (a) 3D surface plot on the effect of Starch and Kaolin on porosity of the membrane. (b) 3D surface plot on the effect of Starch and Clay on porosity of the membrane. (c) 3D surface plot on the effect of Starch and Palm kernel shell ash on porosity of the membrane.
In this 3D Response Surface Methodology (RSM) plot (Figure 9(a)), the response variable (Z-axis) is porosity, and the two independent variables (X and Y axes) are starch (grams) and kaolin (grams). The X-Axis (Starch grams) ranges from 37 to 225 g. It shows how different levels of starch affect porosity. The Y-Axis (Kaolin grams) ranges from 375 to 450 g, showing how varying the amount of kaolin impacts porosity. The Z-Axis (Porosity) represents the response variable, with porosity values ranging from approximately 0.00027 to 0.00029. The peak of the surface (upper region near the back) indicates where the highest porosity (0.00029) is observed. This occurs at higher starch levels (178–225 g) and moderate kaolin levels (425–435 g). This combination suggests that porosity is maximized with higher starch and moderate kaolin. The lowest point on the surface is near the center of the plot, where porosity dips to 0.00027. This occurs when starch and kaolin are at low levels (starch around 37 g and kaolin near 375 g). This indicates that lower levels of both ingredients result in lower porosity. The curvature of the surface shows the interaction between starch and kaolin. For example, as starch increases, the porosity tends to increase significantly. Kaolin also influences porosity, but the effect is seen at higher starch levels. However, too much kaolin (beyond 440 g) may not improve porosity, suggesting a plateau effect. This curved surface demonstrates that the response is not linear, and both starch and kaolin must be balanced to achieve optimal porosity. The contour plot at the bottom shows lines of equal porosity. The closeness of the contour lines represents areas where porosity changes rapidly with small changes in the factors. The region with the highest concentration of contour lines corresponds to the optimal region for porosity (upper-right section of the graph, with high starch and moderate kaolin). This RSM plot highlights the optimal combination of starch and kaolin to maximize porosity Figure 10–12. Normal plot of residuals of density. Plot of residual against predicted of the density analysis. Desirability plot of the density analysis.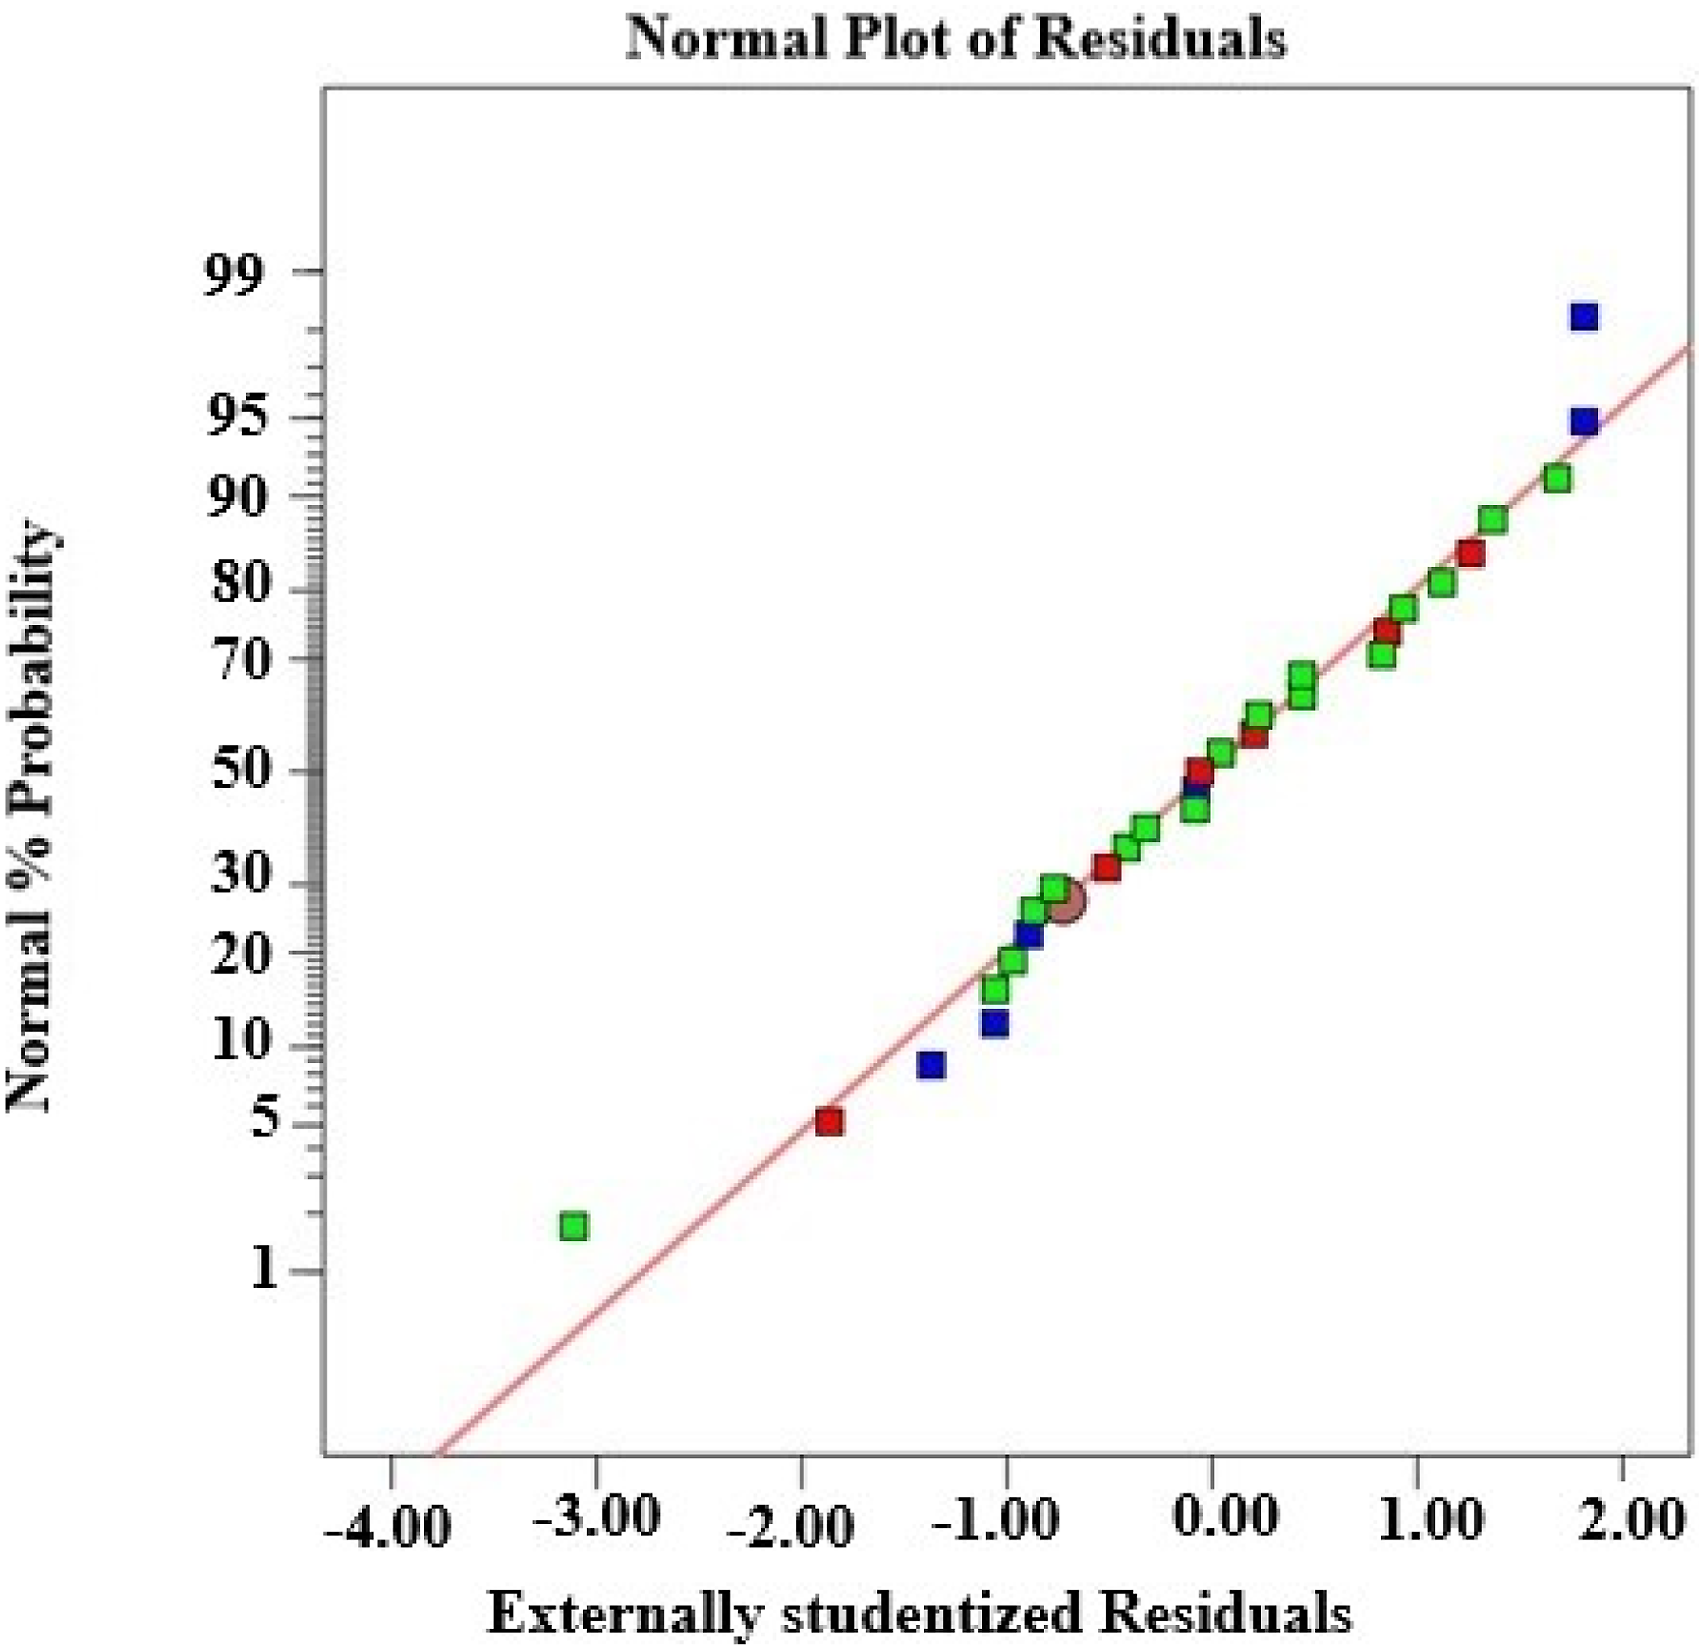


This 3D Response Surface Methodology (RSM) plot (Figure 9(b)) shows how porosity (the dependent variable or response) is influenced by starch (grams) and clay (grams) (the independent variables). The X-Axis which represents starch ranges from 37 to 225 g. This shows how varying the amount of starch affects porosity. The Y-Axis (Clay grams) ranges from 37 to 225 g. It shows the impact of different amounts of clay on porosity. The Z-Axis represents the response (porosity). The values range from approximately 0.00027 to 0.00029, with higher porosity values towards the peak of the surface. The highest point on the surface (near the top center) indicates the combination of high starch (178 g) and moderate clay (179.8 g) results in maximum porosity (0.00029). This suggests that increasing starch and maintaining a moderate clay level maximizes porosity. The lower regions of the plot (near the bottom) indicate lower porosity values (0.00027), which occur when starch is at its lowest (37 g) and clay is at a higher level (202 g). The curvature of the surface shows the interaction between starch and clay. For example, increasing starch leads to higher porosity. However, clay shows a mixed effect—porosity increases to a point with moderate clay levels but decreases with either too little or too much clay. This suggests that both variables influence porosity, but the optimal combination requires balancing the amounts of starch and clay. The contour plot at the bottom shows lines of equal porosity. Closer contour lines represent areas where small changes in starch or clay led to rapid changes in porosity. The most significant changes occur in the region where starch is high and clay is moderate, further highlighting this area as optimal for porosity. These findings suggest a strong interaction between starch and clay in controlling the porosity, with an optimal region for achieving the highest porosity values.
In this 3D Response Surface Methodology (RSM) plot (Figure 9(c)), the response variable is porosity (Z-axis), and the two independent variables are PKS (grams) (X-axis) and starch (grams) (Y-axis). The X-Axis refers to the amount of palm kernel shell (PKS), ranging from 7 to 30 g. This variable explores how different PKS quantities affect porosity. The Y-Axis represents the amount of starch, ranging from 37 to 225 g. This shows how varying starch affects porosity. The Z-Axis represents the response variable porosity ranging from approximately 0.00027 to 0.00029. The plot shows a high peak (around 0.00029) in the upper-right corner of the surface, indicating that porosity is maximized when starch is high (close to 225 g) and PKS is moderate (25.4 g). This combination suggests that a higher starch content paired with moderate PKS leads to the highest porosity. The lowest point on the surface (0.00027) is observed when starch and PKS are at their lowest levels (starch 37 g and PKS 7 g). This suggests that lower levels of both ingredients result in significantly lower Porosity. The curvature of the surface demonstrates that there is an interaction between PKS and starch, affecting porosity. Specifically, porosity increases, rising as starch increases. Increasing PKS improves porosity up to a moderate point (around 25 g), but further increases in PKS do not yield significant improvements in porosity. This interaction indicates that while starch has a stronger positive effect on porosity, the effect of PKS is more moderate and levels off beyond a certain point. The contour plot at the base of the graph shows lines of equal porosity. Regions with closely spaced contour lines indicate areas where porosity changes rapidly with small adjustments in starch or PKS. The highest porosity (upper right) corresponds to high starch and moderate PKS.
From the flow rate analysis, starch had the highest effect on porosity. According to Obada et al., 20 porosity increases as the percentage of the pore-forming agent increases. This is because, during the sintering process above 850°C, the starch content is completely burnt out leaving out pores in the ceramic membranes thereby increasing porosity. However, according to Azaman et al., 21 the higher percentage of pore formers used in the ceramic membranes can cause the ceramic membrane to shrink in size. The shrinkage phenomenon mostly occurs due to the burnout of the pore former and moisture loss during the sintering process. Shrinkage increases as the percentage of pore formers used increases. In addition, higher porosity resulting from the rise of pore former makes the membrane less mechanically robust. As a result, scientists should take caution so as not to put porosity at the detriment of mechanical strength during the fabrication of ceramic membranes. According to Lorente-ayza et al., 7 It’s also essential to note that the specific effect of starch on the porosity of a ceramic membrane can vary based on factors such as the type of starch, its concentration, and the overall membrane fabrication process.
Density
The Density analysis of variance results is displayed in the third row of Table 4. Both R-squared and Adj. R-squared values are close to 1, at 0.725 and 0.45, respectively, while the Adequate Precision exceeds 4, reaching 5.85, indicating the significance of the fitted model. According to the variance results in Table 5, factors A, B, B2, and C2 are significant contributors to the quadratic density model. Utilizing the least square method, the regression coefficients for each factor were determined, and a reasonable second-order polynomial equation as written below for Density was established based on the actual factors.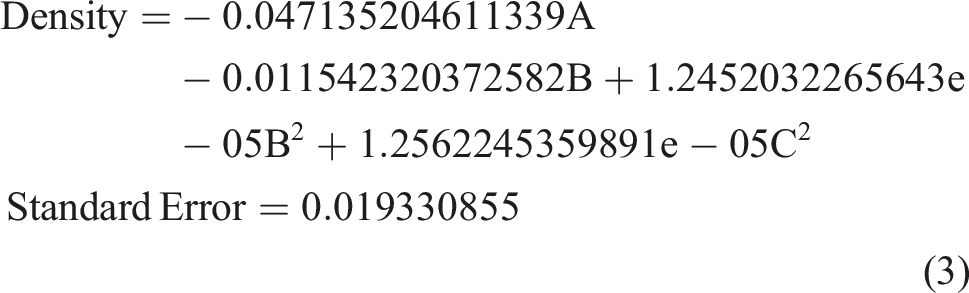
The diagnostic data points of the statistical model illustrated in Figure 4 form nearly linear patterns, suggesting the model’s high significance.
Figure 13(a) and (b) are three-dimensional response surface diagrams of Density, revealing the relationship between Kaolin, Clay, Starch, Palm kernel shell ash and Density, and the interaction between Kaolin, Clay, Starch, and Palm kernel shell ash. (a) 3D surface plot on the effect of Starch and Kaolin on porosity of the membrane. (b) 3D surface plot on the effect of Starch and Kaolin on porosity of the membrane.
This 3D Response Surface Methodology (RSM) plot (Figure 13(a)) represents the relationship between density (Z-axis), starch (grams) (X-axis), and clay (grams) (Y-axis). The X-Axis represents the amount of starch, ranging from 37 g to 225 g. The Y-Axis indicates the amount of clay, ranging from 112 g to 225 g. The Z-Axis (Density): The response ranges from approximately 0.7 to 1.3. The highest density (1.3) is observed when the amount of starch is highest (225 g) and clay is high (225 g). This suggests large amounts of starch and clay produce a denser material. The lowest density (0.7) is found at the opposite end of the graph, where starch is low (37 g) and clay is low (112 g). The plot shows a synergistic relationship between starch and clay. As both variables increase (starch and clay), the density rises, as seen in the curved surface moving upward. Low starch and low clay contribute to the lowest density values, but density rises when either starch or clay increases. The contour lines at the base represent the interaction of starch and clay in terms of density. The lines together indicate steeper changes in density, particularly at higher values of both variables.
This plot illustrates how starch and clay affect density with optimal results achieved by increasing both components together.
This 3D Response Surface Methodology (RSM) plot (Figure 13(b)) shows the relationship between density (Z-axis), PKS (Palm Kernel Shell) grams (X-axis), and clay grams (Y-axis). The X-Axis (PKS grams) represents the amount of Palm Kernel Shell added, ranging from 7 g to 30 g. The Y-Axis (Clay grams) represents the amount of clay, ranging from 112 g to 225 g. The Z-Axis (Density) represents the response variable, density, which ranges from approximately 0.7 to 1.3. The highest density is observed at high levels of PKS (30 g) and clay (225 g). This suggests that using a large amount of PKS and clay results in a dense material. The lowest density occurs when PKS (7 g) and clay (112 g) are at their lowest value. This indicates that the combination of low PKS and low clay produces less dense material. The surface slopes upwards toward higher density as PKS and clay quantities increase. The plot demonstrates a non-linear relationship, meaning that increasing both PKS and clay leads to a more significant increase in density than if either variable were increased independently. The rate at which density increases is more significant when both are increased together, compared to increasing one without the other. The contour lines show the interaction between PKS and clay to density.
Model validation (modeling of response)
Analysis of the experimental data revealed that quartic models shown in equations (1), (2), and (3), were suitable for the responses (Flowrate, porosity, and density) as a function of the components of the ceramic membrane. The validity of the models was checked by plots of the model predicted against the experimental (actual) values as shown in the figures below. The plot of flow rate (Figure 14) shows that the slope line passes through the points. This model (plot) was similar to that of Porosity (Figure 15), and Density (Figure 16). The relative similarity between the experimental observations and the model predictions indicates the validity, precision, and good predictive capacity of the model. Plot of predicted against the actual flowrate of the ceramic membrane. Plot of predicted against the actual of the density of the ceramic membrane. Plot of predicted against the actual density of the ceramic membrane.


Statistical table of the model.
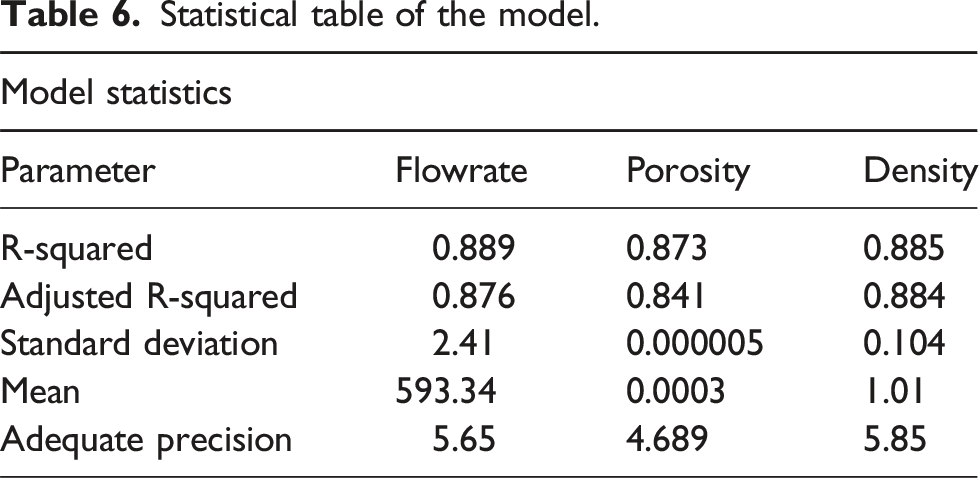
Further, the Adequate Precision (AP) values of 5.65,4.689, and 5.85 for flow rate, porosity, and density, respectively, indicate an adequate signal and the ability of the model to be used. This is because according to Amenaghawon et al., 25 the measure of the signal-to-noise ratio is desirable when greater than 4.
Optimization and verification
Optimal fabrication parameters.

Optimal preparation parameters and prediction versus experimental.

With a relative error of under 5%, it shows that the prediction accuracy meets the set criteria. This provides the capability of RSM in designing and optimizing the preparation parameters of the ceramic membrane.
Characteristics of the optimum ceramic membrane
The characteristics and properties of the optimum ceramic membrane were assessed. The characterization includes X-ray Fluorescence (XRF) analysis, Fourier Transform Infrared Spectroscopy (FTIR) Analysis, X-ray diffraction analysis (XRD), and Brunauer–Emmett–Teller (BET) Analysis.
XRF (x-ray fluorescence) analysis
Elemental composition of the ceramic membranes.

From the XRF Analysis, it can be stated that the constituents of the ceramic membrane are Silicon (69.63%), Al (26.25%), Fe (2.89%), Potassium (0.72), Ti (0.46), Sr. (0.03), and Zr(0.02).
FTIR analysis
FTIR spectroscopy was employed to discern the functional groups and detect any alterations in the chemical structure post-sintering. The features of FTIR, such as high signal-to-noise ratios, rapid data acquisition, and enhanced accuracy in frequency measurements, render it an apt choice as the primary analytical method for characterizing minerals (Madejová et al.26,27). The FTIR analysis revealed evident indications of clay minerals in the sample. A graph of wavenumber and transmittance (FTIR) of the ceramic membrane.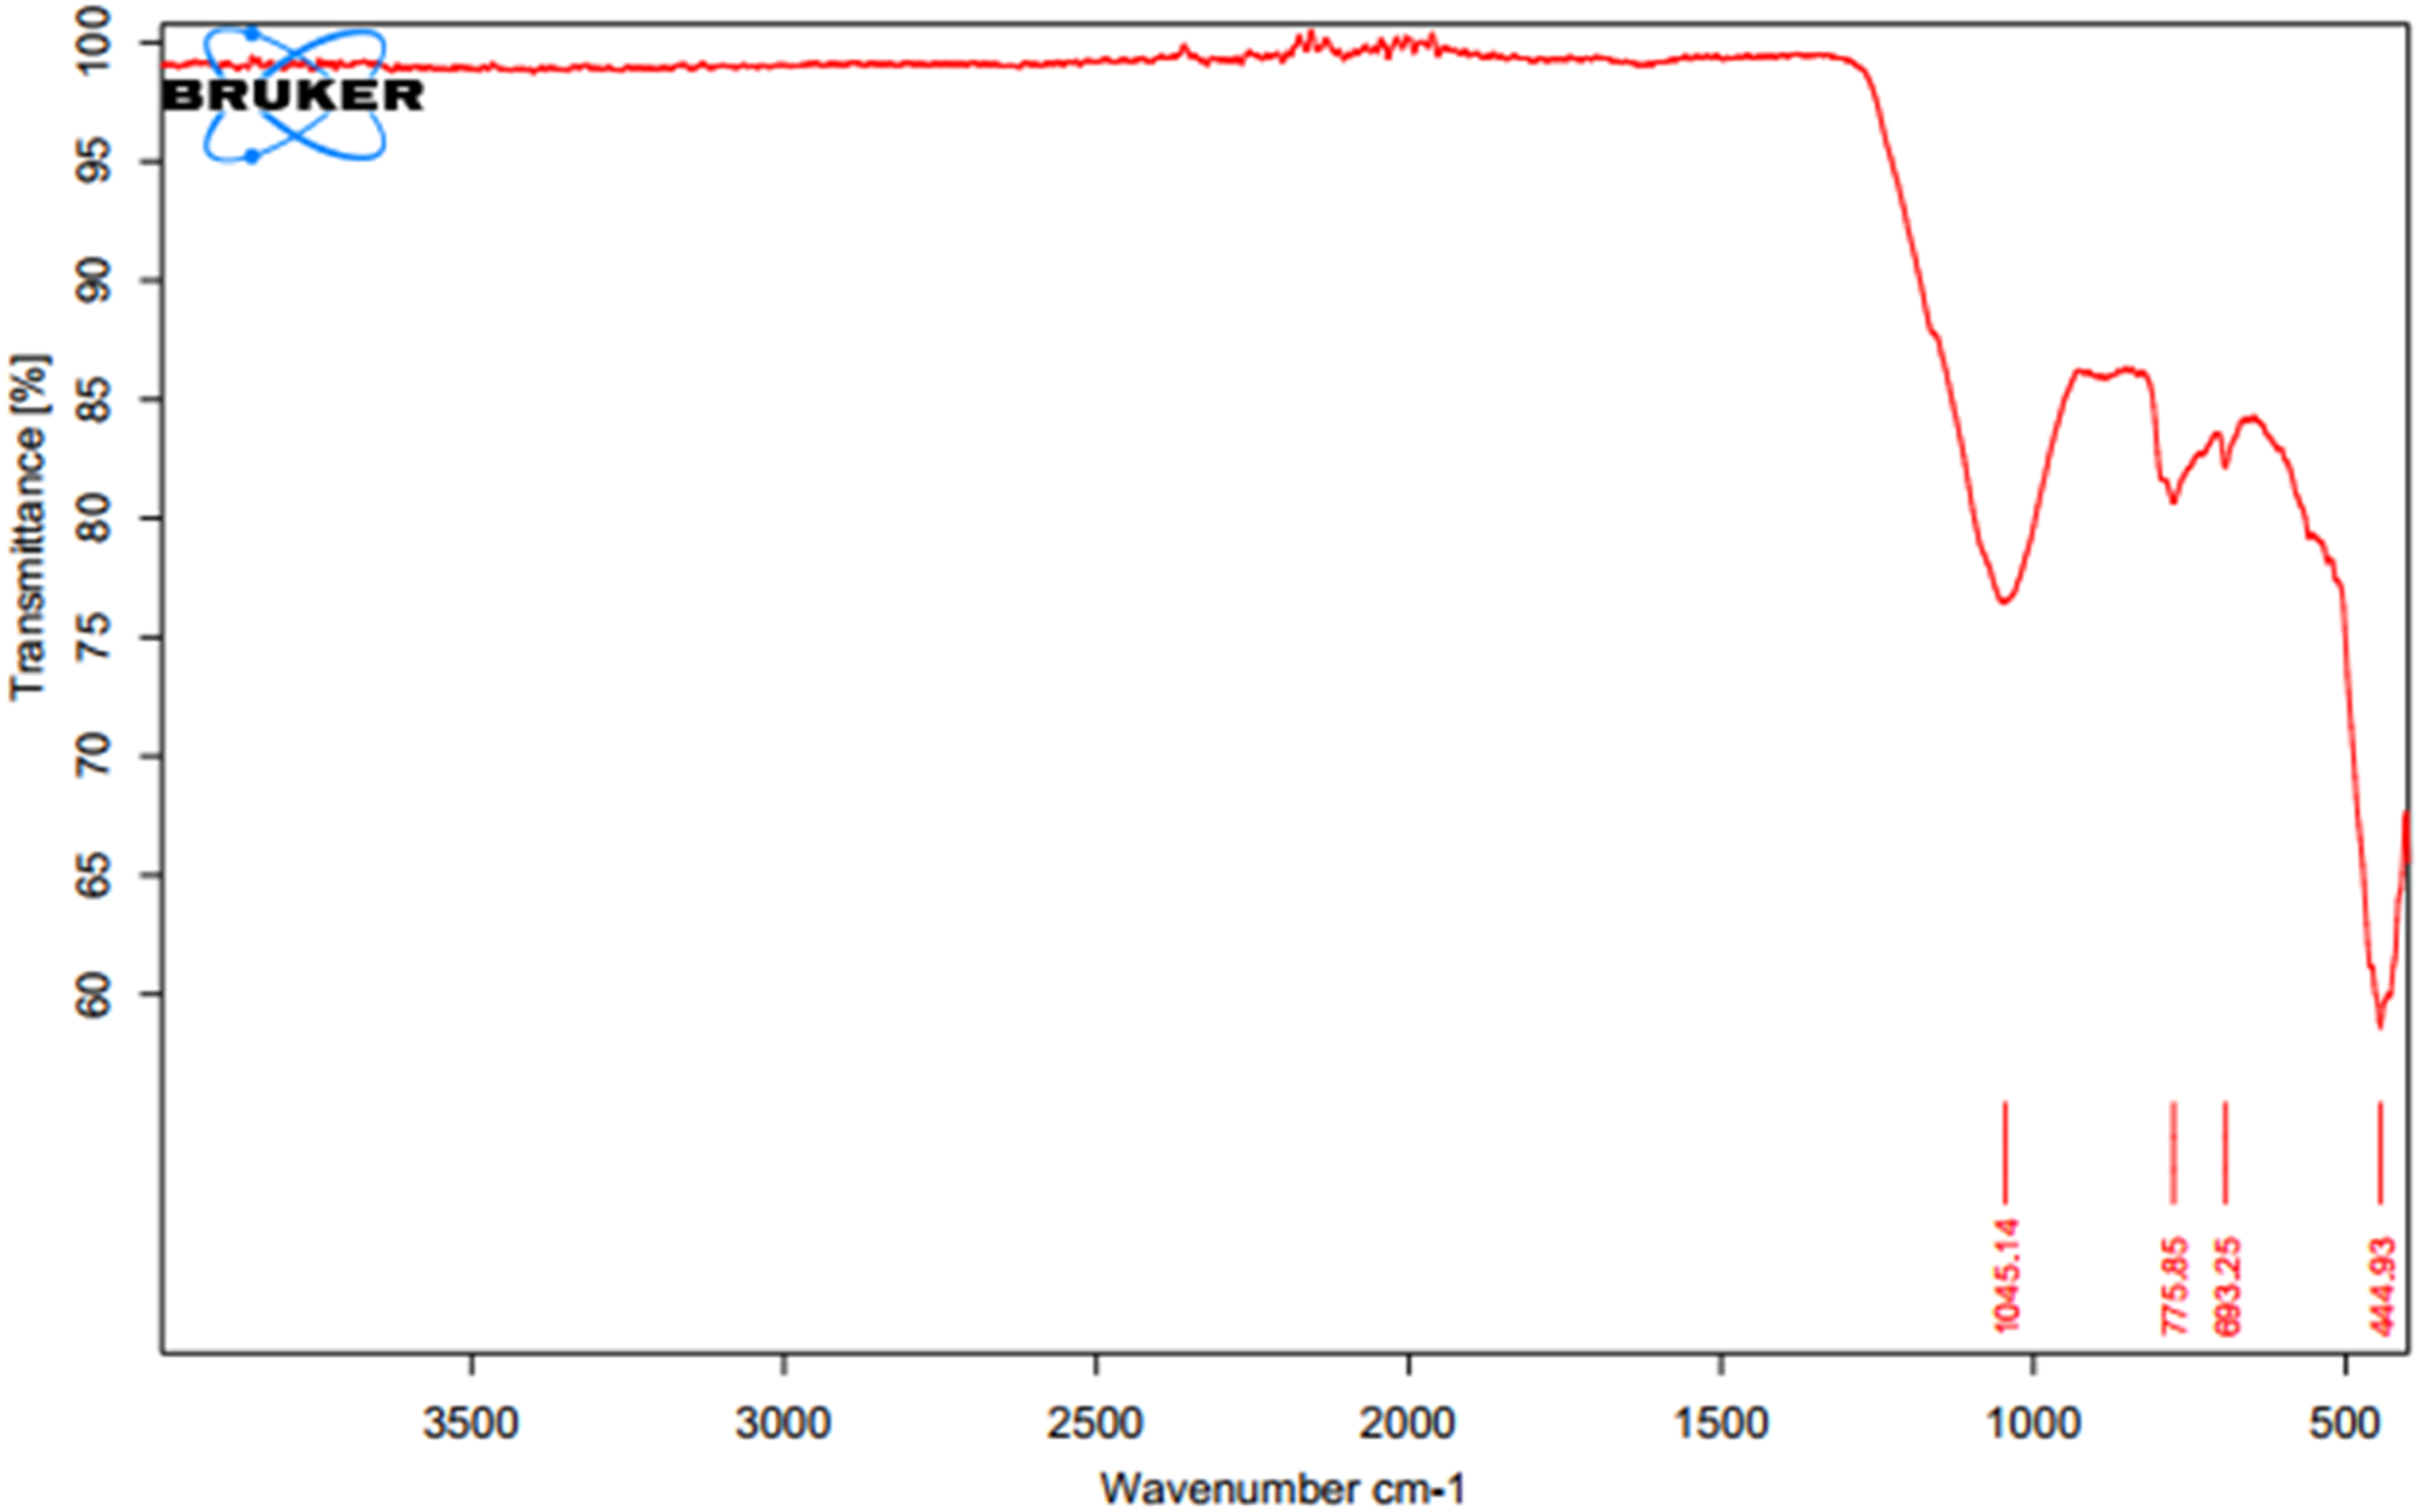
From the study, Figure 17, the strong band at the area 1045.14 cm−1 could be assigned between the bands 1033 cm−1 and 1094 cm−1 and this represents Si–O to Si–O stretching on the IR band spectrum (Madejová et al.26,28). Also, the peak recorded at the band 775.85 cm −1 is found between the bands 790-693 cm−1 on the FTIR spectra table and it is assigned to Si–O stretching, Si–O–Al stretching. From the analysis, the strong band 693.25 cm−1 could also be assigned to Si–O stretching, and Si–O–Al stretching. The narrow sharp band at 444.93 cm−1 which is between 45 and 468 cm−1 could be assigned to Si–O bending, and Si–O–Fe stretching (Madejová et al. 26 ).
X-ray diffraction analysis (XRD)
X-ray diffraction (XRD) is a non-destructive method that furnishes comprehensive insights into the crystallographic structure, chemical composition, and physical attributes of a material. Additionally, XRD offers information regarding the mineral composition of the sample, as depicted in Figure 18. XRD Classification of the ceramic membrane.
As depicted in the figure above, quartz exhibited the highest mineral composition within the ceramic membrane sample, accounting for 82.9%, followed by Boromuscovite at 10.9%, and Gibbsite at 6.2%. Regarding the crystalline structure of the ceramic membrane material, it comprises 65.4% crystallinity and 34.6% amorphous content.
BET analysis
Pore size distribution analysis table.

The analysis indicates a predominant presence of pores ranging in diameter from 2.64 to 6.60
The cumulative specific surface area of the ceramic membranes under study, calculated from the BET analysis data, was determined to be 0.29 m2 with a pore volume of 0.147 cm³·g⁻1. While this value is comparatively low when contrasted with the specific surface area of certain inorganic materials like catalysts (Naqvi et al. 29 ), it falls within the same order of magnitude as those observed for other ceramic membranes with similar pore sizes measured via mercury porosimetry (Nasrollahzadeh et al. 30 ). The relatively low surface area values identified in the ceramic membranes can be attributed to the prevalence of macropores (ϕ > 50 nm), as small pores typically contribute to higher specific surface area values (Jaroniec et al. 31 ).
Conclusions
This paper studied the fabrication of ceramic membranes using Response Surface Methodology (RSM). It also looked at the influence of clay, palm kernel shell ash, kaolin, and starch on the properties of ceramic membrane filters. Optimal test conditions and procedures were determined by selecting a fitting model based on experimental data. The Box–Behnken design (BBD) model was chosen for its ability to reduce the number of experimental trials, thus making it cost-effective. The BBD design was executed using Design-Expert 13 software (Stat-Ease, Inc., Minneapolis, MN, USA), requiring 29 experimental runs. Responses such as Porosity, flow rate, thickness, and density, were used in the model. Based on RSM, an optimum ceramic membrane design was proposed: Kaolin = 413 g, Clay = 180 g, Starch 147 g, Palm Kernel shell ash = 13 g. Compared with the test results, it possesses favorable and reliable accuracy. The addition of kaolin played a role in creating a porous framework within the ceramic membrane. Clay serves as a binding agent, aiding in the consolidation of ceramic particles within the membrane matrix. Starch serves as a pore-forming agent during fabrication, starch undergoes combustion or removal upon firing of the ceramic mixture. From the study, PKSA serves dual roles as both a binder and a reinforcing agent, bolstering the mechanical strength and structural robustness of the ceramic membrane. From the XRD analysis, the fabricated ceramic membrane is made up of silicon, aluminum, iron, and traces of elements such as K, Si, Tr, and Zr. The study has provided information on the optimal mix ratio for ceramic membrane fabrication that possesses reliable accuracy compared with the experimental results. These results will be useful for engineers in the enhancement of ceramic membrane filters.
Footnotes
Author contributions
Augustine Owusu Sekyere, Martina Francisca Baidoo, Godfred Ohemeng-Boahen, and Helen M.K Essandoh designed the research and manuscript, analyzed the data, and verified the results. Augustine Owusu Sekyere wrote the final draft of the manuscript as a corresponding author. Martina Francisca Baidoo, Godfred Ohemeng-Boahen, and Helen M.K. Essandoh reviewed the draft manuscript.
Declaration of conflicting interests
The author(s) declared no potential conflicts of interest with respect to the research, authorship, and/or publication of this article.
Funding
The author(s) disclosed receipt of the following financial support for the research, authorship, and/or publication of this article: this work was supported by the Regional Water and Environmental Sanitation Centre Kumasi (RWESCK) at the Kwame Nkrumah University of Science and Technology (KNUST), Kumasi with funding from the World Bank through the Government of Ghana under the Africa Centers of Excellence project.
Data availability statement
The authors confirm that the data supporting the findings of this research are available within this article.