
Abstract
Temperature uniformity inside the autoclave and in the manufactured thermoset composite part is the key to enhancing curing performance. The present study incorporated experimental setup, multiphysics and computational fluid dynamics (CFD) models to provide insight into the gas flow pattern and temperature distribution inside the autoclave besides temperature and curing evolution in composite parts during the manufacturing process. The ultimate goal is to help improve the uniformity of the degree of curing and produce robust composite parts. The used numerical models were validated by experiment and the predicted results were in agreement with experimental efforts with a difference of 5%. A maximum temperature difference of 3 K was observed for panel 1, 1 K for panel 2, and 4 K for panel 3 during the curing stages. The variation was more pronounced during the post-curing stage, especially at the center. Correspondingly, less degree of curing (DOC) occurred at the center. The DOC variation between the center and the sides at the base of the panel is 2.5%. Variation in DOC across the thickness of the composite panels was also observed due to thermal spikes and uneven heat transfer. The DOC variation between upper surface and midplane is about 11%. Regions of high turbulence intensity lead to better heat transfer while regions of low speed such as confined regions under the tooling table had the poorest heat transfer. The study provided some practical implications to reduce the non-uniformity in temperature distribution and improve part curing.
Keywords
Introduction
High-performance carbon fiber-reinforced polymer composites are largely used in aerospace structural parts due to their lightweight, high strength, corrosion resistance, and extended service life. These polymer matrix composites are cured inside a pressure/temperature controllable autoclave environment to achieve desired fiber volume fraction and reduce void content. The variation in the curing temperature profile, gas flow patterns, the part, mold shape, size, and position can cause uneven temperature distribution in the composite part. 1 The non-uniform temperature distribution leads to uneven composite curing. 2 Consequently, residual stresses, 3 deformation, 4 and other internal defects are introduced in the composite part. To reduce the temperature variation and improve curing process, it is essential to understand what parameters affect the temperature distribution in the autoclave, mold, and part, the flow and its turbulence intensity, and heat transfer.
The temperature field inside the autoclave is a critical factor that controls the quality of the composite part being manufactured.5–8 Several recent studies were conducted to study the temperature distribution inside the autoclave, across the mold body and composite parts aiming to decrease the temperature gradient and improve curing by means of simulation and experiments. Researchers have widely used finite element methods and Computational Fluid Dynamics (CFD) to model autoclave composite manufacturing process. They can be classified into process models for manufacturing, optimization of curing process and mold design.
Modeling
Bogetti et al. used a two dimensional finite element model to build a process model for different geometries and boundary conditions for composite parts. 9 The model addressed the temperature gradient present in curing thick composite parts under different cure cycles. Struzziero et al. developed an optimization model to minimize the thermal spike and also the cure time of the composites. 10
Curing process and mold design
White et al. discussed a two stage curing method to reduce the thermal gradient as well as the non-uniform consolidation problem in thick laminates.
11
Wang et al.
12
combined a numerical model with a genetic algorithm to optimize the design parameters of the mold’s substructure. Xie et al.
13
conducted a simulation to analyze heat transfer during an autoclave curing cycle in the mold. They proposed an improved curing process to achieve a more uniform temperature field in the composite product. Weber et al.
14
summarized key factors affecting convective heat transfer coefficients in the mold panel. They introduced an approach using shift factors along with a measured reference curve in thermal simulation. However, these shift factors were only applicable to simple molds of various sizes. Chen et al.
15
simulated the mold in an autoclave, with a focus on boundary layer grids to enhance the accuracy of the results. Kluge et al.
16
investigated the temperature distribution in an industrial mold within an autoclave. Their findings revealed that positions on the upstream side of the tool heated faster than downstream positions. Due to the inherent characteristics of heat transfer in the autoclave process,
17
the temperature difference in the mold cannot be completely eliminated. Therefore, it is crucial to minimize this temperature difference in the mold. Zhang et al.
18
conducted CFD and experiments to study the effects of metallic mold and flowing medium thermal properties on heat distribution across large parts inside an autoclave. A k‒ε turbulence model was used to simulate the heating process. They claimed that the temperature gradient decreased when copper mold and helium gas were used instead of conventional steel mold and air. Han et al.
19
proposed a method to manage the temperature distribution of a large mold for composite manufacturing using an autoclave environment. They also utilized a validated CFD k‒ε turbulence model to study the effect of tilting mold angle on temperature variation in the mold. They found that when the mold tilted by around
The goal of this study is to investigate the potential of improving composite part curing through exploring temperature distribution and the degree of curing evolution in composite parts manufactured inside an autoclave. The flow behavior and temperature distribution inside the autoclave chamber are highly related to the part-curing performance so they were also studied. To this end, the study incorporated an autoclave experimental setup to manufacture composite panels made from IM7/Cycom 5320-1 prepreg. The experiment utilized thermocouples to monitor the temperature on the composite surface and differential scanning calorimetry to obtain cure kinetic parameters and emitted heat during the exothermic reactions. The collected experimental data was used to set up a multiphysics model and also to validate numerical models. The multiphysics model was used to calculate the temperature distribution and curing evolution inside the composite part. A CFD turbulence transient model was developed to obtain the temperature and flow patterns inside the autoclave chamber. The experimental and numerical approaches cooperatively provided a comprehensive understanding of the temperature and curing evolution during the composite manufacturing process. The study concluded with a practical implications section that gives the potential to improve curing performance and part quality.
Experiment
Autoclave setup and composite manufacturing
The position of the prepreg layup inside an autoclave will affect the temperature distribution and curing of the prepreg. To evaluate this, three composite panels were manufactured using an autoclave. The autoclave used in this study has a maximum part size of 1.067 m (3.5 ft) diameter and 1.828 m (6 ft) total length (Figure 1). Panels were made using 8 layers of 30.48 cm × 30.48 cm (12 in × 12 in) IM7/Cycom 5320-1 prepreg with a symmetric cross-ply lamination scheme. Prepreg layups were placed on an aluminum baseplate at a height of 27.432 cm (0.9 ft). The bagging scheme used in this study is shown in Figure 1. The laminates were layered and placed on an aluminum baseplate, followed by a release film, breather and vacuum bag. Each prepreg layup is separated by 15.24 cm (6 in) apart. To measure the temperature variation at different positions along the span of the autoclave, 16 thermocouples are placed on the top of the prepreg layup. A reference thermocouple is also used to measure the nitrogen gas temperature inside the autoclave. Autoclave at Missouri S&T and bagging scheme used in this study.
The placement of all 16 thermocouples (TCs) and the position of the prepreg layup on the cart are shown in Figure 2. Panel 1 is close to the autoclave door, Panel 3 is near the rear of the autoclave, and Panel 2 is in between Panel 1 and Panel 3. TC1 to TC16 represent the thermocouples. TC4 and TC14 are placed in the center of the layups and TC1, TC3, TC5, and TC7 are placed 2.54 cm (1 in) away from the corner, whereas thermocouples TC2, TC6, TC8, TC9, TC10, TC11, TC12, TC13, TC15, and TC16 are placed 2.54 cm (1 in) from the nearest edge and 15.24 cm (6 in) from the non-parallel edge. Figure 3 shows the experimental setup for Panels 1, 2, and 3. Placement of layup in autoclave and position of thermocouples. Prepreg layup and thermocouples.

Figure 4 represents the temperature distribution during curing for Panel 1. During the curing and post-curing stages, TC1 to TC7 did not reach the reference temperature profile. The difference between the reference and surface temperatures is augmented as the curing temperature increases. Also, it is observed that there is a significant variation between the TCs on the layup. This temperature variation is due to the panel being near the door and underneath the high temperature, high-turbulence intensity stream at the center where the annular hotter entering flow meets and travels downstream. This flow pattern is confirmed by CFD results shown in Figure 23. Throughout the curing process, it was found that the increased turbulence intensity improves the temperature uniformity. Turbulence intensity measures how intense the turbulent fluctuations are. It is related to the kinetic energy of the turbulence per unit mass of the fluctuation velocity field. TC4 which is at the center, has the highest temperature difference from the set temperature. TC4 is located the farthest from the panel sides, so the inplane conductive heat transfer is lower. Figure 5 shows the interpolated surface data of temperature difference in the prepreg at three different times with reference thermocouple during the curing process in Panel 1. The green color on the plot represents the minimum temperature difference while blue represents maximum temperature difference. It is observed that the maximum temperature difference happened during the post-curing stage (third heating stage). Maximum temperature variation on the surface of the layup is also observed during the post-curing stage. Temperature distribution inside the autoclave for Panel 1. Temperature difference in Panel 1 at different times.
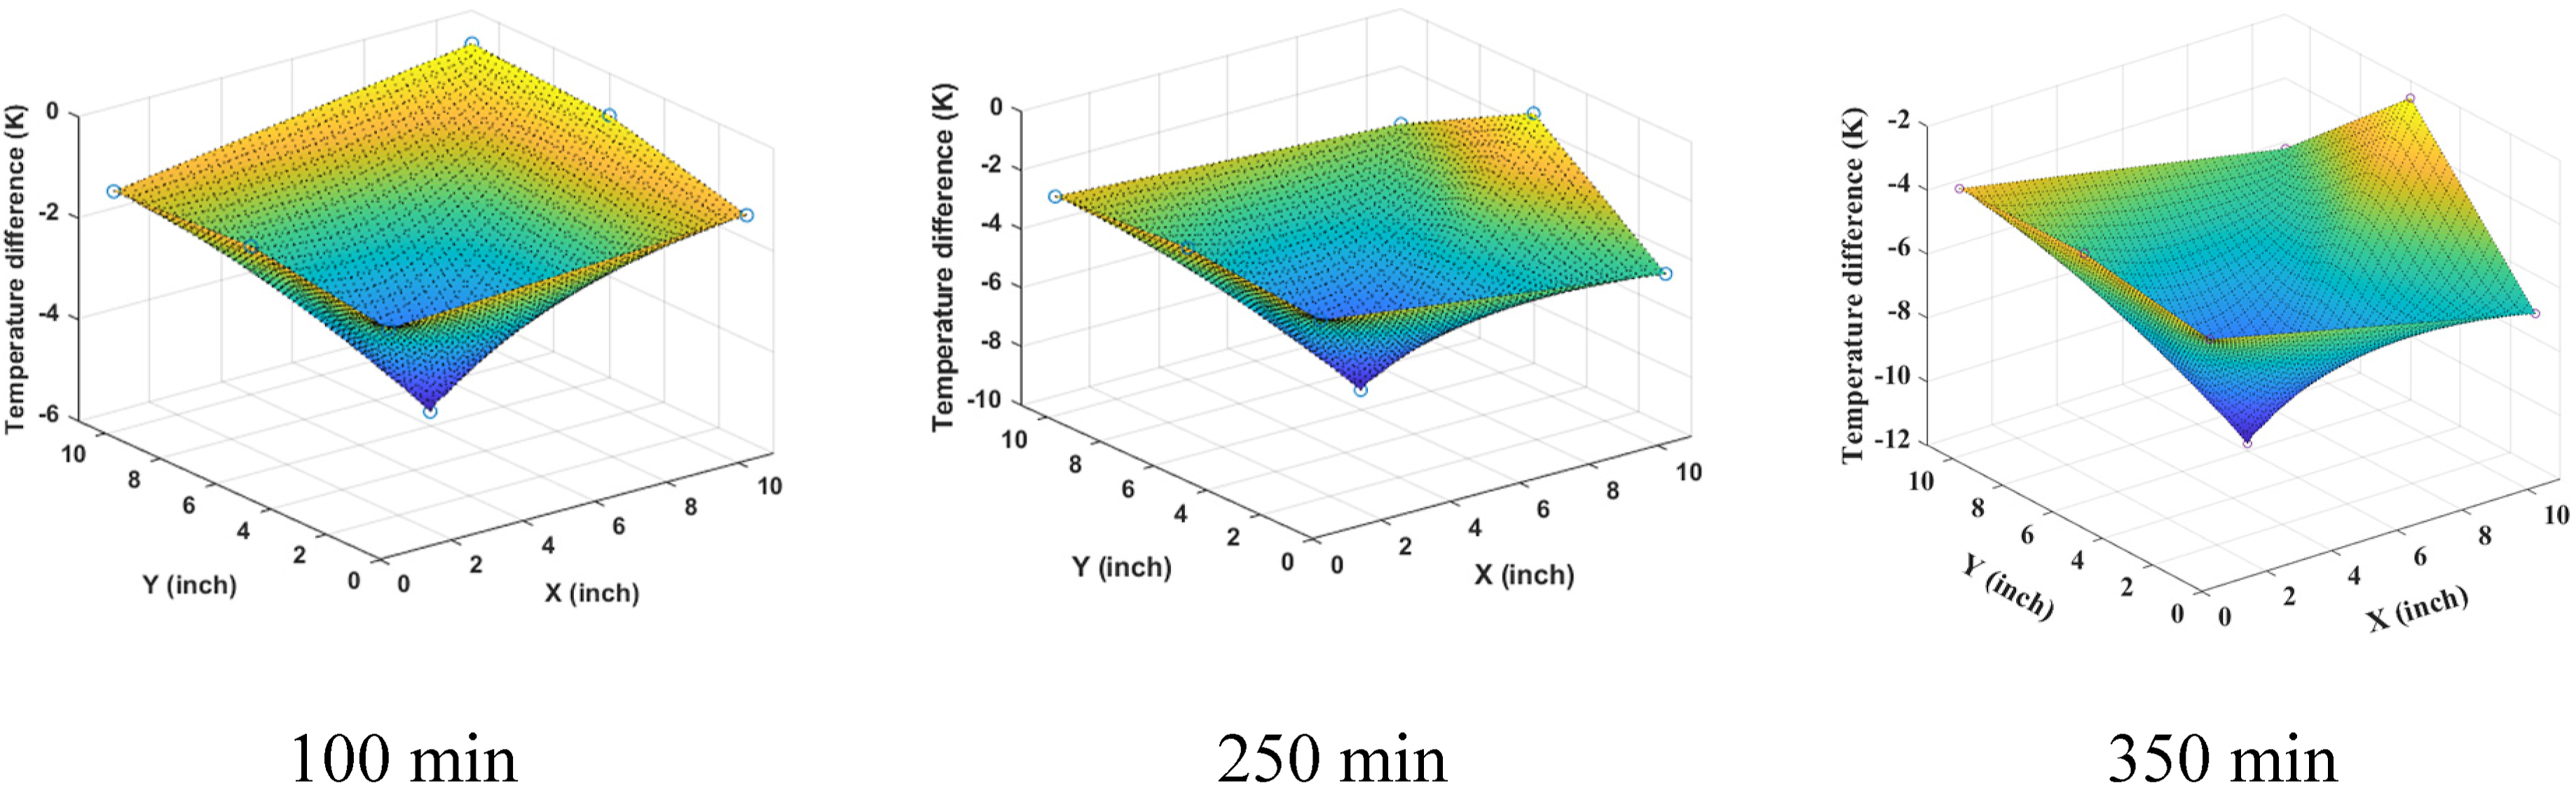
Figure 6 shows the temperature distribution in Panel 2 during the curing process. Similar to the temperature distribution of Panel 1, the thermocouples on the prepreg did not reach the reference temperature during the curing and post-curing stages. It was observed that the maximum temperature difference across the surface of this layup during the curing process was less than 1 K. This is because the velocity profile of gas on the surface of the layup is more uniform due to the higher turbulence intensity which tighten the range of temperature spectrum at this region. This is confirmed by CFD results shown in Figure 23. Figure 7 shows the interpolated data of the temperature difference at the surface of Panel 2 at three different times with reference thermocouple. Compared to the temperature differences at the other two studied panels, the temperature offset from the reference at all times was observed less across the surface of panel 2. This is also due to the uniformity of the flow velocity in the vicinity of panel 2 surface caused by the higher turbulence intensity surrounding flow. This is also confirmed by CFD results in Figure 23. Temperature distribution in Panel 2. Temperature difference in Panel 2.

Figure 8 shows the temperature distribution in Panel 3 during the curing process. It is observed that TC14 located at the center has the highest temperature difference with respect to the reference. Unlike Panel 2, the temperature distribution in Panel 3 has a significant variation in surface temperature. It is attributed to the proximity of Panel 3 to the fan that circulates the gas during operation. The fan directs the high temperature high-turbulence flow towards the exit of the autoclave and away from Panel 3. Consequently, the region above Panel 3 has low turbulence intensity up to the end of second holding stage as illustrated by the CFD results in Figure 23. This low flow intensity contributes to the increased temperature variation on Panel 3. TC16 has the least temperature variation with reference temperature throughout the curing process which can be observed in Figure 9. Temperature distribution in panel 3. Temperature difference in Panel 3.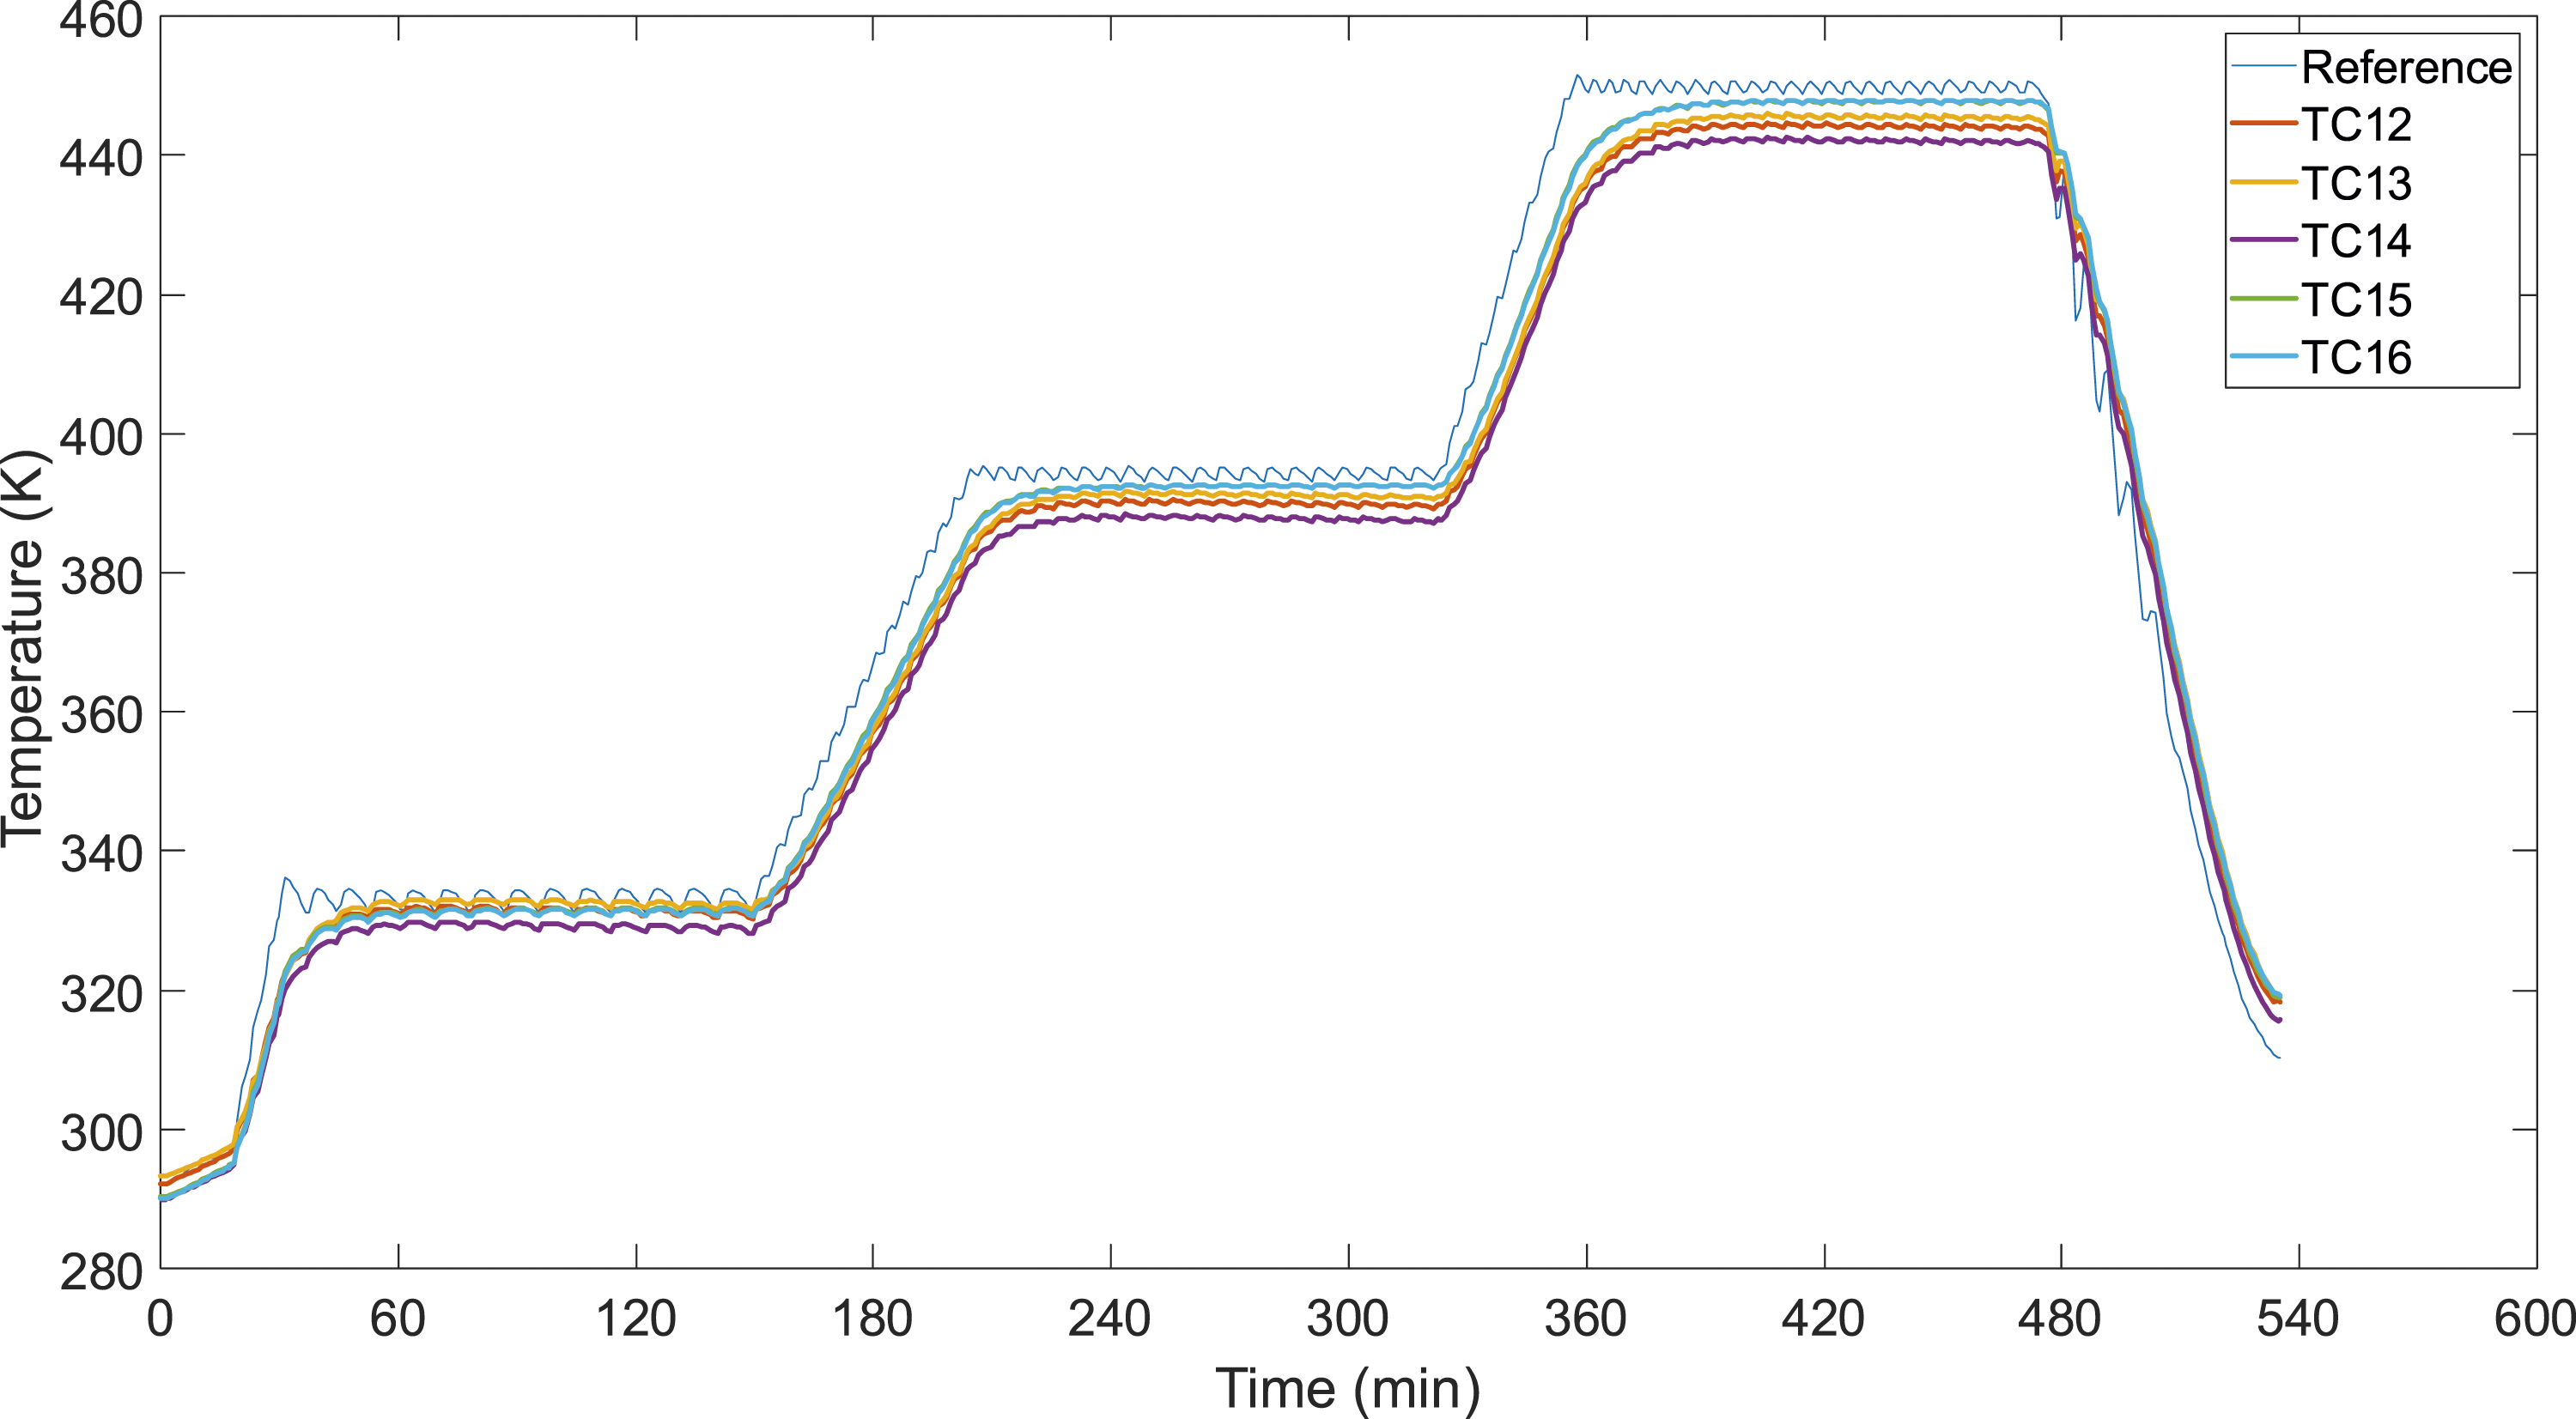

Numerical modeling
Multiphysics model
Exposing a composite to heat causes the thermoset matrix to polymerize (solidify). During the polymerization process, chemical reactions and crosslinking occur and exothermic energy is emitted. The reaction rate is influenced by the temperature history and exothermic reaction. A multiphysics model that integrates cure kinetics and heat transfer models was developed. The cure kinetics model was used to study the evolution of the degree of cure (DOC) during the polymerization process and a heat transfer model was used to study the temperature evolution.
Cure kinetics modeling
Differential Scanning Calorimetry (DSC) is a widely used technique to monitor and obtain cure kinetic parameters of exothermic reactions. DSC monitors the heat flow out of a sample during the curing process. For an exothermic reaction, the degree of cure, α, at a certain time, t, is defined as the ratio of heat evolved from a sample during curing until t to the total heat of reaction of the cured sample. Equation (1) is used to calculate the DOC of a sample.


Thermal model

Material parameters of Cycom 5320-1.

Thermal properties of the base plate and the consumables used in the model.

Multiphysics model setup and boundary conditions
To study the cure kinetics of the composite, a thermo-chemical model was built in COMSOL Multiphysics software. The partial differential equations module was used to address the cure kinetics process in the laminate. The thermal model was incorporated using the heat transfer module. The model reflects the actual manufacturing layup used to cure composite components.
A heat flux boundary condition was applied on all outer surfaces according to equation (4). This corresponds to the cure cycle for composite manufacturing.
Cure cycles
Two cure cycles are used for the simulation. The first cure cycle is the same as the manufacturer’s recommended base cure cycle. The base cure cycle includes a ramp from room temperature to 330 K at 2 K/min, hold at 330 K for 2 h, ramp to a cure temperature of 395 K, at a rate of 2 K/min, and hold at 395 K for 2 h before being cooled to room temperature. The cure cycle is shown in Figure 10. Base cure cycle.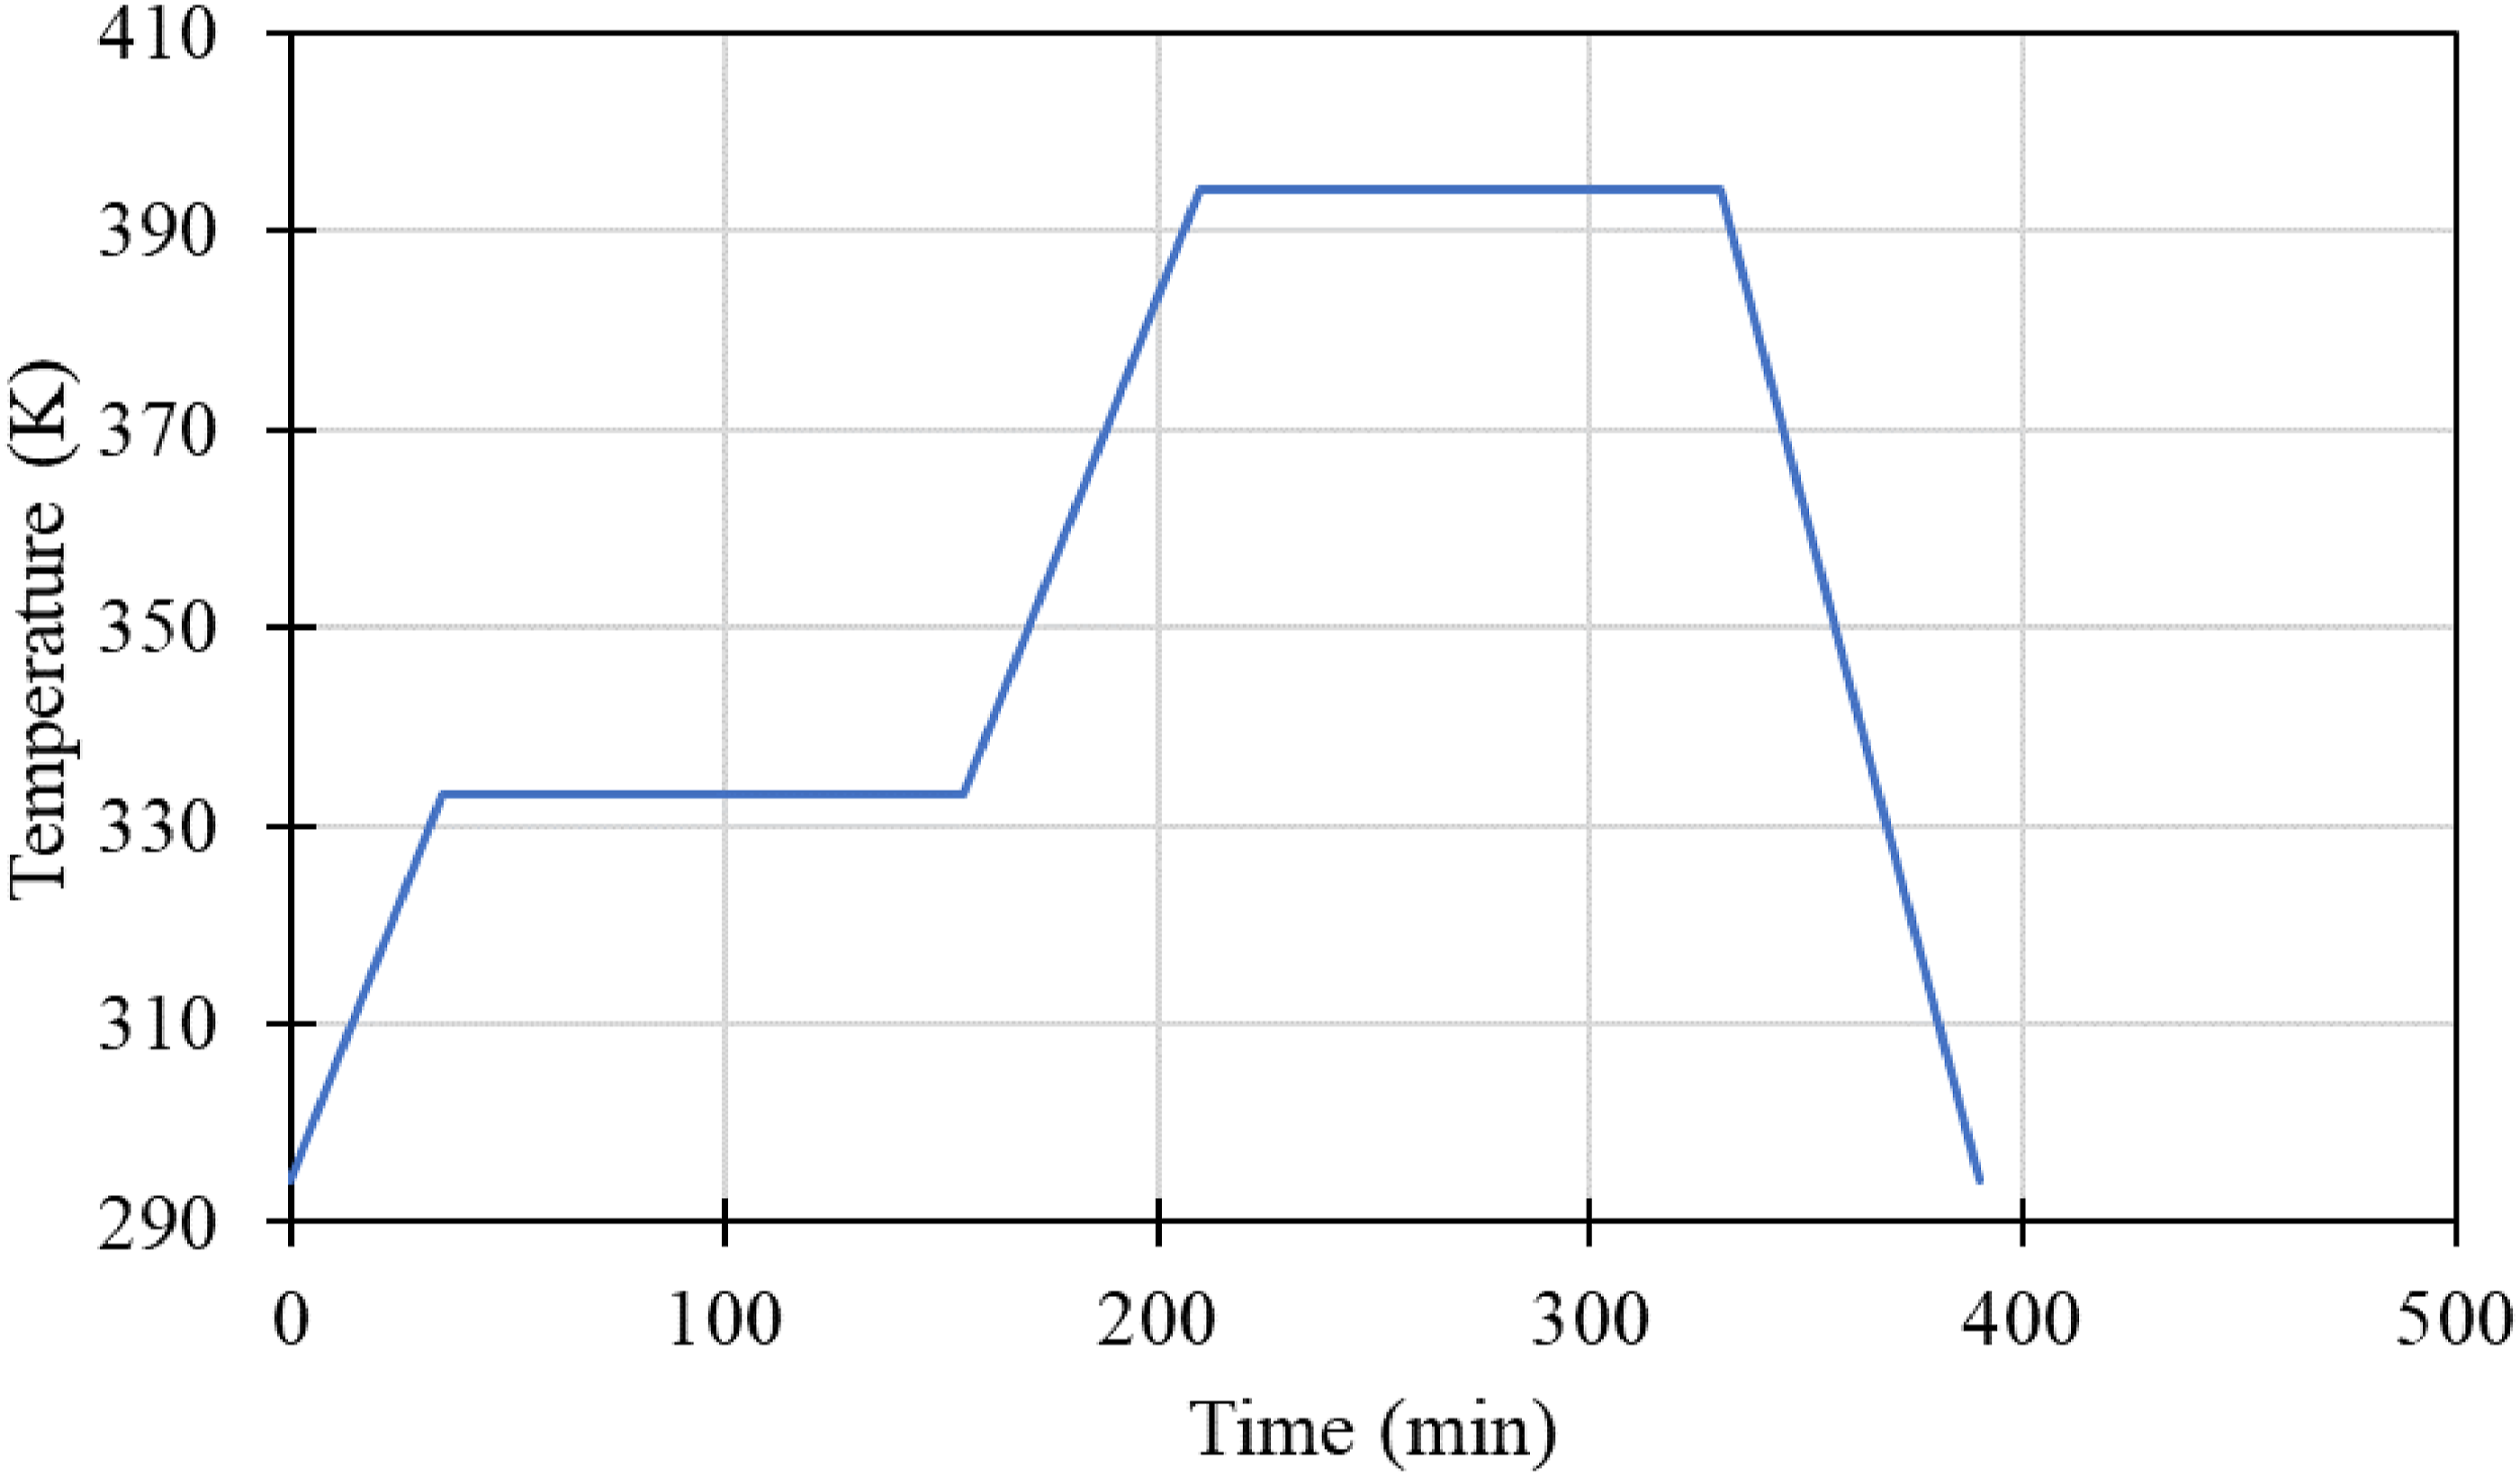
Second cure cycle has both base cure and post-cure and was obtained from the autoclave data recorded during the experiments. The temperatures from panel 1 thermocouples at a time instant on the panel were interpolated over an entire panel. This interpolated data was used as temperature of gas in the autoclave on the top of panel (
CFD 3D-Model
The goal of CFD modeling the autoclave environment was to understand the temperature distribution and airflow pattern inside the autoclave. It was assumed that the heat transfer from the solid to the nitrogen flow field was excluded from the CFD simulation, which means the heat transfer through solid matter was not considered in this section since it was discussed in Multiphysics model Section. More discussion can be found under CFD 3D-Model Section.
Geometry and mesh
The main dimensions of the autoclave model and composite parts are shown in Figure 11. The cylindrical part of the chamber has a depth of 1.768 m (5.8 ft) and an inner diameter of 1.067 m (3.5 ft). The composite panels have dimensions of 30.48 cm Schematic of the autoclave and composite panels’ dimensions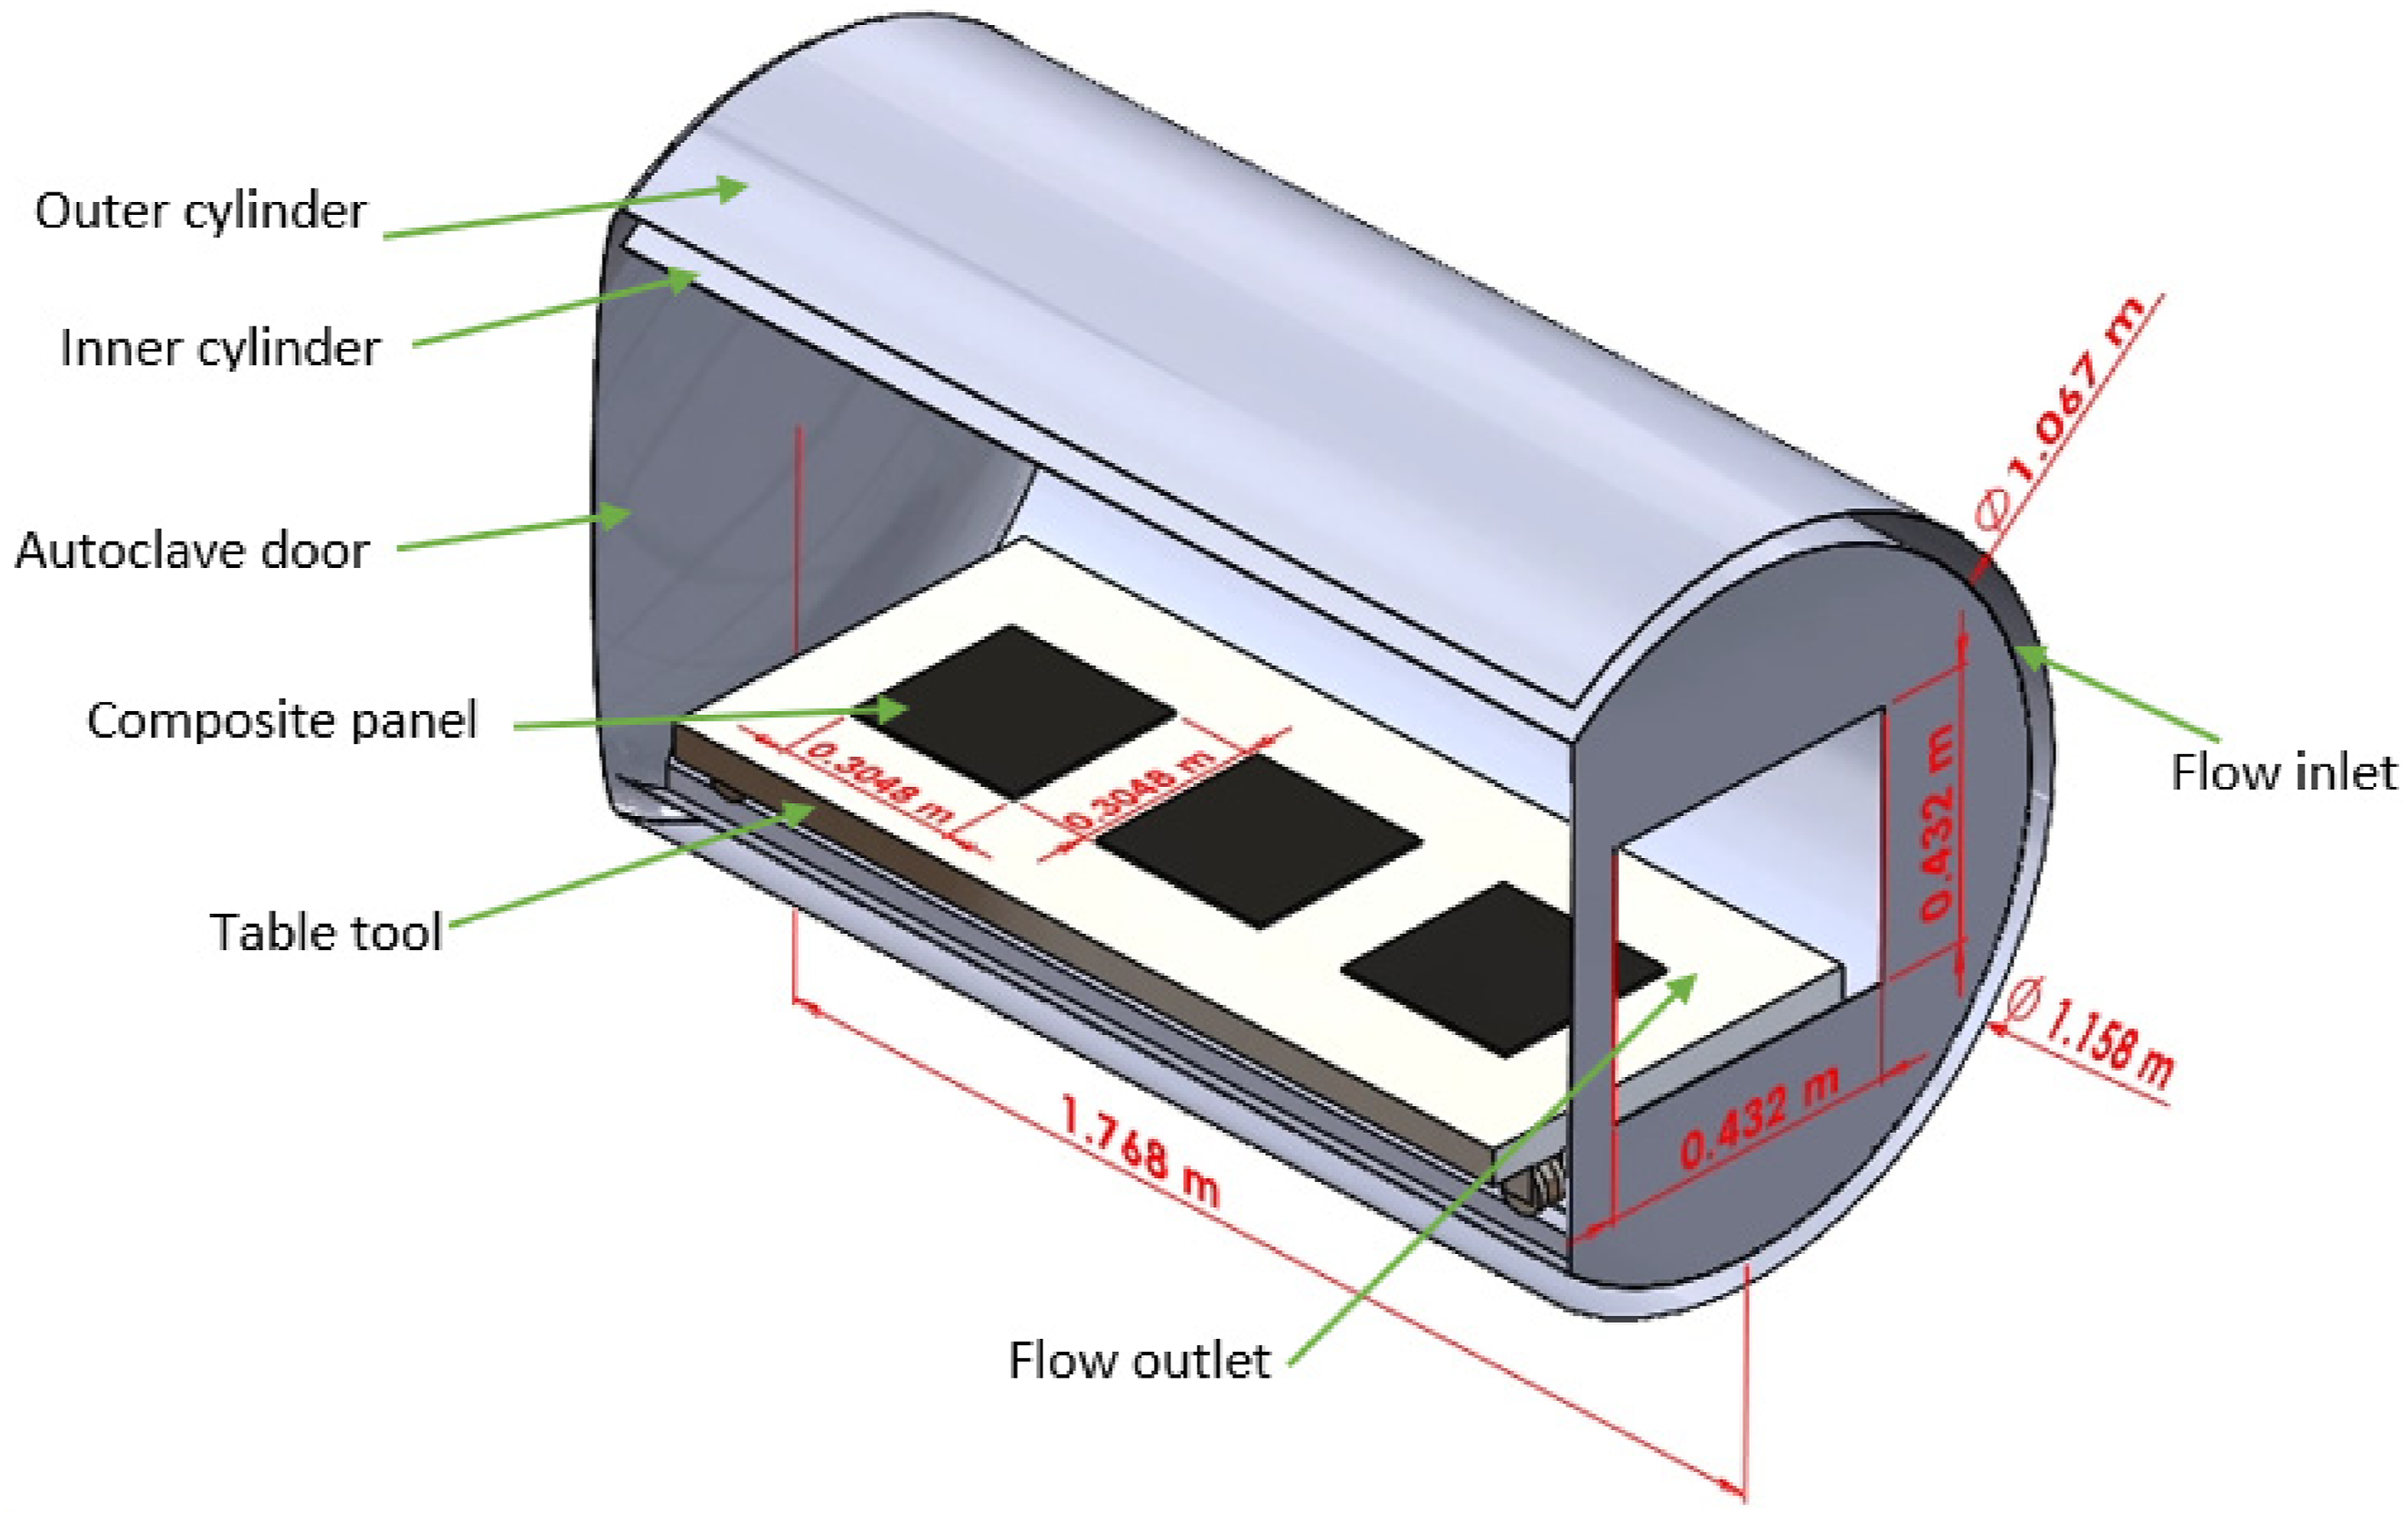
The mesh was built using the Ansys 2022/Fluentm meshing tool. Due to the geometric configurations, a completely structured mesh was not qualified, and instead, a hybrid mesh using the poly-hexcore method was used. The effects of mesh size on the final solution were studied. The number of elements inside the flow domain was approved at around 646430 elements (see Figure 12). The grid sensitivity to mish size was investigated by monitoring the independence of the streamwise velocity on the autoclave total mesh size. The point to collect the velocity data was located at the center of the autoclave. The model was given a time step of 1 and a number of iterations 50. The time to finish a run was about 3 min and 20 s. Autoclave mesh independence study.
Figure 13 shows a cross-section of the volume mesh of the domain with more elements assigned to the areas of interest (the composite panels). The surface grid spacing normal to the walls was adjusted such that the averaged Poly-hexcore mesh with decreased grid spacing normal to the wall. Autoclave model boundary conditions and thermocouple configurations.

Turbulence model
Using equation (5) and average cross-sectional velocity, the Reynolds number (

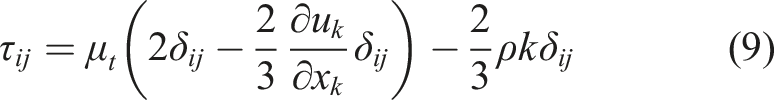
Two turbulence models were tried, the standard k‒ε and the shear-stress transport k‒ω (SST k‒ω), to solve the transient Reynolds averaged Navier–Stokes (RANS) continuity, momentum, and energy equations. The k‒ε model was selected due to its low computational cost and the satisfactory agreement with the autoclave experimental result.4,13,18,19 The SST k‒ω model 27 utilizes both k‒ω turbulence model and a modified k‒ε turbulence model. k‒ω model functions close to the solid walls while the modified k‒ε model is switched on at regions far from the walls. 27 Energy equations were turned on for both models to account for heat transfer by convection. No thermal radiation was incorporated as the autoclave temperature is below 473.15 K (200°C). 28
The governing equations in vector form for the SST k‒ω model is given by

CFD model setup and boundary conditions
Boundary conditions of the modeled autoclave.
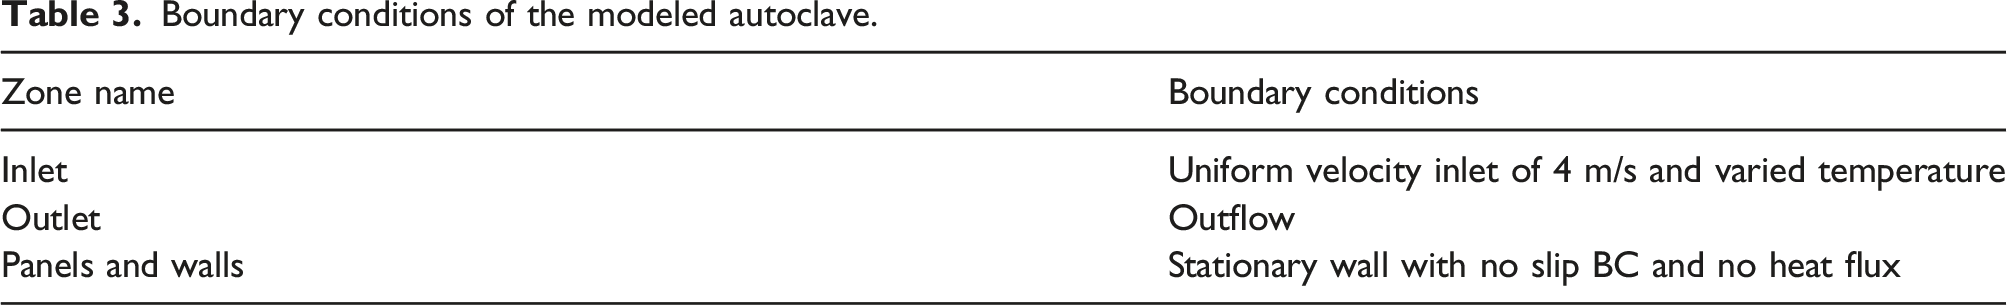
Second-order upwinding discretization methods were used to solve the turbulence governing equations. The coupled approach was used to resolve velocity and pressure in a coupled way. Since the flow enters the autoclave with varying curing temperatures, the model was set to transient with an appropriate timestep and 40 iterations per timestep.
Matlab program was used to smooth out the oscillation and noise in the temperature experimental data. The program was also used to precisely define the endpoints of each stage of the cure cycle. The data was then entered into the CFD model as a transient table. Figure 15 shows the flow chart of different experimental and numerical models used. Implementation flow chart.
Results and discussion
Multiphysics model
Figures 16 and 17 show the results of the base cure cycle. Figure 16 shows the DOC distribution at the end of the simulation across the layup thickness. Figure 17 shows the DOC variation through the laminate thickness during the time span of the curing process. No significant curing happens in the initial isotherm and the heat-up phases. Less DOC was observed at the bottom surface as shown in Figure 16. This indicates less heat exchange between the gas and the panel at this region. Degree of cure distribution after the base cure cycle Degree of cure evolution between the upper surface and midplane for base cure.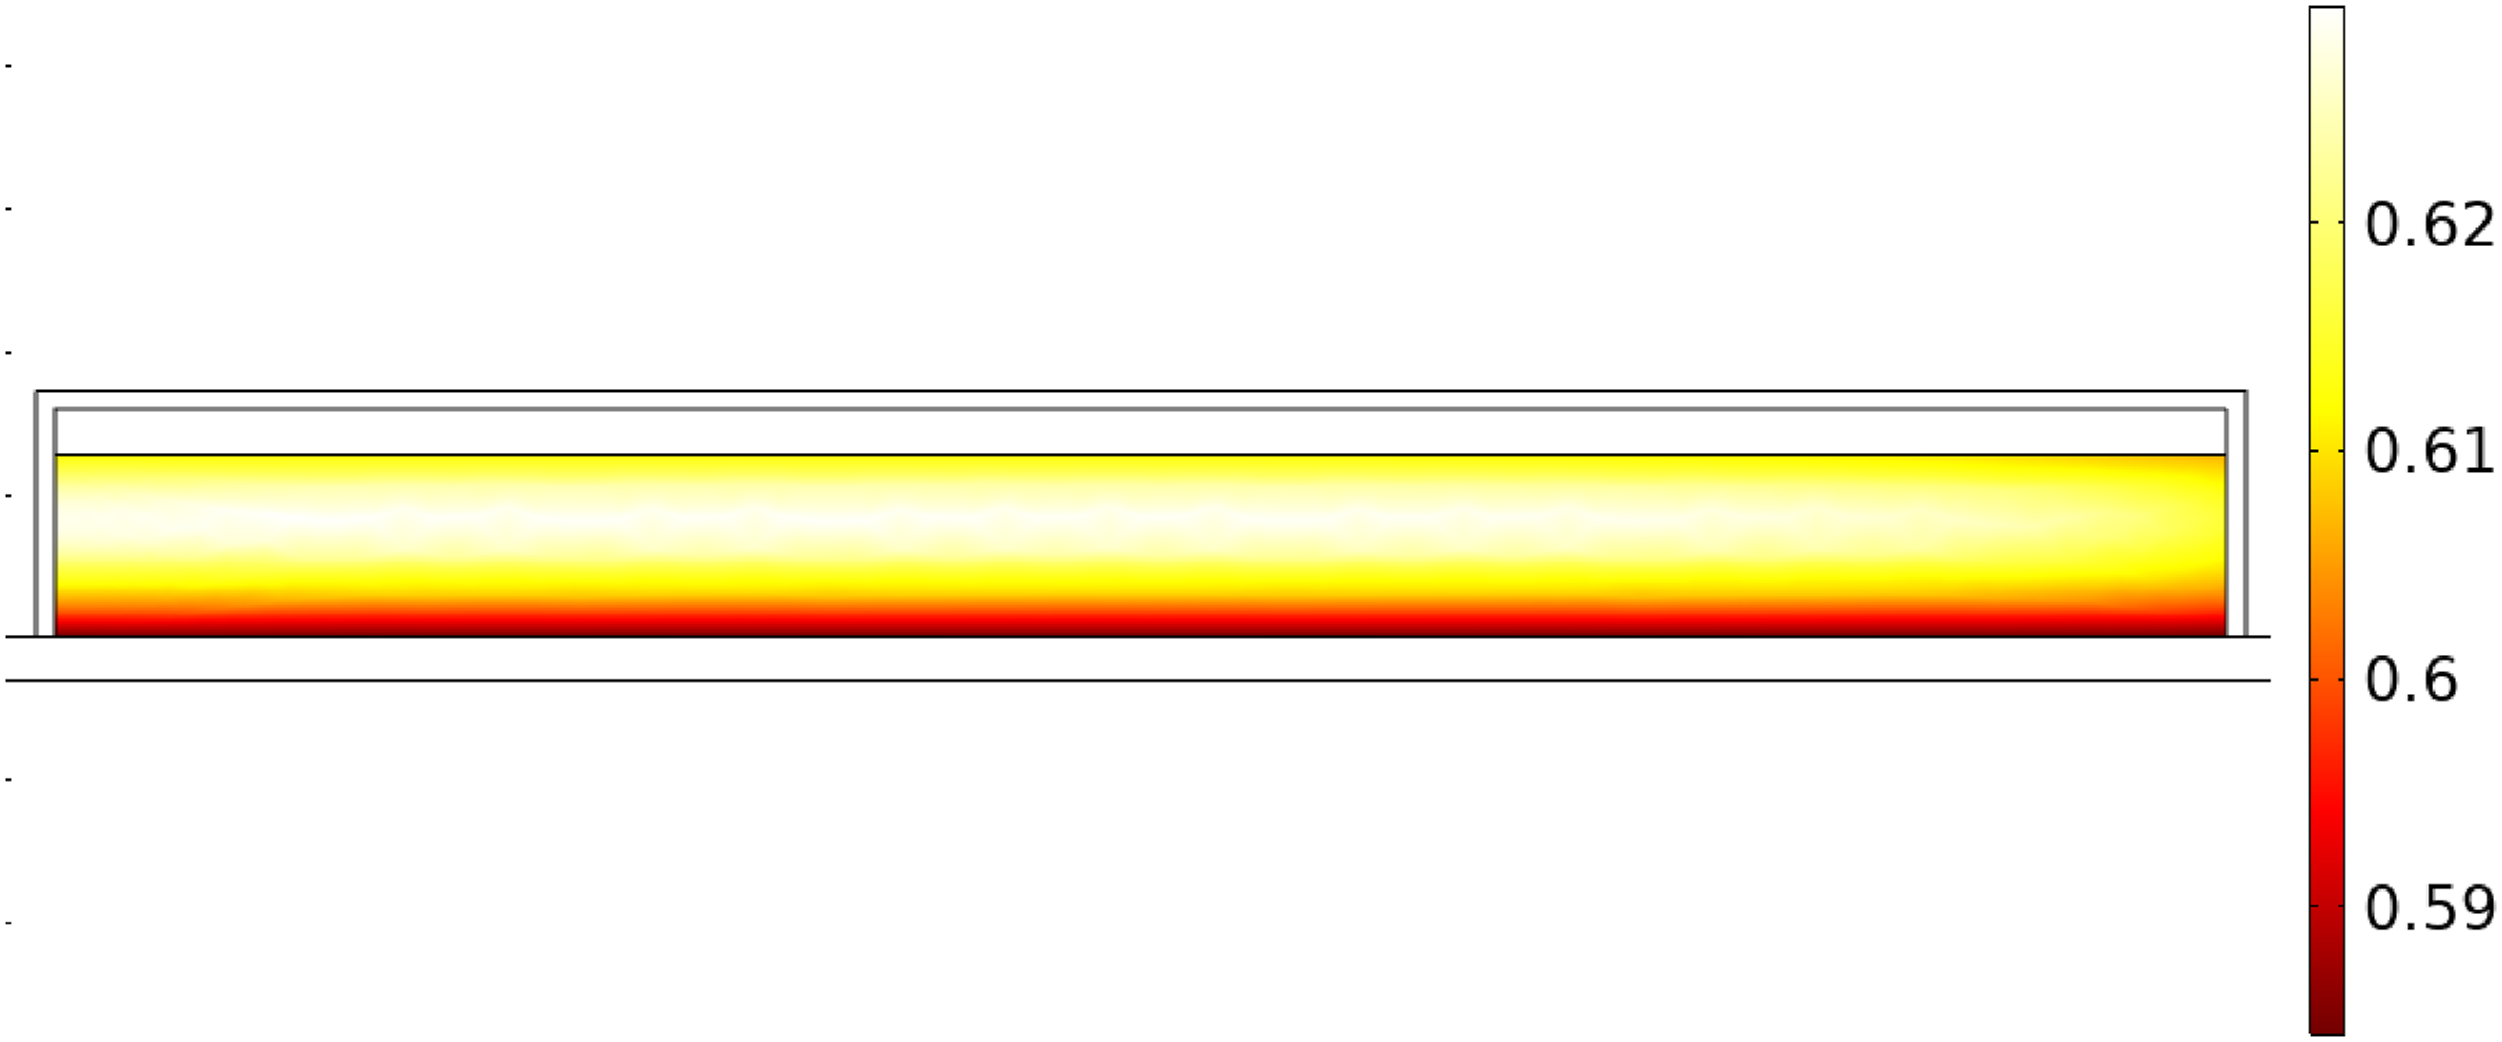

Figure 18 shows the DOC evolution in the prepreg after 350 min into the curing simulation at the bottom of the laminate. The simulation uses the experimental temperature evolution measured on the top of the prepreg layup (Figure 4) as an input. Since the temperature is always less at the center compared to other regions on the layup, the DOC is comparatively less at the center than in other regions. Figure 19 shows the temperature evolution at three different regions on the prepreg compared to the reference cure cycle. Each TC represents the thermocouple regions used in manufacturing Panel 1. It is observed that there is a thermal spike due to the exothermic nature of the curing process during the base curing stage. Figure 20 shows the DOC evolution at the same three locations on the laminate during the curing process. All three locations are at about 95 % DOC at the end of post-curing. Degree of cure distribution at base of the laminate after 350 min into the cure cycle. Temperature evolution at the prepreg surface from simulation (TC1, TC4 and TC6 are thermocouple locations corresponding to experiments). Degree of cure evolution at the prepreg surface from simulation (TC1, TC4, and TC6 are thermocouple locations corresponding to experiments).


CFD 3D-Model
The temperature profiles at the TC4 location predicted by both of the selected turbulence models are shown in Figure 21. The figure shows very identical profiles; therefore, the SST k‒ω model was considered from here on. SST k‒ω and k‒ε models prediction comparison of the gas temperature profile at TC4 position.
Figure 22 shows the comparison between experimental thermocouples readings and simulation results. In general, the predicted curing temperature profiles agree well at low temperatures and start to slightly deviate as the temperature increases. All predicted thermocouple temperatures almost overlap and locate within a range of less than 1 K at each timestep. Also, when changing from the heating stages to the holding stages, the CFD results failed to follow the smooth transition of the measured profiles. The reason for predicted thermocouple temperature profiles located within a tight range and having sharp transitions between stages is attributed to that the CFD model was set to monitor the temperature distribution of the gas just above the thermocouples and not through the solid walls (i.e., no conjugate heat transfer was considered). If solid walls such as the table, mold, and composite layup were considered, the thermal inertia of these materials would result in closer predicted thermocouples temperature profiles to the experimental results. The heat transfer through the solid materials and the cure kinetics were considered in the multiphysics COMSOL model, so they were omitted from the CFD turbulence model. Also, since holding stages (satisfactorily predicted by CFD) are responsible for most of the curing of the composite, the deviation from the experimental results at the end of ramping stage is of less concern. Comparison between experimental and CFD simulation thermocouple temperature profiles.
The temperature distribution near the surface of the composite panels at different instants is illustrated in Figure 23. Figures 23(a) to (c) were calculated at the second heating stage, second holding stage, and third heating (i.e., post-curing) stage at inlet temperatures of 381.62 K, 395 K, and 433.98 K, respectively. A small gas temperature variation of less than 0.1 K is observed at each instant. The temperature inhomogeneity near the panels’ surfaces was observed the highest at the post-curing stage. This agrees with the experiment and multiphysics model. Gas temperature distribution near panels during (a) the second heating stage at 381.62 K, (b) the second holding stage at 395 K, and (c) the third heating stage at 433.98 K inlet temperatures.
Figures 24(a), (c) and (e) show the temperature distribution at a vertical midplane during the same previous instants. The temperature differences inside the autoclave are the highest during the third heating stage, similar observation to the near composite panels’ surfaces. Also, a slightly lower temperature region is observed around the tool table and panels during the heating stages (Figure 24). During heating stages, the highest temperature region is at the center where the annular hotter entering flow meets and travels downstream toward the output. The flow domain is more homogenous during the holding stage (Figure 24(c)). This is due to the long time (2 h) maintained inlet temperature. (a), (c), (e) temperature distribution, and (b), (d), and (f) turbulence intensity distribution across Midplane during different stages of the curing cycle.
Figures 24(b), (d) and 24(f) are the turbulence intensity across the vertical midplane. The regions with reddish color indicate the high turbulence intensity. The high turbulence intensity flow close to the panels coincides with the hotter spots near the composite panels’ surfaces. The intense turbulence enhances the transverse momentum transport between the flow layers and the heat transfer between the gas and the panels’ surfaces.29,30
Figure 25 shows the velocity vector magnitude at the midplane. The flow at the center travels directly toward the exit fan and has the highest speed. A slower flow between the center line and walls circulates as indicated by regions A and B. The flow under the tooling table is the slowest and coolest compared to the flow at the center. This contributes to less heat transfer between the gas and the table and composite panels. This causes uneven curing as indicated in Figure 16. Adjusting table orientation and position will improve the heat transfer at this region. This was also suggested in Ref 19 Velocity vector magnitude at the midplane.
Conclusion
This study aims to provide a better understanding of flow patterns, temperature distribution, and degree of curing evolution around/in composite parts manufactured inside an autoclave. Uniform temperature distribution leads to an even curing throughout the part. Consequently, a robust part with enhanced mechanical properties is produced. Based on the observations, the study also provides some practical implications to improve the curing performance and part quality. Experiments, a multiphysics model, and a CFD model were developed to fulfill the goals of this study. The results produced by the numerical models satisfactorily agreed with the experimental results. It was observed that all TCs temperature measurements were less than the reference temperature during the curing stages. The highest temperature deviation from the reference temperature was always at the center of the layup surface for all stages. This was attributed to the lower inplane conductive heat transfer than the other thermocouples located closer to the panel edges. The temperature deviation of the layup surface and nearby gas was more pronounced during the post-curing stage. The variation between the TCS temperatures was less on the surface of Panel 2 due to the more uniform flow velocity. Gas temperature uniformity slightly improved during the holding stages compared to the heating stages. The DOC uniformity was influenced by three factors (I) thermal spike due to inherent exothermic reactions during base cure cycle (II) uneven gas temperature due to flow pattern inside the autoclave, and (III) variation in heat transfer between the gas and composite panels caused by the tooling and composite configuration. The thermal spike causes faster curing at the midplane of the panel. Uneven gas temperature and heat transfer cause variation in the DOC at any given plane of a composite panel. Variation in heat transfer also leads to the panel bottom surface having the least DOC. The thermal spik is inevitable but post-curing decreases the DOC variation. The potential to improve the uniformity of gas temperature and heat transfer is possible by altering the configuration of the autoclave and the setup of tooling and layup as described in the Practical Implication section.
Practical implications
• Regions close to the entrance and exit fan have more temperature variation due to the increased turbulence intensity and non-uniform flow profile. Thus, placing the part at regions of uniform turbulence intensity away from the entrance and exit will improve part temperature distribution and DOC uniformity. • The flow at the autoclave center is more uniform compared to the sides where flow circulates. Also, flow is slower under the tooling table and panels which hinders heat transfer between the gas and the mold and part. Repositioning and orienting the tooling table to a higher level close to the autoclave center will likely accelerate the underneath flow and improve heat transfer at this region. • Allowing equal flow velocity near all sides of the panels will improve DOC uniformity. This can be done by introducing flow channels or lattice structures on the tooling table and mold. • Placing a caul plate at the top of the composite panel decreases the difference in heat transfer between the upper and lower surfaces of the panels. • Post-curing is highly recommended to improve the degree of curing. • Flow inside the autoclave inherently exhibits variation in turbulence intensity due to the autoclave configuration and geometry. This variant turbulence cause uneven heat transfer. It is likely introducing an upstream porous/lattice structure will improve the uniformity of flow turbulence and heat transfer between the gas and part.
Footnotes
Declaration of conflicting interests
The author(s) declared no potential conflicts of interest with respect to the research, authorship, and/or publication of this article.
Funding
The author(s) received no financial support for the research, authorship, and/or publication of this article.
Data availability statement
The data that support the findings of this study are available from the corresponding author upon reasonable request.