
Abstract
Fatigue analysis and life prediction are the key and challenging issues in the mechanics research of composite material. In this paper, based on the progressive damage analysis method and fatigue cumulative damage theory, a three-dimensional fatigue cumulative damage numerical model is constructed by introducing the orthotropic constitutive equation, 3D-Hashin fatigue criterion, and material performance degradation scheme. Two loading conditions of tension–tension fatigue and compression–compression fatigue of Carbon Fiber composite laminates were investigated. In the tension–tension fatigue experiments, when the cycle is
Introduction
In comparison to traditional metallic materials, composite materials exhibit favorable fatigue resistance. However, composite materials possess anisotropic properties and exhibit diverse ply configurations, which leads to a more complex failure mechanism of fatigue cumulative damage. Fatigue damage in composite materials, such as fiber fracture, interfacial debonding, and matrix degradation, mutually induce and couple with each other, posing challenges in assessing fatigue life.1,2 At present, a small allowable value is usually given in the design of composite structural parts, and the use is relatively conservative, which fails to give full play to the weight-reducing performance of composite materials. In recent aircraft designs, composite structural parts are transitioning from secondary load-bearing parts to primary load-carrying parts, and their fatigue life and durability problems have become more prominent.
Research on composite material fatigue life can be categorized into three types: fatigue life models, phenomenological models for residual strength/residual stiffness, and progressive damage models for fatigue.3,4 Despite the distinct characteristics of fatigue performance between composite materials and metals, fatigue behavior of composite materials can still be described using S-N curves. The variables of the model mainly include: stress level, stress mean value, stress ratio, laminate stiffness, and lay-up method.
Hashin 5 established a criterion that can identify fatigue damage, and this criterion can better identify two modes of fiber fatigue and matrix fatigue. Reifsunide 6 adopted the Mori-Tanaka method, and the stress field of the composite material was calculated using the average stress formula, and then the corresponding fatigue criterion was constructed, which can identify the interface and the performance of the corresponding components from the perspective of mesomechanics. Gathercole 7 systematically studied the fatigue problem of composite materials and constructed a corresponding fatigue life model. The model introduced the fatigue stress amplitude and stress mean value, and finally gave the expression of the equal-life model, and related parameters explained. Philippidis et al. 8 established a fatigue criterion capable of identifying fatigue failure under multiaxial loading conditions, which bears resemblance to the Tsai-Wu criterion under static loading. Kawai 9 investigated axial and off-axis experiments on the off-axis fatigue life of plain fabric composite laminates at room temperature and 100°C. The stress ratio was 0.1, and the S-N curve of two test conditions was obtained. Seyhan 10 conducted tension–tension fatigue tests on bidirectional woven E-glass fiber composite materials and established a mathematical model for probabilistic fatigue life distribution using the Weibull distribution. The tests were performed under three different stress levels and a stress ratio of 0.1, and the probability of fatigue failure at various stress levels was calculated based on the probabilistic statistical model. Yang 11 investigated the vibration fatigue behavior of aeroengine blades through experiments. The vibration mode diagram of the composite material blade is measured to obtain the region with the largest vibration stress distribution, which is also the weakest part of fatigue. The fatigue damage is monitored according to the change of the natural frequency of the component. Guo 12 conducted experimental research on the tension–tension fatigue characteristics of adhesive-bonded composite structures and obtained a fatigue prediction model by fitting the S-N curve. The experimental results demonstrated a nonlinear decrease in adhesive stiffness with an increasing number of fatigue cycles.
In the realm of residual strength and residual stiffness modeling, Broutman and Sahu 13 developed a linear residual strength model, which postulates that the material’s residual strength exhibits a linear decrease with the accumulation of fatigue cycles in the structural load. Schaff and Davidson 14 further refined and optimized the aforementioned linear model. For variable-amplitude fatigue loads, Yao and Himmel15,16 devised a fatigue life prediction method based on the theories of strength degradation and cumulative damage. Stojkovic 17 proposed a two-parameter strength degradation model under equal-amplitude spectral loading, which requires a small experiment to fit the parameters of the model. Philippidis and Vassilopoulos 18 found that the modulus E(n) of the laminate has a linear relationship with the number of loading cycles according to the fatigue experiments of composite materials. Liu 19 established a two-parameter model of stiffness degradation, which offers improved characterization of the three stages of fatigue damage evolution.
In the domain of progressive damage analysis models, the characterization of fatigue progressive damage differs from that of residual strength and residual stiffness models. It involves the introduction of damage variables to simulate the comprehensive process of damage accumulation in composite materials subjected to fatigue loads. Shokrieh 20 et al. established the progressive fatigue cumulative damage theory of composite materials. This model can be divided into three major sections: fatigue failure assessment, material performance degradation, and stress analysis. The stress analysis module primarily relies on finite element software, such as utilizing three-dimensional solid elements in Abaqus for stress analysis. The fatigue failure assessment module introduces seven fatigue failure modes through subroutines: fiber compression and tension failure, interlayer compression and tension failure, matrix–fiber shear failure, matrix compression, and tension failure. Adam 21 et al. proposed a residual strength and residual stiffness model applicable to any stress state and stress ratio for individual unidirectional plies. Beheshty 22 et al. normalized the fatigue test data to establish an equivalent model of fatigue life, which is applicable to any stress level and stress ratio. Wang 23 conducted extensive static strength and fatigue experiments on unidirectional laminates and fitted model parameters for fatigue life calculation based on the experimental results. Feng 24 employed a mesoscale unit cell model of three-dimensional braided composites and defined fiber bundle and matrix damage within the Umat subroutine of Abaqus. The results show that the fatigue damage first appears at the contact surface between the fiber bundle and the matrix in the unit cell, and the damage begins to spread from the surface and inside of the fiber bundle, and the damage mode is in good agreement with the experiment.
Regarding the fatigue monitoring of composite materials using frequency-based techniques, Abo-Elkhier 25 et al. conducted bending experiments on glass fiber laminates while simultaneously performing modal tests. The findings revealed a correlation between the changes in modal parameters and the fatigue state of composite structures, thereby providing novel approaches for composite material evaluation. By combining modal parameters such as natural frequency and damping ratio with fatigue life, fitting curves were derived, enabling the monitoring of structural fatigue life through modal parameter variations. Liao 26 et al. obtained the frequency attenuation curve of structural components under fatigue loads by initially establishing a fatigue calculation model and conducting modal analysis, thereby deriving the stiffness values at specific cycle counts. Subsequently, an artificial neural network was introduced to predict the fatigue life of glass fiber composites. Angela 27 et al. analyzed the material performance degradation and delamination damage of composite materials under fatigue load, and found that matrix damage and strength reduction will lead to the spread of lamellar damage. Angela 28 et al. discussed the development of the Smart Time XB method and predicts the evolution of delamination damage in composite structures. Angela 29 et al. verified the correctness of the model by introducing only cycle hopping strategy and taking composite laminates as the research object. Malekinejad 30 et al. summarized the failure behavior of composites, including the properties of joints and the material mechanics behavior of bonding. Bhowmik 31 et al. summarized the influence of loading conditions, machinery, and wear on fatigue behavior of natural fiber polymer composites.
Considering the complexity and importance of fatigue damage and life prediction of composite materials, it is of great significance to stud of composite materials under fatigue loads for the reliability design of composite structural parts. This paper first establishes a numerical model that can predict the stiffness and strength degradation process of composite materials under fatigue loads and evaluate the fatigue life. Furthermore, various failure modes of composite materials under fatigue loads are comprehensively considered. The fatigue life of composite materials under tension-tension fatigue and compression–compression fatigue conditions is studied, and the mechanical properties and failure laws under fatigue loads are revealed. Finally, the stiffness attenuation and frequency of the material under fatigue load are combined to obtain the frequency attenuation curve under fatigue load, which is of great significance for the health monitoring of structures in actual engineering and the prediction of remaining fatigue life through the decline rate of natural frequencies.
Theory of fatigue life of composite materials
Fatigue failure criterion
With the degradation of unit stiffness and strength, various damages will occur inside the composite material, so it is necessary to define a suitable failure criterion to identify fatigue damage. Considering the various failure modes that may occur in composite materials under fatigue loads, the fatigue judgment criteria 32 for the failure modes selected in this paper are as follows:
Fiber compression fatigue failure criteria (
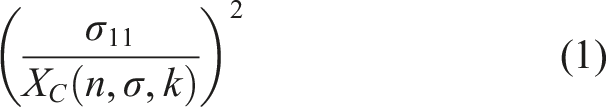
Fiber tensile fatigue failure criteria (

Matrix-fiber shear fatigue failure criterion (

Matrix tensile fatigue failure criterion (
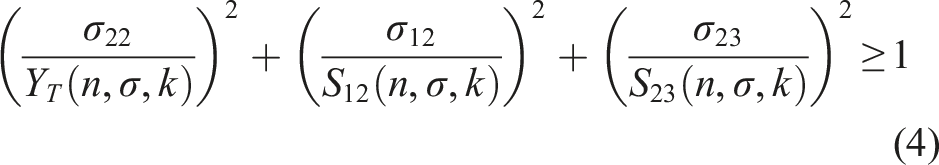
Matrix extrusion fatigue failure criterion (

Delamination Tensile Fatigue Failure Criterion (

Delamination Compressive Fatigue Failure Criterion (

When a composite material component fails, the number of cycles corresponding to the material is the ultimate fatigue life of the composite material. Considering that the fiber is the main load-bearing part of the composite material structure, when the fiber damaged unit extends to the edges of both sides of the composite laminate along the vertical load direction, it is determined that the overall fatigue failure of the composite material occurs.33,34
Residual strength and residual stiffness model
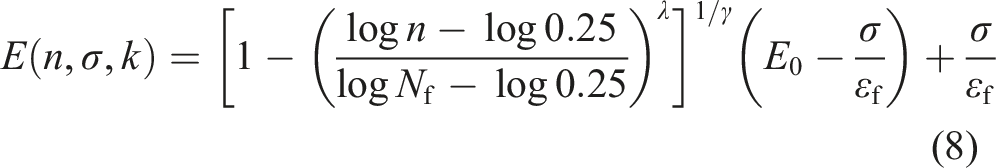
Under the fatigue load, the stiffness and strength of the composite material will gradually degrade, and the expression of the residual stiffness degradation model
20
is as follows:
The expression of the residual strength degradation model
16
is as follows:

Sudden drop scheme of composite material stiffness.

Equal-life model
In the general research of life model, if the fatigue performance of composite materials is described for each stress state and stress ratio, a large number of experiments need to be carried out. In order to make the fatigue model have better applicability, the researchers introduced the life prediction model. The constant life model combined with the residual strength and residual stiffness models can avoid the limitation of using special stress ratios in the fatigue life analysis process.
The equal-life model established by Beheshty
22
can predict the fatigue life of unidirectional plates, and its longitudinal expression is as follows: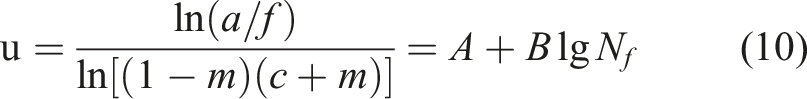
The definition of the parameters in the equivalent life expression is as follows:
For the life model in the transverse direction of the matrix, literature37–39 has improved the initial model, and the expression of the improved matrix equal-life model is as follows: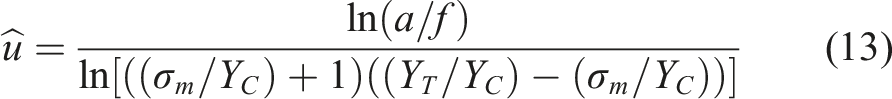
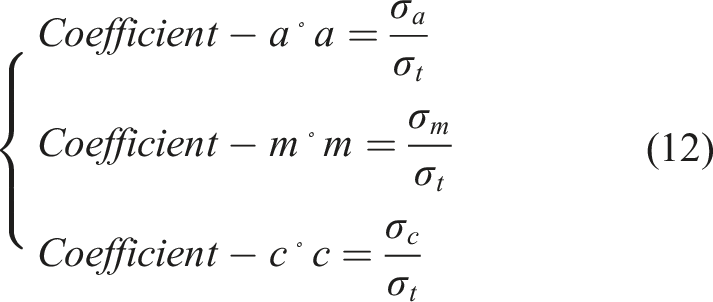
For the constant life model in the shear direction, the longitudinal and transverse constant life models have the same effect on the fatigue life in the positive and negative directions for the working conditions subjected to shear fatigue loads. Thus it is not necessary to define the ratio of compressive strength to tensile strength in equation (10). Therefore, for unidirectional laminates, in the fatigue life model under shear fatigue load c = 1, the modified expression is as follows:

Fatigue finite element model and modal analysis
The fatigue and modal calculation process of composite materials is shown in Figure 1. When the progressive degradation of strength and stiffness under fatigue load is not considered, the static strength of composite materials is obtained. First, according to the static strength calculation results, different stress levels are selected to determine the fatigue load of the model, and then on the basis of the static strength prediction. An equal-life model and a progressive degradation model of stiffness and strength of the composite material under fatigue load are introduced, and the number of fatigue cycles is continuously increased. In order to analyze the structural behavior of the component subjected to fatigue loading, this study initially determines the stiffness value of the element at a specific cycle number. Subsequently, the obtained element stiffness value, which replaces the initial material state, is incorporated into the frequency-life relationship under cyclic fatigue loading. Considering the substantial number of fatigue calculations typically involved, encompassing tens of thousands of cycles, and to ensure computational accuracy, a fatigue cycle assumption is adopted. In each fatigue cycle, only the damage and stiffness degradation occurring under the maximum fatigue load are taken into account. Thus, a two-step analysis process is established, where the first step pertains to the application of the maximum fatigue load, while the second step involves the fatigue load. Consequently, each incremental step represents a specific number of cycles. Flowchart of composite material fatigue life prediction.
In the calculation of the tensile strength of the composite material, L = 152.4 mm, B = 76.2 mm, width W = 38.1 mm, and the aperture is 6.35 mm. The layering sequence is The finite element model of composite material strength and fatigue prediction.
Mechanical property parameters of AS4/3501-6 composite materials. 41

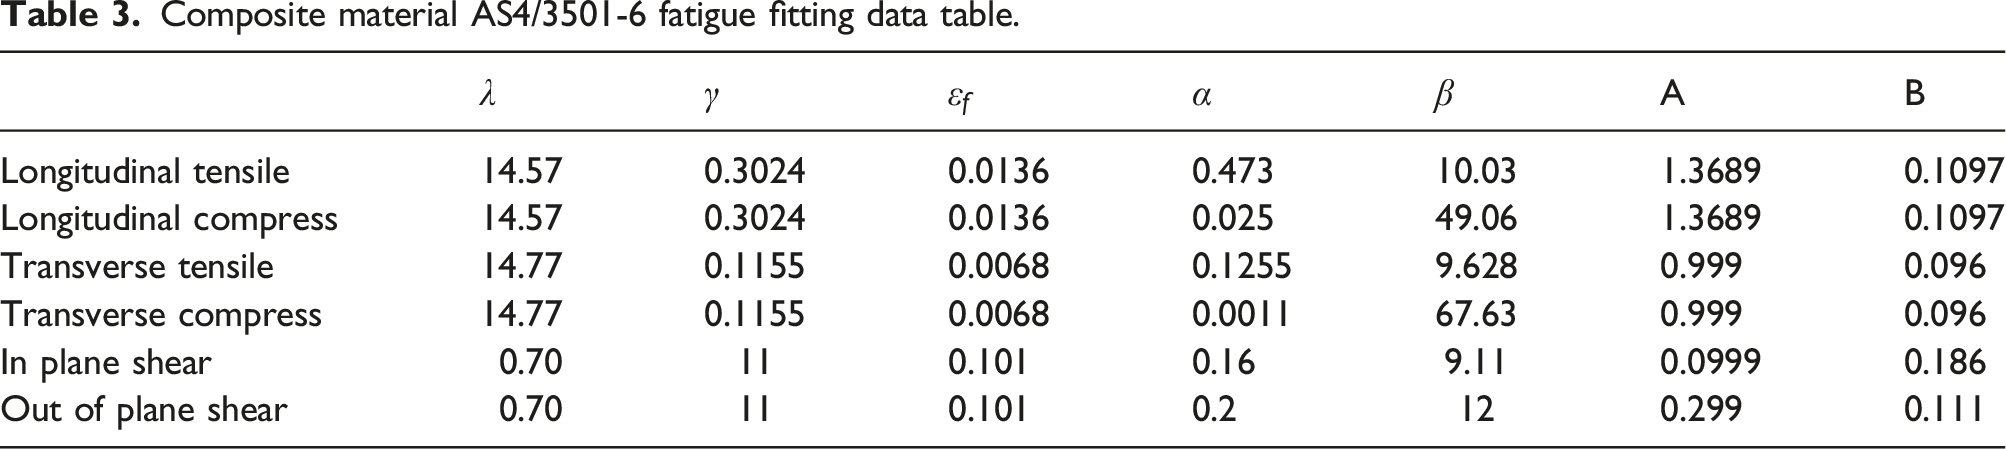
Composite material AS4/3501-6 fatigue fitting data table.
Fatigue failure modes and degradation
Damage evolution of tension-tension fatigue failure
Under the fatigue load, the composite fiber and matrix failure modes are shown in Figures 3–5. The composite tensile parts did not fail at the cycle of The tensile fatigue damage of fibers in each layer. The tensile fatigue damage of each laminated matrix. The fiber compression fatigue damage of each layer.


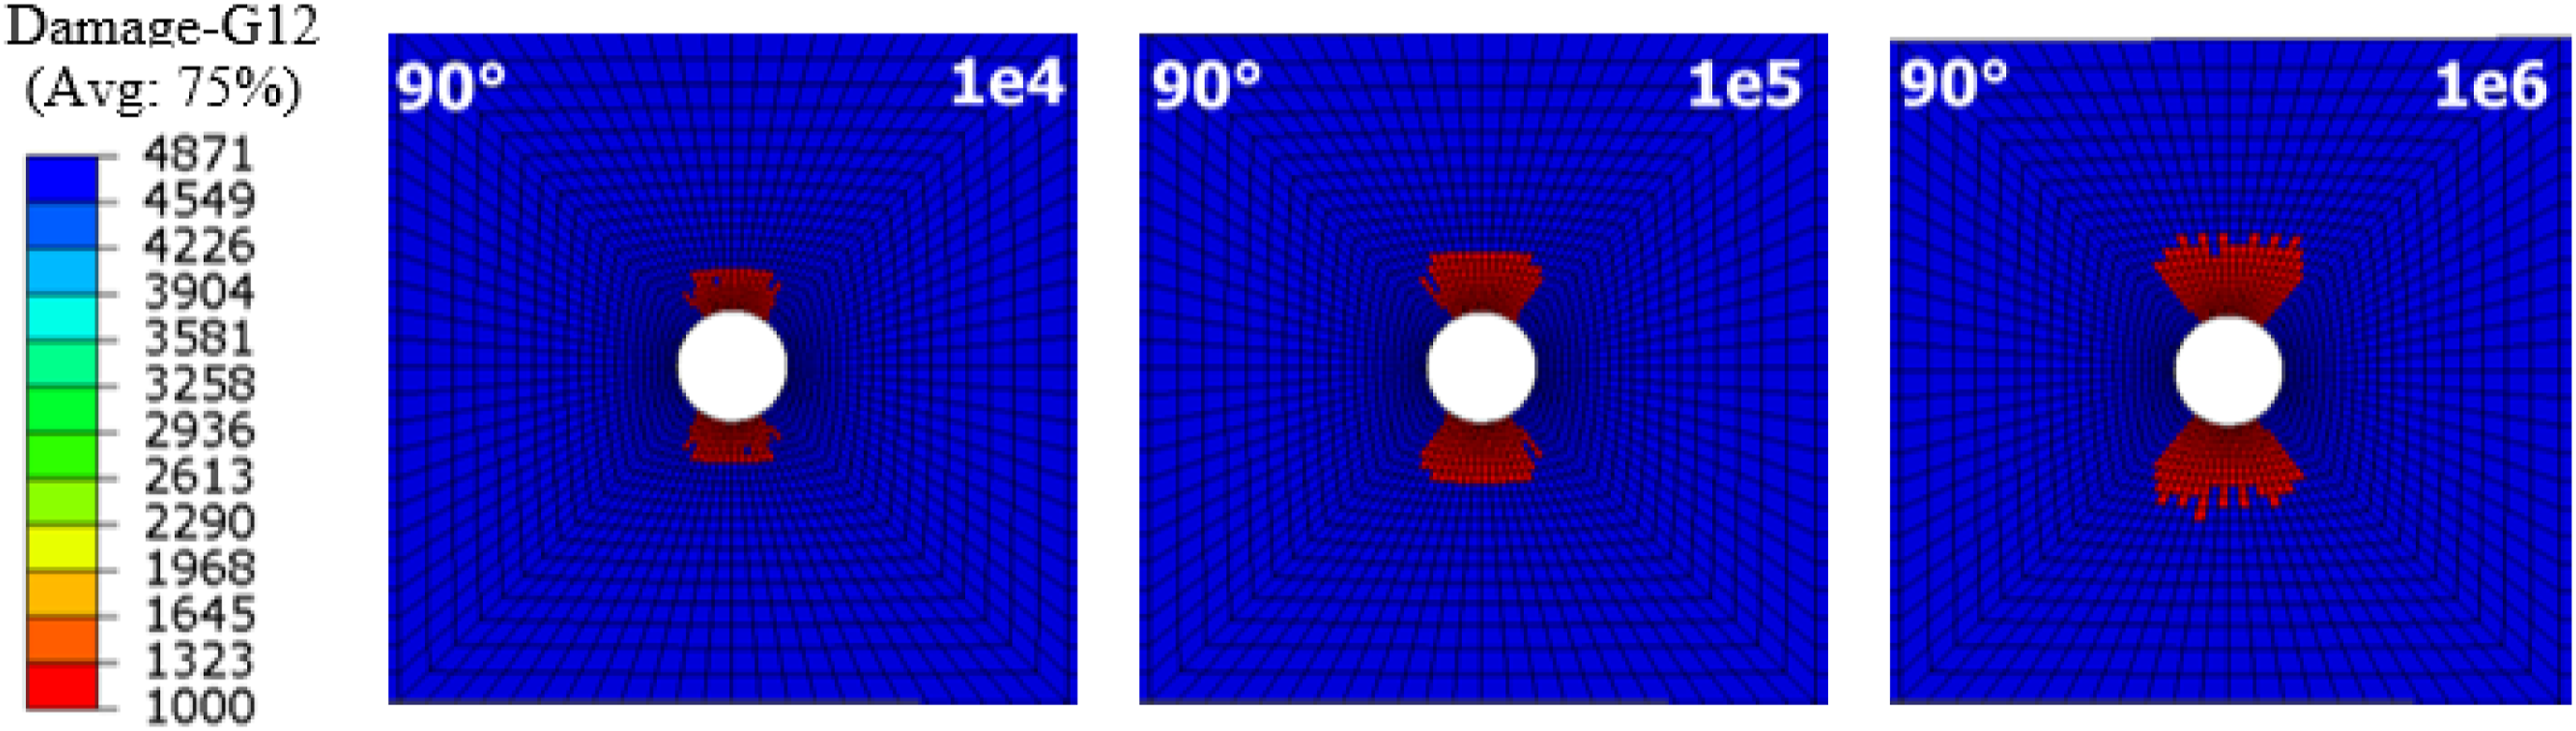
Considering Figure 6 that the strength and stiffness of the composite material will undergo gradual degradation under fatigue load, the degradation contours of the stiffness cycles of E22 and G12 under The Matrix compression fatigue damage of each layer. E22 damage degradation nephogram of G12 damage degradation nephogram of 


In order to reveal the progressive degradation process of the stiffness of the composite material under different cycles, the strength value is normalized. Figure 9 shows the Yt performance degradation process of 90° laminates at 40% stress level and different cycles. The strength degradation starts near the hole and expands to both sides of the composite laminate. Figure 10 shows the stiffness degradation process of the 90° ply at 50% stress level under different cycles. The matrix damage occurred in the ply, and its stiffness value degraded to 1000 MPa, and the stiffness value of the unfailed unit underwent gradual degradation. Yt degradation of 90° laminate under different cycle times at 40% stress level. G12 Degradation of 90° ply under different cycles at 50% stress level.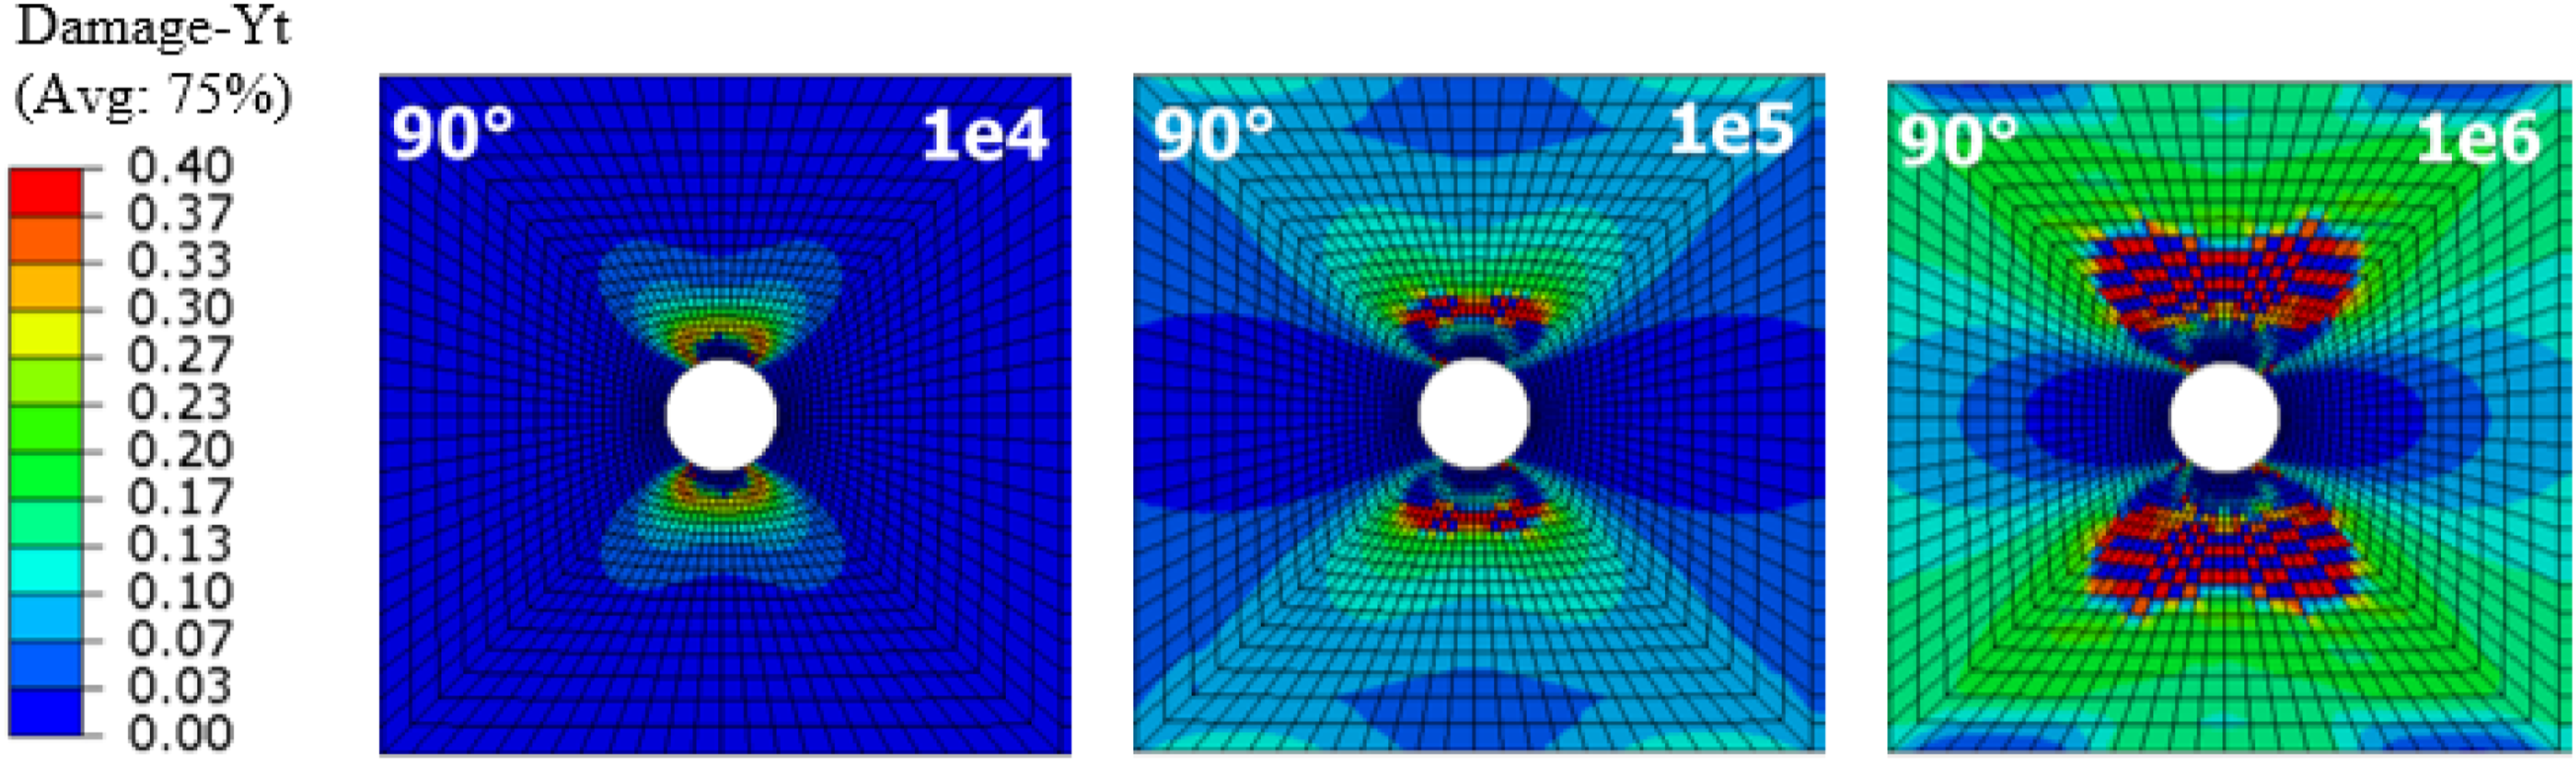
To quantify and visualize the level of damage a measure of the relative reduction in the strength parameter due to damage 
Compression–compression fatigue damage and evolution process
In this paper, 80% stress level was used to show the unit failure statistics of various failure modes in the area near the hole. First, the units of all layers near the hole are counted, and then the failure ratio of various damage units in the round hole area is obtained according to the damage mode. It can be found that the units with fatigue damage under fatigue loads are mainly matrix compression damage, followed by matrix–fiber shear damage units, and the proportion of fiber compression damage is about 20%. Considering the matrix–fiber shear fatigue criterion includes the strength degradation items of S12 and S13, the fatigue failure elements are more than fiber compression damage elements. Because the composite structure is finally crushed under the fatigue load, a small number of delaminated compression fatigue damage elements appear in Figure 11. Damage ratio of various failure modes in the hole area.
In order to study the damage evolution of composites under compressive-compressive fatigue loading, the failure modes of different plies were analyzed. Figure 12 shows the fiber compression damage and its evolution law of the 0° ply under fatigue load. There is almost no fiber tensile damage in the 0° ply under 60% stress level. With the increase of the stress level, the fiber compression damage starts near the hole and spreads to both sides of the composite laminate. At stress levels of 80% and 90%, when n/N = 0.5, a small number of fiber damage units begin to extend to the edge, the laminate structure still has a certain bearing capacity and has not been completely destroyed. When a large number of continuous fiber damage units extend to both sides of the composite laminate, fatigue damage occurs, and this cycle is the fatigue life of the composite structure. The fiber compression damage and its evolution law of the 0° ply.
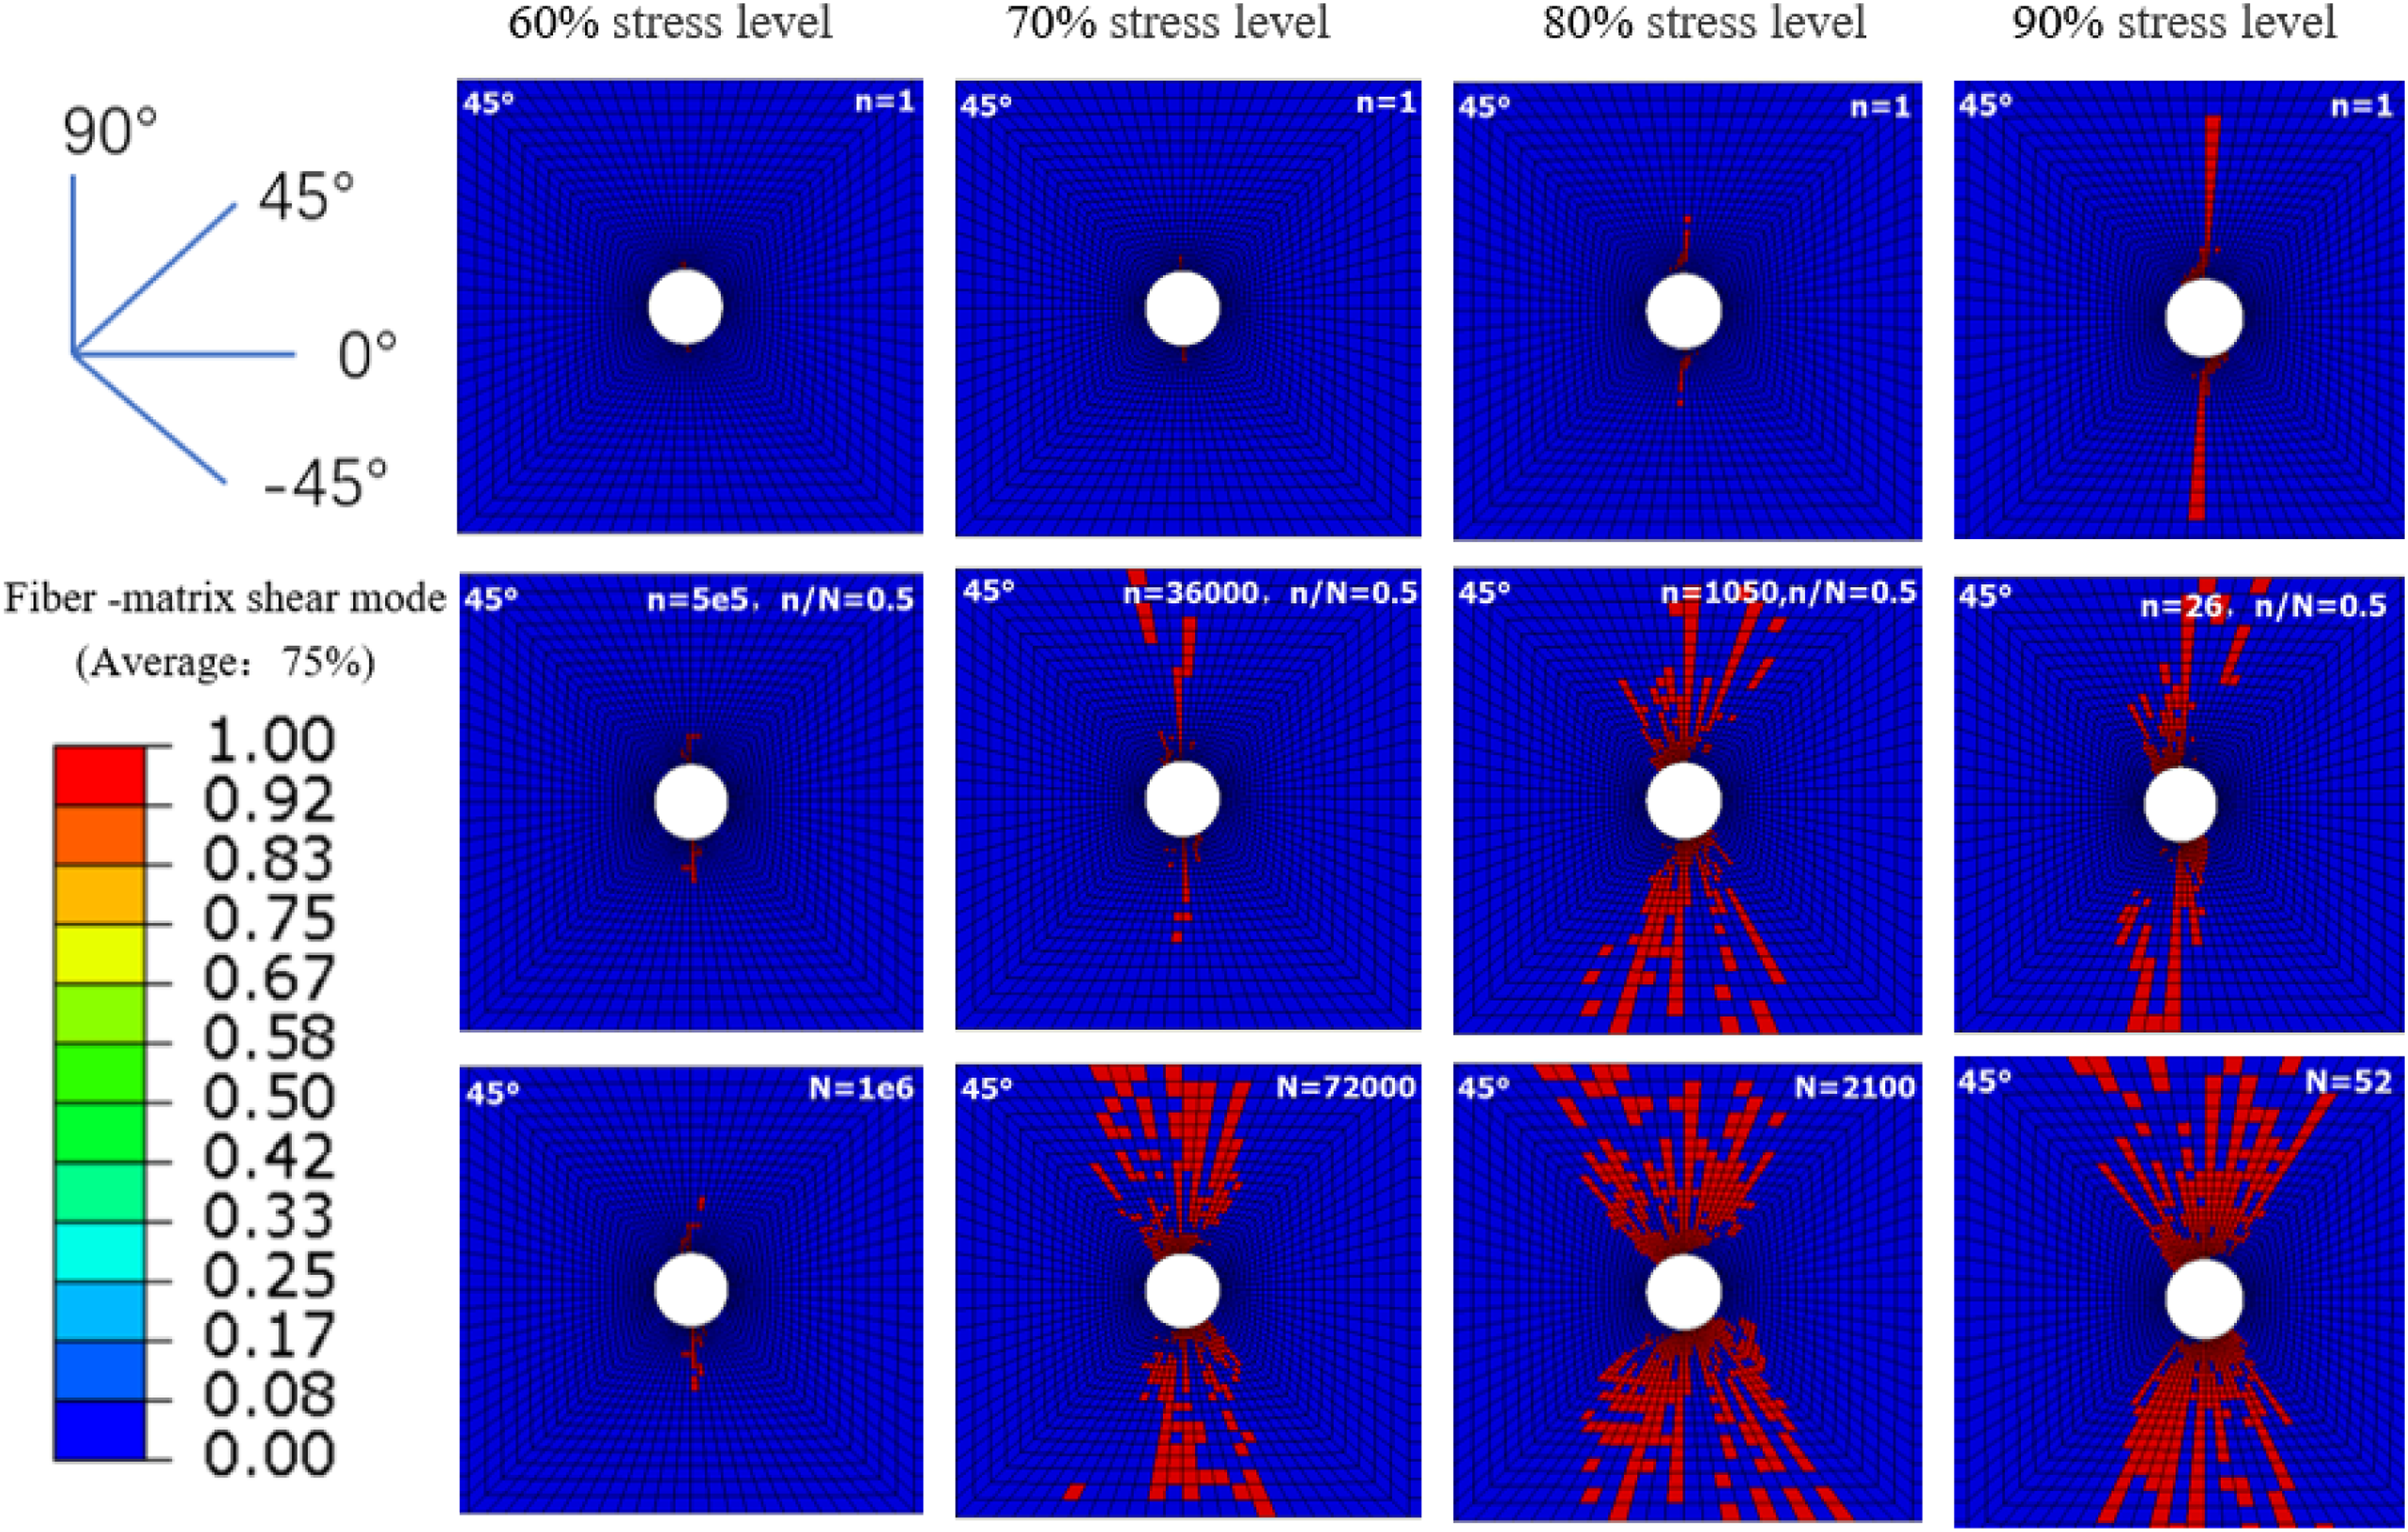
Figure 13 shows the matrix compression fatigue cumulative damage of different laminates at the 80% stress level. It can be seen that no matrix fatigue damage occurs in the 0° laminate, while the matrix damage unit of other laminates extends to both sides of the laminate. Observing Figures 12–16, it can be seen that the fiber compression damage of the 0° ply near the hole extends to both sides of the sample, which is the final fatigue failure, and a certain amount of interlaminar compression units appear in the and-45° ply. Considering that there are some differences in the final fatigue failure modes of composite laminates under different stress levels, the 0° ply units with ultimate fatigue failure at the 70% stress level are slightly lower than the units at the 80% and 90% stress levels, and interlaminar compression damage units appear. At the same time, considering the applied compressive fatigue load, the stress state did not enter the tensile failure mode or did not meet the fatigue tensile failure criterion, and no fiber tensile damage and matrix tensile damage occurred in each laminate. When fatigue failure occurs, no fiber compression damage occurs in the 90° ply. Matrix compression fatigue cumulative damage at the 80% stress level. Matrix compression damage under different cycles at 90% stress level. Cumulative damage and evolution of 45° ply matrix–fiber shear fatigue. Cumulative damage and evolution of 45° ply delamination compression fatigue.
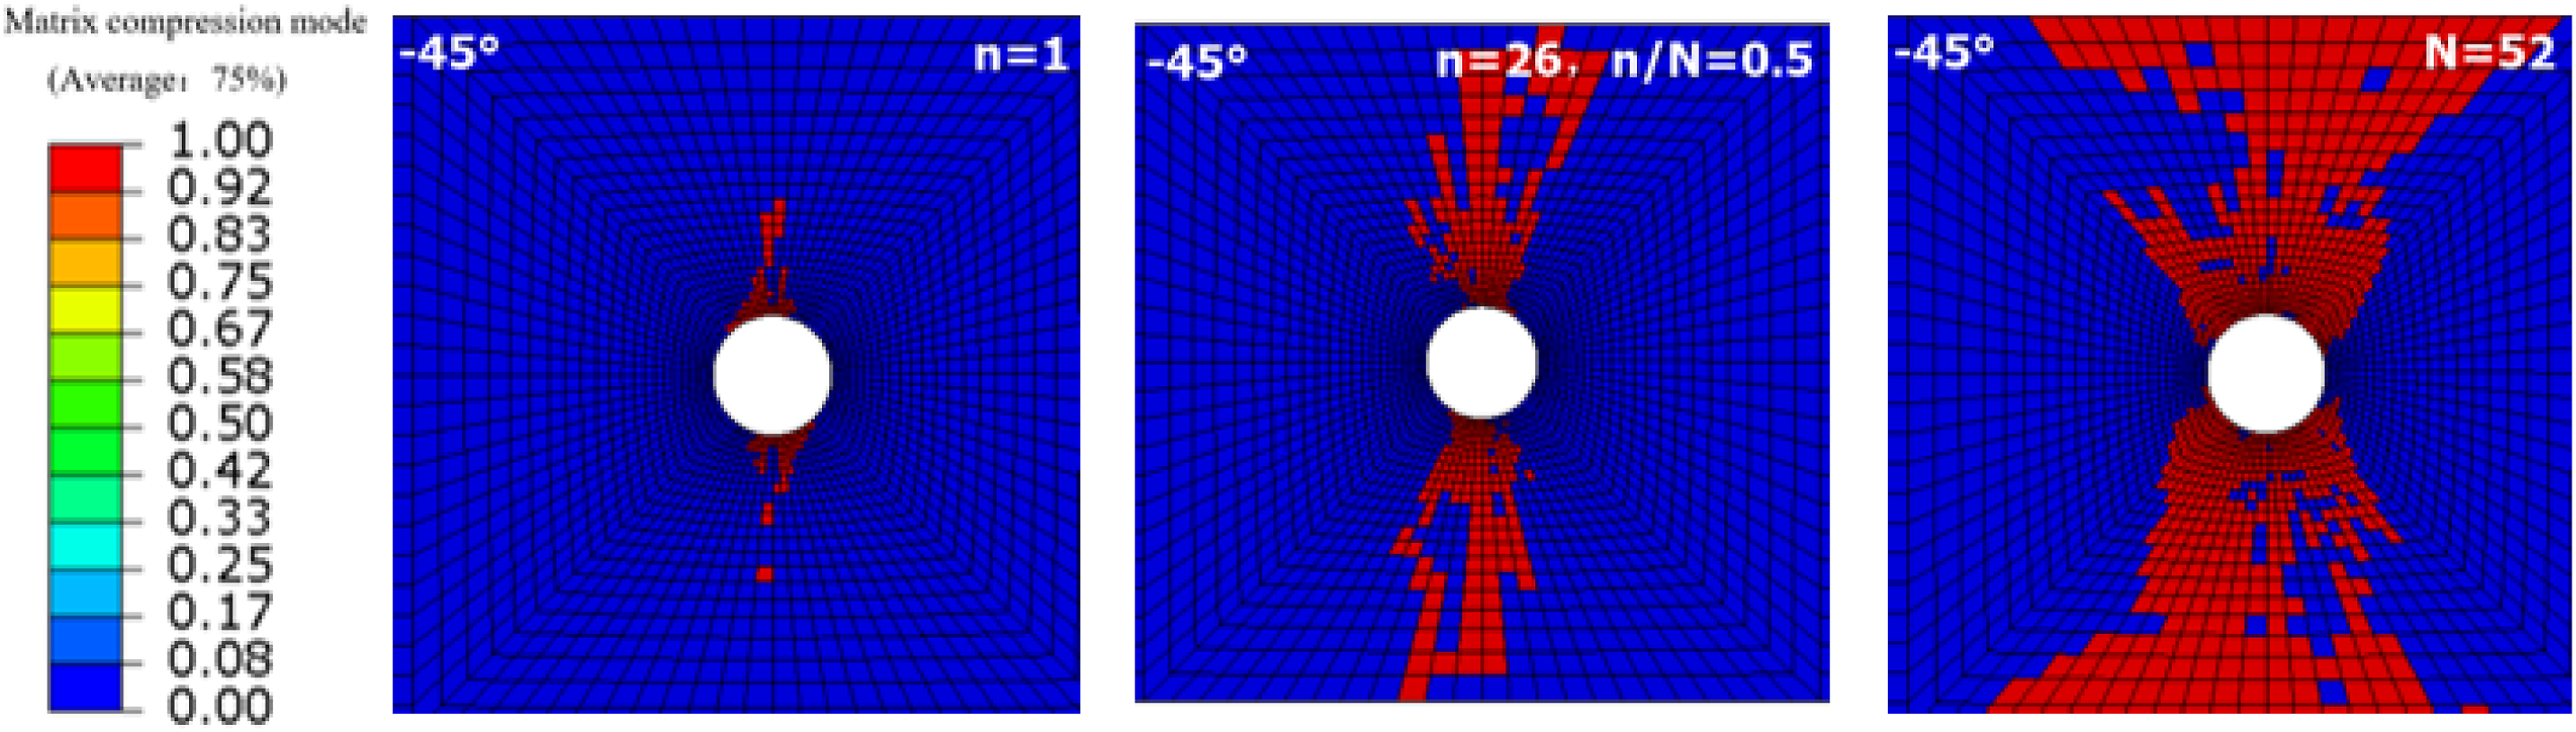

In order to reveal the cumulative damage process of the matrix compression fatigue, the −45° laminate under the 90% stress level is selected for discussion. Under high stress level, a certain amount of damage appears at the beginning, and as the number of cycles increases, the stiffness and strength of the unit are degraded. When n/N = 0.5, a small amount of matrix damage unit extends to both sides of the plate. When the structure fails, a large number of matrix compression elements expand to both sides of the plate.
Comparison of compression–compression fatigue life prediction of composite materials and experimental results in literature. 40

Comparing the composite material compression–compression fatigue S-N curve in Figure 17, it can be found that the correlation between composite material simulation and experimental curve fitting is high, and the overall error is less. Therefore, the fitted S-N curve can be used to evaluate fatigue problems under different stress levels. Compression–compression fatigue S-N curves of composite materials.
Figure 18 shows the triple error band of the average value of the compression–compression fatigue of composite materials. The three experimental values and predicted values of each group under the three stress levels are all within the triple error band, which validate the reliability of the fatigue life prediction calculation model established in this paper. Triple error band for compression–compression fatigue of composite materials.
Modal analysis at a specific number of cycles
The stiffness of the material will decrease under fatigue loading, which will change the frequency of the structure. In this paper, the stiffness value at a specific cycle is derived, and the relationship between fatigue life and frequency attenuation is established Figures 19 and 20. Firstly, the fatigue life of composite laminates is evaluated, and then the Umat subroutine is used to derive the stiffness value of the unit under the specified number of cycles. At the same time, the python script is used to make each unit have independent material parameters, and an inp file is generated. The stiffness values for the specified number of cycles are read, and the initial modes are replaced to calculate the stiffness values for the model material. Finally run the inp file to obtain the relationship between frequency attenuation and life under different cycle numbers. When performing modal analysis on composite laminates, the left end is a fixed boundary, and its first six frequencies and mode shapes are shown in Figure 21. By normalizing the frequency and life, the curve of fatigue life and frequency attenuation can be obtained. Flowchart of modal calculation for composite laminates. Calculation model for modal analysis of composite laminates. Modes and vibration shapes of composite laminates.


Tensile–tensile fatigue frequency attenuation curve
Figure 22 (a)-(e) shows the frequency attenuation under different stress levels (80%, 70%, 60%, 50%, 40% stress level respectively), it is evident that an increase in stress level leads to a more pronounced frequency attenuation. Notably, the higher-order mode exhibits greater sensitivity to fatigue damage in composite materials. In the context of the tensile test specimens subjected to fatigue loading, which showed no signs of fatigue damage, the frequency decay curve indicates that the residual frequency reaches a stable state after a certain number of cycles. Frequency attenuation diagram under different stress levels.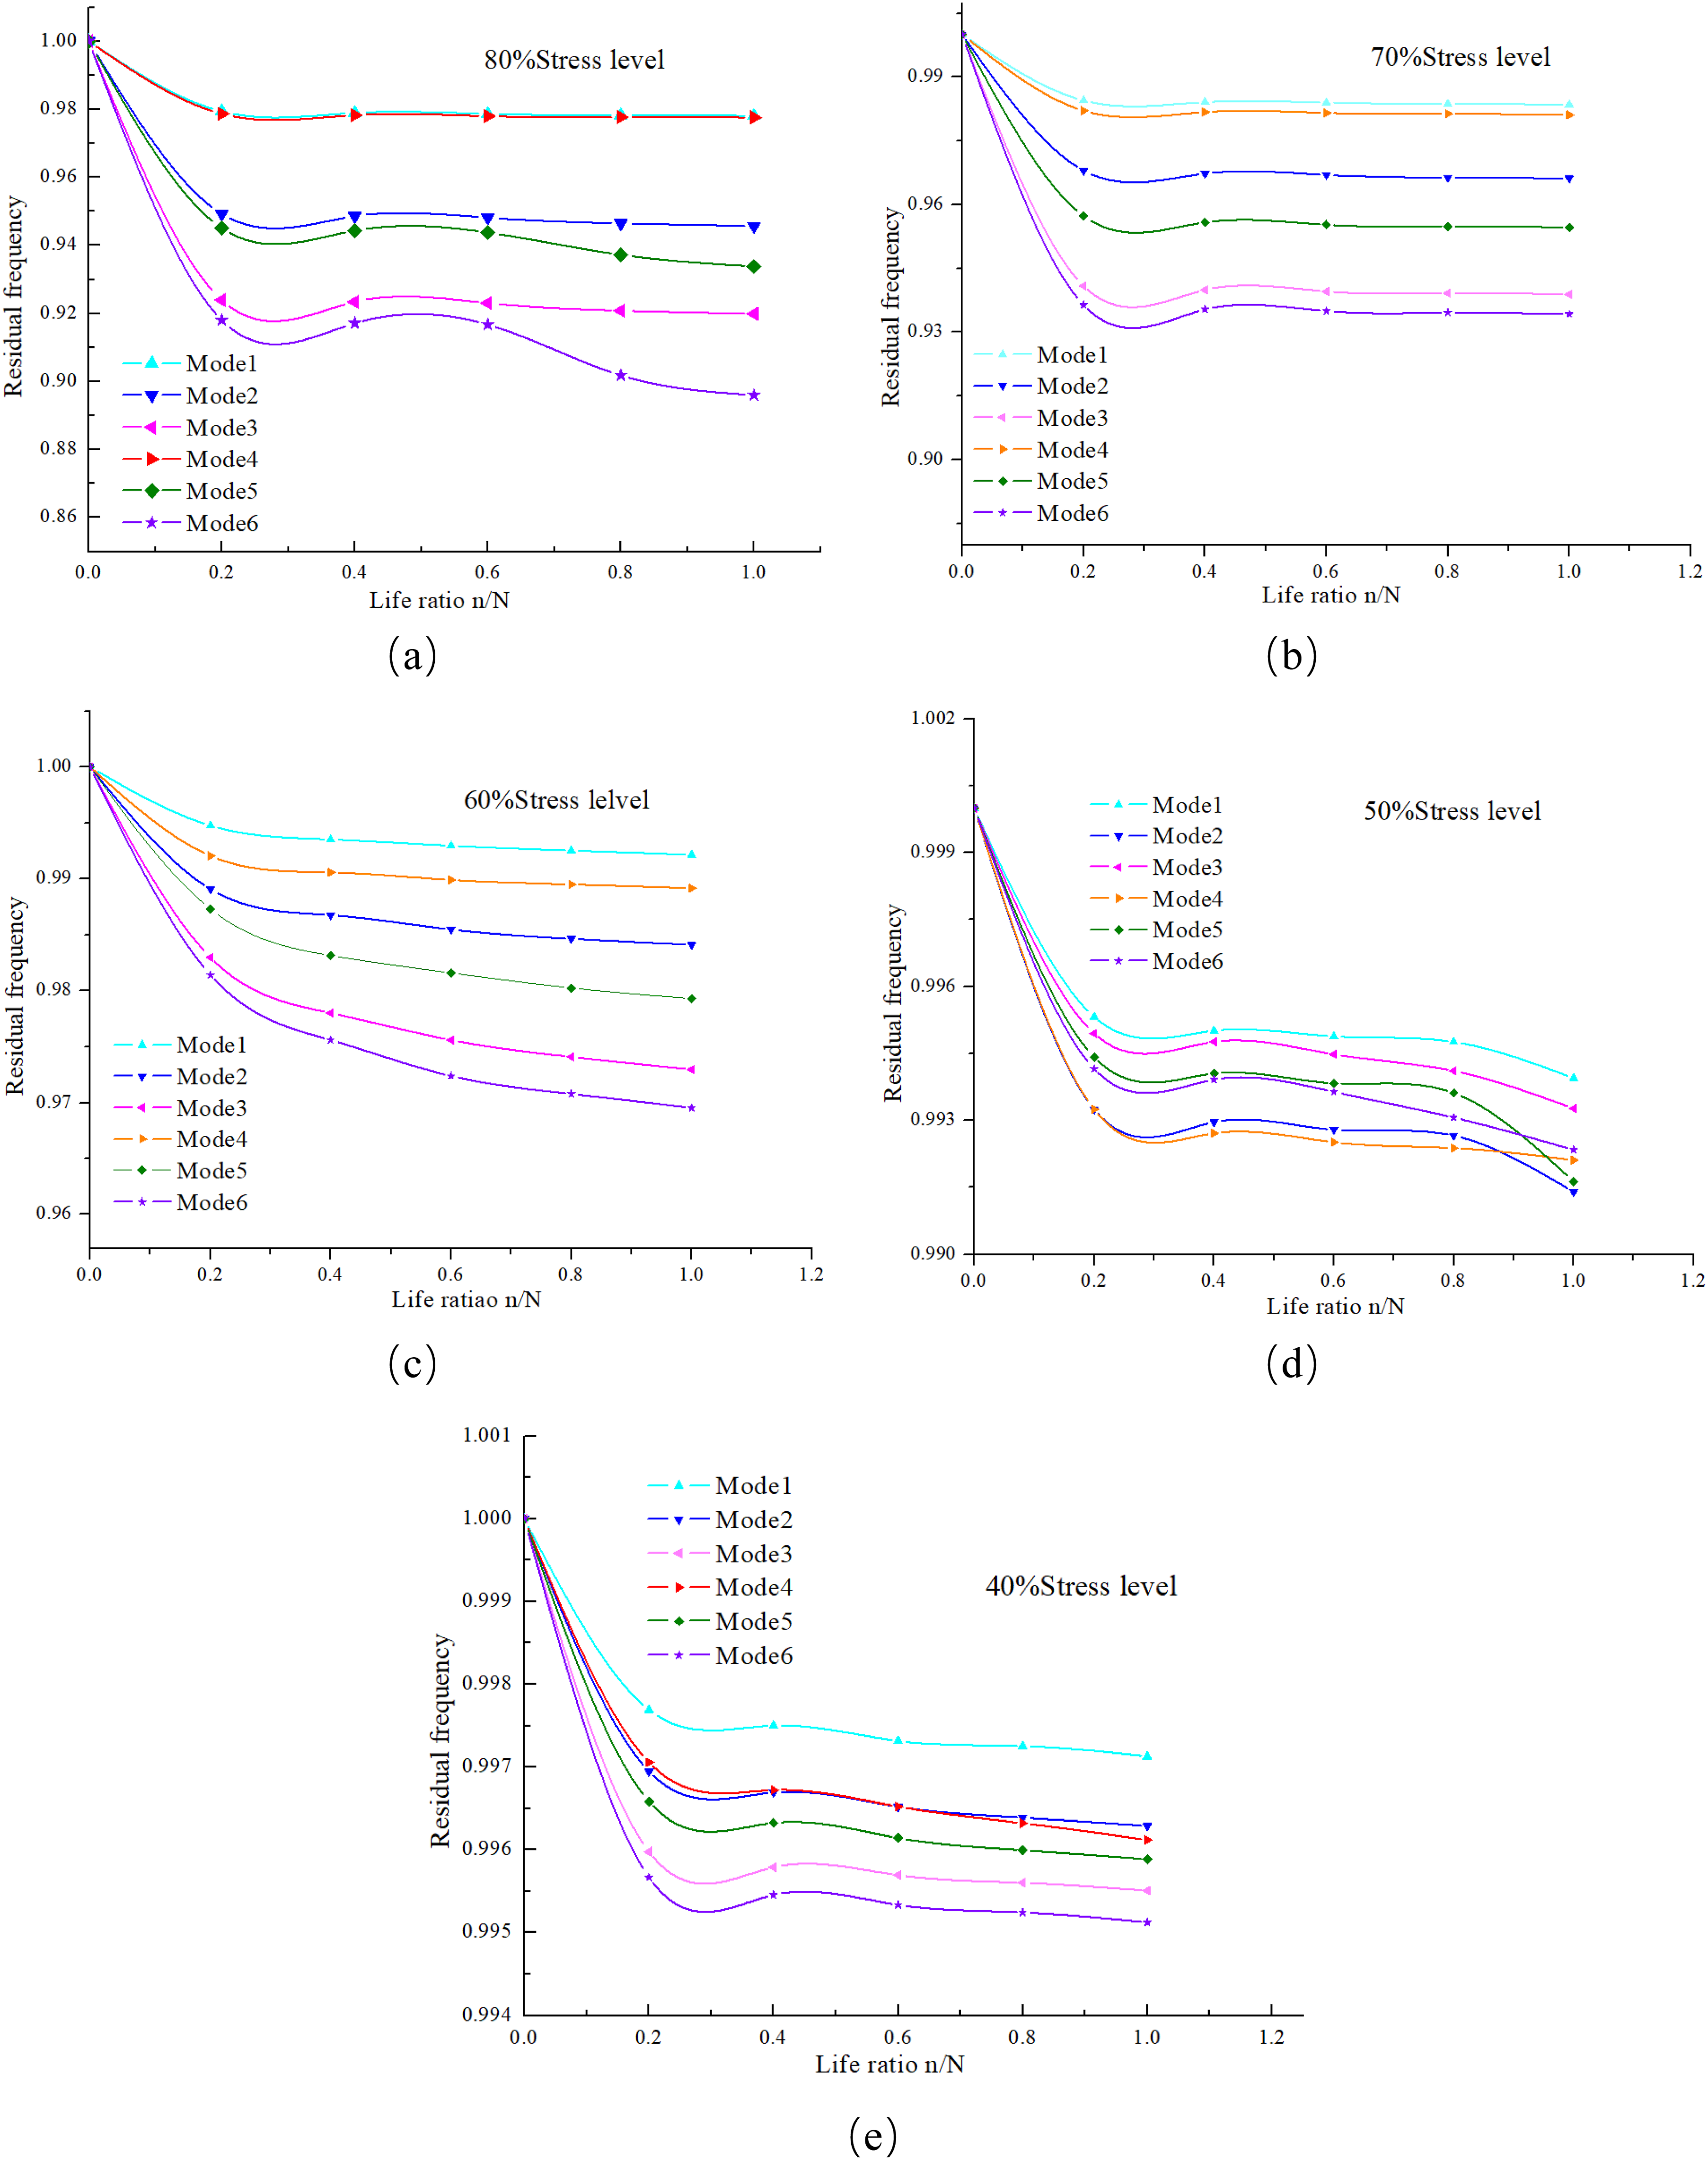
Compression–compression fatigue frequency attenuation curve
Figure 23 are the frequency attenuation life curves of composite materials under compression–compression fatigue loading. At 60% stress level, the structure has no fatigue damage and its frequency attenuation is small, while at 80% stress level, the structure has fatigue damage. The frequency attenuation is more obvious, and the second-order mode is more sensitive to fatigue damage at the 60% stress level. Frequency attenuation diagram under different stress levels.
Conclusions
In this paper, based on the progressive damage analysis method and fatigue cumulative damage theory, a finite element model for fatigue cumulative damage and life prediction of composite materials is constructed. The tensile–tension fatigue and compression–compression fatigue damage characteristics of composite materials were studied, the damage evolution process of different laminates of composite materials under fatigue load was analyzed, and the relationship between fatigue life and frequency attenuation of composite materials was revealed. The fatigue life of the structure can be indirectly predicted by detecting the natural frequency of the structure, which is of great value to engineering applications. The conclusions are as follows: (1) The finite element model of fatigue cumulative damage and life prediction of composite materials has good accuracy, and can analyze the problems of composite material tension-tension fatigue and compression–compression fatigue life accurately. The simulation results of tension–tension fatigue life prediction are in good agreement with the experiment. In the life prediction of compression–compression fatigue, the prediction results under four stress levels are all within the triple error band. (2) In the calculation of tensile–tension fatigue life of composite materials, under the five fatigue loads, no fatigue damage occurs in the experimental and simulation results, which shows that the composite laminate has good fatigue performance. However, a certain amount of fiber and matrix failure occurred inside the composite, along with a progressive degradation of stiffness and strength. (3) In the process of tension–tension fatigue life prediction, the tensile fatigue cumulative damage of the 90° laminate matrix expands from the center of the hole to the two sides of the laminate. At low stress levels, the matrix tensile damage did not extend to both sides of the board, and at high stress levels, the matrix tensile damage of the 90° ply laminate extended to the entire ply area. (4) The natural frequency of a structure decays as the stress level increases. For compression–compression fatigue, at the 80% stress level, the frequency of each order decreases more rapidly with the accumulation of fatigue cycles. Considering that fatigue damage mainly occurs near the round hole, when it is close to its life, the fifth order frequency attenuates by about 0.35. In actual engineering, the fatigue life of the structure can be predicted by monitoring the frequency of the composite material structure.
Footnotes
Declaration of conflicting interests
The author(s) declared no potential conflicts of interest with respect to the research, authorship, and/or publication of this article.
Funding
The author(s) disclosed receipt of the following financial support for the research, authorship, and/or publication of this article: This work was supported by the Natural Science Foundation of Chongqing (Grant No. CSTB2023NSCQ-MSX0802), the Science and Technology Research Program of Chongqing Municipal Education Commission (Grant No. KJQN202201105, KJQN202201113).