
Abstract
Piezoelectric composites offer many advantages compared to piezoelectric ceramics or polymers because of their mechanical flexibility and relatively high stress-induced voltage. In this research, high-molecular weight polyvinylpyrrolidone (PVP) and lead-free piezoelectric (K0.45Na0.51Li0.04) (Nb0.85Ta0.1Sb0.05)O3 (KNNLST) ceramics have been used to produce composites. The possible range of composites from 0 to 100 wt% has been explored. The ceramics were produced using conventional processing methods, while the composites were solution-cast after being mixed with a magnetic stirrer. The composites were characterized by scanning electron microscopy (SEM), X-ray diffraction (XRD), and dielectric and piezoelectric characterization to determine their properties. The morphology of the composites indicates the homogeneous distribution of the ceramics in the polymer. The XRD patterns show that the dissolved amorphous PVP precipitates and the addition of KNNLST ceramics contributes substantially to the crystalline phase formation. The relative permittivity and loss tangent values increase with an increase in ceramic content. Acceptable polarization and strain hysteresis curves were obtained only for the KNNLST ceramics. The composites produced will be suitable for dielectric applications.
Introduction
Piezoelectric materials which are based on BaTiO3,1–3 PbZrTiO3,4,5 or (KxNa1-xNbO3)6–8 ceramics usually have high dielectric constant values (>1000), low dielectric loss values (<0.05), and relatively high piezoelectric constant values. Their hard, brittle, and generally low breakdown strength values limit their usage in specific applications. However, polymers are flexible and soft but typically have low dielectric and piezoelectric properties. The low thermal stability of the piezoelectric properties of ferroelectric polymers limits their applications. 9 Piezoelectric polymers like polyvinylidene difluoride (PVDF) and its derivatives are used in applications requiring much flexibility but low piezoelectric properties. Therefore, piezoelectric composites are needed to bridge the deficiencies in the properties of both ceramics and polymers. A combination of the strength of polymers and ceramics is required to obtain a good dielectric property of composites. Dielectric constant and breakdown strength are important parameters for dielectric composites. 10 Polymer composites for use as capacitors usually have high power density due to their ability to charge and discharge quickly. 11
Much work has been reported in the literature on polymeric composites, some of which include the following: A high recoverable energy density storage capacity with a dielectric constant between 17 and 38 and energy storage density of 1.34 J/cm3 for 0.85(K0.5Na0.5NbO3)-0.15(SrTiO3)/PVDF and (K0.5Na0.5NbO3)/PVDF composite films. 12 An energy harvesting output voltage of 1.9 V has been reported for in situ poling of electrospinned, hydrothermally produced KNN nanorods-PVDF composite. 13 Random and dielectrophoretically aligned 10 vol % (K,Na,Li)NbO3-polydimethylsiloxane (PDMS) composite resulted in piezoelectric properties similar to those obtained in PVDF and P(VDF-TrFE) for sensors and energy harvesters and a ten-fold increase in piezo charge coefficient (17 pC/N) was recorded for the later.14,15 This increment was attributed to the reduction of inter-particle distance to below 1 µm in the aligned chains.
Polyvinylpyrrolidone (PVP) is a polymer that is soluble in water and many organic solvents leading to the formation of hard, transparent, and glossy films. It is chemically stable, biocompatible, with low toxicity, and finds application in the production of cosmetics, drug delivery, additives in coatings, etc. 16 Its structure is usually altered with the introduction of water, leading to heterogenous structures of different sizes. 16 Hydrothermally synthesized nanocomposites based on PVP and Cu have been reported to exhibit higher dielectric constant and AC conductivity values. 17 In studying the microstructure, dielectric, and energy storage properties of BaTiO3-PVDF composites, PVP has been used as a modifier leading to improved dielectric constant values, more uniform particle size distribution, lower defects, and higher energy charge density. 9 When the content of PVP-modified BaTiO3 is 30 vol%, the highest possible discharged energy density of 4.06 J/cm3 at 240 kV/mm was obtained. Composites modified with PVP have improved properties compared to those without modification. Electrospinned BaZr0.3Ti0.7O3 fibre-PVDF composite films produced through solution casting enhanced the values of dielectric and breakdown strength. 18
Electrospinning to produce PVP-modified SrTiO3 nanofibre-PVDF composite from solution casting improved the energy density due to surface modification and the large aspect ratio of the SrTiO3 nanofibre. 19 Solution-cast composite films based on polyvinylpyrrolidone/polyacrylamide at different temperatures show a dominant ion conduction mechanism based on the dielectric properties. 20 Spin coating and slot die coating methods have been used to produce nanocomposites based on PVP-SrTiO3, with the slot die coating method giving a better result. A high dielectric constant of 70 @1 MHz was reported when 70 wt % of the ceramic (SrTiO3) was used. 21 KNN-based ceramics are promising replacements for the well-known PZT ceramics because of their high dielectric and piezoelectric charge coefficient values.8,22 Sodium niobate (NaNbO3)-PA11 composites showed d33 = 6.5 pCN-1 for 30 vol % NN nanowires while PVDF/NN particles gave d33 = 2.6 pC.N-1 for 25 vol %. 23 Microcubes (40 %) of Na0.47K0.47Li0.06NbO3-polydimethylsiloxane (PDMS) composite on ITO-coated PET substrate under vertical compressive force showed an output voltage and generator current of 48 V and 0.43 μA/cm2, respectively. 24 In most of the composites where PVP was introduced, it was claimed that it only served as a surface modifier. The novelty of the research is the use of PVP not as a modifier but as a main component of the dielectric composite. In this research, the particles of KNNLST ceramics and PVP have been used to produce a composite, and the main objective is to determine the suitability of PVP as a major constituent of the composite and its effect on the dielectric properties of the produced composites.
Materials and methods
Ceramic preparation
The KNNLST ceramic powder was produced from raw powders of Na2CO3, Li2CO3, K2CO3 (99%), Nb2O5, Ta2O5 (99.9%) (chemPUR Feinchemikalien und Forschungs GmbH, Karlsruhe, Germany), and Sb2O3 (99.9%) (Thermo Fisher GmbH, Kandel, Germany). Stoichiometric amounts of the powders were weighed and milled using ethanol as solvent. The solution was put in an Attrition mill operating for 2 h at a speed of 500 r/min with 3 mm ZrO2 milling balls. After milling, a solvent extractor separated the powder from the solvent. The powder was calcined in a tube furnace at 850°C for 4 h. A second milling process was carried out using the same parameters to obtain a homogeneous powder with uniform size-distributed particles. The powder was initially pressed using a Uniaxial Press at 135 MPa for 30 s and subsequently with a Cold Isostatic Press at 500 MPa for 2 min. Some pressed ceramic powder was sintered at 1075°C for 2 h at a heating and cooling rate of 3 and 10°C, respectively.
Composite preparation
Polyvinylpyrrolidone (PVP) (SERVA Electrophoresis GmbH, Heidelberg, Germany) with a molecular weight of 1,350,000 was used without further modification. The following amounts (weight %) of the ceramic (0, 10, and 100) were added to the polymer to form the composites. The polymers were each weighed and separately dissolved in 10 mL of deionized water. The dissolution was carried out with a magnetic stirrer whose temperature was gradually increased from room temperature to 70°C for 60 min until a clear and uniform solution was obtained. Appropriate amounts of the KNNLST ceramic were weighed, added to the solution, and dissolved using a magnetic stirrer for 90 min until a highly viscous and homogeneous solution was obtained. The resulting solution was then solution-cast by pouring into different in-house-produced moulds. After drying in air for 24 h, the composites were put in the oven at 50°C and cured for 72 h.
Composite characterization
The bulk density values of the composites were determined geometrically by calculating the mass and volume of the samples, while that of the ceramics was measured using the Archimedes method. The phases in the composites were determined using an X-ray diffractometer (Bruker D8 Discover, Karlsruhe, Germany) with CuKα anode (λ = 1.5406 Å) and operating at a voltage and current of 40 kV and 40 mA, respectively. Grazing incidence diffraction mode with a source fixed at 5°C, scanning speed of 3 s, increment of 0.01°, and measurement range of 10 to 60° was used for data acquisition. In preparation for the SEM measurements, silver paints were applied at the ends of the samples and placed in a vacuum chamber to dry. This was done to ensure enough electrical contact and reduce charging during the measurements. The morphology of the samples was analysed with a Field Emission Scanning Electron Microscope (FESEM) (Zeiss Supra VP 55, Carl Zeiss AG Jena, Germany). The secondary electrons detector was used to acquire the images after correcting for astigmatism. It was also ensured enough vacuum (<10−4 Pa) was created in the chamber before measurements took place.
Samples for electrical characterization were poled at room temperature by applying electric fields between 1.5 kV/mm and 3 kV/mm for 300 s depending on the composition. The higher the PVP content, the lower the electric field used. All the samples for electrical characterization were coated with silver paints on both surfaces. The dielectric properties of the composites were determined with an LCR meter (HP 4284, Palo Alto, USA). Metallic wires acting as electrodes were attached to both surfaces, and the measurement was carried out at frequencies ranging from 20 Hz to 1 MHz. Some of the samples were measured without heat-treating them while another batch were heat-treated. To compare the obtained results with real and imaginary permittivity values, the real permittivity was calculated using the expression in equation (1).
25

The imaginary permittivity was calculated using the relation in equation 2.

The ferroelectric characterization of the samples was done with a Sawyer-Tower circuit attached to a high-voltage generator and a computer containing the software for the data acquisition. The measurement was done by applying a 2 kV/mm field. Unipolar and bipolar strain hysteresis was carried out with a displacement transducer. The slope of the unipolar strain measurement is used to calculate the d * 33 values for the samples.
Results and discussion
Density
The bulk density graph of the PVP-KNNLST composites is shown in Figure 1. The density value for the sintered KNNLST ceramics was determined to be 4.676 ± 0.068 g/cm3, which is ∼95% of the theoretical density.
26
When the ceramic content of the composite is 80 and 90 wt%, macro-cracks were observed. These compositions were therefore produced through solution casting, grinding, and pressing into pellets. When the content of PVP in the composite was 10 wt%, the density value decreased to 3.3974 ± 0.059 g/cm3, corresponding to 72.656% of the sintered ceramics density. On increasing the PVP content to 20 wt%, the density further decreased to 2.69 ± 0.02 g/cm3. Increasing the PVP content to 30 and 40 wt%, the density values further decreased to 2.159 ± 0.079 g/cm3 and 1.905 ± 0.016 g/cm3, respectively. Additional increment in the content of PVP up to 100 wt% does not significantly result in a significant change in the density value ≈ of 1.5 g/cm3. Bulk density values of PVP-KNNLST composites measured at room temperature.
The density value of the PVP is slightly lower than the theoretical value because, on dissolution in water, the sample can no longer reach its maximum density value due to the retention of water molecules which are less dense. It has been reported that when PVP is mixed with water, there is a change in the structure of the polymer. 27 A Raman study of water absorption in PVP revealed that moderately strong hydrogen bonds are formed and plasticizing effect on the mobility of the polymer takes place. This plasticization effect on the polymer is based on the Gordon–Taylor/Kelley–Bueche relationship derived from polymer free-volume theory. When the quantity of water is in a considerable quantity, strongly bound water and free water are formed. 28
Scanning electron microscopy
The micrographs of the PVP-KNNLST composites are shown in Figure 2. The morphology of the pure PVP sample (Figure 2(a)) shows a smooth surface without grain boundaries indicating the amorphous nature of the polymer. On the sample’s surface, however, there is a very long, entangled fibre-like structure with an average width of 10 µm. This structure could be due to the manufacturing method where the PVP was produced as amorphous fibres through electrospinning, and not all fibres dissolved completely. A report in the literature about PVP stated that its structure is altered when it comes in contact with water.
21
It appears that dissolving the polymer in the water resulted in the formation of the fibre-like structure. When 20 wt % of KNNLST ceramics was introduced (Figure 2(b)), the fibrous structure can still be observed in the microstructure, but when the volume decreased substantially few particles of the KNNLST ceramics can be observed. It is not clear why the volume of fibrous structure begins to gradually disappear when KNNLST ceramics are added. A possibility could be due to the processing method involving magnetic stirring which possibly led to the breakage of bonds in the polymer. Scanning electron microscope images of PVP-KNNLST composites showing (a) PVP 100%, (b) PVP 80 wt%-KNNLST 20 wt%, (c) PVP 60 wt%-KNNLST 40 wt%, (d) PVP 40 wt %-KNNLST 60 wt%, (e) PVP 20 wt%-KNNLST 80 wt%, and (f) PVP 0 wt%-KNNLST 100 wt%. The magnification for the samples is such that 1 micron represents 10,000 times enlargement of the size.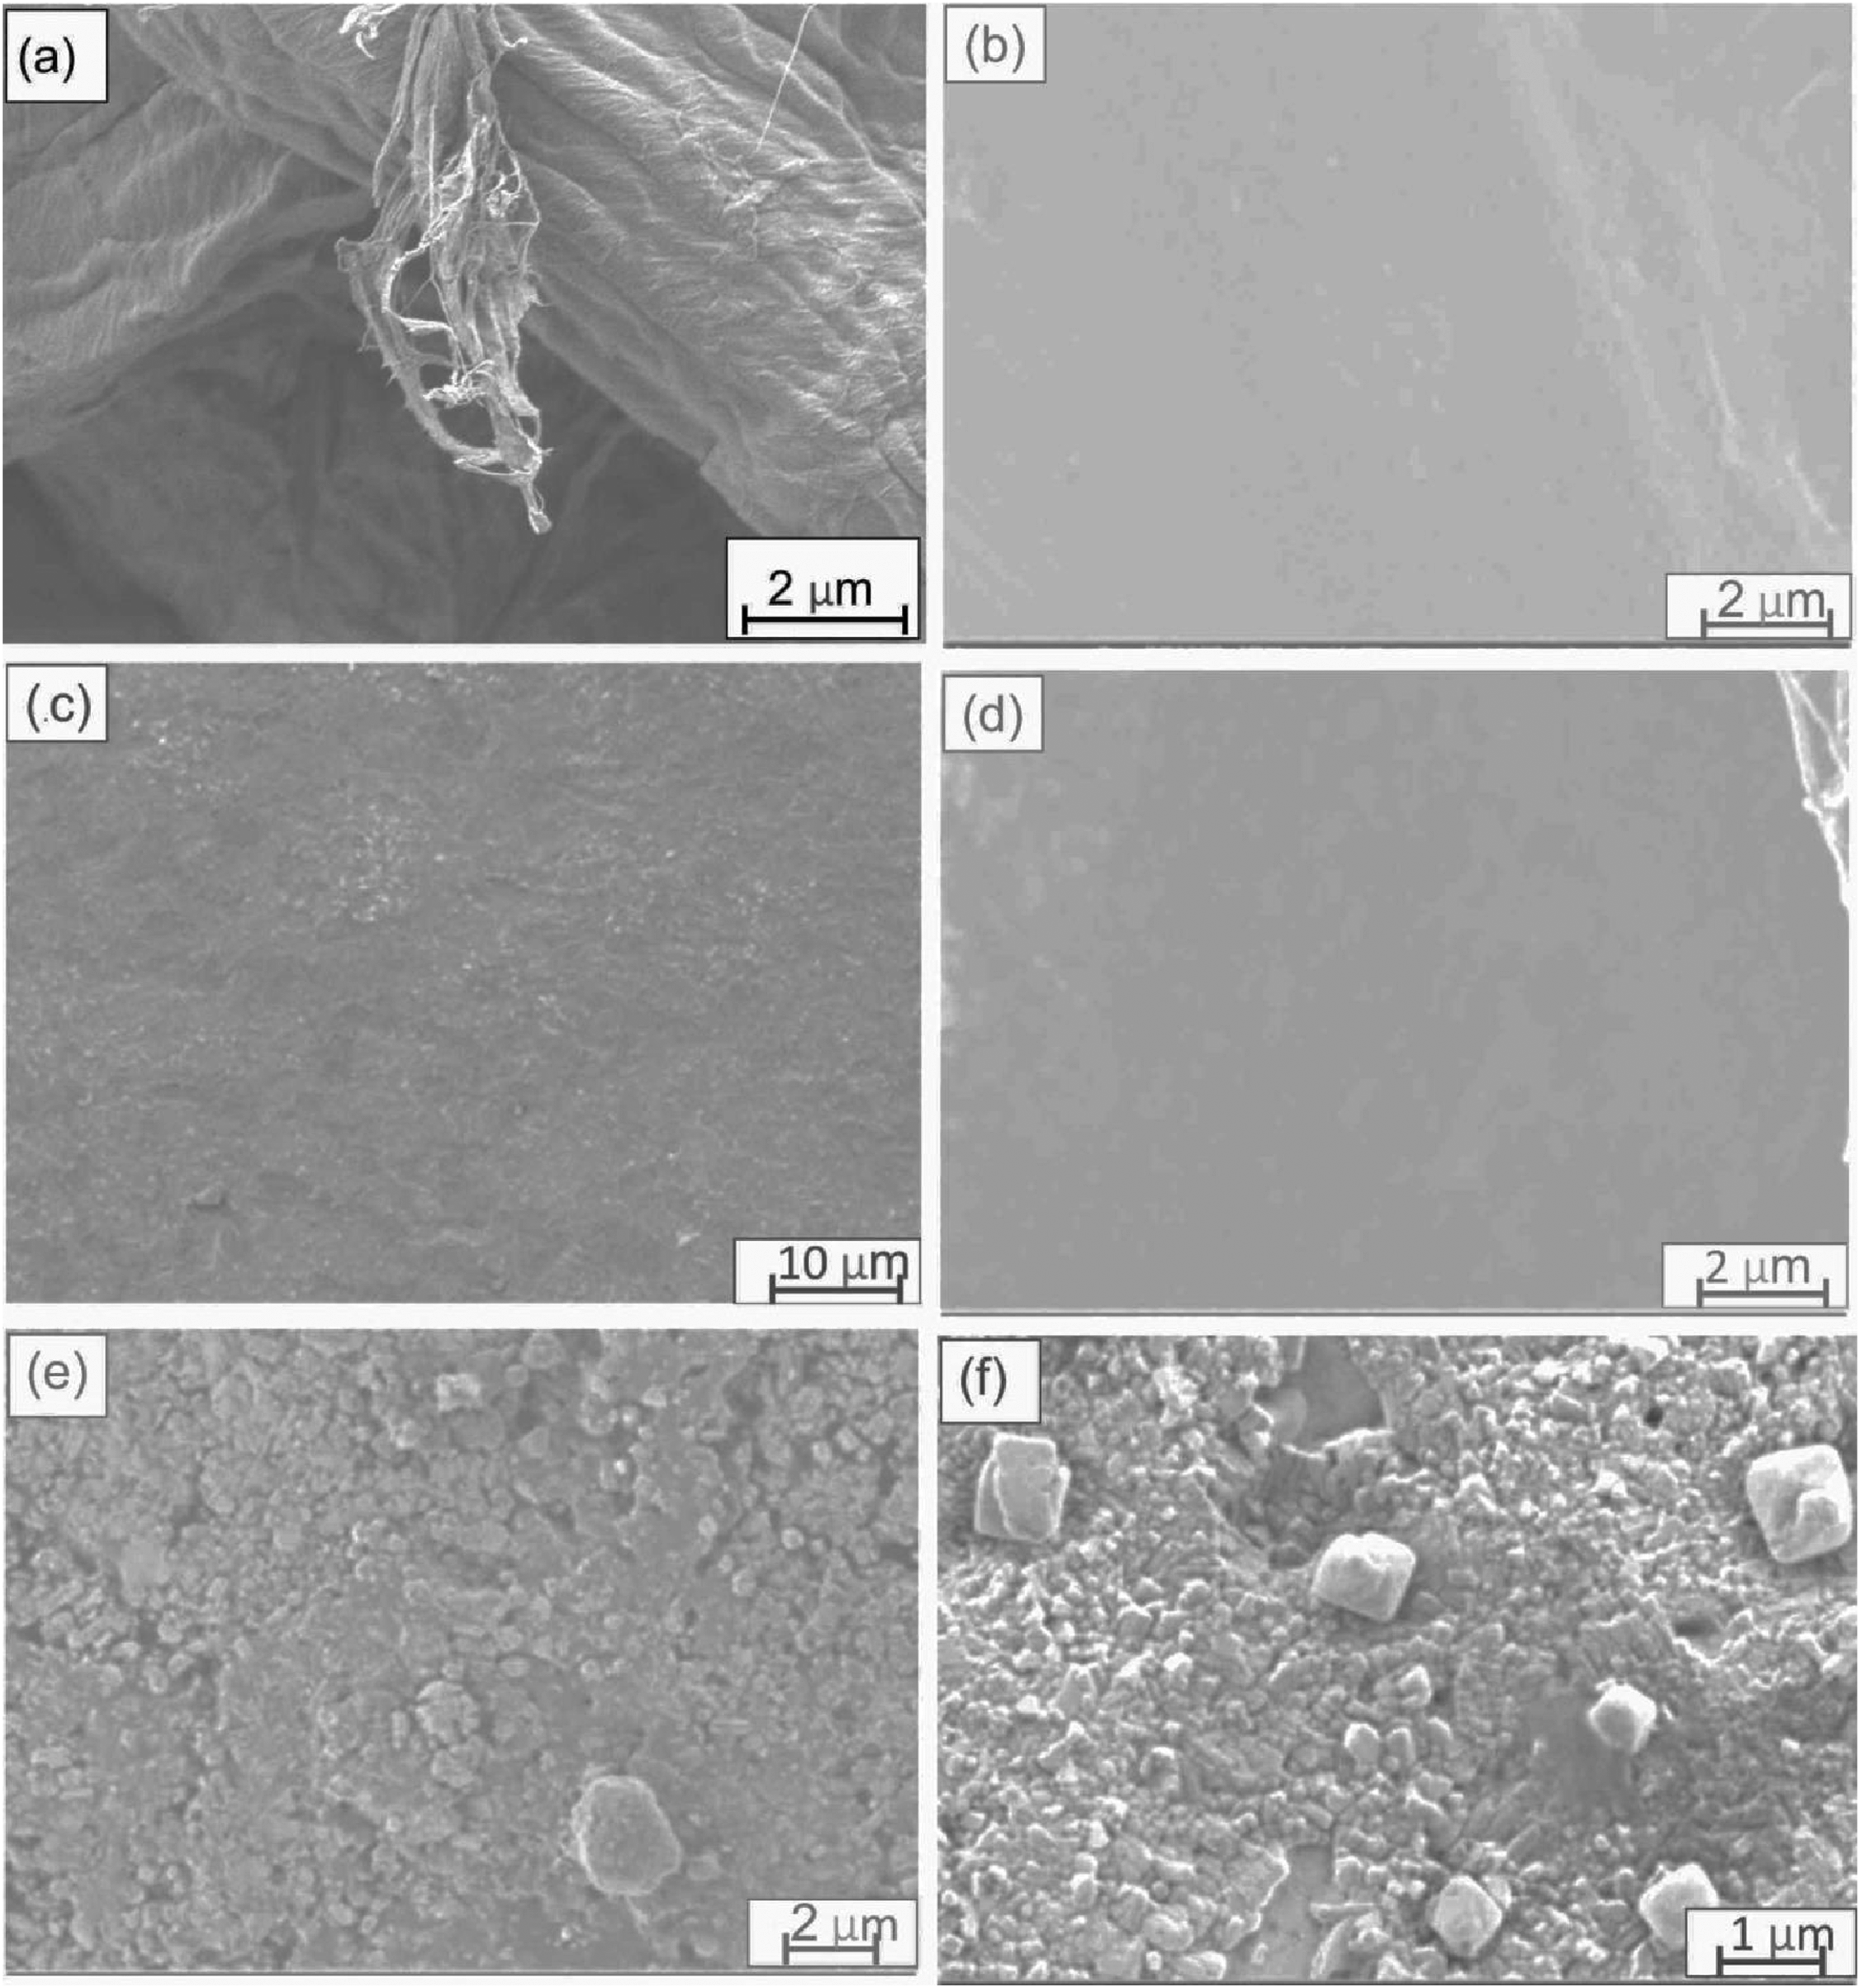
With 40 wt% of KNNLST ceramics (Figure 2(c)), the distribution of ceramic particles is relatively evenly distributed, with pockets of agglomerates. When the ceramic content was increased to 60 wt% (Figure 2(d)), the ceramic particles could be observed on the sample’s surface with relatively even particle distribution except in a few places with fewer ceramic particles. A closer examination of the samples indicates that the ceramic particles are in the sub-micron size range. Increasing the ceramic content to 80 wt% (Figure 2(e)), the morphology of the ceramics becomes more prominent. A few pores can be observed in some areas of the micrograph. The polymer is observed very well on the surface of the ceramics in some areas of the sample. The effect of the ceramics on the composite morphologies such that it tends to replace the fibrous morphologies with polycrystalline materials has clear grain boundaries. For the composition with 100 wt% KNNLST ceramics (Figure 2(f)), most grains are in the sub-µm size range, while a few are about 1 µm. The grains are homogeneous, with little or no precipitates at the grain boundaries. At low electron high tension (1 kV), the porosity in the sample could not be observed as the sample appears to be quite dense. The KNNLST ceramics show the usual quasi-cubic morphology associated with KNN ceramics, and the grain sizes are mostly <1 µm. The grain size is mostly in the sub-micron range due to the second attrition milling after the calcination and the controlled sintering process.
X-ray diffraction
The graphs of the X-ray diffraction data for the PVP-KNNLST composites are shown in Figure 3. PVP is an amorphous polymer represented by the lone broad peak at Bragg angles between 20 and 27°. A preliminary experiment that introduced 5 wt% KNNLST ceramic to the PVP led to a transformation in the diffraction pattern from an amorphous to a crystalline structure. The presence of water in PVP has been reported to modify its structure by lowering the angle of the diffraction peaks and splitting the peaks.
27
KNNLST ceramics have been reported to have two-phase orthorhombic, tetragonal phase coexistence.29,30 A peak splitting was observed where the broad peak of PVP once was. In addition, more diffraction peaks were introduced at 32°, 46°, 52°, and 56°, respectively. When 20 wt% of KNNLST ceramics was introduced, the diffraction peaks became more pronounced and were typically at KNNLST diffraction positions. The intensity of the diffraction peaks also increased. The peak splitting that was at 32° collapsed into a single peak. Little or no amorphous phase was observed at 80, 60, and 50% PVP mixing ratios possibly because the crystalline phase of KNNLST is very intense such that it makes amorphous phase less significant. A plot of X-ray diffraction patterns for PVP-KNNLST composites. The measurements were made at room temperature.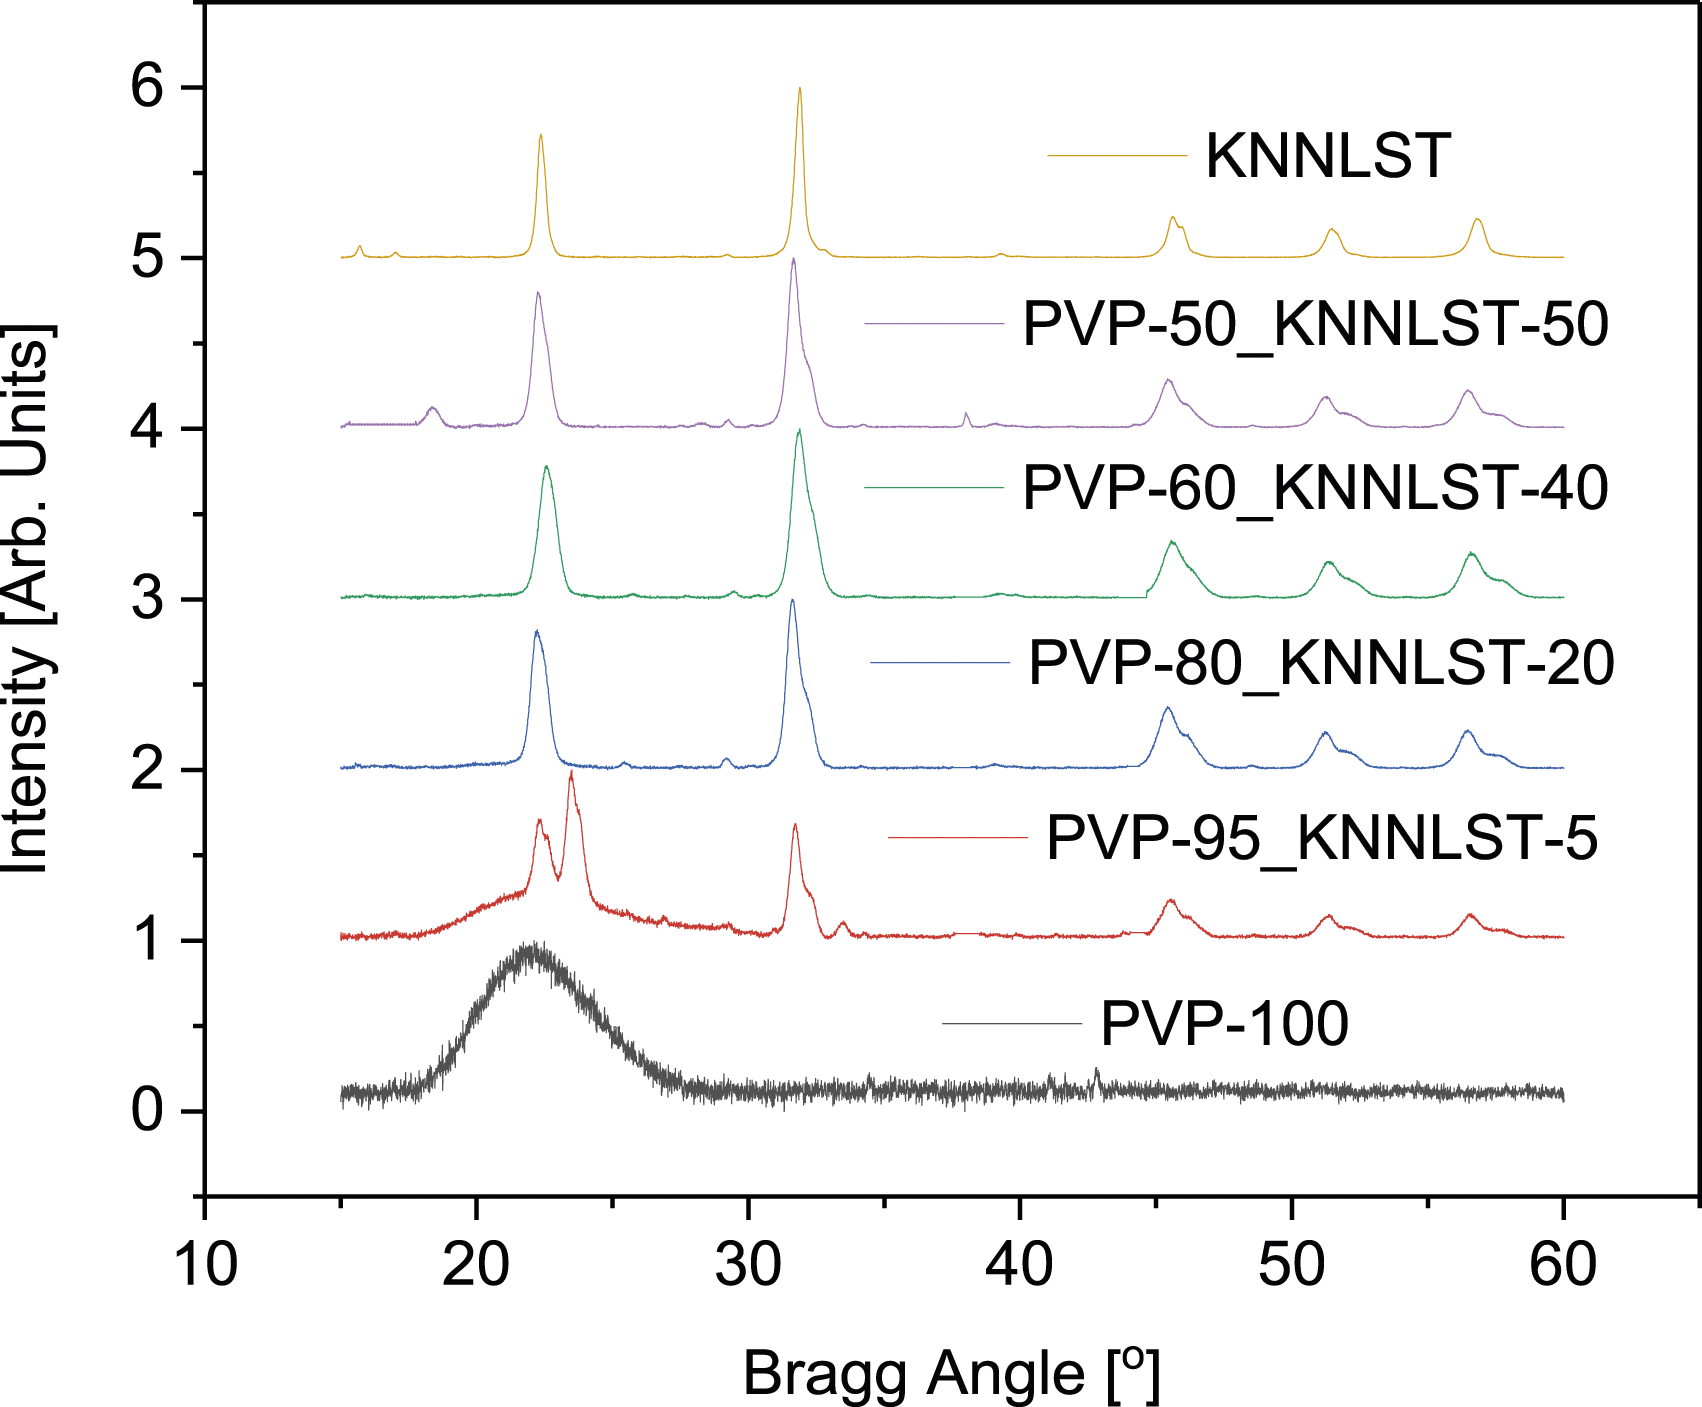
The addition of 40 and 50 wt% KNNLST ceramics further strengthened the diffraction positions of the ceramics. The diffraction pattern of pure KNNLST ceramics is also shown in Figure 3 and is similar to the pattern in the literature for ceramics with similar composition. 31
Dielectric properties
The plot of the dielectric properties of the solution-cast PVP-KNNLST composites is shown in Figure 4. This analysis was done to understand the effect of non-heat-treatment on the dielectric behaviour of the composites. The relative permittivity value of PVP is measured to be ∼10 across the range of frequencies measured. The addition of KNNLST ceramics to the polymer led to a steady increase in the relative permittivity values up to 300 at 20 Hz which decreases to 20 and 1 MHz. As the frequency of measurement increases, the relative permittivity values gradually decrease. The loss tangent value of pure PVP is ∼1 at 20 Hz and decreases to 0.03 at 1 MHz. As the content of KNNLST ceramics increases, the loss tangent values increase. Increasing frequency leads to a decrease in loss values for all compositions. Plot of (a) relative permittivity (ε
r
) values and (b) dielectric loss values as a function of frequency for solution-cast PVP-KNNLST composites. The measurements were carried out at room temperature.
The dielectric properties of the heat-treated PVP-KNNLST composites after solution-casting are shown in Figure 5. The relative permittivity values are shown in Figure 5(a). As the frequency of measurement increases from 20 Hz to 1 MHz, the relative permittivity and dielectric loss values gradually decrease. The relative permittivity value of PVP was found to be ∼11 at 20 Hz and slightly reduced to ∼10 at 1 MHz. This value is similar to those reported in the literature for PVP.9,32 As the content of KNNLST ceramics increased, the relative permittivity values of the composite generally increased except for compositions with 50 wt % KNNLST content. This could be a result of the sample condition during the measurement. At frequencies below 1 kHz, relative permittivity values as high as 1000 were obtained for composites with ceramic content of more than 50 wt %, which decreases to ∼200 at 1 MHz. The relative permittivity values of KNNLST ceramics are relatively stable over the range of frequencies measured and decrease from 1400 at 20 Hz to ∼1000 at 1 MHz. The obtained values are similar compared to relative permittivity values of ceramics with similar compositions.7,33 It is observed that there is a decrease in permittivity (ε
r
) values as the amount of PVP in the samples increases. This is because the permittivity values of KNNLST ceramics are much higher than PVP values. As their contents in the composite increase, it is logical that the overall permittivity values increase. Permittivity (ε
r
) depends on the dipole density per unit volume, and so the addition of the ceramics which have a higher dipole density per unit volume will lead to an increase in permittivity values.
34
Plot of (a) relative permittivity (ε
r
) values and (b) dielectric loss values as a function of frequency for solution-cast and heat-treated PVP-KNNLST composites. The measurements were carried out at room temperature.
The loss tangent values of the PVP-KNNLST composites are shown in Figure 5(b). The shape of the curves indicates the level of dipole mobility in the samples. The dielectric loss values are relatively high (>1) at low frequencies (<20 Hz) and decrease to below 0.04 at 1 MHz. As the ceramics content increases, the dielectric loss values also increase, similar to the result for the relative permittivity. The loss tangent value of the KNNLST ceramic is relatively stable over the frequency range of measurement. As the content of the ceramics in the composite increases, the dielectric loss values increase. Overall, the relative permittivity and dielectric loss values of the PVP-KNNLST composites heat-treated and measured were significantly higher than those measured without heat treatment in the oven.
The real and imaginary plots of permittivity as a function of frequency are shown in Figure 6. The real part of permittivity (Figure 6(a)) shows that PVP has the lowest values at all frequencies. The graph is very similar to that obtained from the LCR meter. As the amount of KNNLST in the composite increases, the permittivity value increases. The imaginary part of permittivity (Figure 6(b)) is slightly different from the dielectric loss in the obtained values although the shape of the curves is similar with frequency. PVP also had the lowest values and as the content of KNNLST increases, the imaginary values also increase. Plot of (a) real permittivity (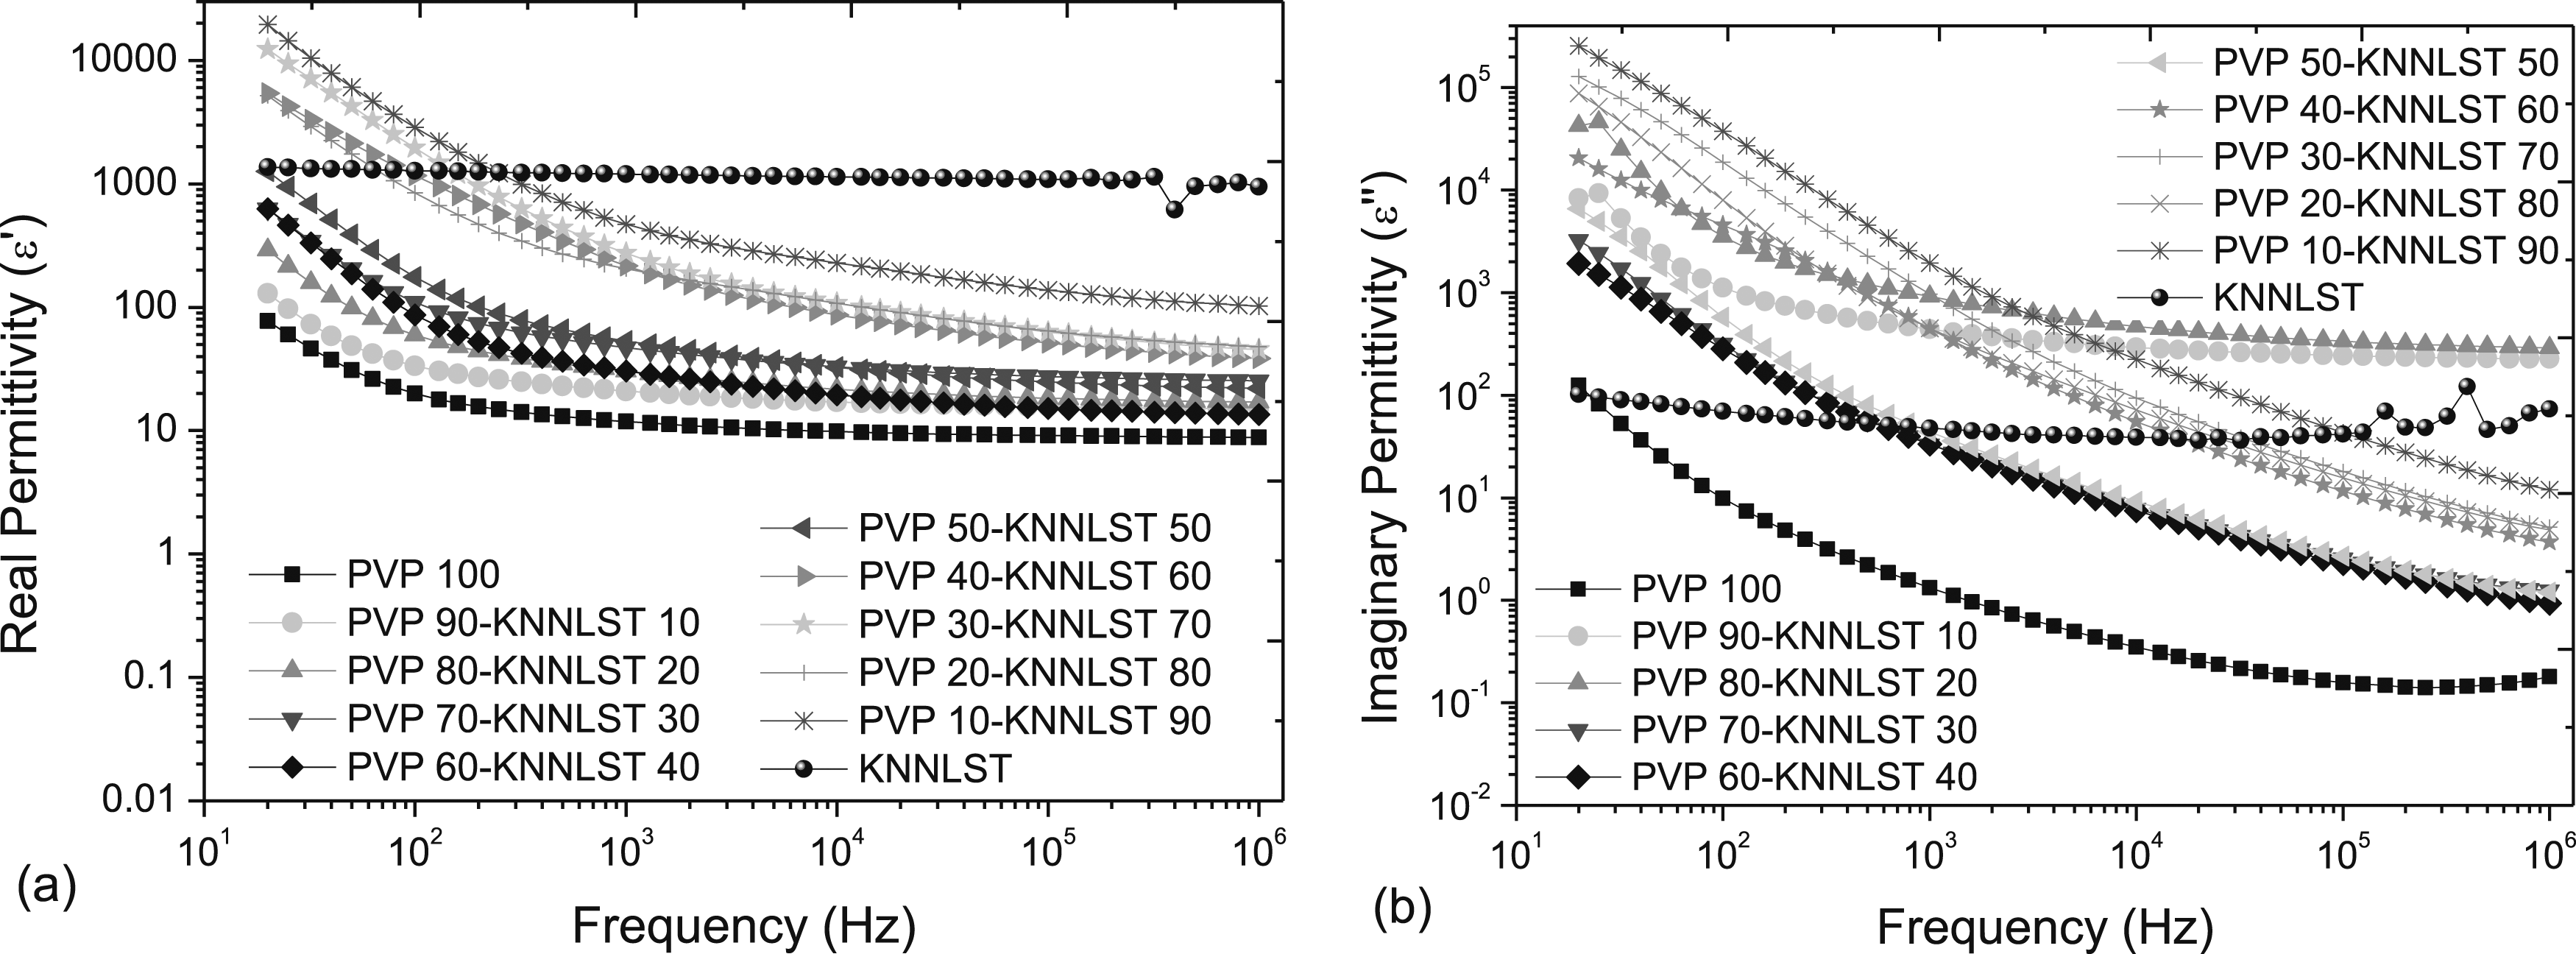
The discontinuities observed in the dielectric properties of KNNLST ceramics may be related to their resonance frequency. The behaviour observed in Figures 4(b) and 5(b) indicates that the dielectric loss is mostly due to dipolar motion. A higher PVP value is expected to result in lower dielectric loss values and the results show that as the ceramic content increases, the loss values increase. The loss values obtained in the PVP-KNNLST composites are higher than those of pure PVP and KNNLST ceramics. This is possibly because of the production process. A temperature much higher than that was used in producing the composites is required for sintering the ceramics making the dipole movement higher.
The dielectric properties of materials help to give insights into the nature of the grains, grain boundaries, transport characteristics, ability to store charges, and material structure. The dielectric properties of most dielectric materials in this work decreased with increased frequency because at low frequencies, the charge carriers respond faster to the applied field but can’t follow fast enough at higher frequencies. The dielectric properties of polymers are determined by the charge distribution and statistical thermal motion of their polar groups, which are polarized through electronic, ionic, and dipole polarization. The inertia of the moving charges makes it difficult for the dipoles to follow the electric field at higher frequencies. The molecules in the composites can no longer match the speed of changes in the electric field. The two factors involved are their inability to orient fast enough through rotation and the shifting electron clouds’ failure to keep up with the field.
The dielectric loss is the energy loss associated with the applied electric field being ahead of the polarization shift. 35 It is affected by sample composition, preparation method, porosity, etc. It originates from the migration of space charges (interfacial polarization contribution), direct current (DC) conduction, and movement of the molecular dipoles (dipole loss). 35 The dielectric losses of both PVP and KNNLST are lower than those of the composites because these effects are reduced compared to the composite. The high energy dissipation in the composite is due to high conduction loss where the charge flow in a substituting electromagnetic field as polarization switches direction. It is also possible that there are oxygen vacancies in the lattice which induces free charge carriers leading to more leakage currents. As the polarization delays the applied field, an interaction occurs between the field and the dielectric’s polarization which causes material heating.
AC conductivity
The plot of AC conductivity as a function of frequency for PVP-KNNLST composites is shown in Figure 7. As the frequency of measurement increases, the conductivity values for the composites increase possibly due to the increase in the mobility of the charge carriers like electrons through hopping mechanism. The higher the content of KNNLST ceramics in the composite, the higher the initial conductivity values. This suggests that increasing the content of dissimilar materials leads to increased space charges and new material created. The conductivity value for PVP is the lowest and increased from 3.5*10−8 S/m at 20 Hz to 1.4*10−5 S/m. An exception is in the composition with 80 wt% of KNNLST ceramics, where an increment in the frequency did not significantly change the conductivity values. It is not clear why this is so. Still, a possible explanation is that the electrode’s effect on the sample inhibited the easy excitation of electrons until very high frequencies were reached. Graph of conductivity as a function of frequency for PVP-KNNLST composites. The measurements were carried out at room temperature.
The polarization and strain hysteresis curves of KNNLST ceramics are shown in Figure 8. Polarization and strain hysteresis curves for PVP-KNNLST composites could not be obtained because the flow of electrons in the composites was too high to allow the measurement to proceed to completion. Some samples’ porosity ensures that free electrons make it difficult for the composite to be properly polarized. When they are, their contribution from conduction is too high. Saturation polarization was not attained on the application of a 2 kV/mm field, possibly due to free electrons in the samples leading to leakage currents, so the loop could not return to the starting position. Graph of (a) polarization and (b) strain hysteresis curves of KNNLST ceramics. The measurements were carried out at room temperature.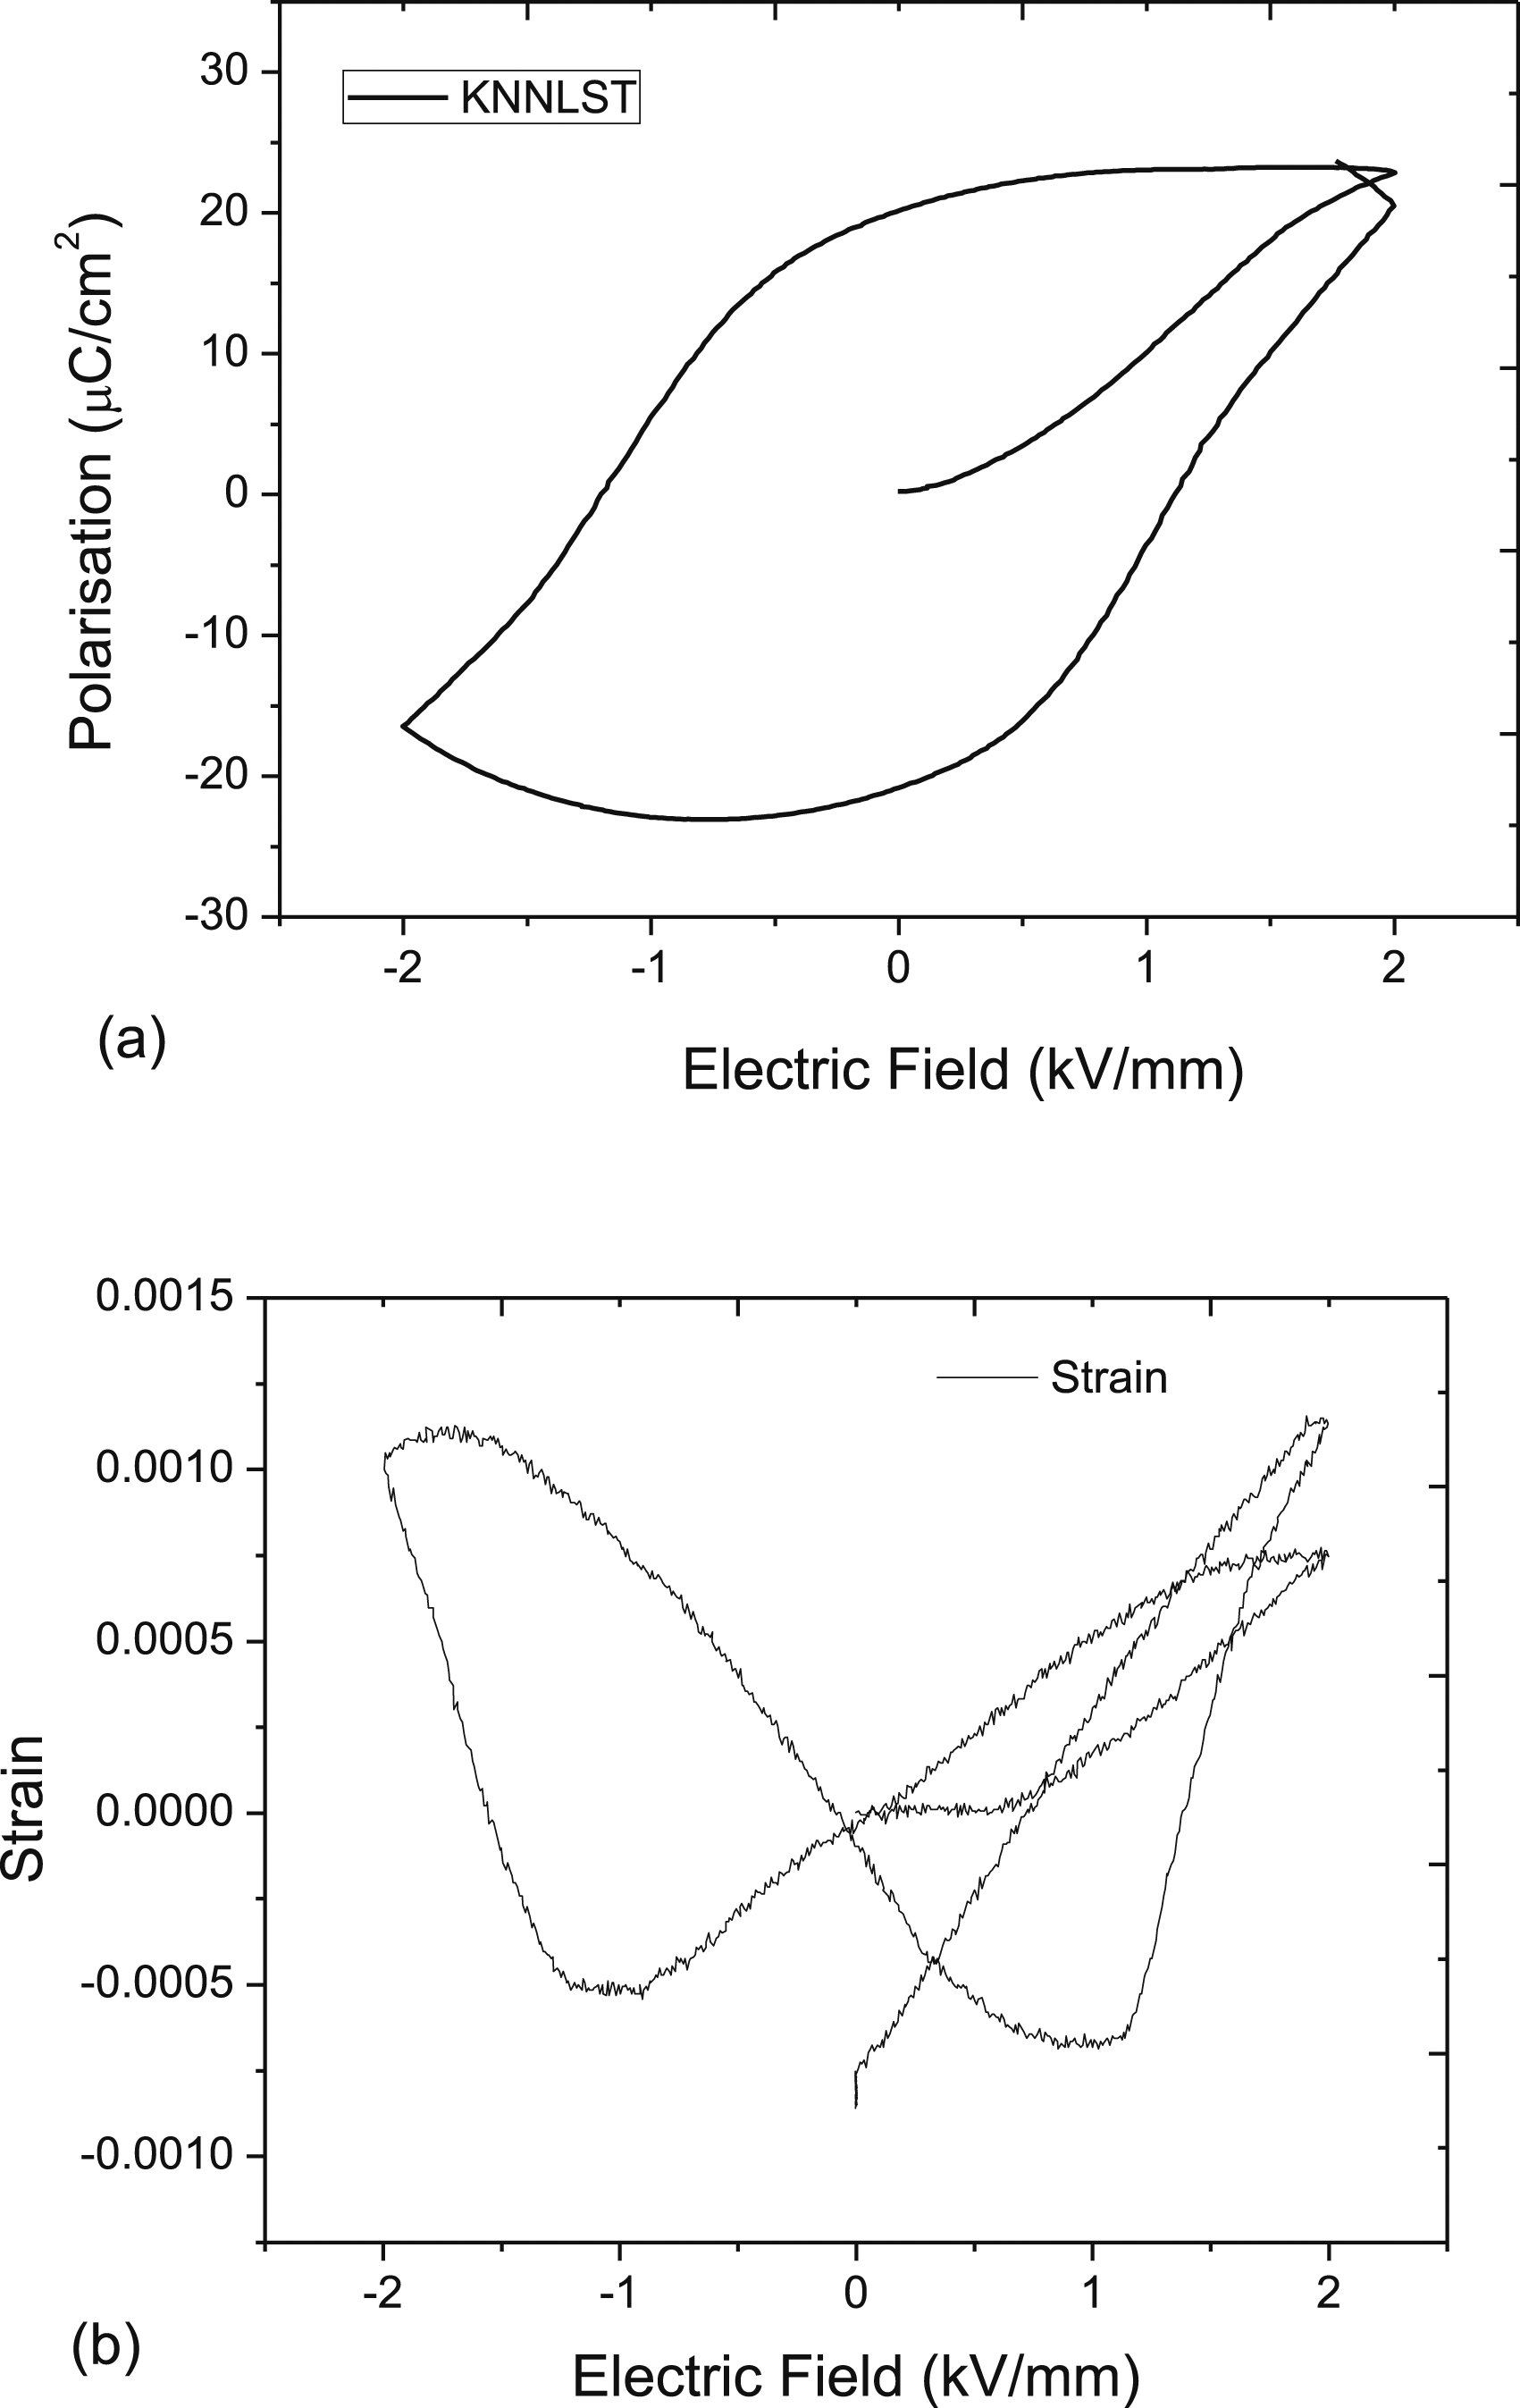
Sample porosity is also a contributing factor to the drift and resultant unsaturation. The lower-than-desired amounts of sodium could have caused some imbalance/distortion in the perovskite structure. A small amount of silicon was detected in the sample during EDX analysis. It may have been introduced by using a furnace previously used to heat-treat silica.
Conclusion
A set of homogeneously produced PVP-KNNLST composites with a polymer content from 0 to 100 wt % was prepared and characterized with techniques including SEM, XRD, dielectric, and ferroelectric properties. As expected, the density results show that as the content of the ceramics increases, the bulk density values increase. No significant difference in density values was obtained for composites where the contents of the ceramic range from 0 to 40 wt% due to the limitations in the method. PVP is mostly amorphous, while the grain structure of KNNLST has piezoelectric grains. As the ceramic content increases, the ceramic particles can be observed on the surface of the micrographs. When the ceramic content is above 60 wt%, the grains could be observed with porosity on the microstructure. Sub-micron-sized grains could be observed on the surface of the KNNLST ceramics. The dielectric properties of the composites depend on the material composition such that higher KNNLST contents resulted in higher relative permittivity and loss values with a few exceptions. As the measurement frequency increases, the dielectric properties generally decrease. The polarization and strain hysteresis show that only the KNNLST ceramics had good hysteresis curves. The charging in the composites during the measurement made it difficult to obtain reasonable curves.
Footnotes
Declaration of conflicting interests
The author(s) declared no potential conflicts of interest with respect to the research, authorship, and/or publication of this article.
Funding
The author(s) received no financial support for the research, authorship, and/or publication of this article.