
Abstract
Dielectric nanocomposite elastomers based on poly(styrene-ethylene/butylene-styrene) (SEBS) and SEBS-grafted-maleic anhydride (SEBS-g-MA) with barium titanate (BT) suitable for electroactive applications were successfully manufactured by using two corotating twin extrusion systems. The main purpose of the work was to investigate the thermal, mechanical, dielectric, and morphological effects of additives on SEBS and SEBS-g-MA to widen their applications for electroactive applications using fast and more cost-effective simple production process. The morphological characterization showed a good and bad dispersion of BT into SEBS-g-MA and SEBS with 34.9% and −3% dielectric permittivity change in SEBS-g-MA and SEBS upon addition of 10 wt% BT. In addition, dielectric permittivity change, thermal change (enthalpy relaxation and thermal transitions), and mechanical (Young’s modulus, hysteresis loss under multiple stress cycles, storage modulus, loss modulus, and tan δ) properties of elastomers were found to be a function of additive concentration, compatibility and interaction between elastomers and additive type, orientation of additives, and reinforcing factors of additives in elastomers. A simple and effective modeling technique was used to demonstrate the effects of dielectric properties on nanocomposites due to poor dispersion of additives.
Introduction
Thermoplastic elastomers possess the properties of thermoplastic polymers and rubbers in different phases, behaving like elastomers at room temperature with thermal processability. A variety of thermoplastic copolymers are available based on styrene block copolymers, thermoplastic copolyester, thermoplastic polyurethanes, thermoplastic copolyamide, thermoplastic olefins, thermoplastic vulcanizates, and melt processable rubbers. 1,2 Poly(styrene-ethylene/butylene-styrene) (SEBS) triblock obtained from the hydrogenation of SBS (Poly[styrene-butadiene-styrene]) is a type of styrene block copolymer which consists of polystyrene as end hard blocks and ethylene-butylene as the mid-soft block. Morphologically, the domain size of the hard block and the soft block are in nanoscales. SEBS has become more and more captivating to industrial and academic communities because of its nanostructured morphology, resistance to harsh environmental conditions, and its unique ability to demonstrate mechanical deformation under electrical field. 3,4 Because of these superior mechanical, morphological, and electromechanical characteristics, it has enormous potential for applications in strain and stress sensing, actuation, and energy generators. Moreover, the attachment of the polar group, maleic anhydride (MA), on SEBS’s carbon backbone provides better dispersion of highly polarizable additives like barium titanate (BT) for the enhancement of its electrical properties. However, electroactive properties such as actuation, Maxwell stress, polarizing capability, and strain sensing abilities of these virgin elastomers and their nanocomposites are dependent on several mechanical, thermal, and electrical properties of thermoplastic elastomers. In addition, the type of additives used, dispersion levels, and the interaction between elastomers and additives are also of major concern. 1,2,5 –10 Elastomers tend to have high dielectric constant under relaxed conditions versus stretch conditions. 11 The relative change in polarization under different strain conditions gives low prospect for the use of these elastomers as energy generators, although these elastomers can retain a high degree of mechanical compliance. However, the addition of dielectric fillers enhances polarization capability of an elastomer under strain as dielectric fillers come close to each other. Moreover, these dielectric thermoplastic elastomers also need to have a high dielectric permittivity (as well as high mechanical compliance) with very low dielectric loss if they are to be deployed successfully when used for electroactive applications.
Compared to different piezoelectric, shape memory, and conventional dielectric polymers used in such applications, styrene-based triblock SEBS was found to have higher electrical elongation (47% vs. 0.1% for lead zirconate titanate (PZT)), higher energy density (139 KJ m−3 vs. 2.5 KJ m−3 for PZT) and better electromechanical coupling efficiency (0.85 vs. 0.6 for PZT). 7,12,13 In addition to its elastomeric properties, SEBS can easily be processed for its mechanical and electrical performance enhancement. Even though conventional dielectric elastomers such as silicone also have good electromechanical performance, 6,14 several problems such as the requirement of high biased voltage and difficult processing requirements remain unresolved. 7,15 The ease of processing thermoplastic elastomers with the addition of different filler types to tailor their dielectric properties makes them more suitable for artificial muscles, capacitive sensors, and capacitive energy harvesters. 7,16 Conductive fillers tend to change the dielectric permittivity of polymer matrices by several folds. 17 He and Tjong 18 reported the dielectric permittivity of polyvinylidene difluoride increased by 15 times with the addition 0.5% of reduced graphene sheets 19 . However, they also tend to increase the dielectric permittivity loss of nanocomposites leading such manufactured nanocomposites to have low dielectric strength. 20 In addition, Kim et al. 21 noticed the low deformation of thermoplastic elastomers on the application of an electric field even with the addition of a higher percentage of carbon black. This may be due to a higher relative stiffness change on the polymer nanocomposite matrix, rather than its relative dielectric permittivity increase due to the high reinforcing effect of carbon black. It has also been reported that the high dielectric loss (six times increase in dielectric loss of polymer matrix upon addition of 4% volume concentration of carbon black), low dielectric strength (less than 3V µm−1 upon addition of 2.5% volume concentration of carbon black in SEBS vs. 50 V µm−1 of virgin SEBS), and high reinforcing effects (40% increase in Young’s Modulus with the addition of 0.5 wt% of graphene-carbon nanotubes particles) of conductive fillers such as carbon black, carbon nanotubes, and graphene limit the applications of elastomers nanocomposites for many electroactive applications like energy harvesting generators and charge storing flexible supercapacitors. 19,22
This article presents the enhancement of dielectric permittivity with very low dielectric loss and minimum increase in stiffness of thermoplastic elastomers using high dielectric fillers based on BT. The aim of the current work is to show the importance of compatibility and interaction between additives and polymer to change the dielectric as well as mechanical properties of these polymers with differing ratios of nano-additives. Specifically, this article addresses the following: (i) the effect of polymer–additives interaction on the electrical, mechanical, thermal, and morphological properties of BT/polymer composites; (ii) the dielectric and thermomechanical response of BT/polymer composites over the range of frequency and temperature respectively; (iii) the thermal response of BT/polymer composites; (iv) the effect on dielectric properties of BT/polymer composites due to the dispersion of additives in polymer matrix; and (v) manufacturing of high dielectric thermoplastic elastomers composites using faster and more cost-effective simple production processes such as hot melt extrusion in place of conventional solvent methods.
Experimental
Materials
SEBS (i.e. SEBS triblock) (Kraton® G1652 E Polymer) with linear structure and 29–30% styrene content and SEBS-grafted-MA (SEBS-g-MA) (i.e. SEBS-g-MA triblock) (Kraton® FG1901G Polymer) with linear structure and 29–30% styrene content were obtained from Kraton polymer research, Belgium. High dielectric material BT (100 nm, 99.9%) was obtained from IoLiTec Ionic Liquids Technologies GmbH, Germany.
Preparation of nanocomposites
Material blending was carried out in a corotating twin screw extruder (extruder 1 with 5 heating zones and die) with L/D ratio of 25:1. Nanocomposites of SEBS and SEBS-g-MA with different percentages of BT (1 wt%, 5 wt%, and 10 wt%) were subsequently produced with a temperature profile over five zones of 180–240°C and 160–200°C, respectively. For all samples, screw speed was maintained at 70 revs min−1.
The extrudate from extruder 1 was pelletized and fed using gravimetric feeder into a separate corotating twin screw extrusion machine (extruder 2 with six heating zones and a die) with L/D ratio of 25:1. The extrudate was then passed through a roller system running at a constant speed of 0.5 revs min−1 at 20°C for the production of a constant thickness sheet. Processing was carried out with a screw speed of 70 revs min−1, and temperature profile 170–240°C and 160–200°C over six zones for SEBS and SEBS-g-MA nanocomposites, respectively.
Dielectric characterization
A Solatron 1260 impedance analyzer with a 1296 dielectric interface was used for the dielectric characterization of all flat samples. A Solatron 1296 2A sample holder consisting of two parallel circular electrodes of 40 mm diameter was used to facilitate measurement of all solid samples. The material was placed in between two electrodes and a 3 Vrms alternating voltage was applied. Each sample was measured five times and the standard deviation (SD) was found to be less than 0.1% for all sample types and thickness for all samples were between 1 and 2 mm
Mechanical characterization
Five ASTM type I tensile bars were obtained for each composite by cutting an extruded sheet of each sample along the axis of screw rotation obtained from the extrudate. Tensile testing was carried out using a Zwick/Roell Z010 tensile testing machine with 2.5 KN load cell capacity. The speed and the maximum extension between the grips were maintained at a speed of 500 mm min−1 and 200%, respectively. Finally, the average curve of five samples was calculated and plotted for each composite type. Then, standard Young’s modulus of elasticity was measured for each composite at different strain point. Similarly, cyclic testing was performed on all composite samples. Total hysteresis loss and total elastic energy present were measured using work curves for each cycle. The total amount of energy required for the composite to extend by 200% was divided into two types of energy: (i) elastic energy and (ii) loss energy as shown in Figure 1.
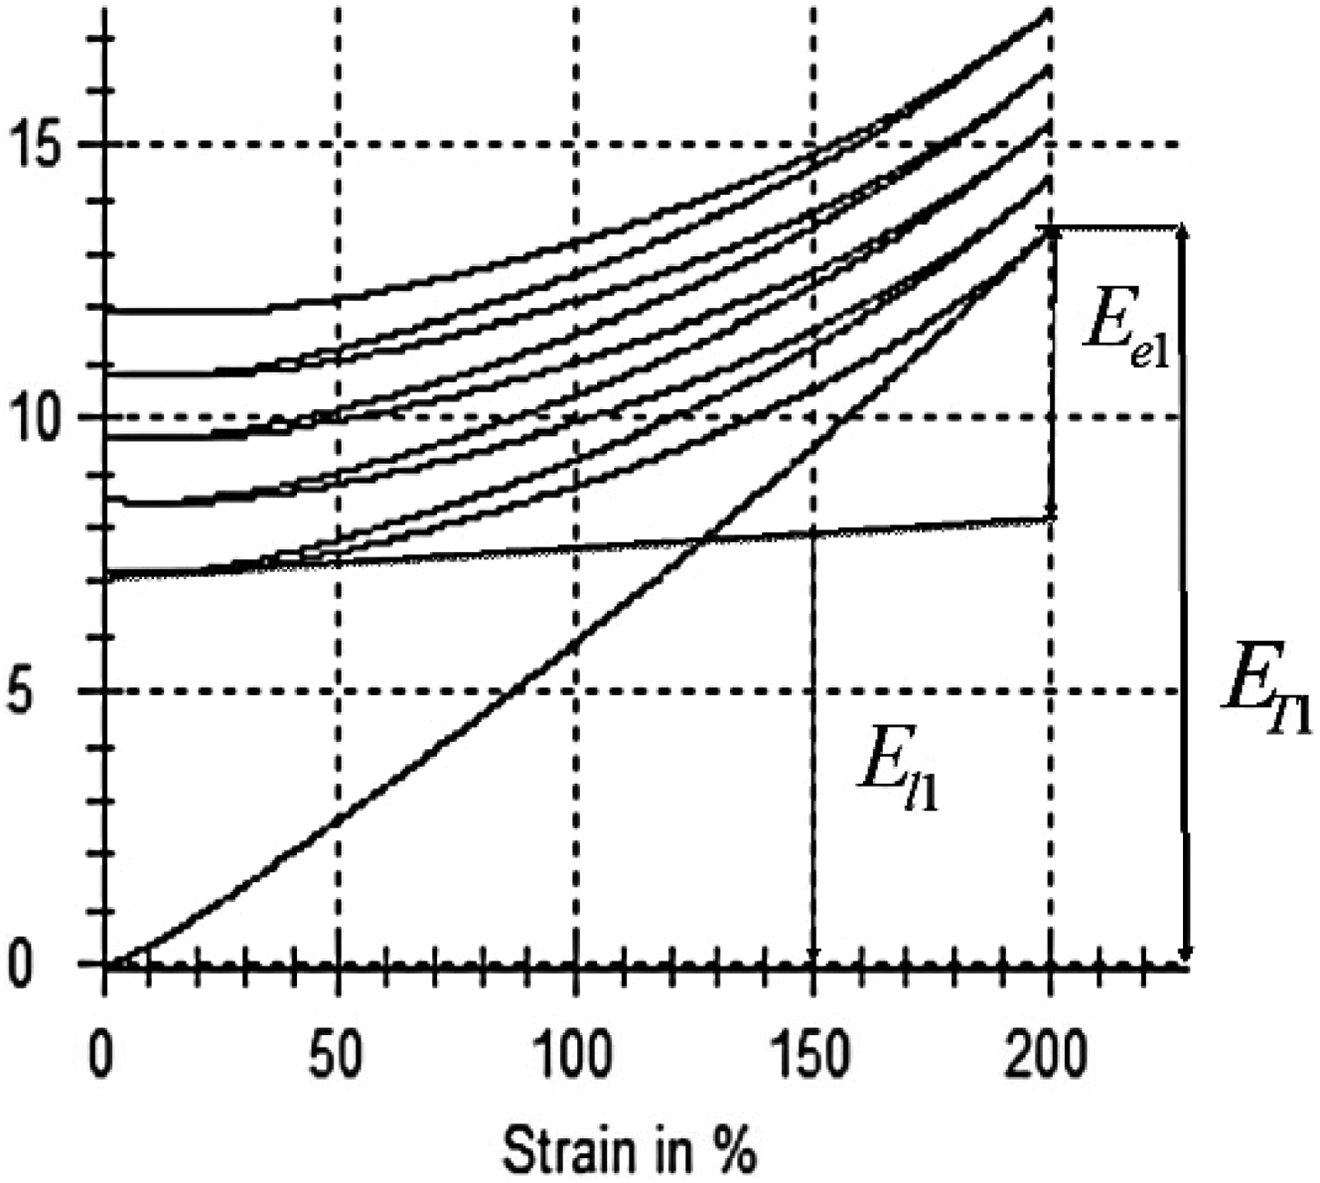
Total energy (ET 1) divided into elastic energy (Eel ) and loss energy (El1 ) for cycle 1 for SEBS.

where, ETi, Eei, and Eli are total energy applied, elastic energy present in the material after reloading and loss energy or hysteresis loss of thermoplastic elastomer respectively for the cycle i.
The term loss factor was used to measure the shape memory properties of nanocomposites under large extension. The loss factor can be directly defined as

Dynamic mechanical analysis
Tensile flat samples were prepared by cutting an extruded sheet along and transverse to the axis of screw rotation obtained from corotating twin screw extrusion. Dynamic mechanical analysis (DMA) was carried out on a TA Instruments DMA Q800 in a ramp temp/multifrequency mode from 25°C to 140°C at a frequency of 1 Hz with a heating rate of 3°C min−1. DMA was used to measure transitions of mechanical failure of elastomer, maximum molecular chain movements of the same and glass transition of styrene block of a sample using data obtained from storage modulus, loss modulus, and tan δ, respectively, as the sample deformed at an amplitude of 16 µm under a sinusoidal deformation of 1 Hz.
Modulated differential scanning calorimetry
Modulated differential scanning calorimetry (MDSC) of all composites were carried with TA instrument 2000. The heat capacity was calibrated using sapphire, while temperature and baseline were calibrated using indium. An oscillation period of 60 s and amplitude of ±0.47°C was used in modulated heating and cooling experiments. SEBS was subjected to equilibration from 22°C to –80°C followed by heating at 3°C min−1 to 180°C. At the beginning of each heating run, materials were held isothermally for 3 min to obtain thermal stabilization between the reference pan and sample pan. TA software for MDSC was used for recording, analysis, and deconvolution of the signals. The least square method was used to smooth all the curves for better analysis. The level of smoothing was selected within the range of 3°C to give minimum distortion and no shift of peaks. Thermal analysis of each composite type was performed using total heat flow curve and derivative of reversible specific heat capacity curve. The temperature derivative of reversible specific heat capacity was used to measure glass transition because it is reported to show high sensitivity to the process of heat flow during glass transition. 23,24
Attenuated total reflectance-Fourier transfer infrared spectroscopy studies
Polymer–additive interaction in the different composites was studied using attenuated total reflectance-Fourier transfer infrared spectroscopy (ATR-FTIR). Infrared spectra of all composites were obtained with a VARIAN 600 ATR-FTIR. ATR-FTIR spectroscopy was carried out at room temperature on clean solid extruded flat samples with a resolution of 4 cm−1. All data were collected between 600 and 4000 cm−1 with an average of 32 scans.
Morphological studies
Four samples (SEBS, SEBS-g-MA, SEBS with 10 wt% of BT, and SEBS-g-MA with 10 wt% of BT) were chosen for morphological analysis. Samples were submerged in liquid nitrogen and were cryo-fractured to visualize the distribution of additives in polymer matrix along the thickness (traverse cross section area). The samples were gold coated on the surface and morphological studies of prepared samples were carried out with TESCAN (Brno, Czech Republic) scanning electron microscopy (SEM) at 20 kV. Numerous regions were selected and element mapping was performed to access the materials distribution profile.
Results and discussion
During the extrusion process, the torque measured and die pressure for all composites were between 15 to 10 Nm and 34.5 to 70 kPa, respectively for extruder 1. Similarly, for extruder 2, the torque observed and die pressure were between 25 to 140 Nm and 27.5–48.3 kPa, respectively for all composites.
The real dielectric permittivity calculated for SEBS and SEBS-g-MA composites from the Salotron 1296 at a frequency of 10 Hz at room temperature is shown in Table 1.
Real dielectric permittivity of SEBS and SEBS-g-MA with BT and % change with respect to virgin polymer.
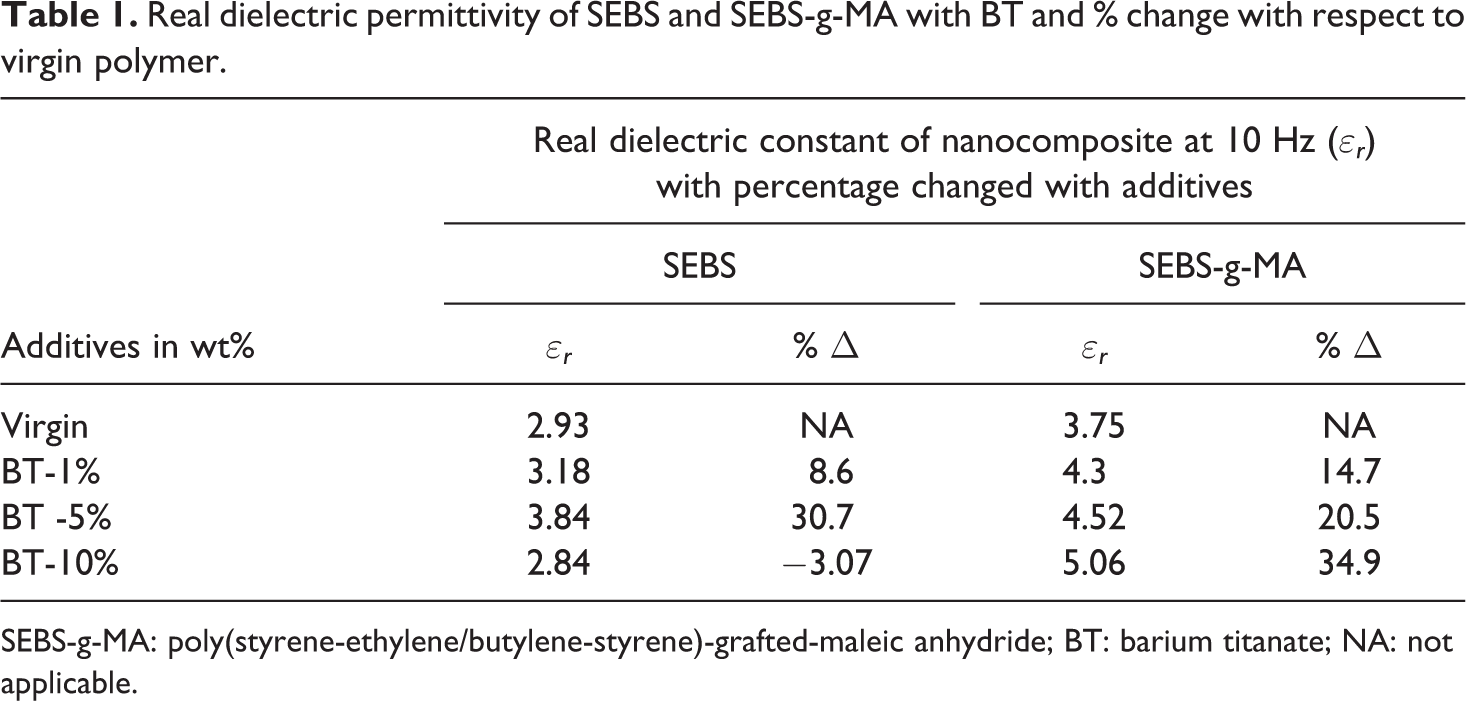
SEBS-g-MA: poly(styrene-ethylene/butylene-styrene)-grafted-maleic anhydride; BT: barium titanate; NA: not applicable.
The graph for the real dielectric permittivity of SEBS and SEBS-g-MA composites is shown in Figure 2.
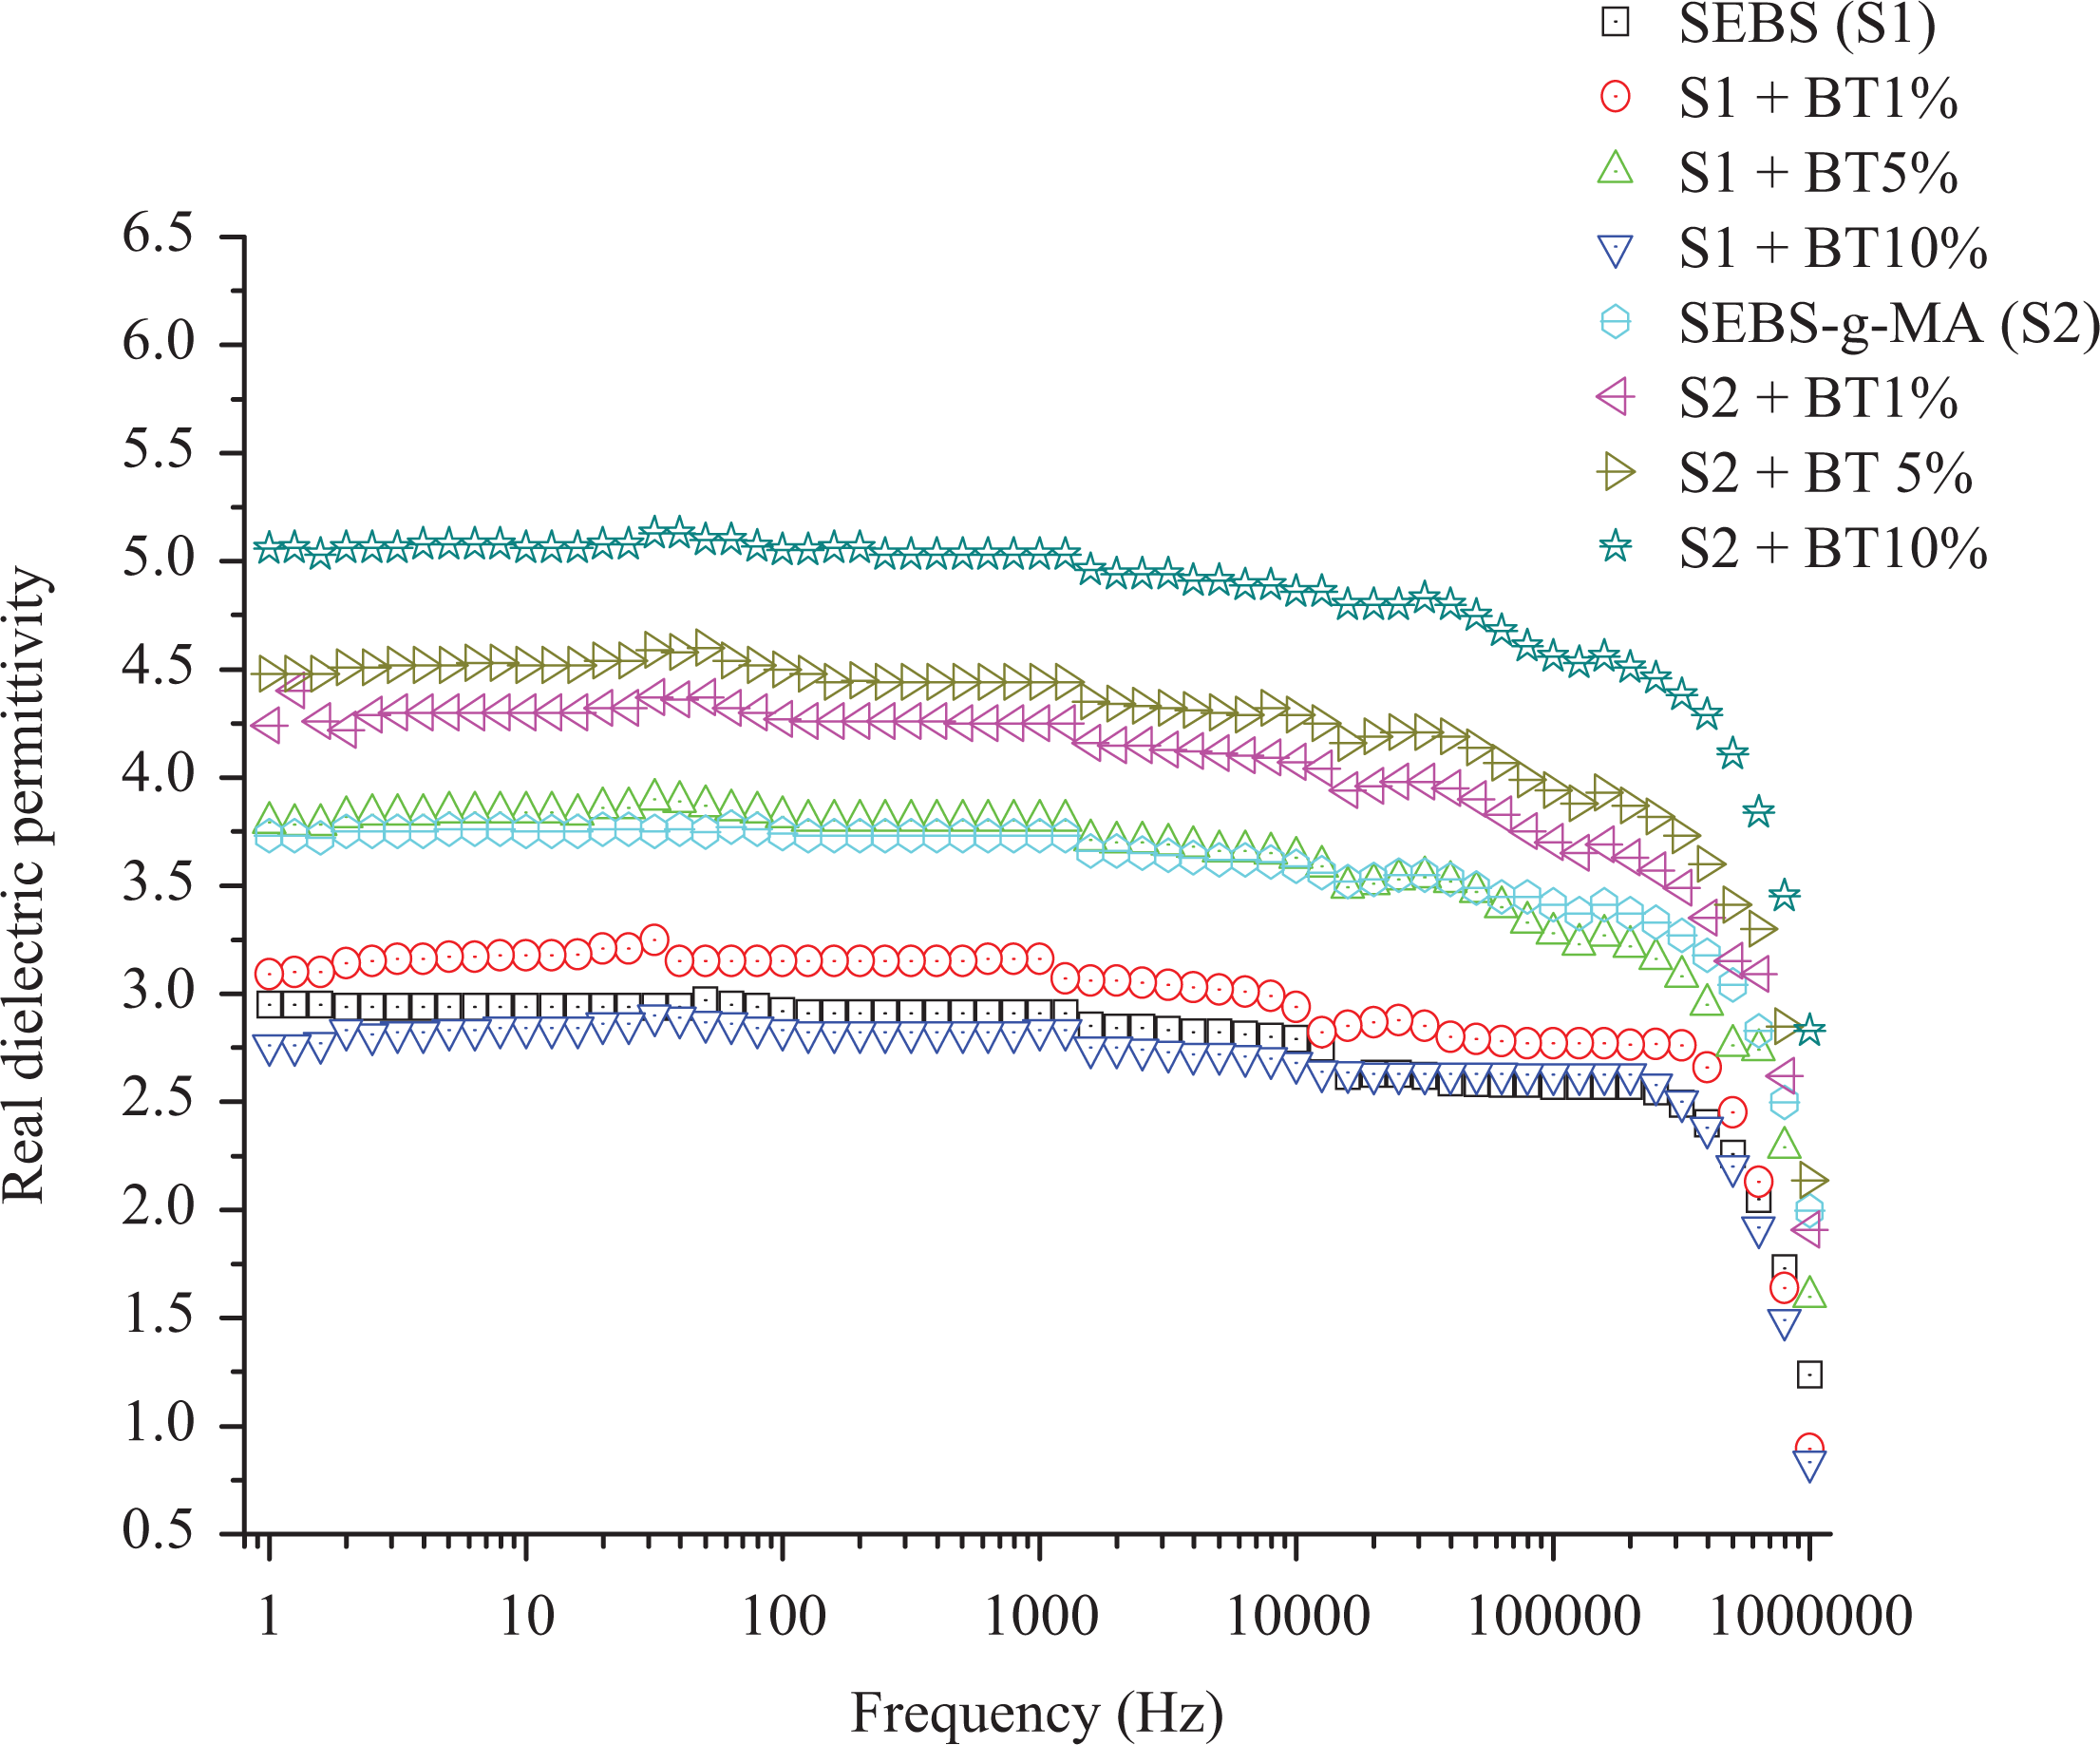
Real component of dielectric permittivity of SEBS (S1) and SEBS-g-MA (S2) composite with different percentages of BT.
The dielectric loss (tan δ) was also measured and found to be less than 0.05 below 1 kHz for all composite samples making them suitable for energy storing capacitive applications. However, the loss was found to increase with an increase in frequency. The total dielectric permittivity of those samples was published in our previous work. 17 There was no significant difference between real dielectric permittivity shown in Figure 2 and Table 1 and total dielectric permittivity for all samples from our previous work because of low loss factor over the range of all frequency measured. However, total dielectric permittivity alone can’t always give the information about the polarization capability of materials in all cases as it is the vector sum of loss factor and real dielectric permittivity. The real dielectric permittivity of virgin material was increased from 3.75 to 5.06 with the addition of 10 wt% of BT measured at 10 Hz. Due to the high polarization capability of BT, the addition of BT in SEBS-g-MA shows the increase in the real dielectric permittivity of the overall composite in all cases. 25 Orientation, shape, and dispersion of high dielectric additives in the polymer matrix define the resultant dielectric developed the nanocomposite. 26 It is suggested that the enhancement of real dielectric permittivity of nanocomposites is the result of interfacial polarization existing between the polymer matrix and the additive particles. 27 –30
Similar to the total dielectric permittivity, the real dielectric permittivity of virgin SEBS (2.9 at 10 Hz) also increases with an increase in BT up to a certain percentage (3.84 at 10 Hz with 5 wt% of BT) and decreases at higher concentrations (type 10 wt%) (2.84 at 10 Hz) . The decrease in dielectric permittivity is probably due to the poor interaction between nonpolar SEBS and highly polar BT additives. This type of effect is also found in different epoxy composites by Patsidis et al. 31 and Zhang et al. 25 However, the attachment of a MA polar molecule enhances the real dielectric permittivity of SEBS even at a higher concentration as shown in Figure 2. This negative change in dielectric permittivity is not observed when the compatibility is increased between SEBS and BT by attachment of polarizing molecule MA as shown in Figure 2 and Table 1. Similarly, Stoyanov, 3 and Yang and Kofinas 32 also found that the dielectric permittivity increased with an increase in TiO2 content making SEBS compatible to the additives. This result shows the role of the interaction between additives and polymer molecule for the enhancement of dielectric permittivity. The increase in dielectric permittivity with low dielectric loss optimizes the electroactive properties of different elastomers, thereby increasing the potential of these elastomers to be used for strain/stress sensors, capacitive energy generators, artificial muscles, and flexible charge storing capacitors. The enhanced dielectric permittivity of elastomers composites is a crucial factor for electroactive applications. Mechanical properties (such as Young’s modulus and loss factor) and viscoelastic properties are also equally important to determine stiffness, flexibility, hysteresis loss, and stability of such composites during their uses.
Table 2 shows the secant Young’s modulus of different nanocomposites at various strain rate. There was no substantial effect in secant Young’s modulus with the addition of additives to elastomers to 1% strain (ca. 100 MPa and 45 for SEBS and SEBS-g-MA composites, respectively), but the modulus of SEBS and SEBS-g-MA increases with the increase of BT percentage at the higher extension (3.5MPa, 2.9MPa, 3.9MPa, and 3.2 MPa for SEBS, SEBS-g-MA, SEBS with 10 wt% BT, and SEBS with 10 wt% BT, respectively at 150% strain).
Secant Young’s modulus of nanocomposites with different stain percentage of BT and percentage change in Young’s modulus (% Δ) with respect to virgin polymer.
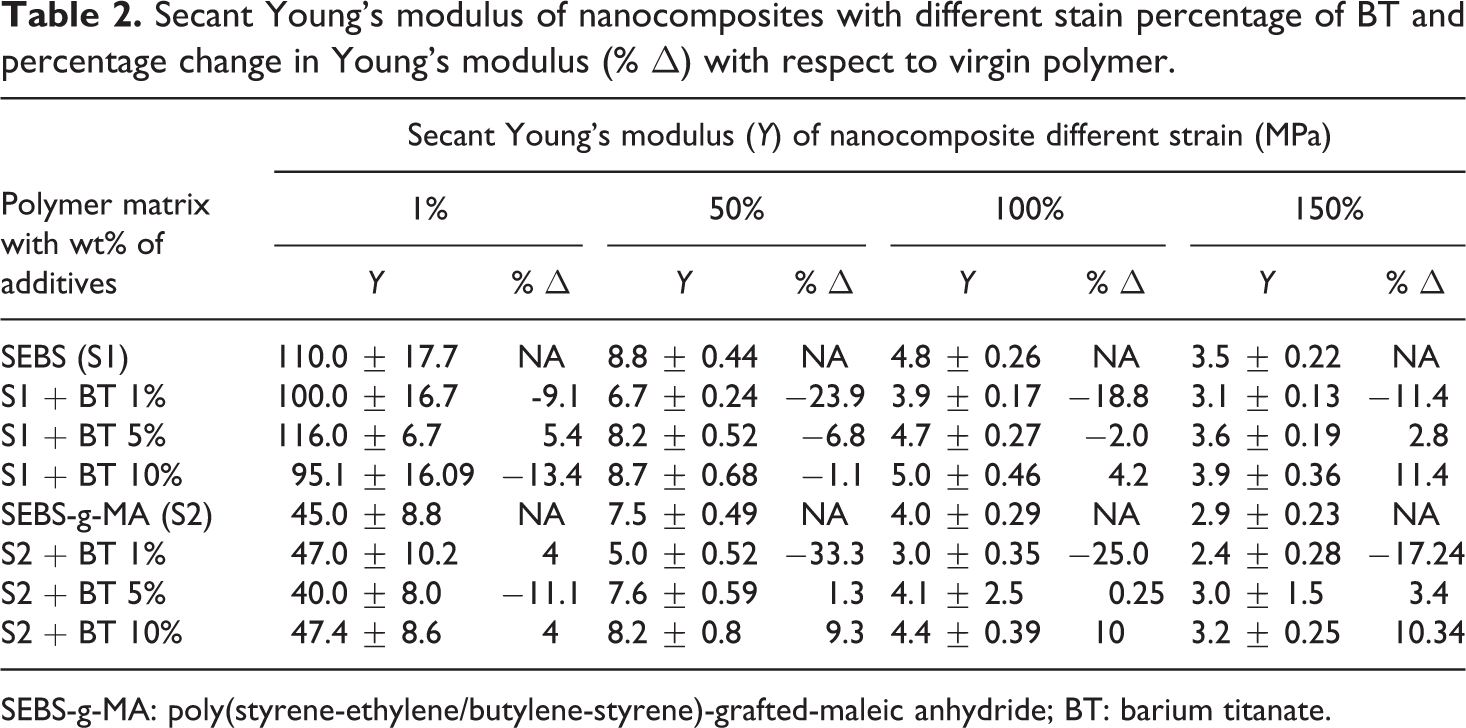
SEBS-g-MA: poly(styrene-ethylene/butylene-styrene)-grafted-maleic anhydride; BT: barium titanate.
Figures 3 and 4 show the tensile profile of SEBS and SEBS-g-MA with BT, respectively. The stress was measured up to 200% strain for all samples. All samples of both composites were found to be highly elastic with no breakage till the measured elongation. In both composite types, curves consist of a linear region or an elastic region, a necking point, a drawing region and again a linear region at all concentration of modifiers. The stretching of the necking region also known as natural draw ratio is hardly seen in both composite types but it prevails in most experiments as it is a function of temperature and processing parameters. 33 Unlike most of the plastic materials, thermoplastic elastomers continue to extend linearly after necking of tensile samples and still possess elastic property. It is because of the fact that the necking produces stronger microstructure leading to the higher amount of energy or stress required for breakage. 33
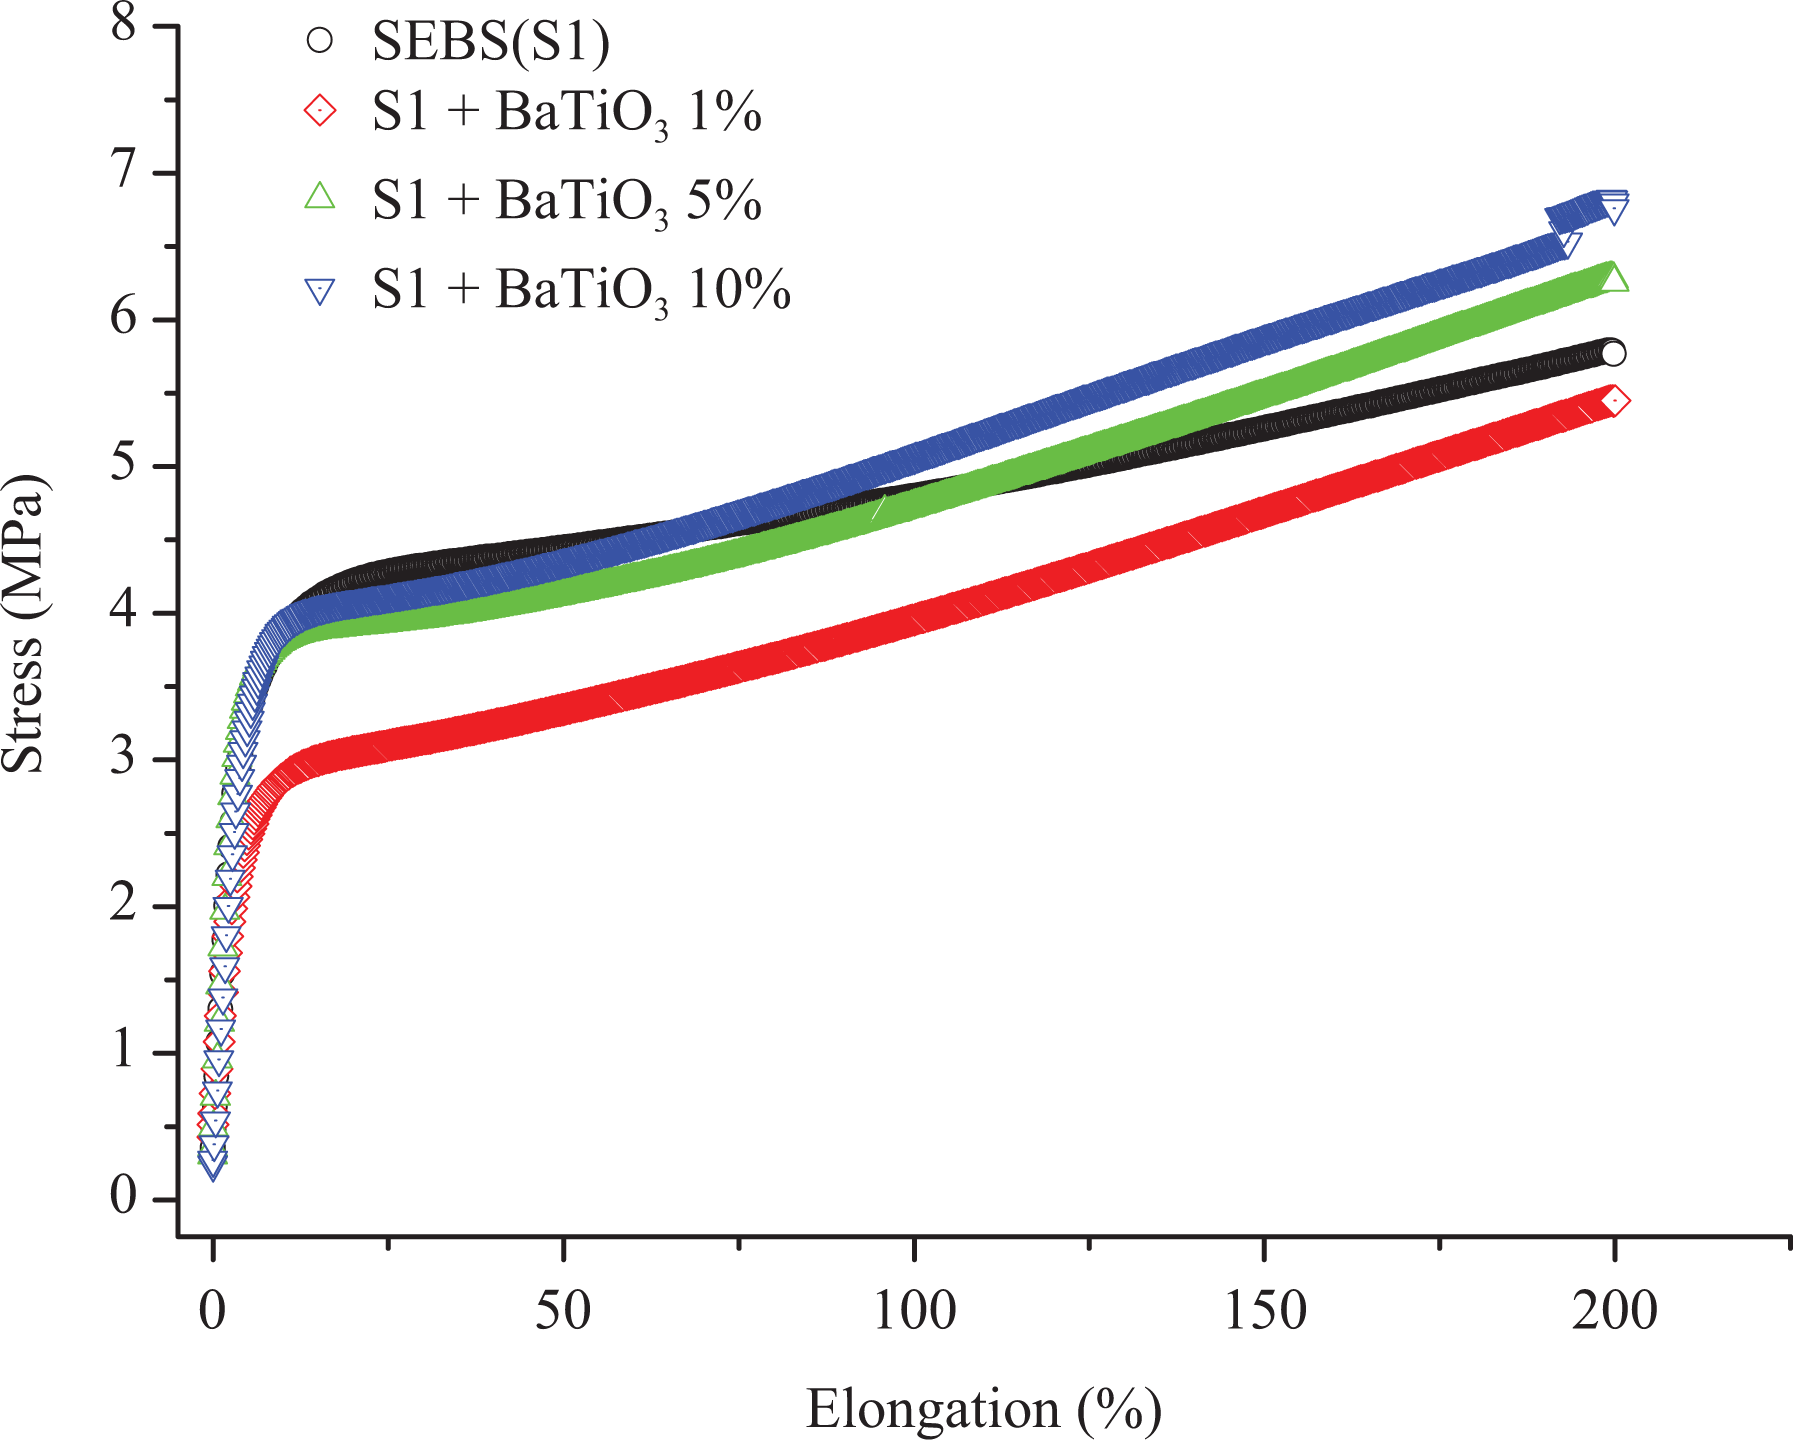
Tensile properties of SEBS with BT.
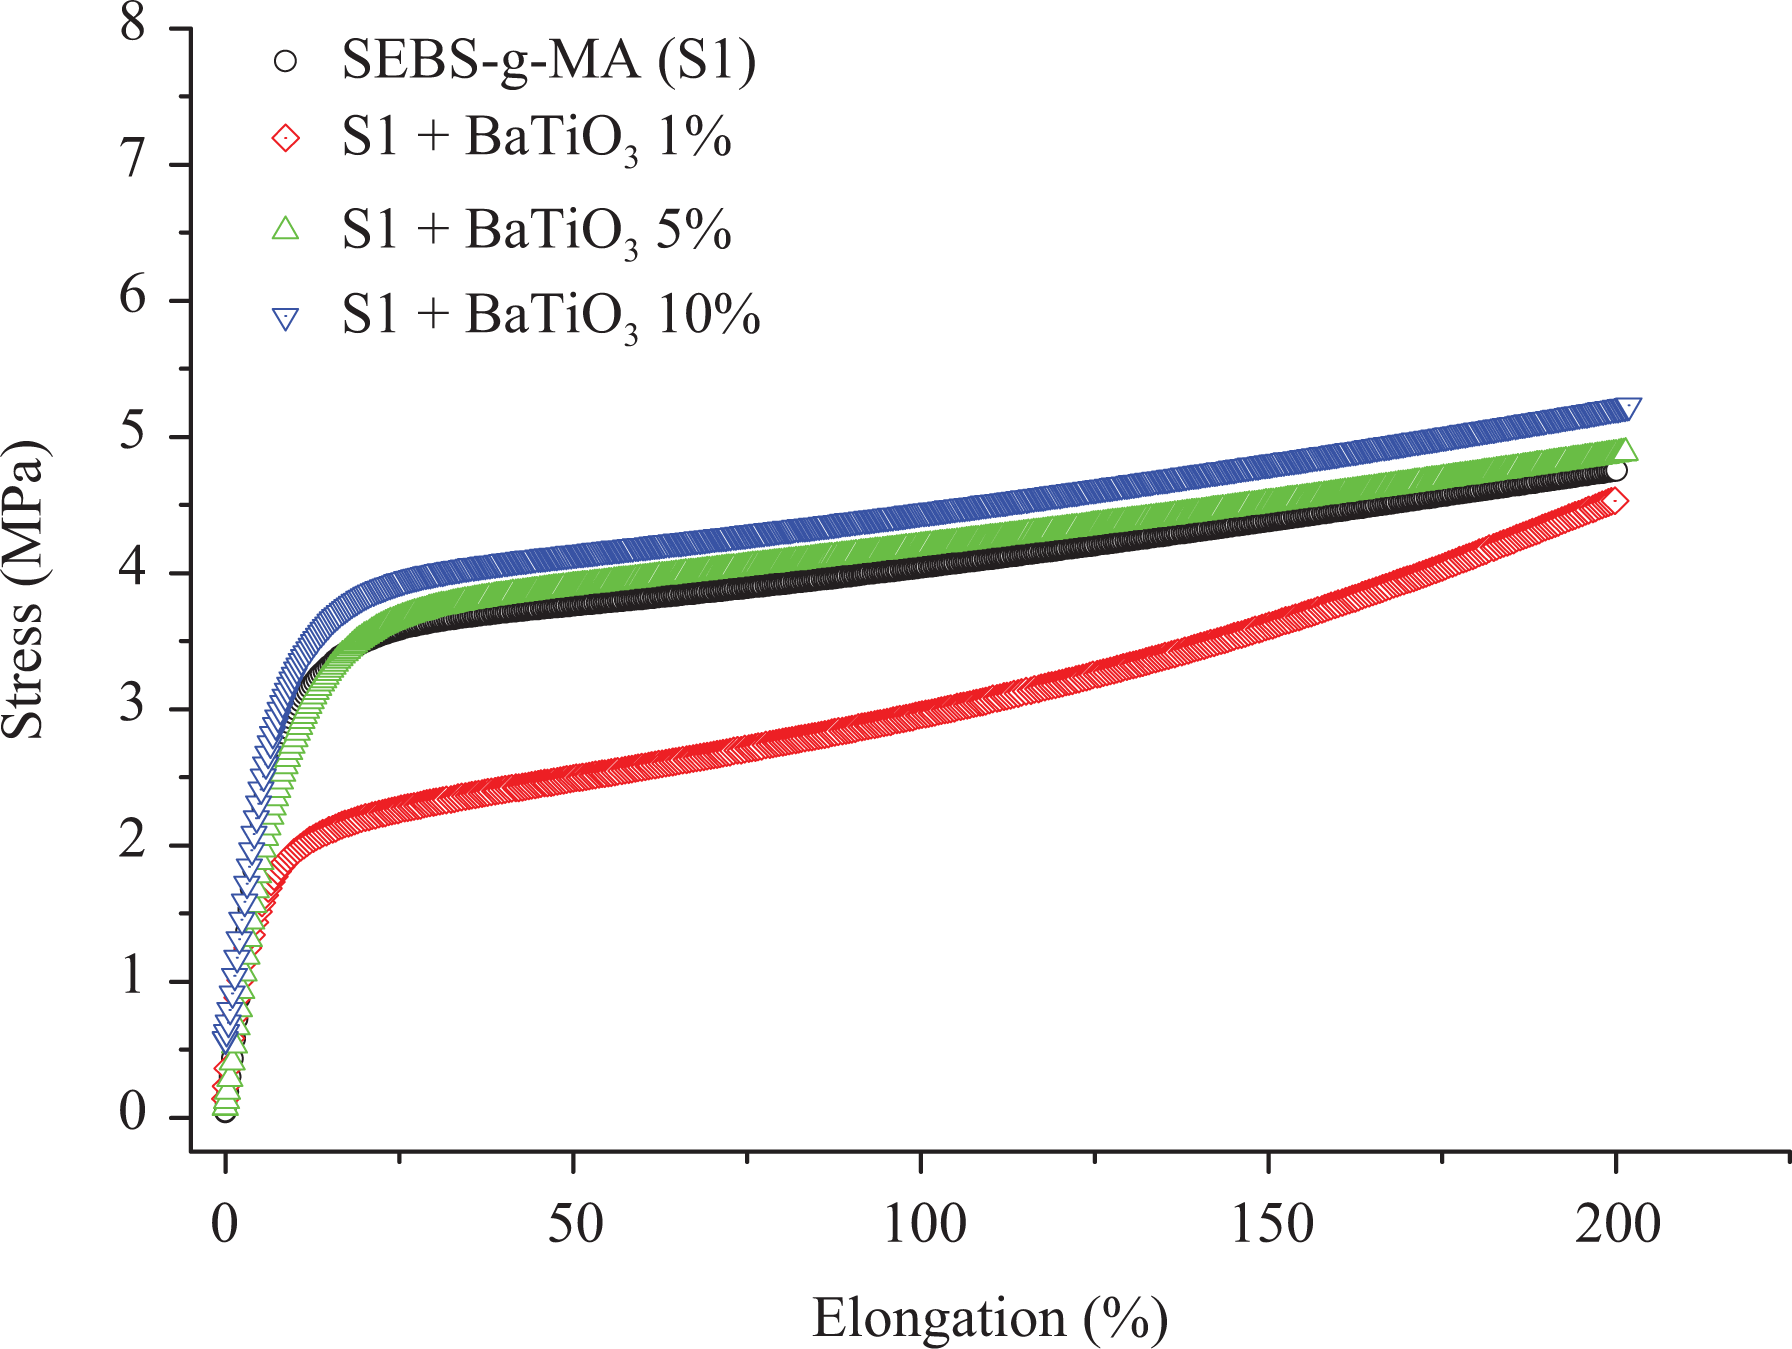
Tensile properties of SEBS-g-MA with BT.
The modulus of resilience is defined as energy absorbed by the material below its yield point. No significant difference was observed in resilience with the addition of 5 wt% and 10 wt% BT, however, the modulus of resilience was found to decrease upon addition of 1 wt% BT for both polymer matrices. The decrease in modulus of resilience at low concentration of BT can be defined based on the orientation of additives. The orientation of BT additives is not along the direction to the axis of screw speed at which tensile measurement of the extrudate was taken, however, at a high percentage of BT, the mechanical interlocking effects of additives are also seen along the tensile measurement axis giving almost the same modulus of resilience. The energy observed between yield point and breakage defines the modulus of toughness of the material. From Figure 3, the addition of 5 wt% and 10 wt% BT increases the modulus of toughness of SEBS but not in the same fashion as 5% and 10 wt% of BT in SEBS-g-MA as shown in Figure 4. SEBS and SEBS-g-MA with 1 wt% of BT show a low toughness compared to pure SEBS and SEBS-g-MA, respectively, but this result might be altered if the material is extended to the breaking point as the slope gradient of SEBS as well as SEBS-g-MA with 1 wt% of BT is higher after the yield point of virgin SEBS and SEBS-g-MA respectively which can be seen from Table 2. The percentage change in Young’s modulus of SEBS-g-MA with 1 wt% of BT with respect to unfilled SEBS-g-MA was found to change significantly from 33.2% to 17.3% when measured at 50% of strain and 150% strain, respectively. However, SEBS at all concentrations of BT show low values of stress to strain ratio at 50% strain than a virgin SEBS suggests a higher drawing region which may be due to lack of reinforcement and low compatibility of SEBS with BT as shown in Table 2, but this effect is not observed in SEBS-g-MA. However, the overall result suggest poor miscibility of BT (at 5 wt% and 10 wt%) on SEBS when using the current processing configuration described. Generally, manufacturing of highly flexible dielectric composites has huge potential for electroactive applications. However, the incompatibility between additive and elastomer leads to poor mechanical and electrical performance making them not suitable for electroactive applications, which requires continuous mechanical and electrical deformation.
Figure 5 shows the loss factor of different composites under each cycle. The loss factor was found to be 1.40, 1.60, 1.45, and 1.44 for SEBS-g-MA, SEBS-g-MA with 1 wt% BT, SEBS-g-MA with 5 wt% BT, and SEBS with 10 wt% BT, respectively versus 1.15, 1.75, 1.1, and 1.0 for SEBS, SEBS with 1 wt% BT, SEBS with 5 wt% BT, and SEBS with 10 wt% BT, respectively. According to Cantournet et al., 34 the extension of elastomers occurs due to sliding (after the elastic limit) and nonsliding action (within elastic limit in the first cycle) between hard and soft blocks. This condition is also observed during the unloading condition. The loss of stiffness during cyclic testing after the first cycle results in stress softness behavior 34 leading to a low loss in consecutive cycles as shown in Figure 5. This stress hysteresis or stress softening behavior was first described by Mullins and is known as Mullin’s effect. 35 Due to stress softening effect of dielectric thermoplastic elastomers nanocomposites, the loss factor decreases to minimum by the factor 3 from first to the second cycle in all cases. Upon addition of 1 wt% of BT, the loss factor is highly increased in all cycle due to high mechanical interlocking. However, this effect was hindered as the percentage of BT was increased due to the formation of agglomerations. In SEBS with 10 wt% BT, the loss factor was found to be lower than virgin SEBS almost for all cycle. It is because of lack of interaction between BT and SEBS and agglomeration of BT in SEBS during the manufacturing procedure. Although this result seems better for electroactive applications, agglomeration of BT hinders overall polarization effects of composites as well as makes it mechanically unstable with time. However, SEBS-g-MA shows improved interaction with BT leading to the better dispersion of BT and a continuous loss factor at all concentrations due to the presence of the polar MA molecule.
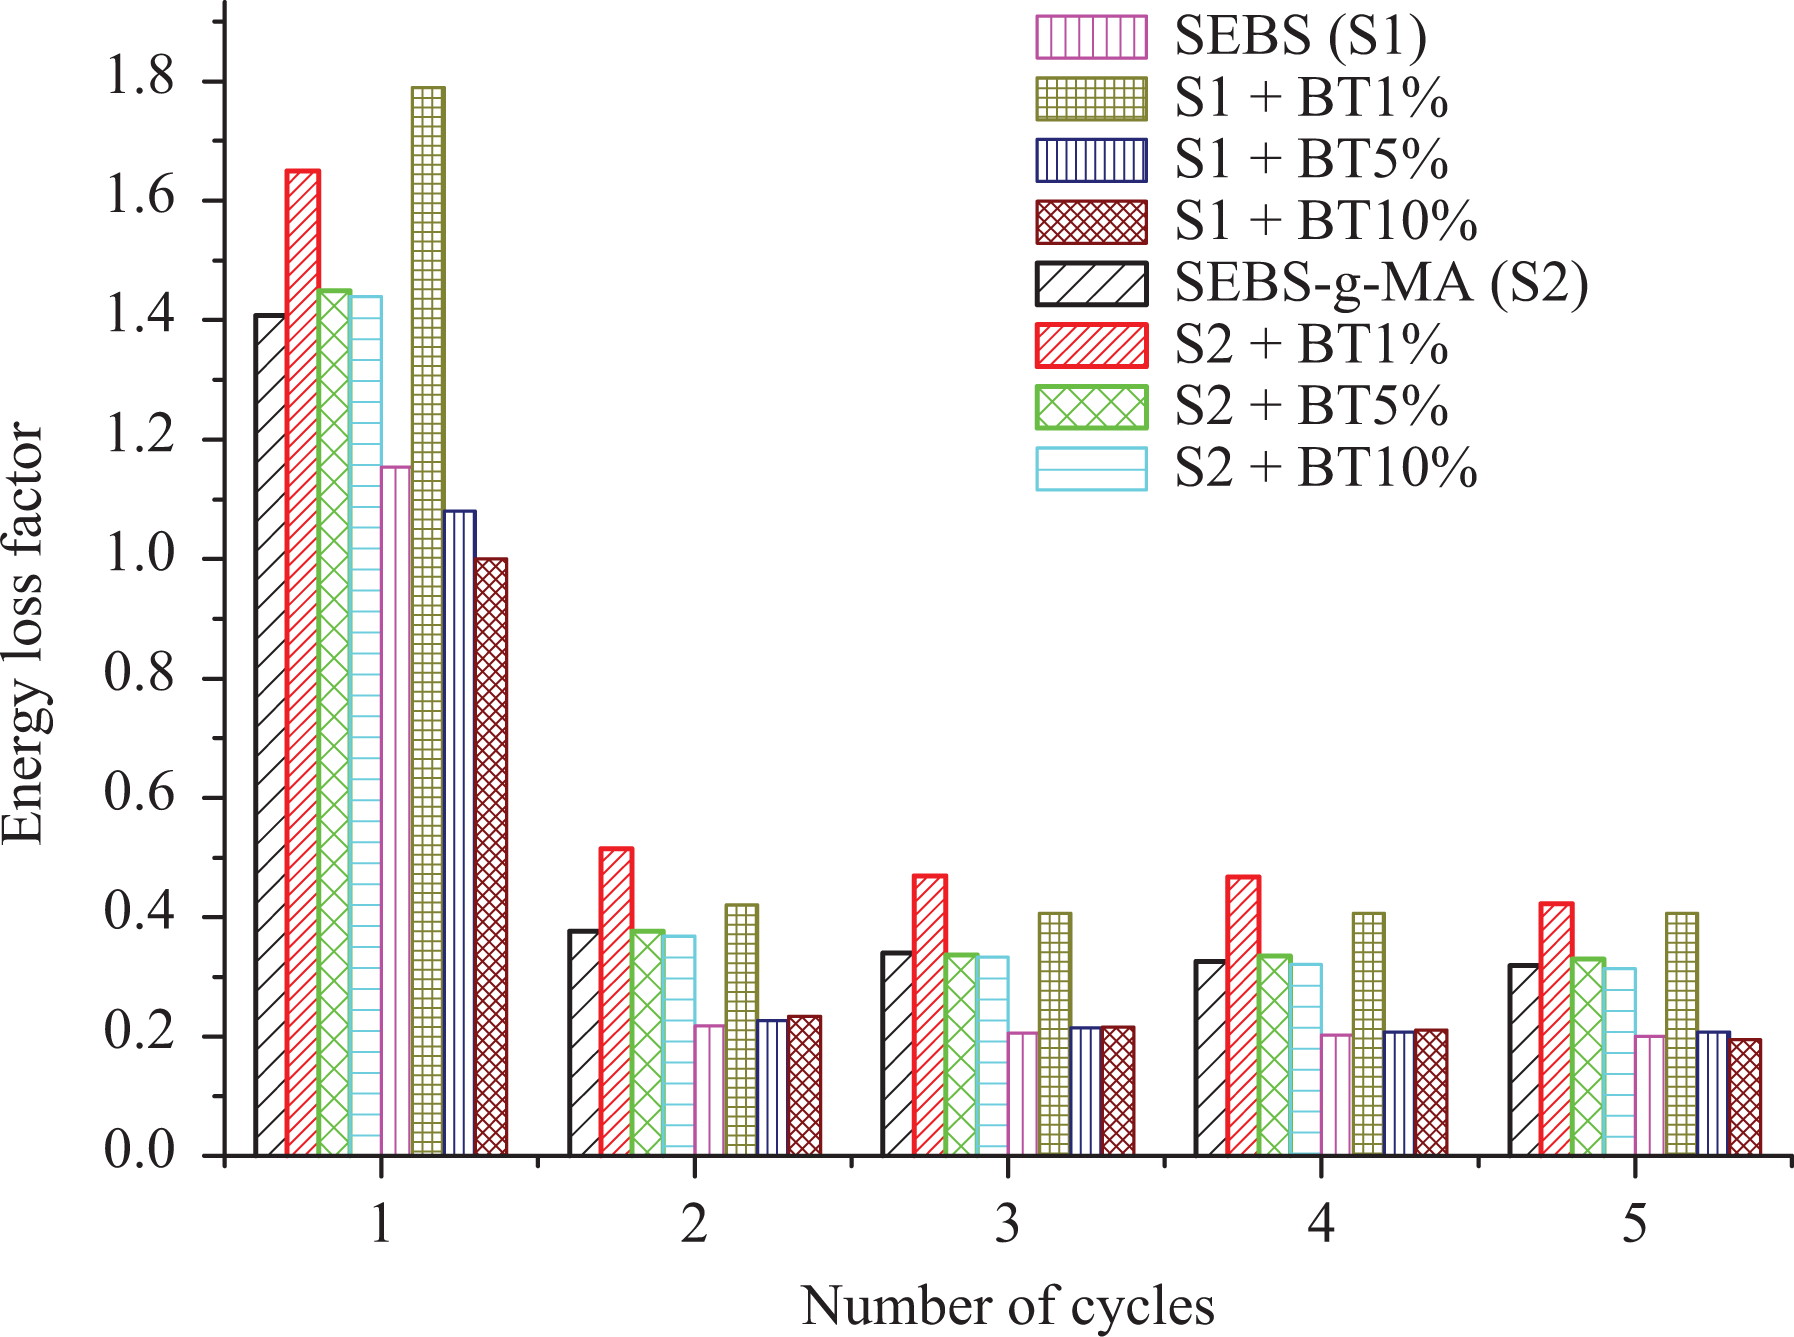
Loss factor for each cycle of different composites presented with different colors.
Table 3 shows storage modulus, loss modulus and tan δ of SEB and SEBS-g-MA with BT measured at a test frequency of 1 Hz and temperature of 31°C in transverse and parallel direction to the axis of screw rotation.
Storage modulus (G′), Loss modulus (G″) and tan δ of nanocomposites measured at a test frequency of 1 Hz and temperature of 31°C BT and percentage change of the same (% Δ) with respect to virgin polymer.
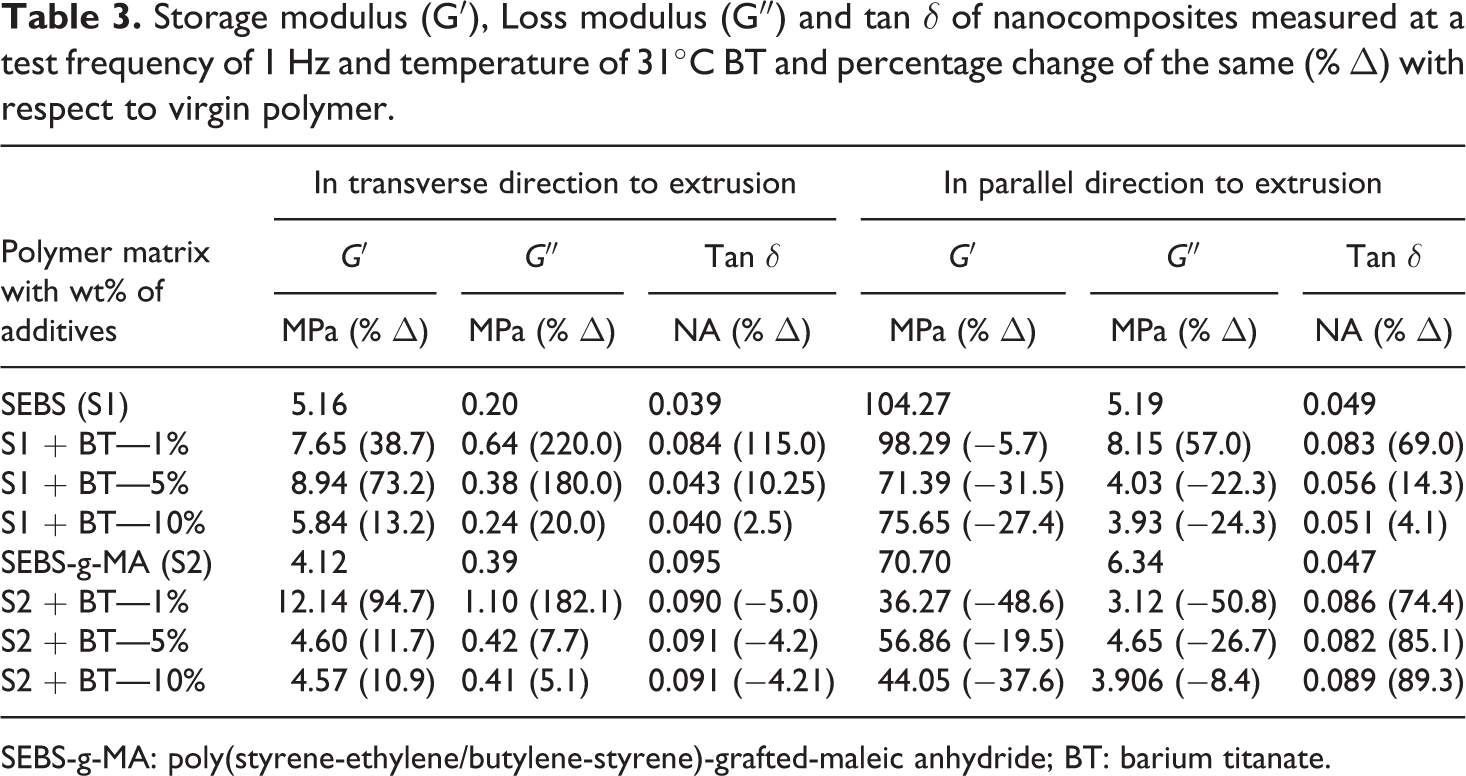
SEBS-g-MA: poly(styrene-ethylene/butylene-styrene)-grafted-maleic anhydride; BT: barium titanate.
In the transverse direction of the extrusion, BT showed an increase in moduli and tan δ in both SEBS and SEBS-g-MA based nanocomposites.
Unlike the high increase in storage modulus and loss modulus observed in the transverse direction, the addition of BT was found to decrease both the moduli of the nanocomposites in the parallel direction except for loss modulus (8.15 MPa) of SEBS with 1 wt% BT versus 5.19 MPa for virgin SEBS. The decrease with both moduli observed is due to the presence of low shear stress and high draw ratio due to rollers along the axis of screw rotation during extrusion. The reinforcing effect increases with an increase in the amount of BT from 1 wt% (storage modulus was 36.27 MPa) to 5 wt% (storage modulus was 56.86 MPa) with SEBS-g-MA and storage modulus remains comparable with the addition of 10 wt% of BT (44.05 MPa). However, the storage modulus of SEBS decreases when the wt% of BT was increased from 1% (98.29 MPa) to 5% (71.39 MPa) and remains considerably low (75.65MPa) with addition of 10 wt% BT. In addition, the decrease in the value of tan δ of SEBS-g-MA from 0.95 to 0.91 was observed in a transverse direction with the addition of 5 wt% and 10 wt% BT fillers. In contrary, this effect was not observed in SEBS composites, where the value of tan δ remains above 0.4 (vs. 0.39 for virgin SEBS) polymer with addition of any concentration of BT. This result also suggests higher compatibility and dispersion of BT fillers with SEBS-g-MA matrix compared to SEBS matrix. Compatibility between a filler and a polymer matrix is a crucial parameter for sustainable electrical and mechanical property for an electroactive application.
Generally, with the addition of additives to elastomers, they tend to change the stiffness of the material at higher temperatures when they are measured at low strain conditions using DMA. On the other hand, the addition of BT did not improve the storage modulus of SEBS at high temperature as shown in Figure 6. In addition to this, the molecular motion of SEBS starting around 40°C rise in a similar fashion to higher temperature till 90°C upon addition of a different percentage of BT shown in Figure 7. Moreover, the peak of tan δ also remains almost constant at all concentrations of BT as shown in Figure 8.This suggests very less interaction or no interaction between nonpolar SEBS with highly polar BT dielectric filler.
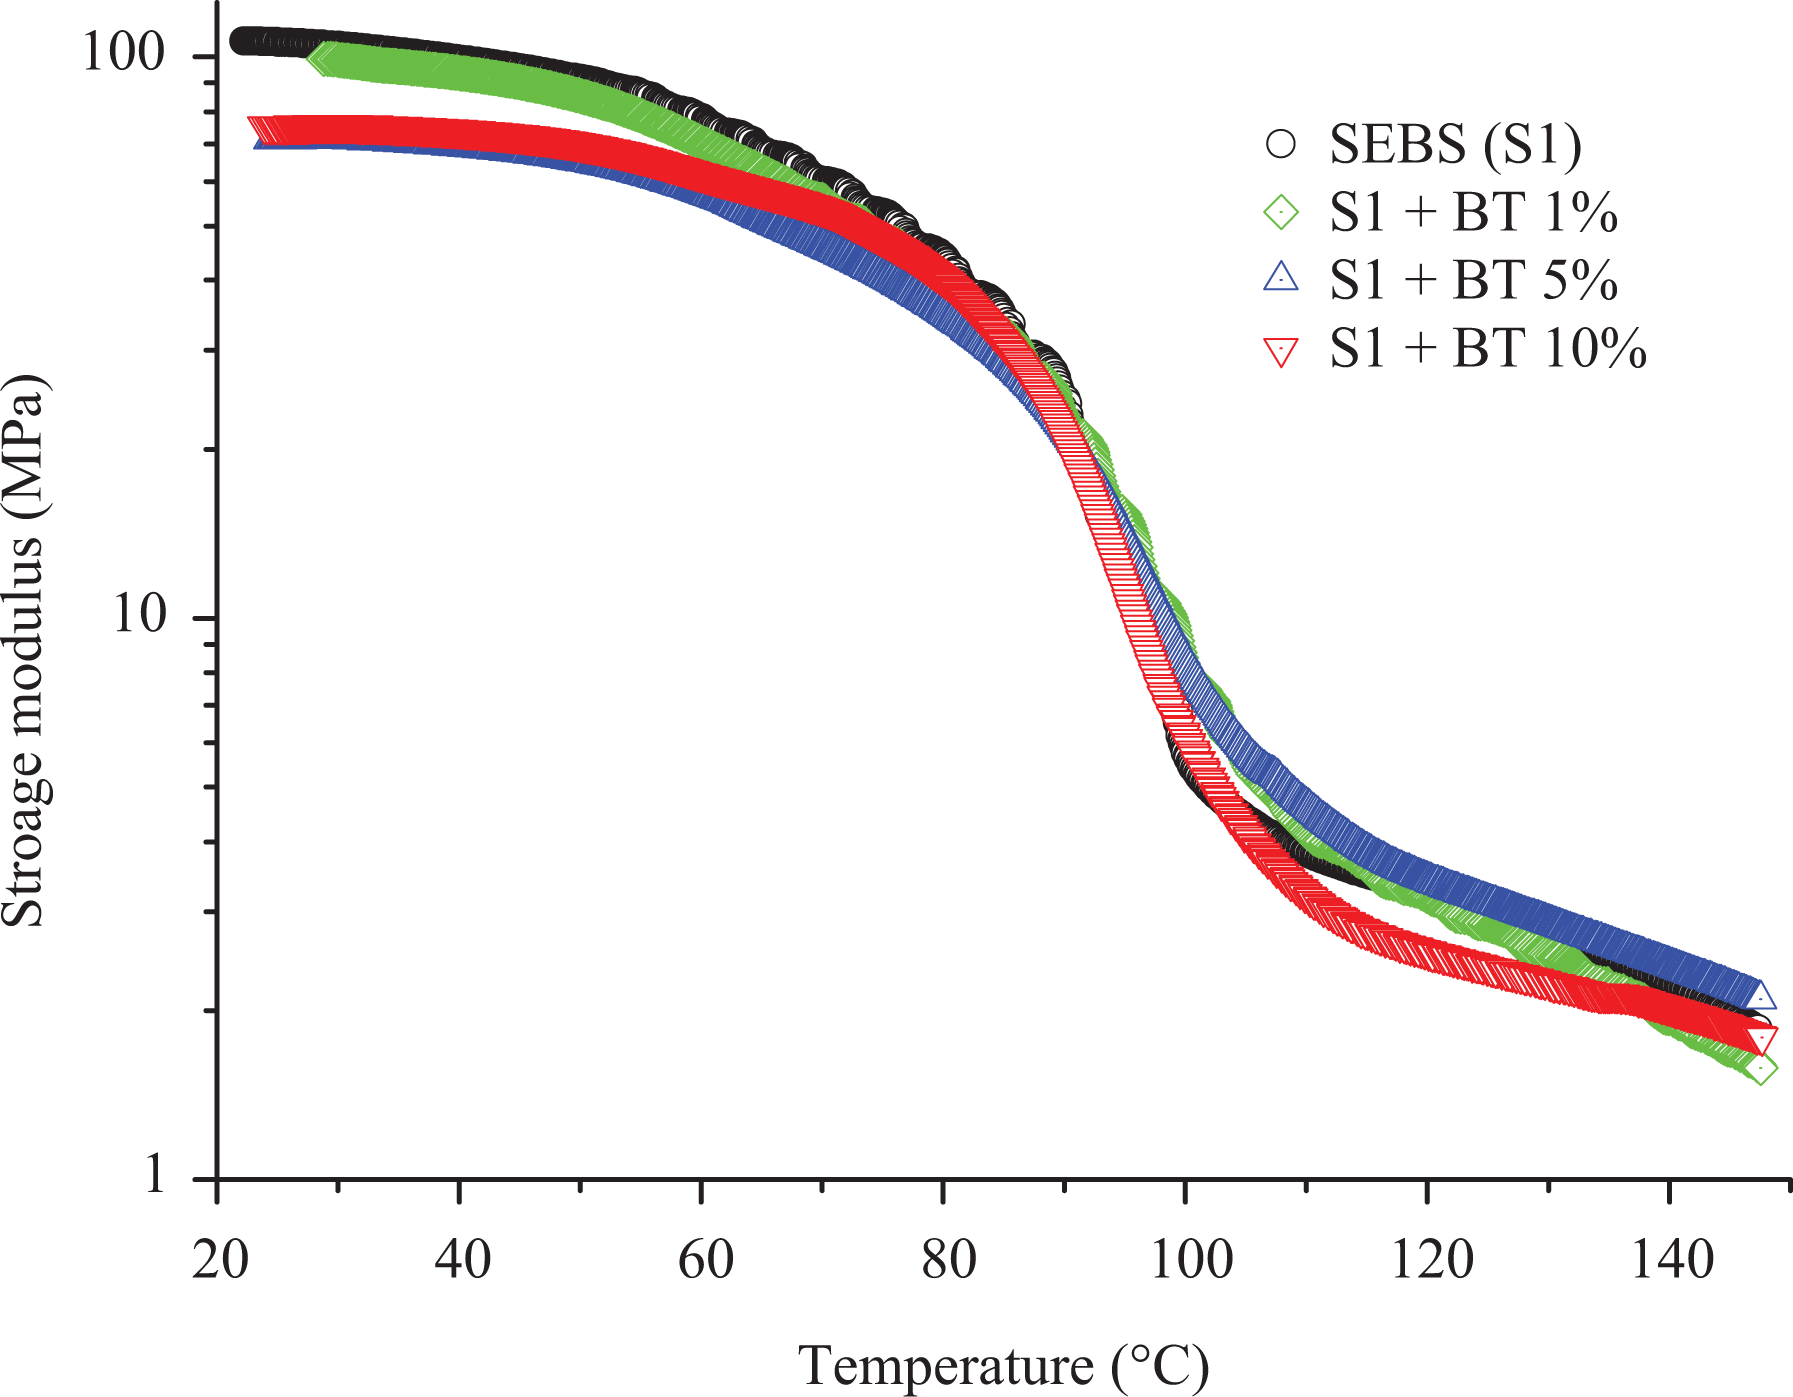
Storage modulus of SEBS (S1)/BT composites presented with different colors.
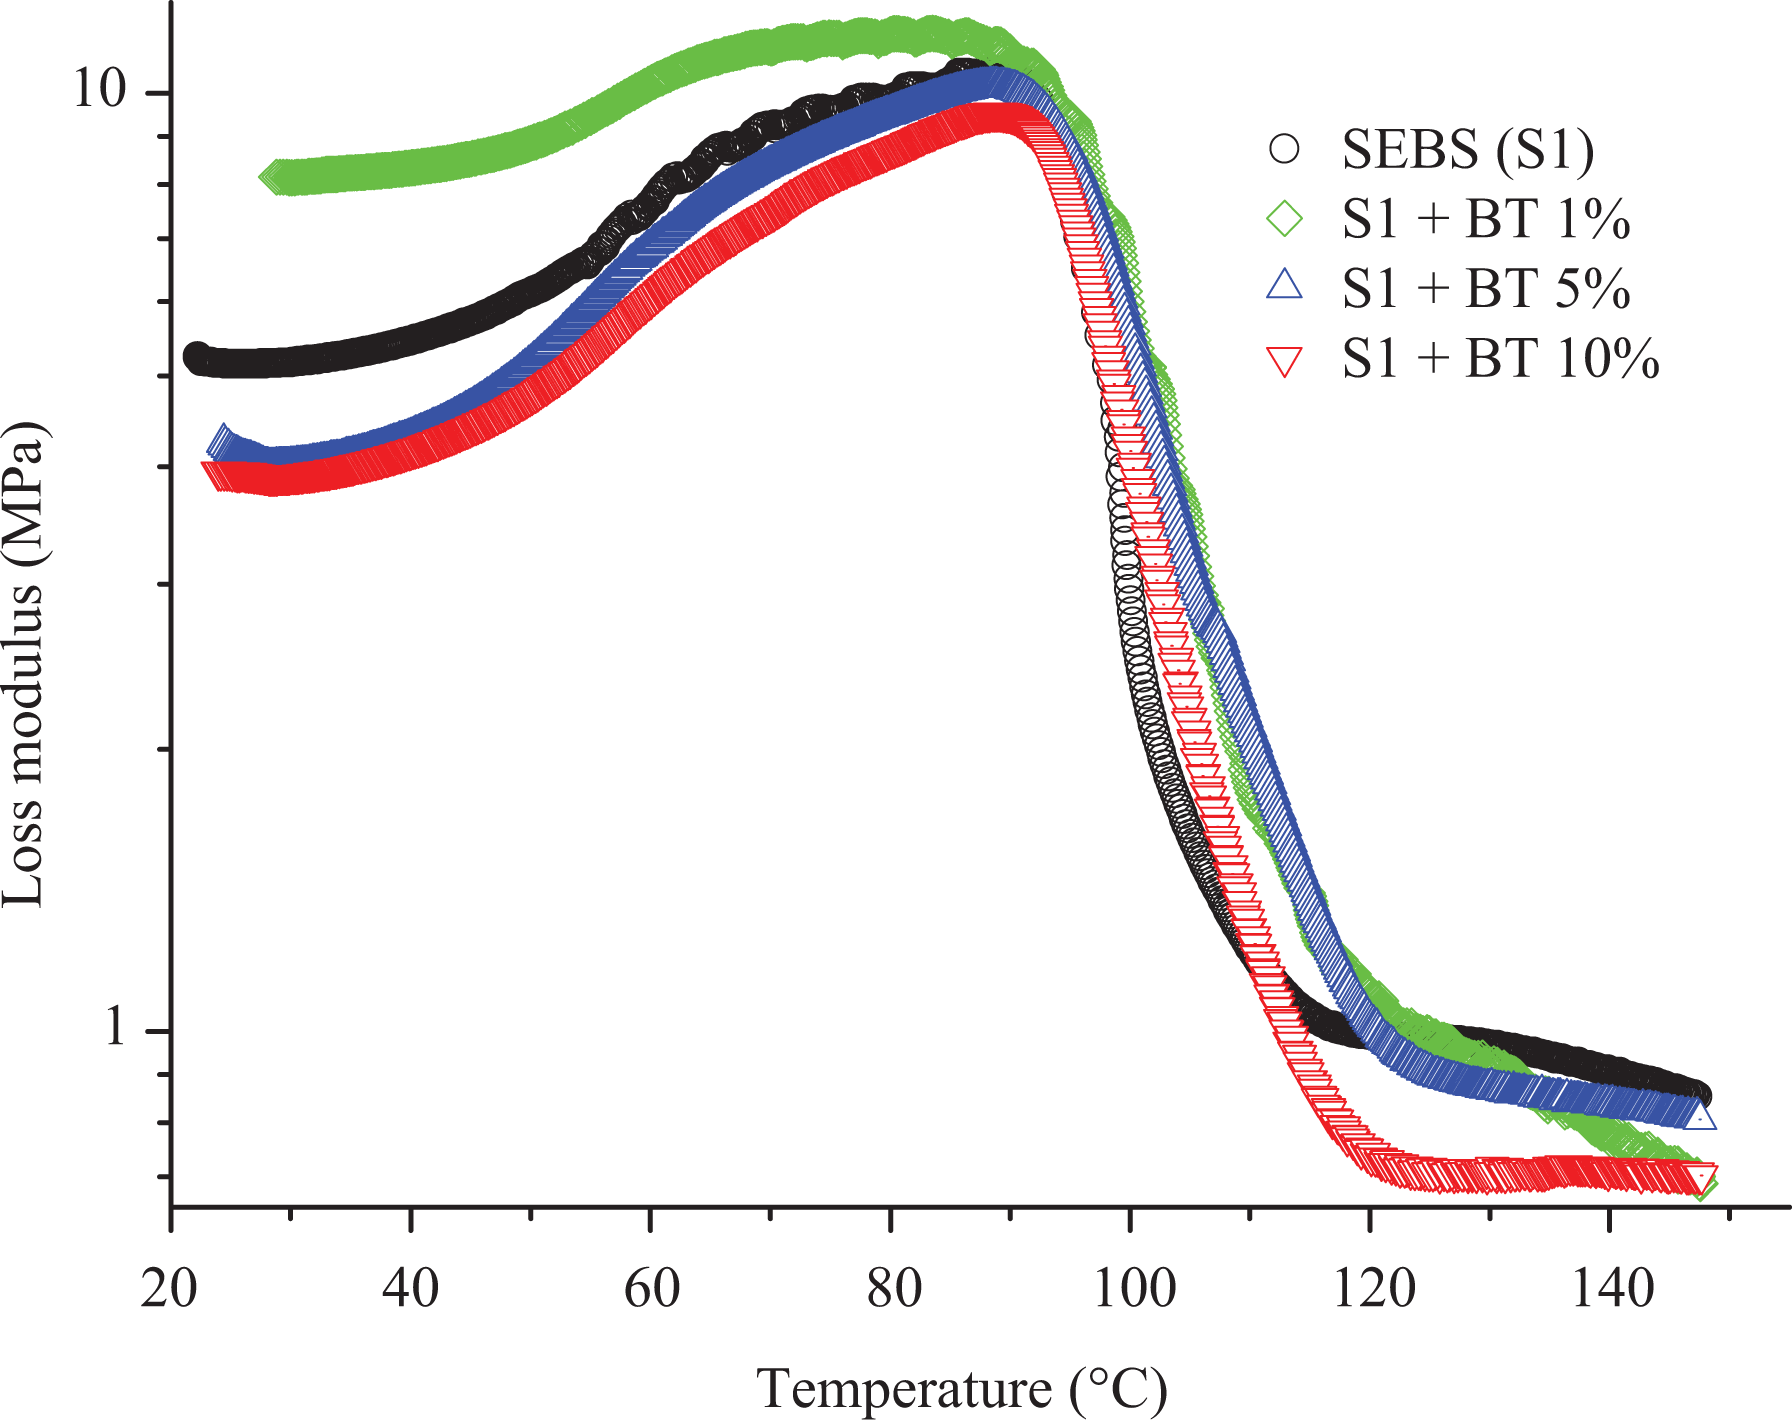
Loss modulus of SEBS (S1)/BT composites presented with different colors.
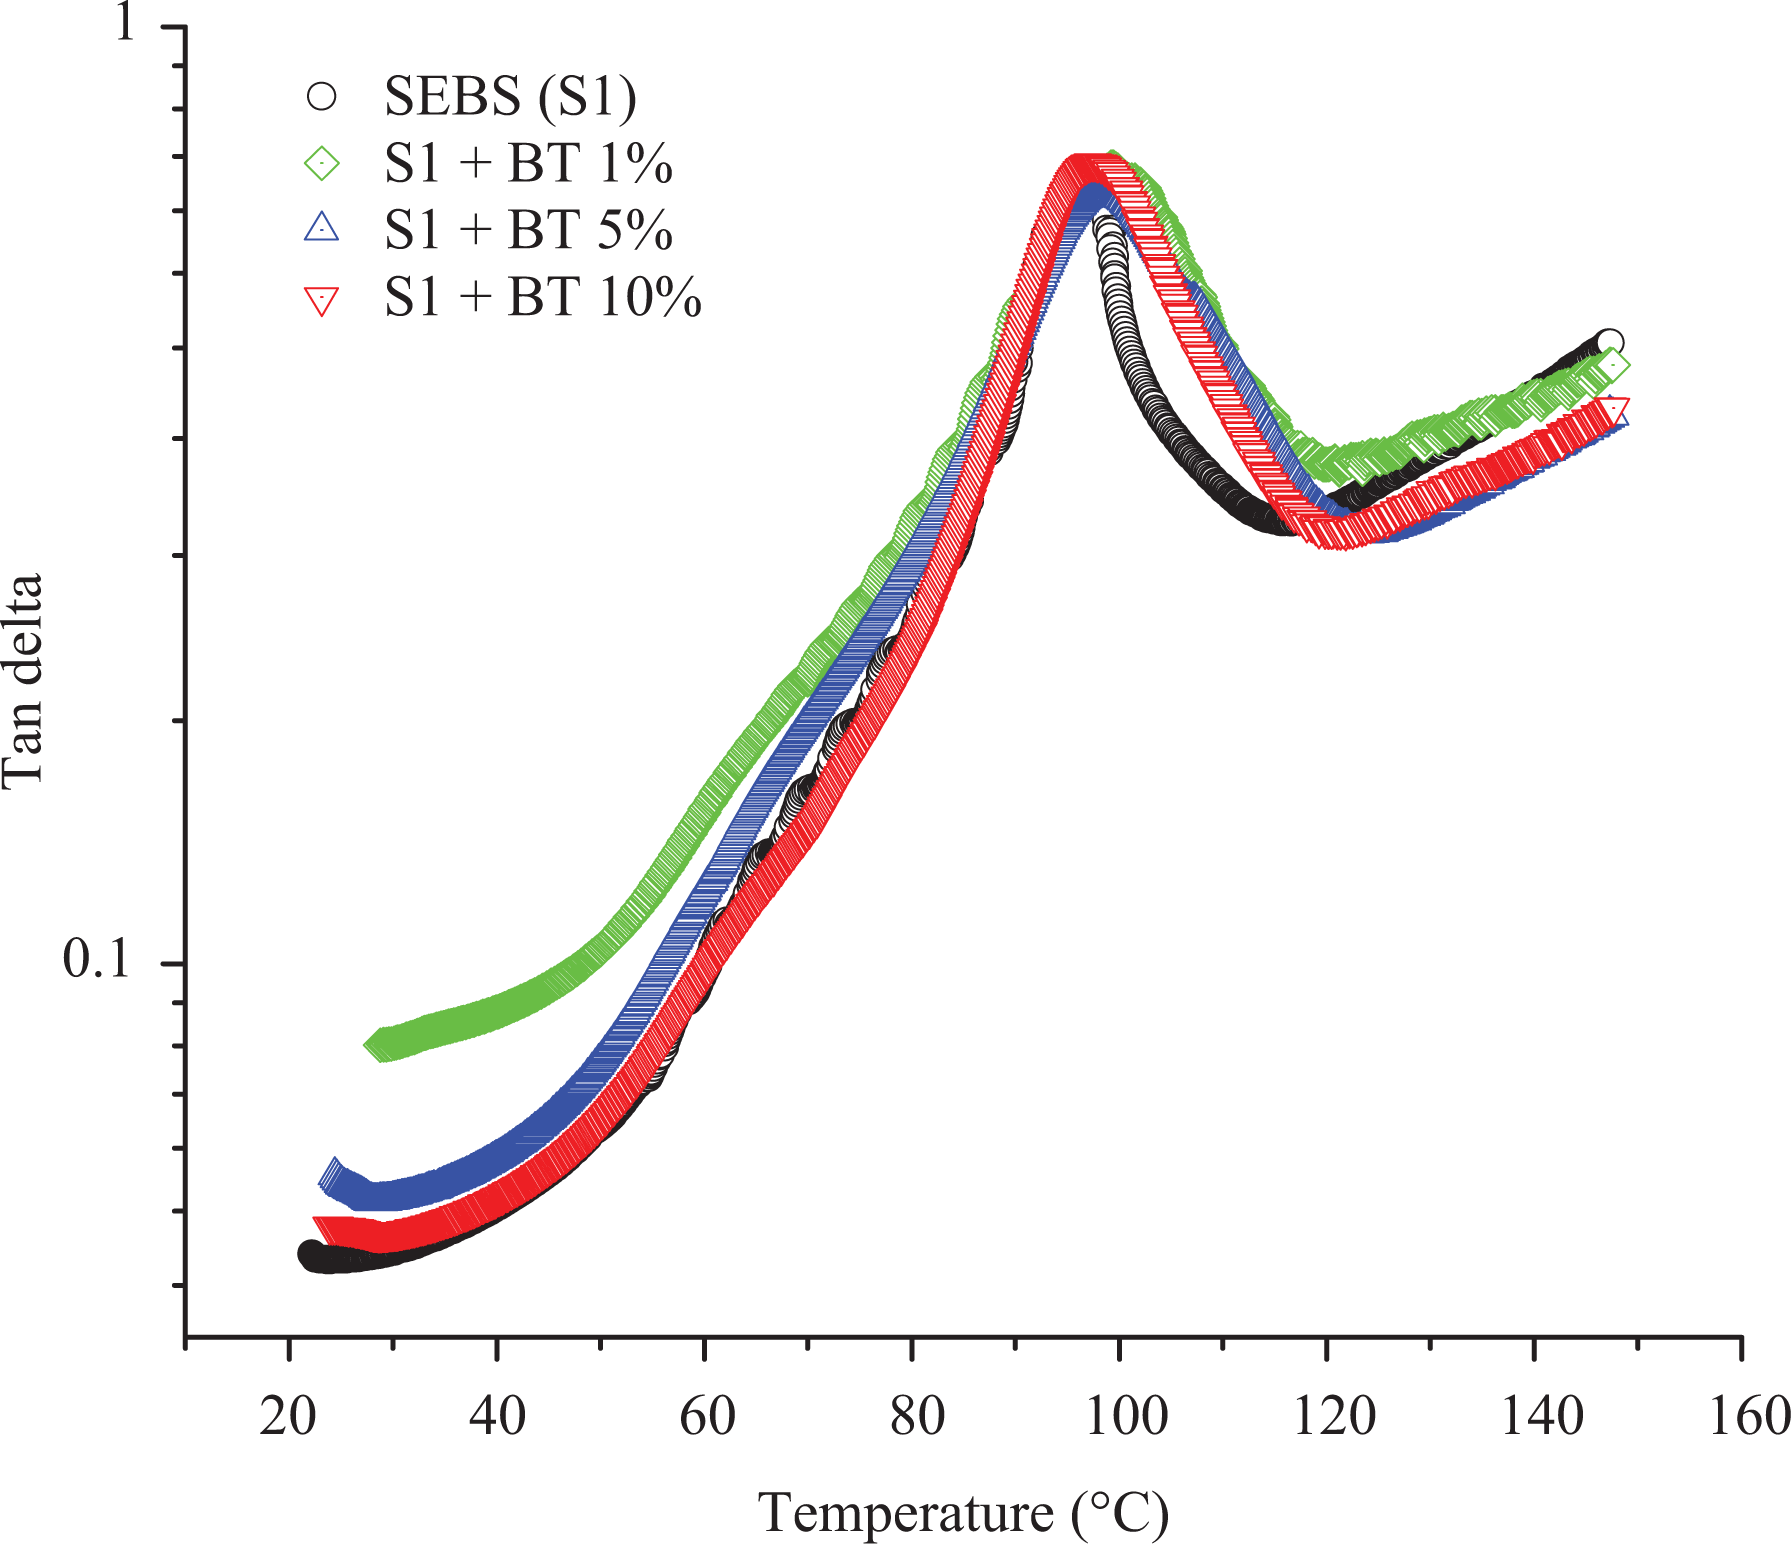
Tan δ of SEBS (S1)/BT composites presented with different colors.
Wang 36 used a concept of surface energy to describe the dispersion of additives in a rubber matrix either in the form of aggregates or agglomerates. He used a kinetic model as described in equation (3).

where Δw is the change in adhesion energy, waa is the adhesive energy between additive-additive particles, wpp is the adhesive energy between the polymer–polymer molecule, and wap is the adhesion energy between additive and polymer. According to the Wang’s model, when Δw = 0, additives once dispersed don’t form agglomerates. if Δw > 0, the aggregates form agglomerates once they are totally dispersed in thermoplastic elastomers. Finally, if Δw < 0, the aggregates have a high tendency to disperse in the polymer matrix. 37
Wang equation suggests that the value of Δw should be either equal to 0 or greater than 0 when BT is dispersed into SEBS matrix leading to poor dispersion ability. A better manufacturing procedure (such as the use of supercritical CO2 assisted extrusion) allowing better dispersion of additives into polymers can sometimes readily solve the issue faced in this context. 38 –41 If the Δw is positive and high enough, other techniques like a molecular modification of SEBS (such as the attachment of MA with SEBS) will lead to the better dispersion ability of BT in the polymer.
The SEBS-g-MA-BT composites show different behavior compared to SEBS-BT composites based on the storage modulus, loss modulus, and tan δ. Figure 9 shows the storage modulus of SEBS-g-MA-BT nanocomposites. The stability or elastic property of SEBS-g-MA-BT nanocomposites increases with an increase in BT content at a higher temperature making it more thermal resistive. Loss modulus shows a high increase in the width of the peak of loss modulus with an increase in BT. Generally, a broad peak of loss modulus represents the higher damping behavior of the material. 42 However, in the case of Figure 10(a) broad peak is not due to the higher molecular motion between two segments rather it is because of resistance to molecular movement between segments at higher temperatures due to the high interaction between polar MA molecule of SEBS-g-MA and highly polar dielectric filler BT. Due to the reinforcing nature and high interaction of compatible BT additives, molecules of SEBS-g-MA show only low molecular movement at higher temperature thereby lowering the loss modulus value when measured using DMA under low strain condition. Because of a hindrance in molecular movement at a higher temperature when measured at low strain conditions in DMA, the peak appears to be broad rather than a narrow peak. SEBS-g-MA/BT composites show a broader peak compared to virgin SEBS-g-MA as shown in Figure 11. In addition, Figure 11 also shows a low value of tan δ with the addition of BT fillers at all range of the measured temperatures. This result also suggests that the material is still a low loss material although the amount of BT was increased. A temperature shift in the peak of the tan δ was observed on SEBS-g-MA upon addition of BT. This effect is likely due to an absolute change in storage and loss modulus under low strain conditions as shown in Figures 9 and 10. Some authors suggest that these changes observed on the tan δ transition peaks are due to the addition of additives, 43 whereas some suggest a change in time-dependent relaxation of polymers molecules due to the effect of additives. 44
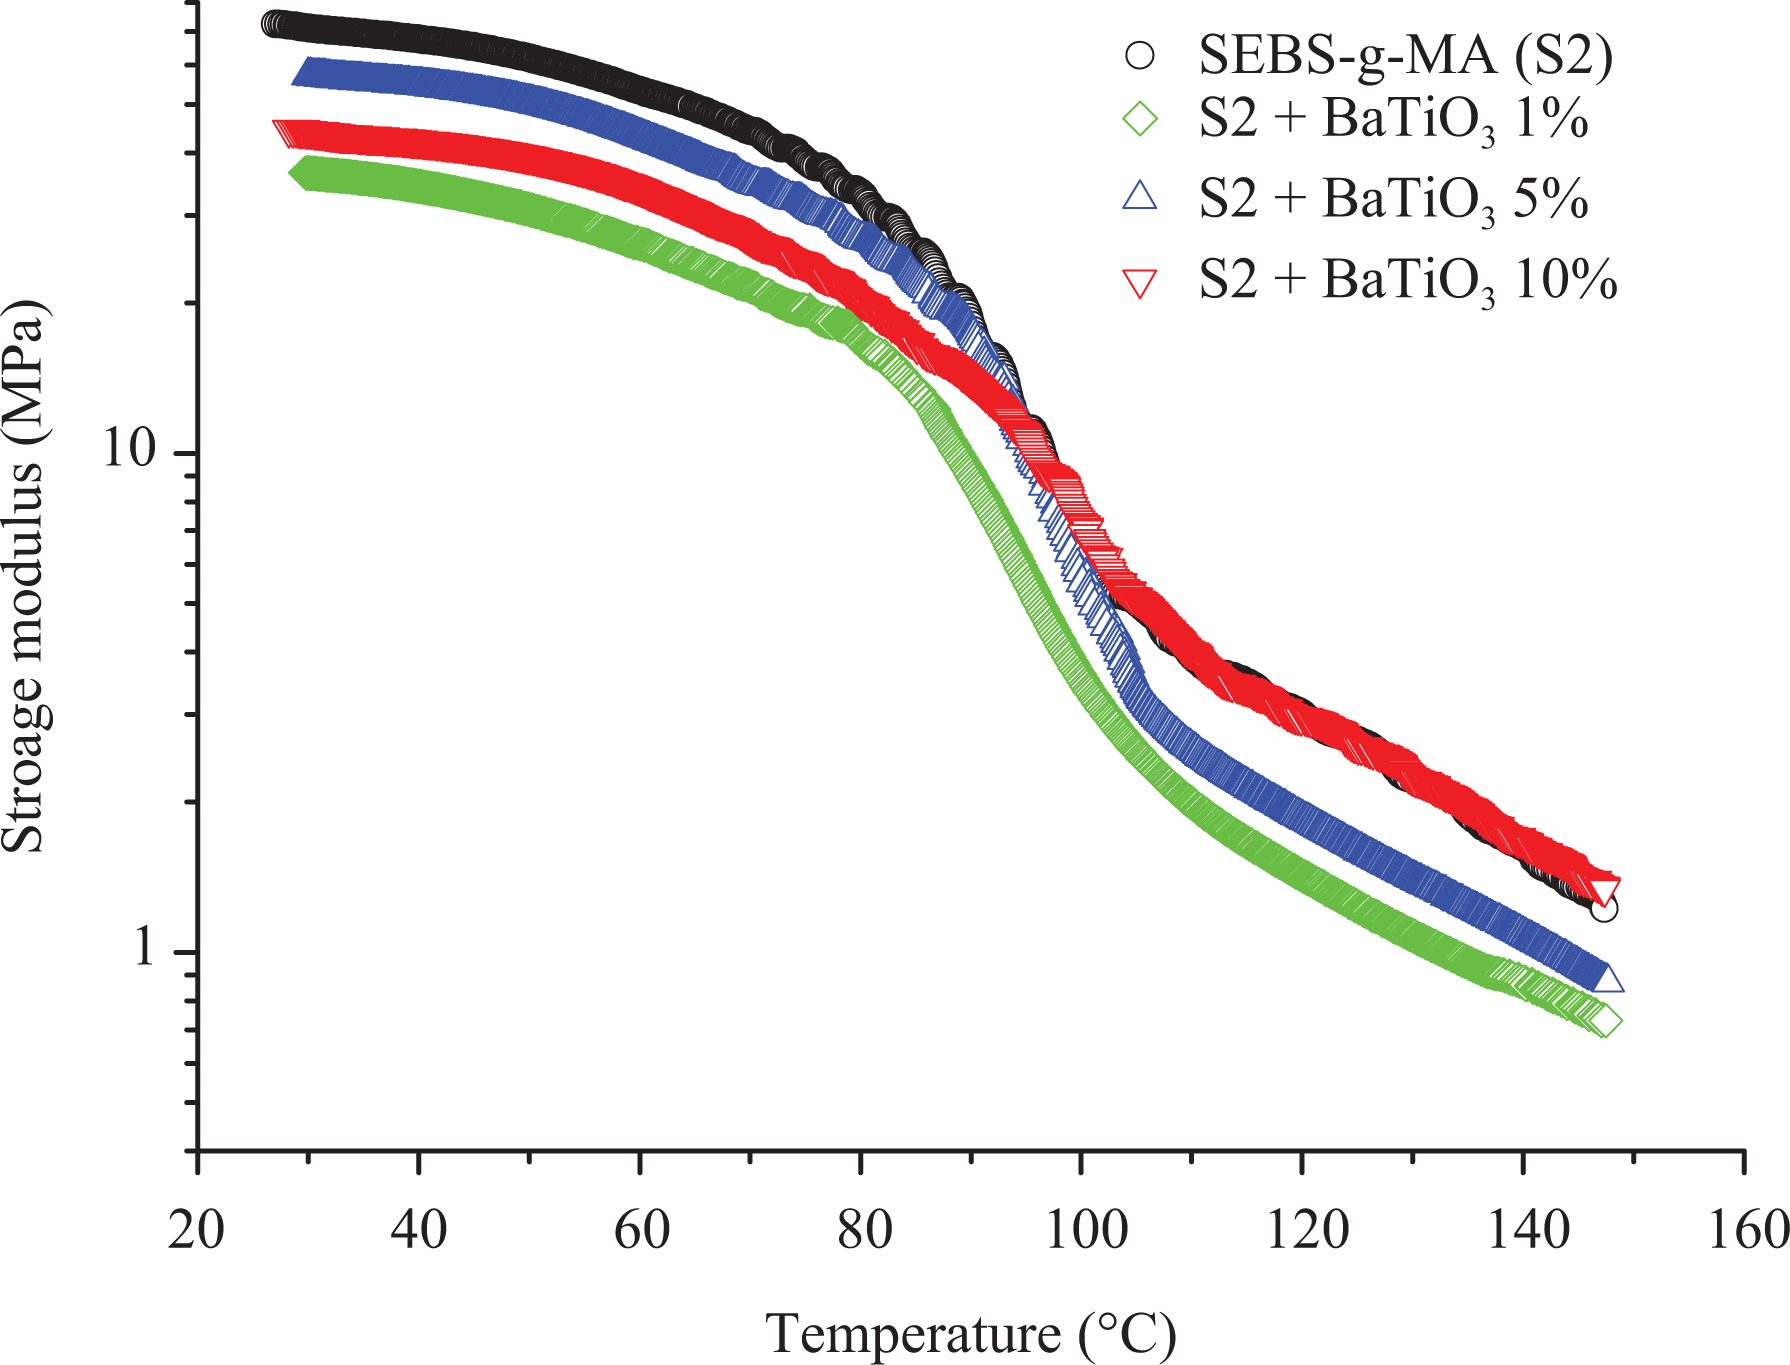
Storage modulus of SEBS-g-MA (S2)/BT composites presented with different colors.
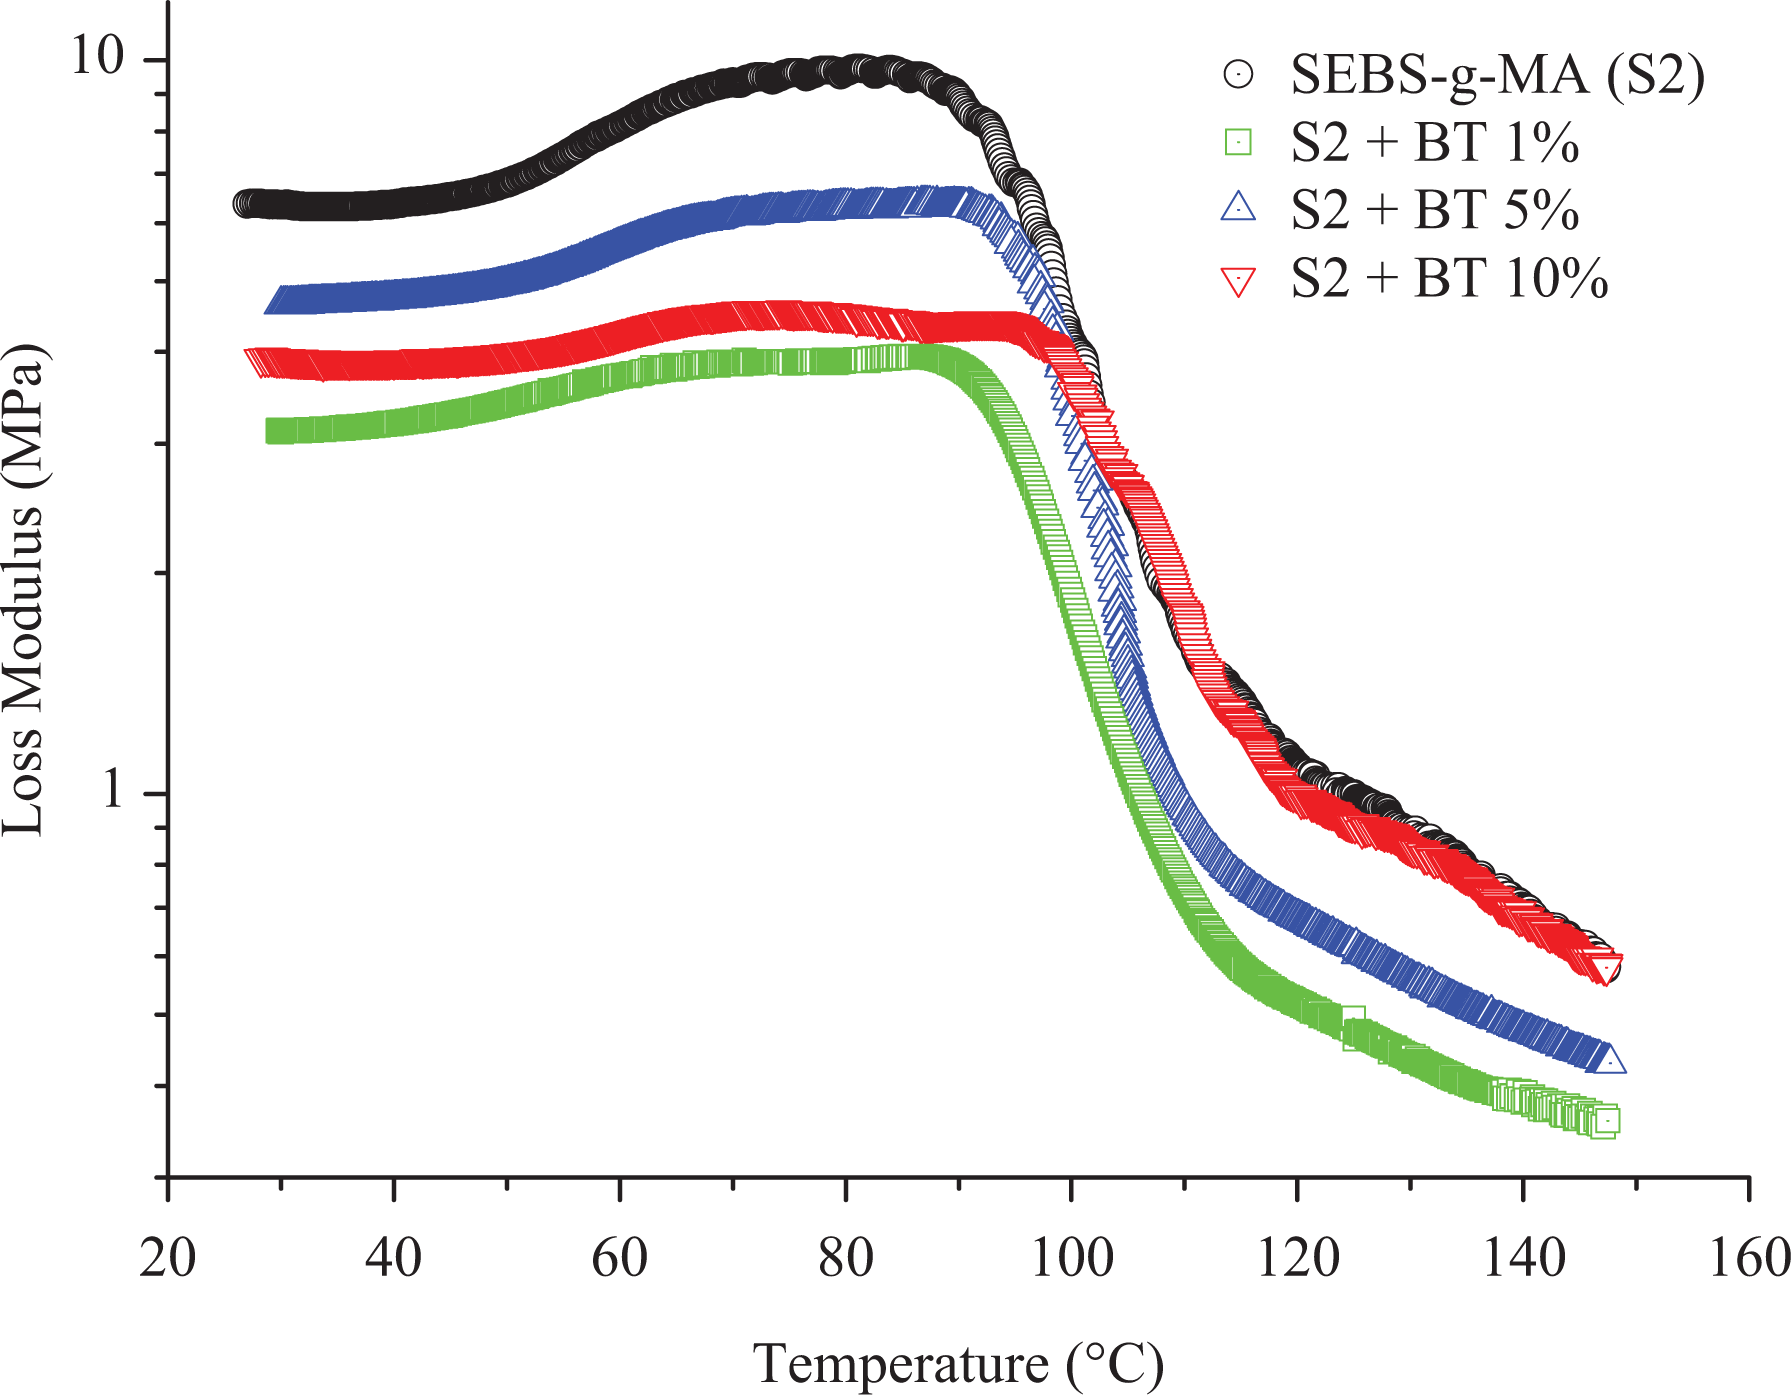
Loss modulus of SEBS-g-MA (S2)/BT composites presented with different colors.
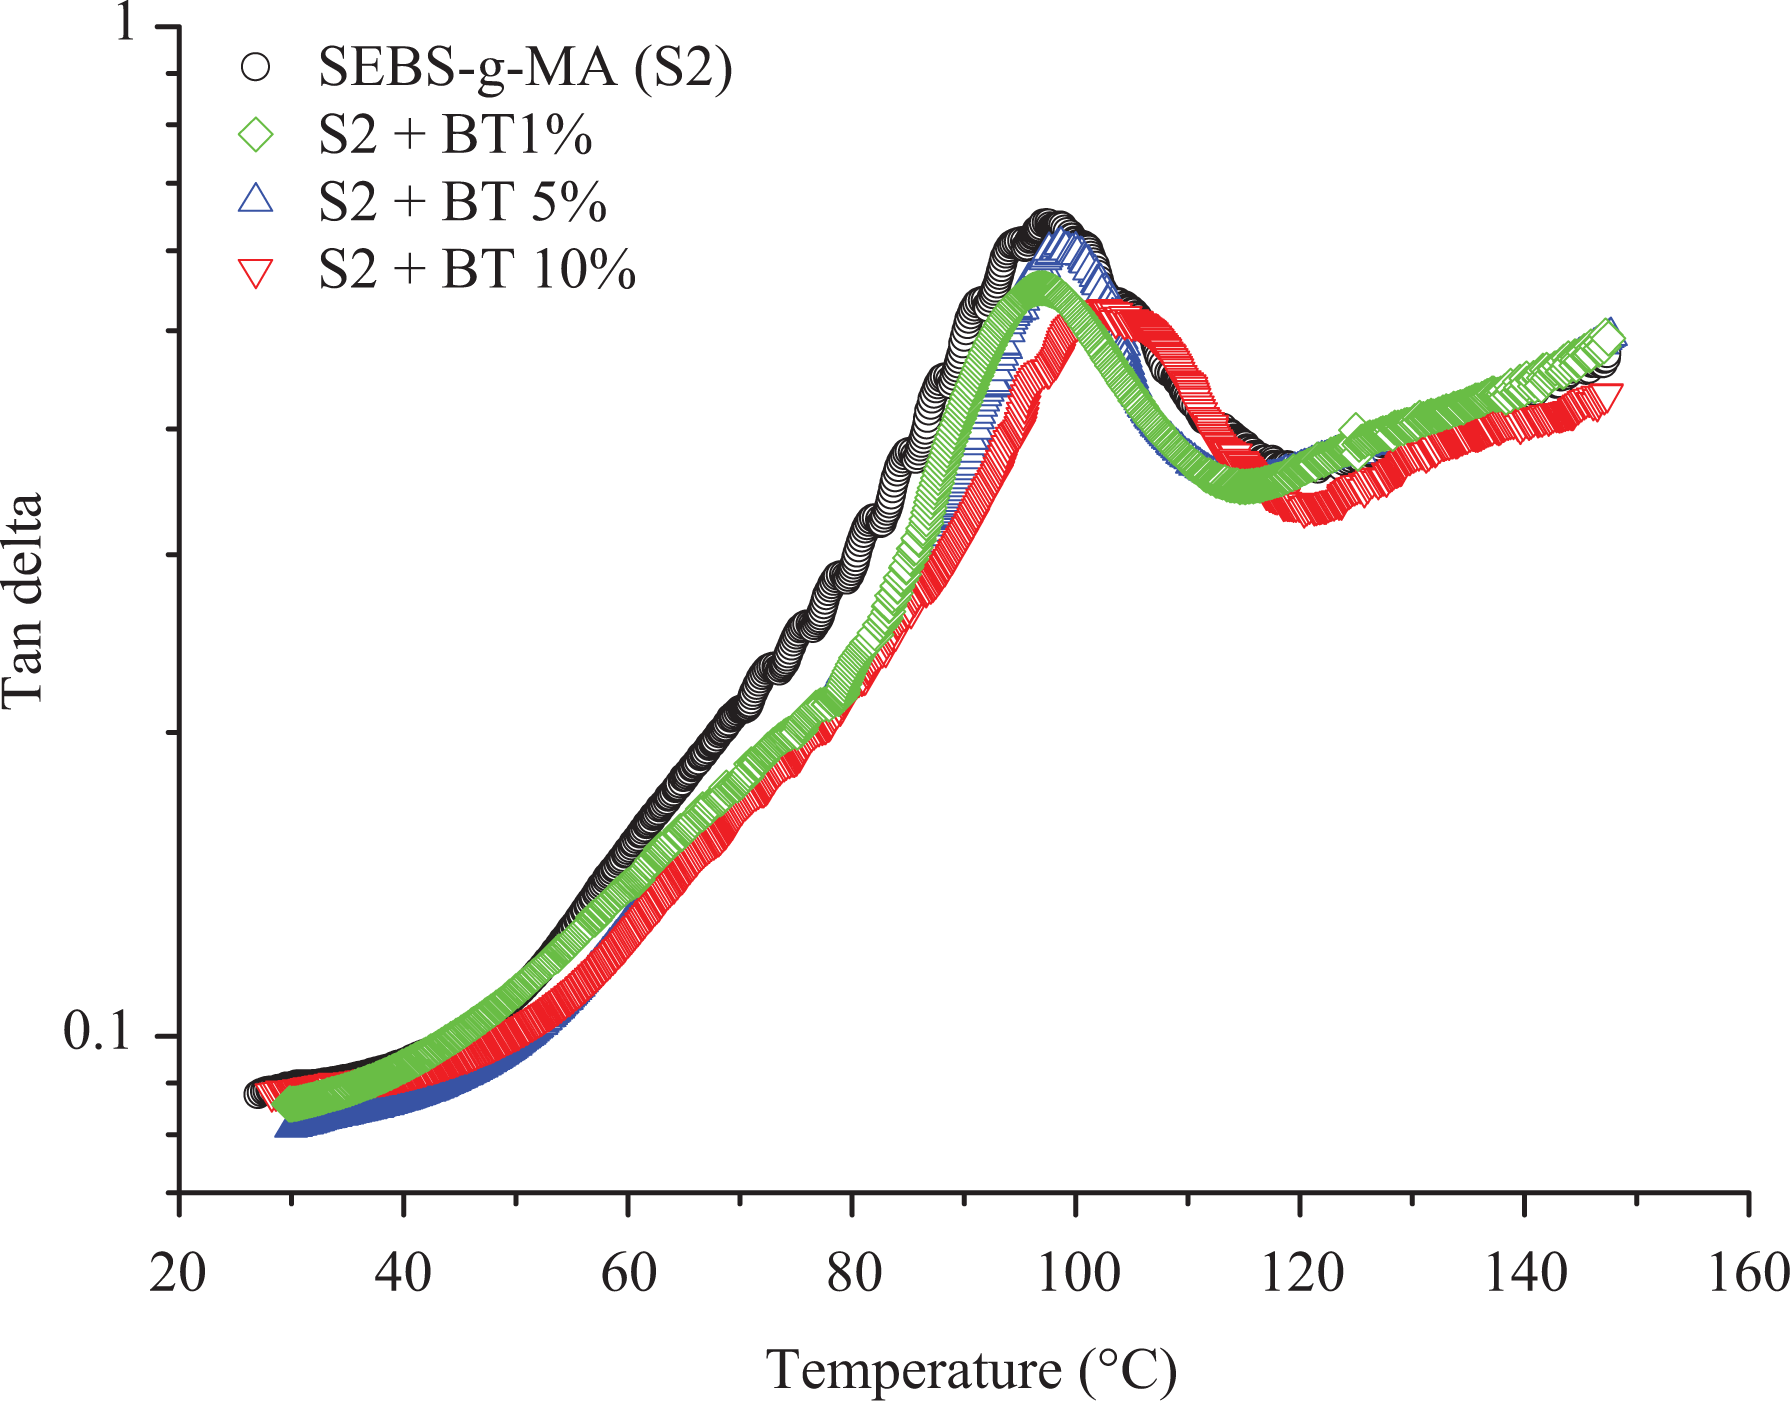
Tan δ of SEBS-g-MA (S2)/BT composites presented with different colors.
The temperature shift in the peak of the tan δ was found to be directly proportional to the amount of BT contents, since, when the amount of filler is sufficient, additives form a higher reinforcing effect, thereby overcoming the hydrodynamic effects of polymers. However, this network can be broken down at a high percentage of strain (generally above 0.1% strain range) which is best defined by the Payne effect. 37,45 –47 This effect is not seen when strain % is very low as used in this work. The shift in tan δ (a representation of the glass transition of the hard block) is an essential parameter to study for different nanocomposites as it defines mechanical stability as well as viscoelastic properties of nanocomposites for all possible applications under different strain/stress condition for different applications.
Figures 12 and 13 shows the heat flow curve, and temperature derivative of reversible specific heat capacity (Cp) respectively for different BT/polymer matrices. Although the peak of total heat enthalpy around 11°C was not highly altered upon addition of BT on both triblock, rearrangement of this peak due to densification of aromatic structure (TC1 and TC2 in Figures 12 and 13, respectively) forming multiple interphases with soft block soon after the endothermic peak enthalpy was found to be affected upon addition of BT. This effect is more prominent in SEBS-g-MA than SEBS triblock due to the high interaction of the polar MA molecule attached to the soft block with BT. Similarly, the rate of change of heat enthalpy soon after glass transition (measured in Figure 13) in SEBS-g-MA also showed significant change upon addition of BT than in SEBS as shown in Figure 12. However, the glass transition temperature of different composites (ca. −53°C for SEBS-g-MA composites and −56°C for SEBS composites) calculated by temperature derivative of reversible specific heat capacity were found almost to be constant with the addition of different amount of BT additives. A slight difference in the glass transition of the soft block was observed between SEBS-g-MA and SEBS triblock because of the presence of MA, a bulkier molecule, in an ethylene/butylene molecule in SEBS-g-MA.
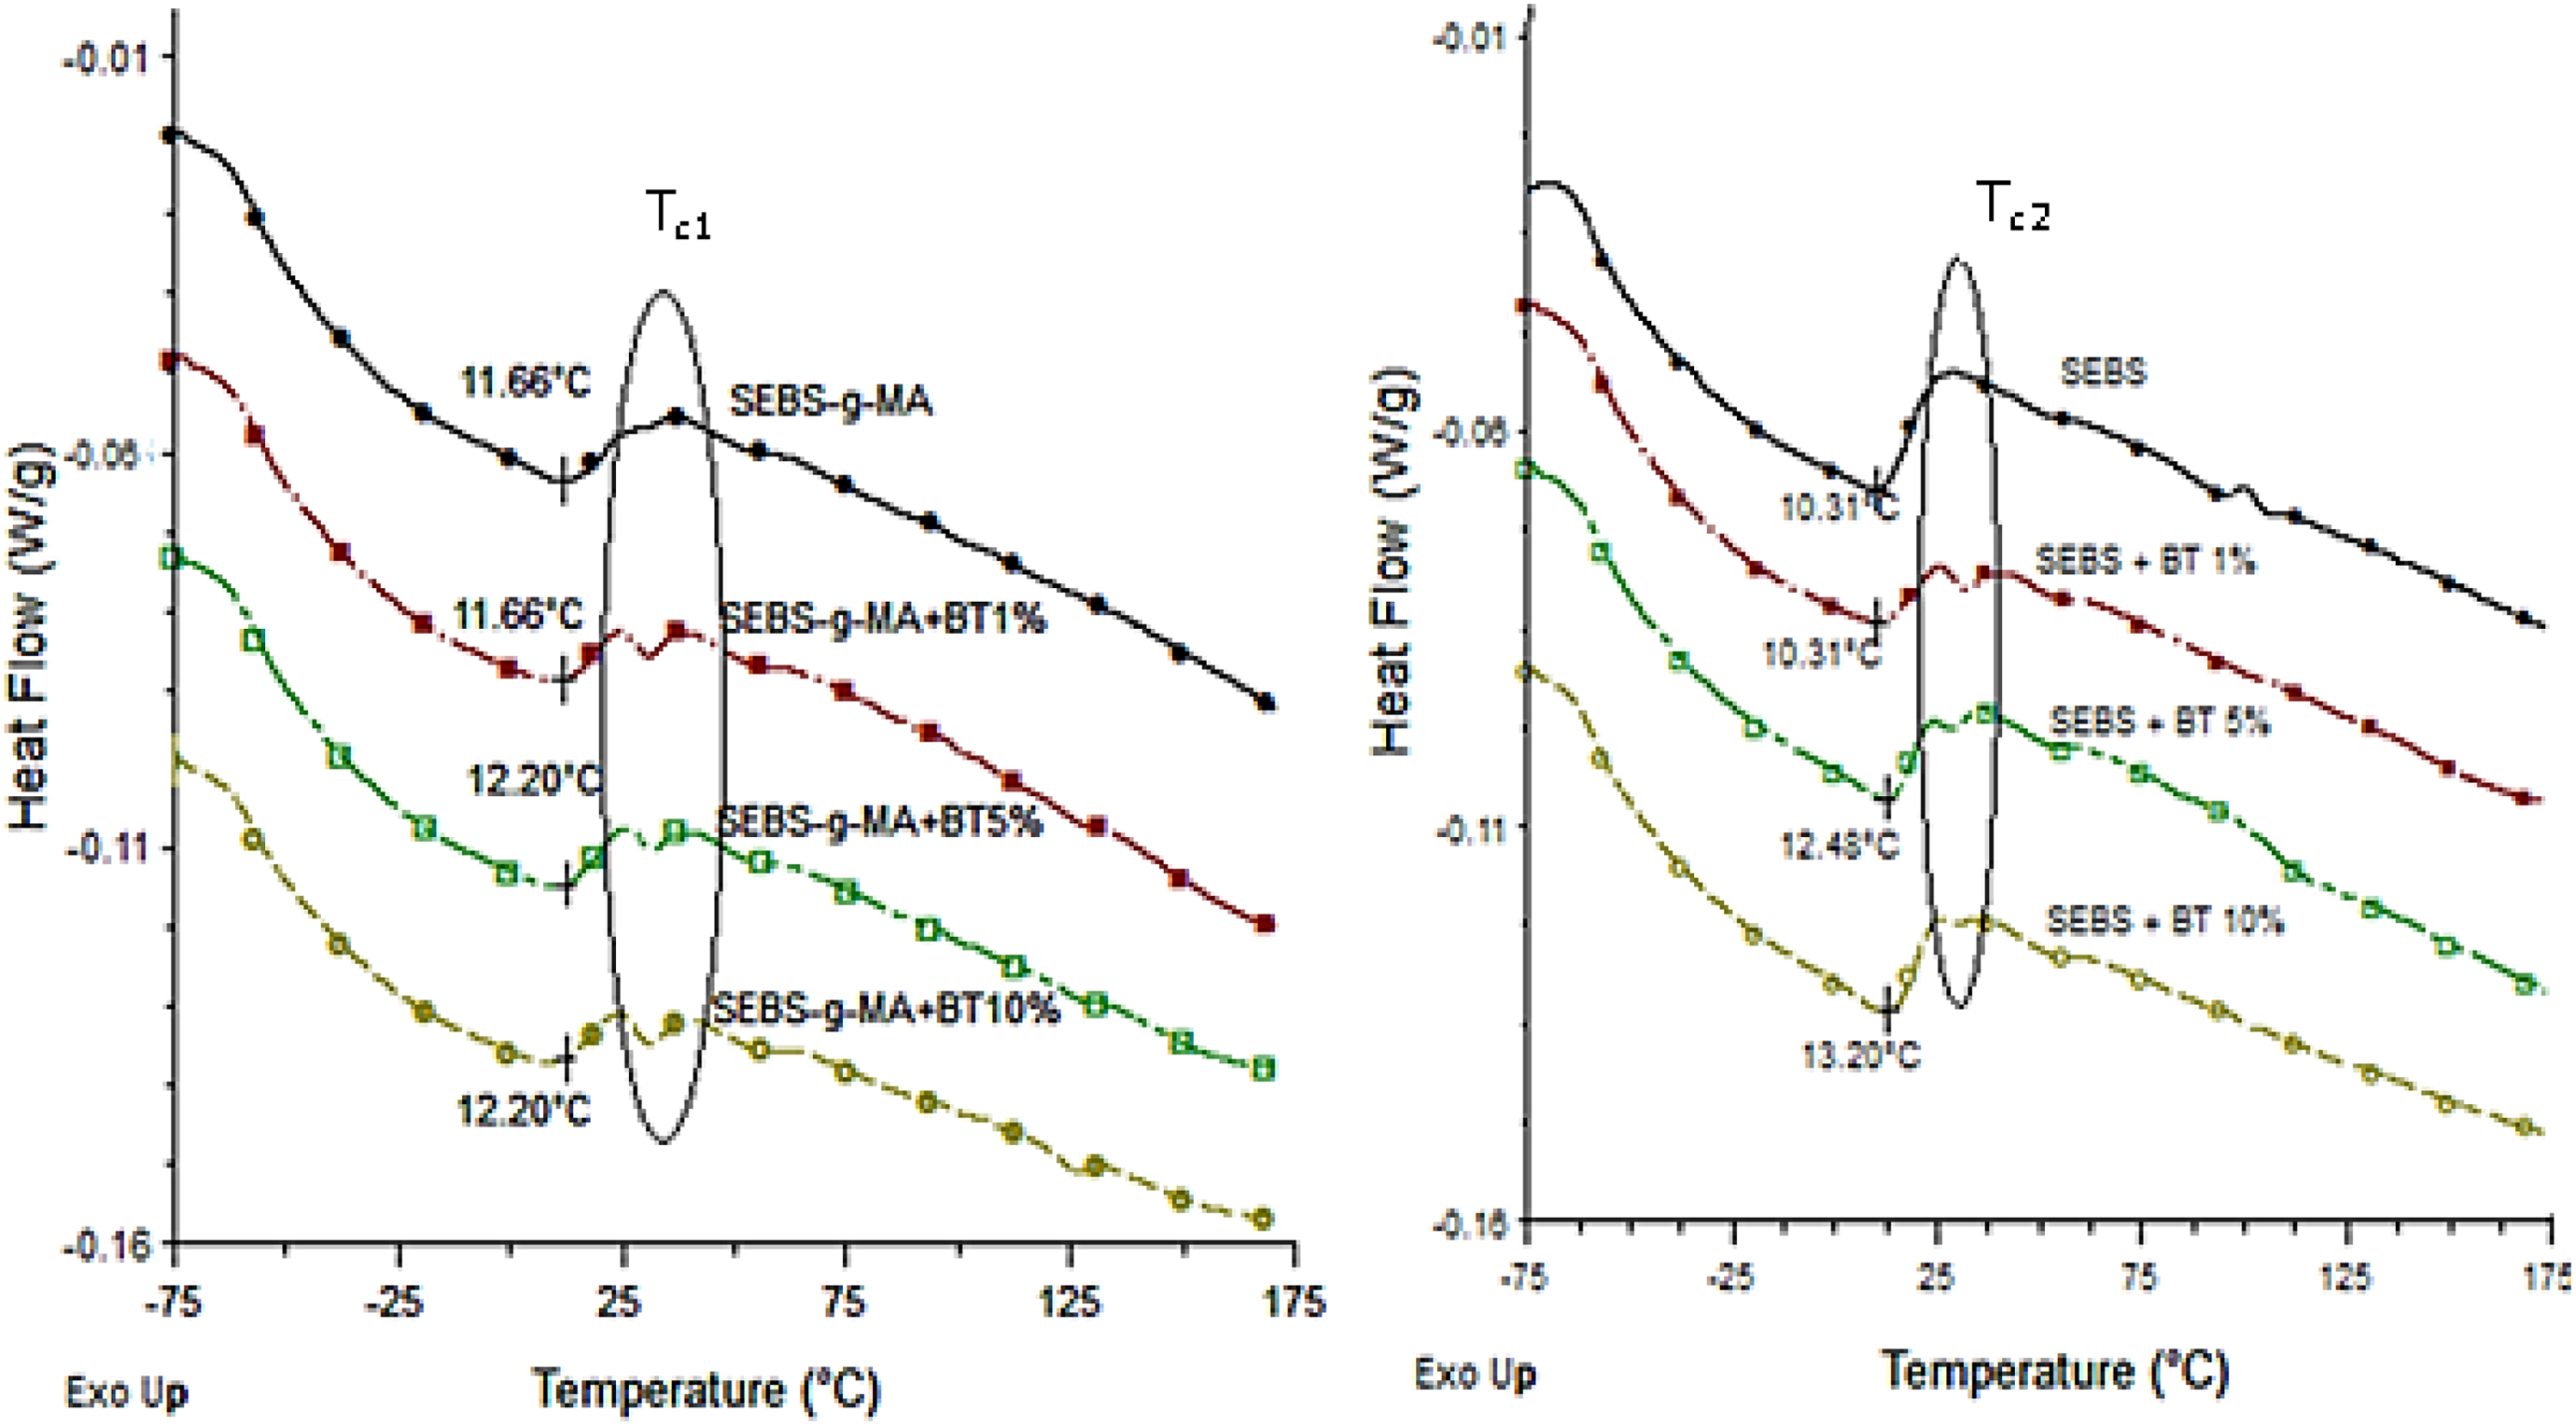
Total heat flow curve of SEBS-g-MA/BT composites (left) and SEBS/BT composites (right).
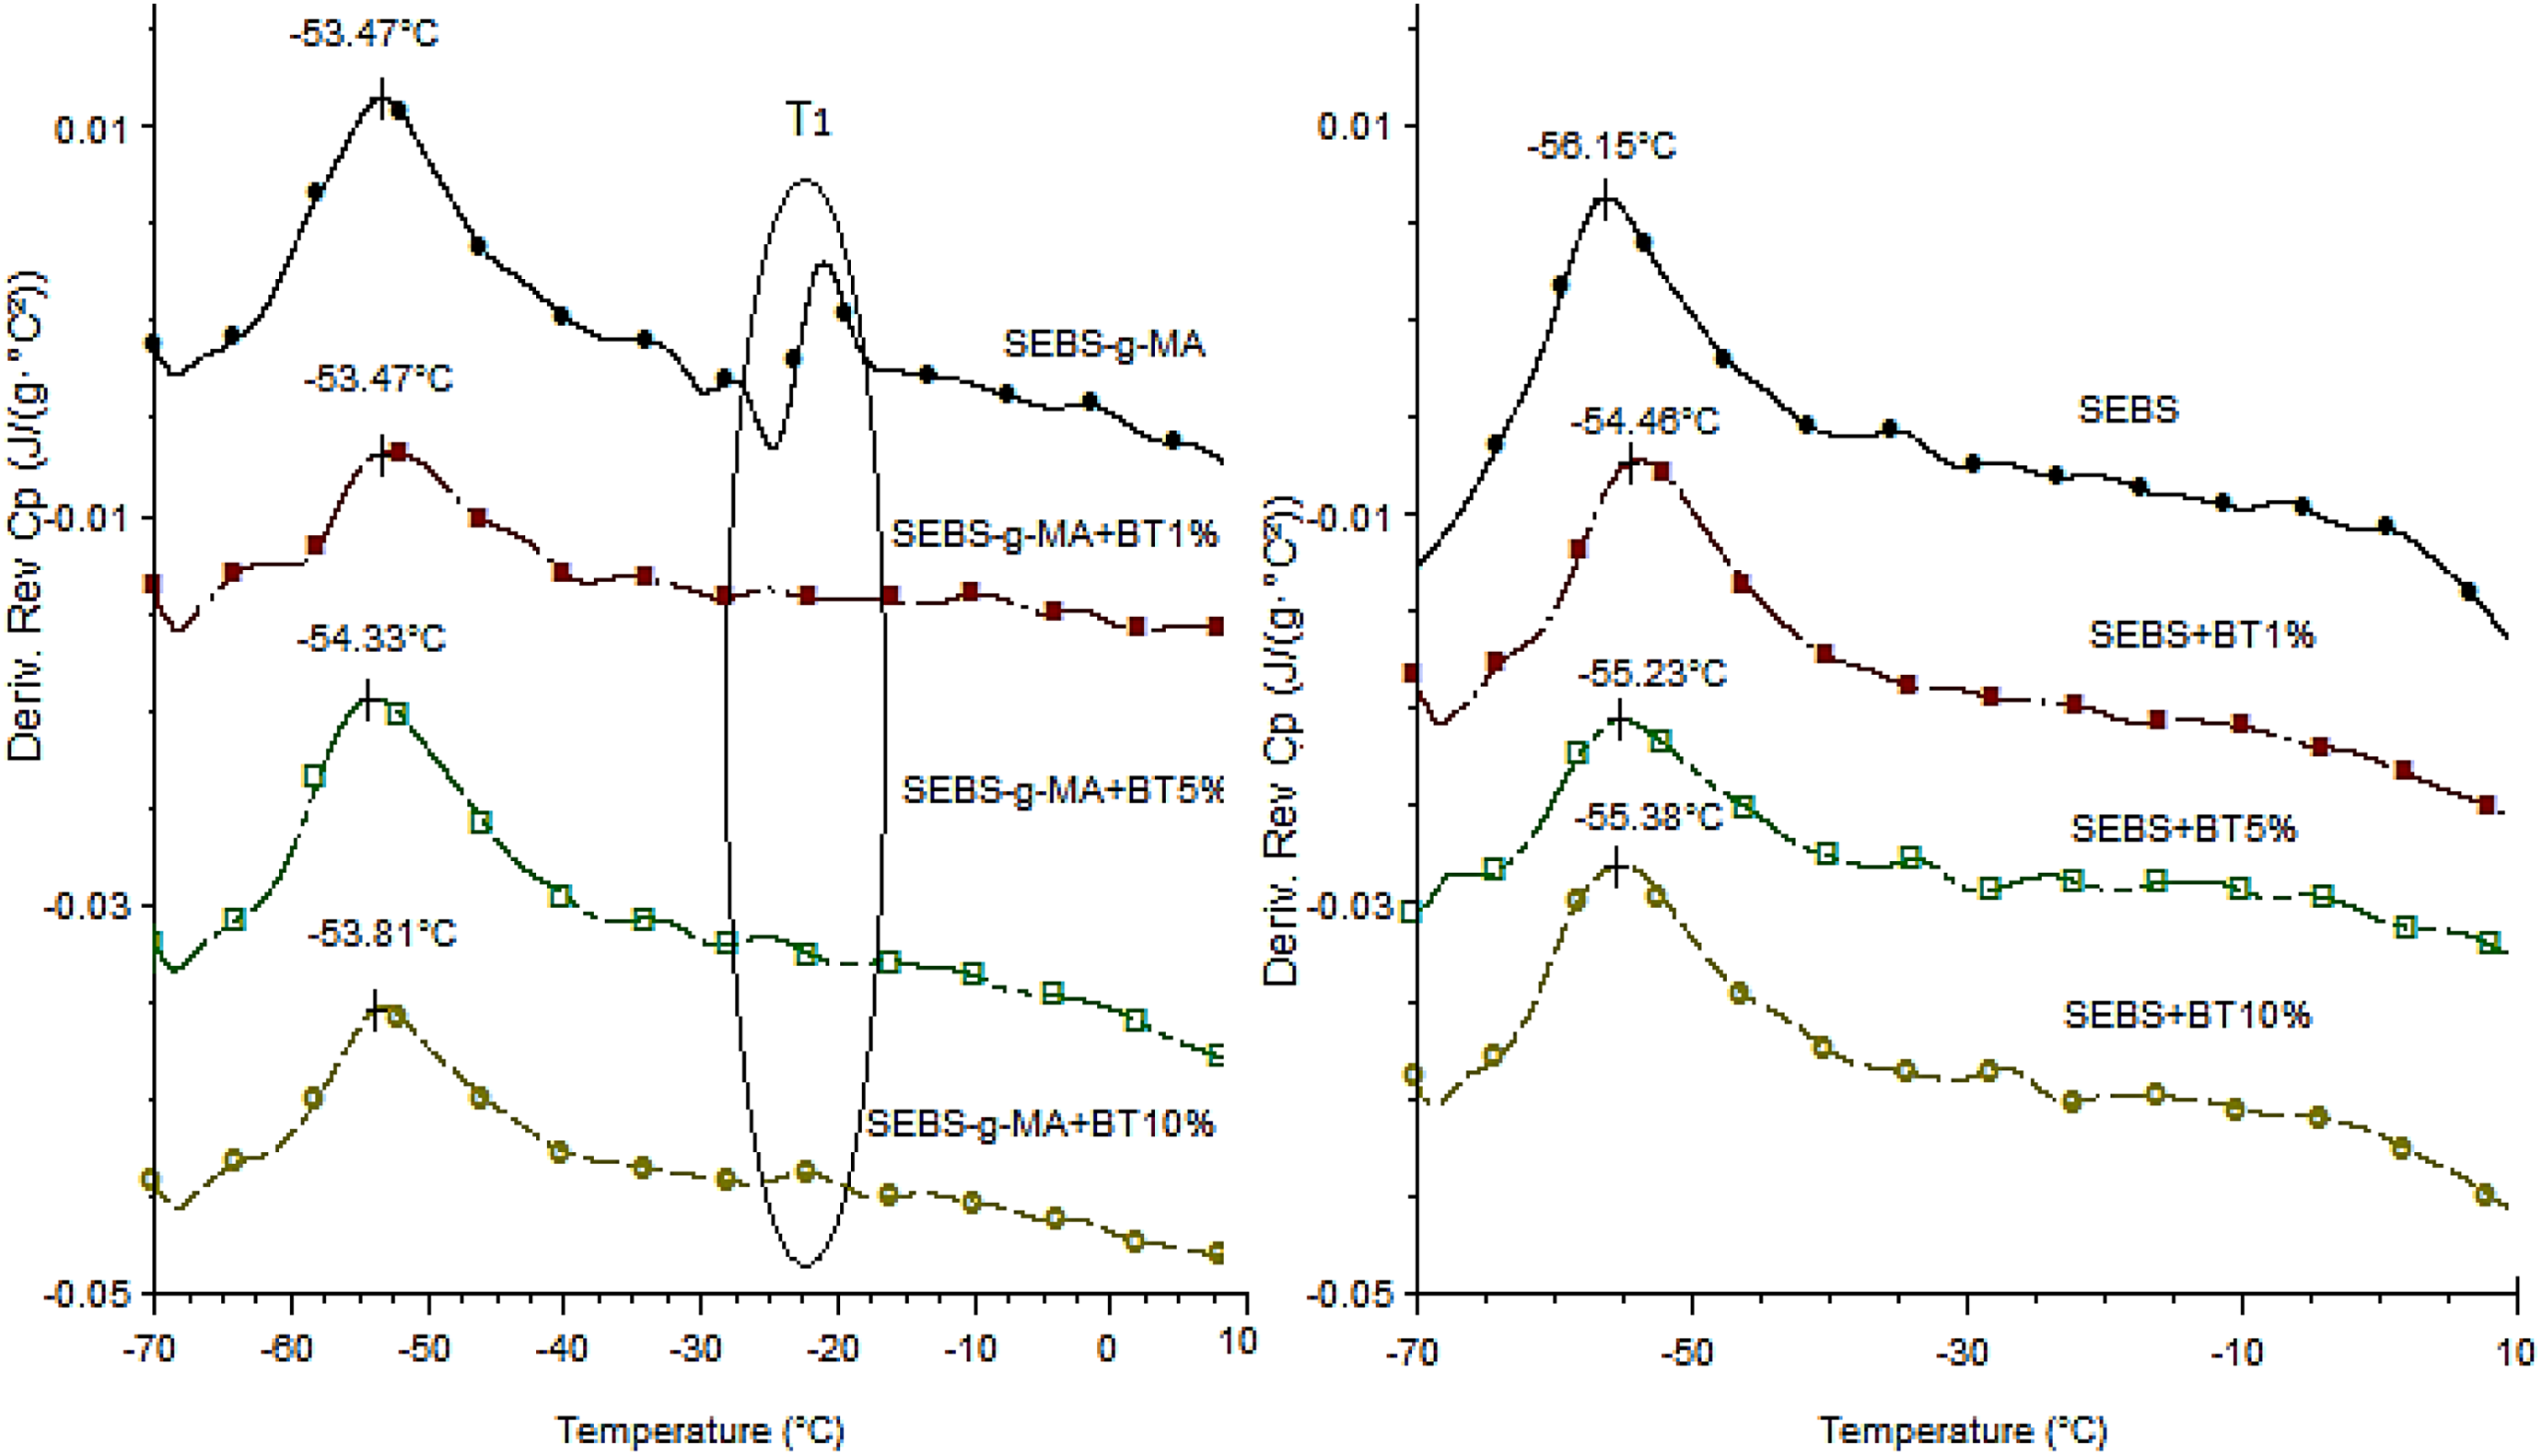
Temperature derivative curve of reversible Cp curve of SEBS-g-MA/BT composites (left) and SEBS/BT composites (right).
Moreover, the broadening of Tg (ca. 53°C) in SEBS-g-MA compared to SEBS upon addition of BT also confirms the formation of homogenous mixtures of SEBS-g-MA/BT composites than SEBS/BT composites. Also, there is a sudden change around −25°C in SEBS-g-MA as shown in Figures 12 and 13 (T1). This sudden change observed was found being altered upon addition of BT additives. It also confirms an interaction of SEBS-g-MA triblock with BT additives.
Figure 14 and Table 4 shows the ATR-FTIR graphs of SEBS and SEBS-g-MA triblock and different frequencies of bands observed in FTIR spectra of the studied SEBS and SEBS-g-MA polymers, respectively. 48 –50 Generally, anhydride shows two FTIR bands due to vibration coupling of C=O groups. In succinic anhydride, these two bands are seen at 1871 and 1793 cm−1 for asymmetric and symmetric vibration of C=O groups, respectively. 48 Extruded SEBS-g-MA did not show any strong bands at those fingerprint regions, however, two strong peaks were observed at 1735 and 1715 cm−1. The strong band present at 1715 cm−1 shows C=O dimers present in COOH dimers. 48,49 It may be due to the ring opening of MA by hydrolysis phenomenon due to prolong storage of SEBS-g-MA leading to hydrolysis of 95% of MA. However, the presence of 1310–1210 cm−1 bands observed by C–O–C stretching of anhydride group suggests that some anhydride groups were still unaltered during extrusion or prolonged storage. 51 In addition, observation of 1776 cm−1 band peak along with other peaks in between 1776 and 1735 cm−1 concludes esterification of MA due to prolonged storage of SEBS-g-MA elastomer. 52 Moreover, the formation of other groups like alcohol during the process can also be confirmed due to the presence of a strong band at 1045 and 1017 cm−1. 48 The peak shown at 1601 cm−1 confirms the presence of C=C bond of benzene ring. 53
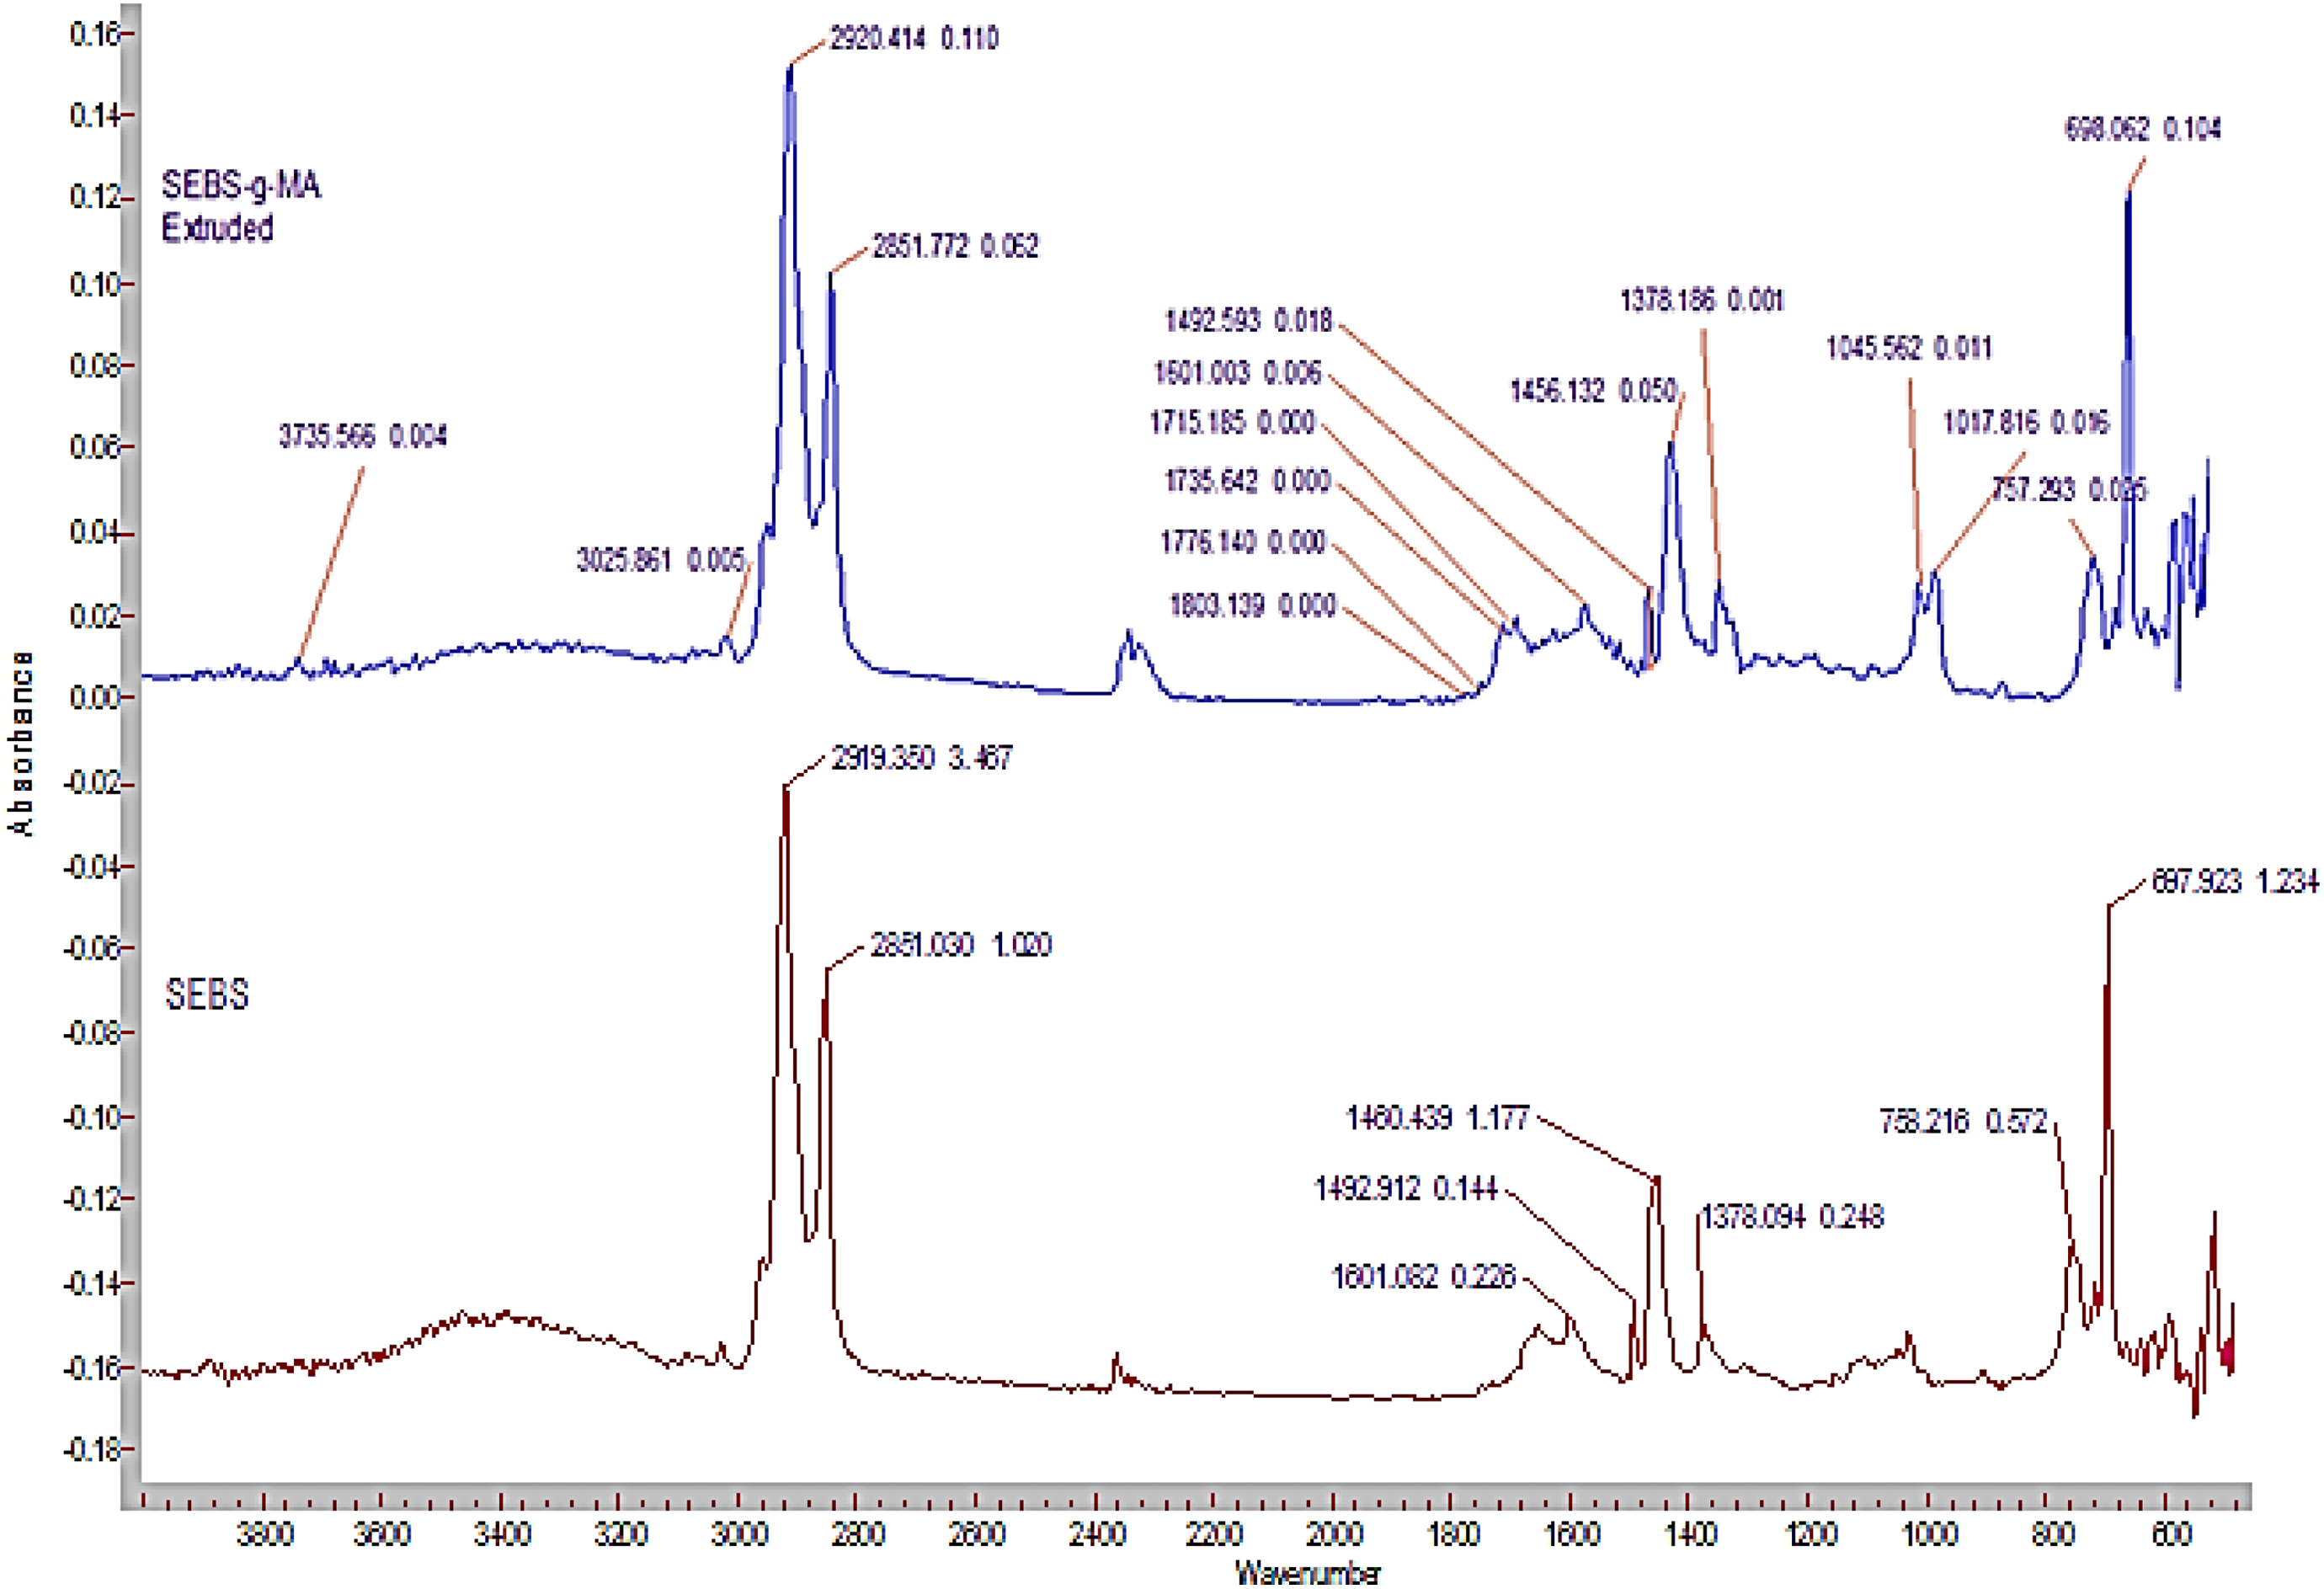
ATR-FTIR spectra of SEBS and SEBS-g-MA.
Different frequency bands of SEBS and SEBS-g-MA observed in FTIR spectra.
SEBS-g-MA: poly(styrene-ethylene/butylene-styrene)-grafted-maleic anhydride; FTIR: Fourier transfer infrared spectroscopy; EB: etylene butadiene; PS: polystyrene.
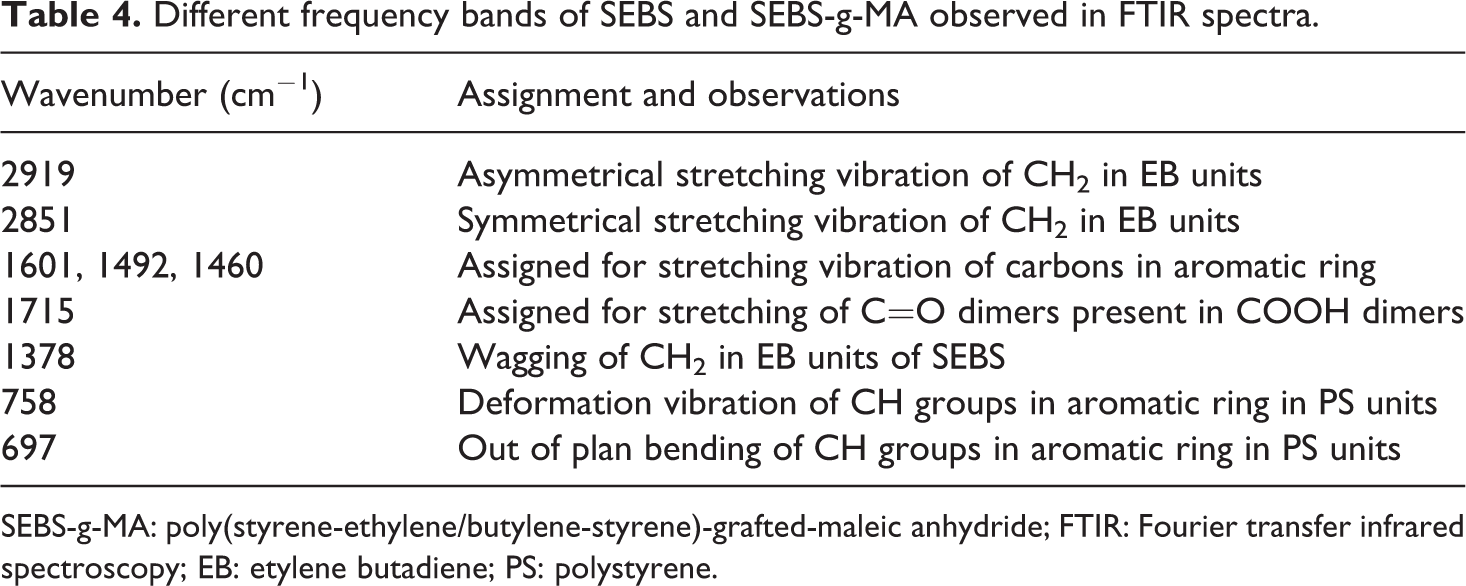
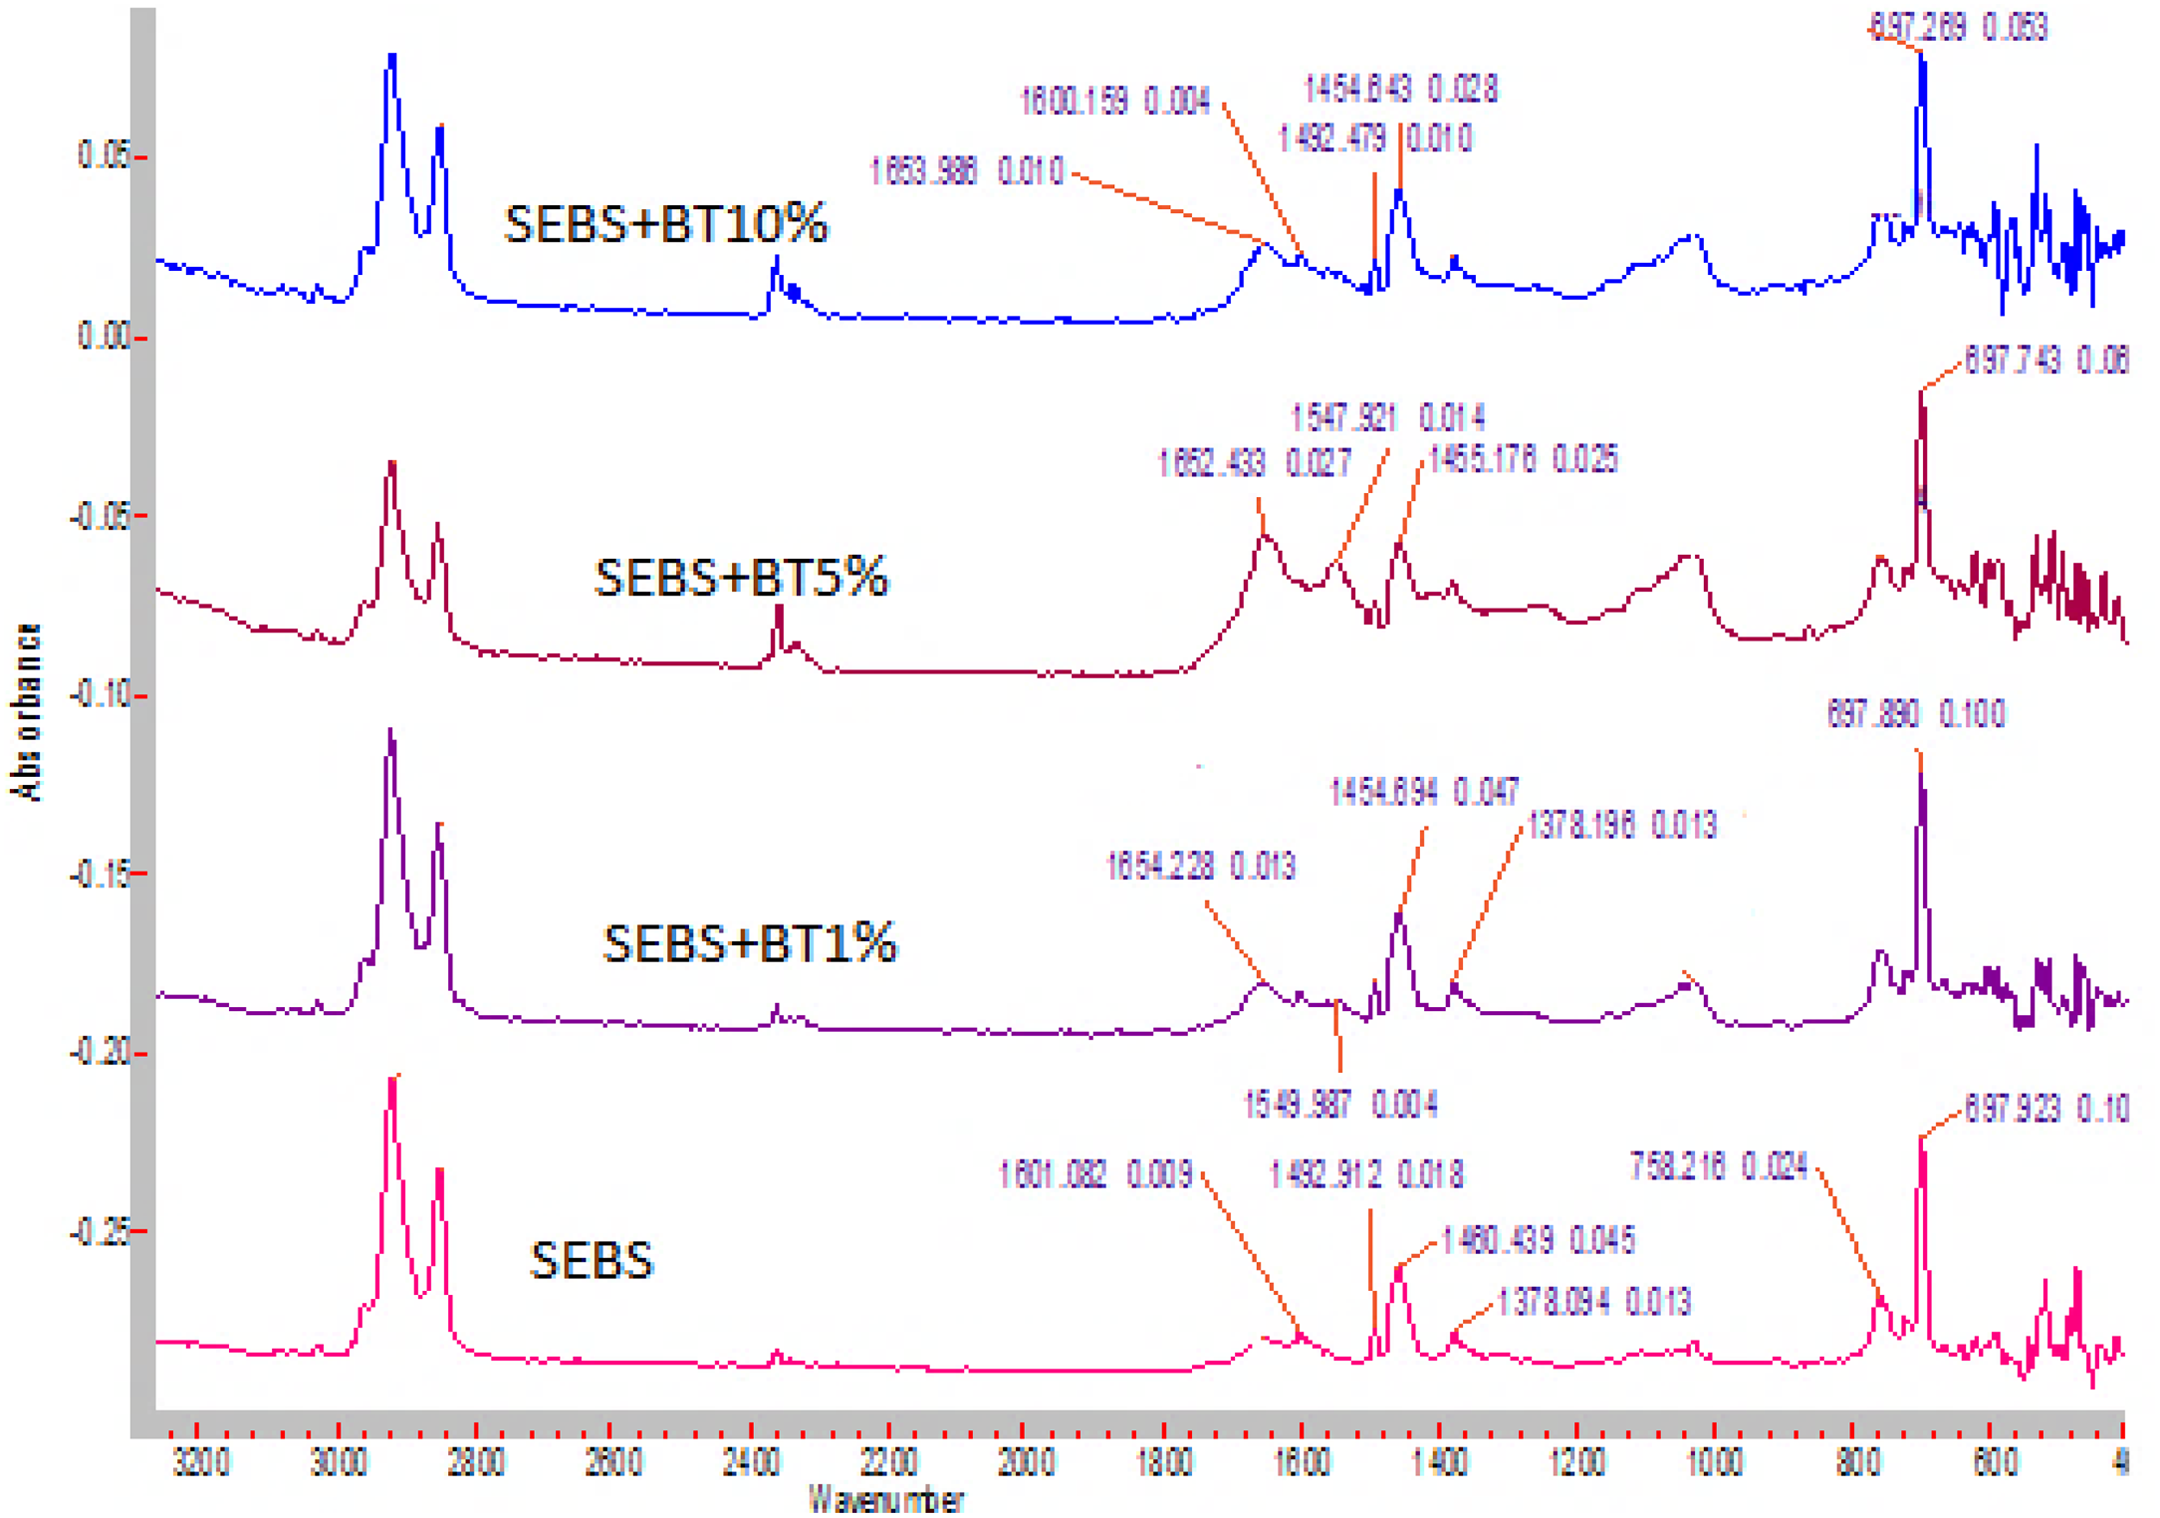
BT also shows a slight interaction with SEBS thermoplastic elastomers with the C=C of a benzene ring with a change in wavenumber as shown in Figure 15. The intensity of interaction of BT does not change with C=C bond when BT is changed from 5 wt% to 10 wt% (the wavenumber change from 1460 to 1454 cm−1 in both cases). In addition, the rocking effect of benzene ring at 758 cm−1 wavenumber almost remains constant upon addition of 10 wt% of BT. Figure 16 shows the FTIR graphs of SEBS-g-MA-BT composites. The graphs show that BT interacts mainly with MA group. FTIR band shifts and change in intensity, especially in C=O dimmers, C–O–C band peaks, and OH peaks show the interaction of BT with SEBS-g-MA in acidic or other forms. In addition, change in IR peak band and nature of C=C bond at 1601cm−1 also confirms the interaction of benzene ring of polystyrene with BT very slightly. The presence of many other peaks between 1800 and 1601cm−1 confirms a high interaction of BT with MA molecule together with the benzene ring.
ATR-FTIR spectra of SEBS/BT composites.
ATR-FTIR spectra of SEBS-g-MA/BT composites.
Figure 17(a) and (b) show SEM images of SEBS and SEBS-g-MA, respectively. SEM images show a slight change in morphological structure between SEBS and SEBS-g-MA. Authors suggest higher glass transition temperature for the soft block of SEBS-g-MA than the rise given by SEBS to the different morphological structure.
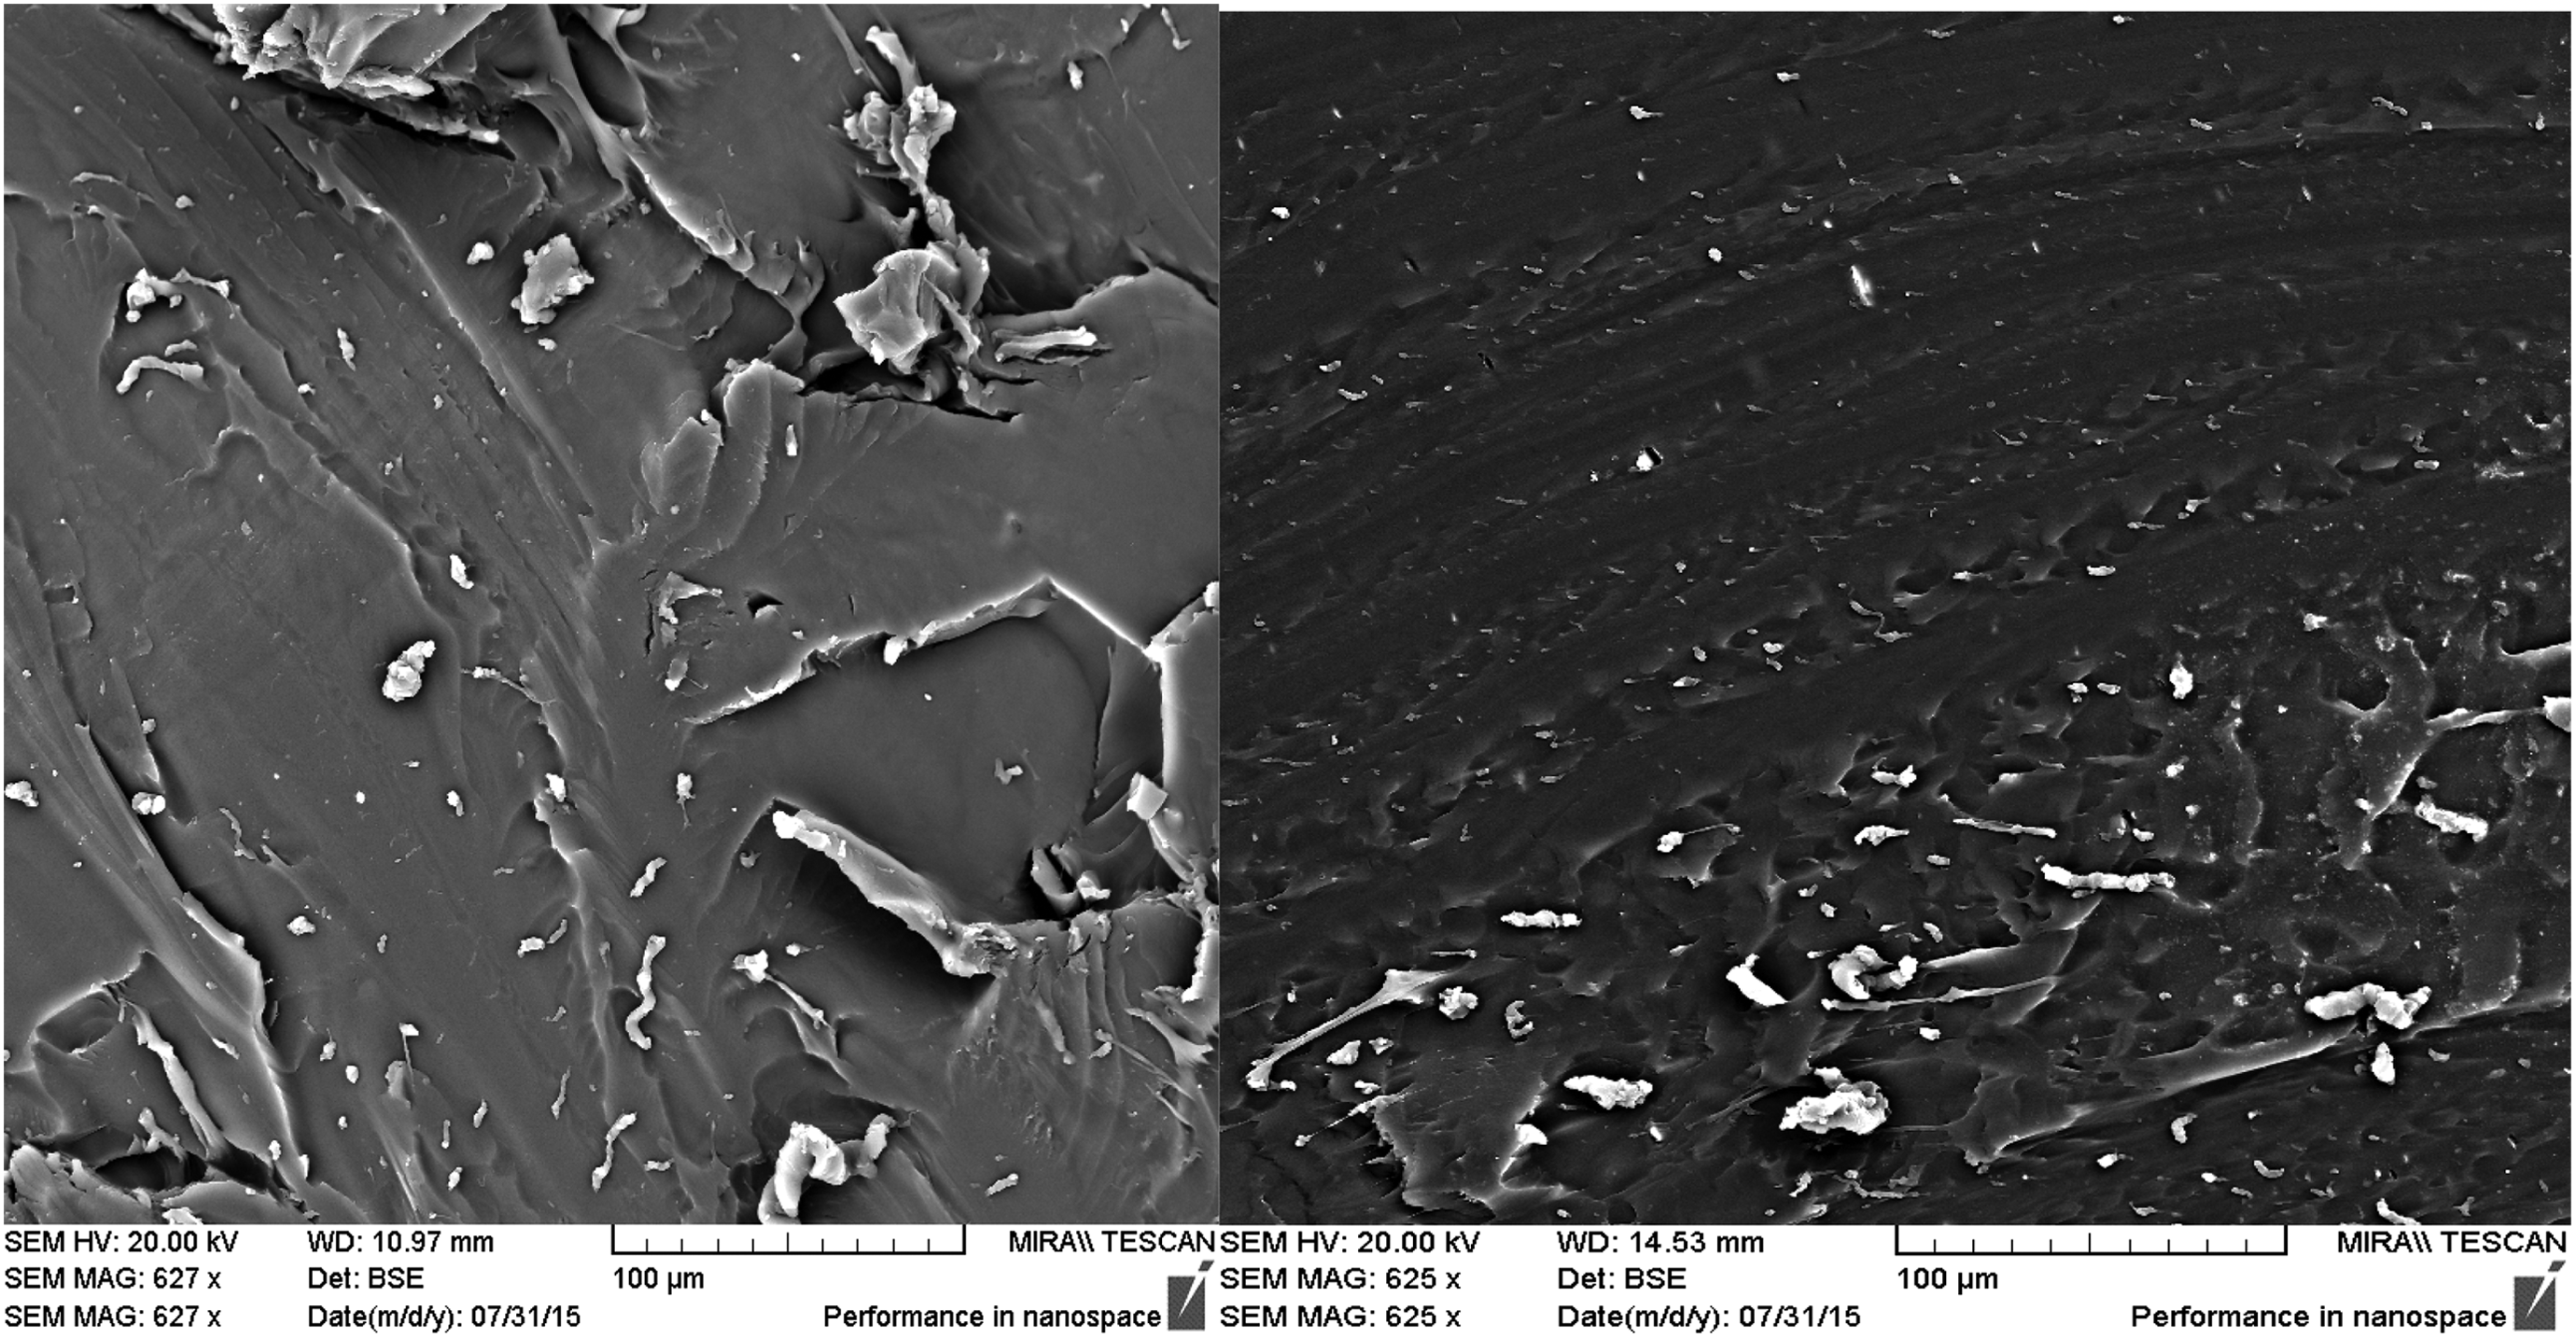
SEM images of (a) SEBS left and (b) SEBS-g-MA right.
Figure 18(a) and (b) show SEM images of SEBS and SEBS-g-MA composites. Comparing Figure 17 to Figure 18, the relatively large transformation was observed in SEBS-g-MA nanocomposite than SEBS nanocomposites.
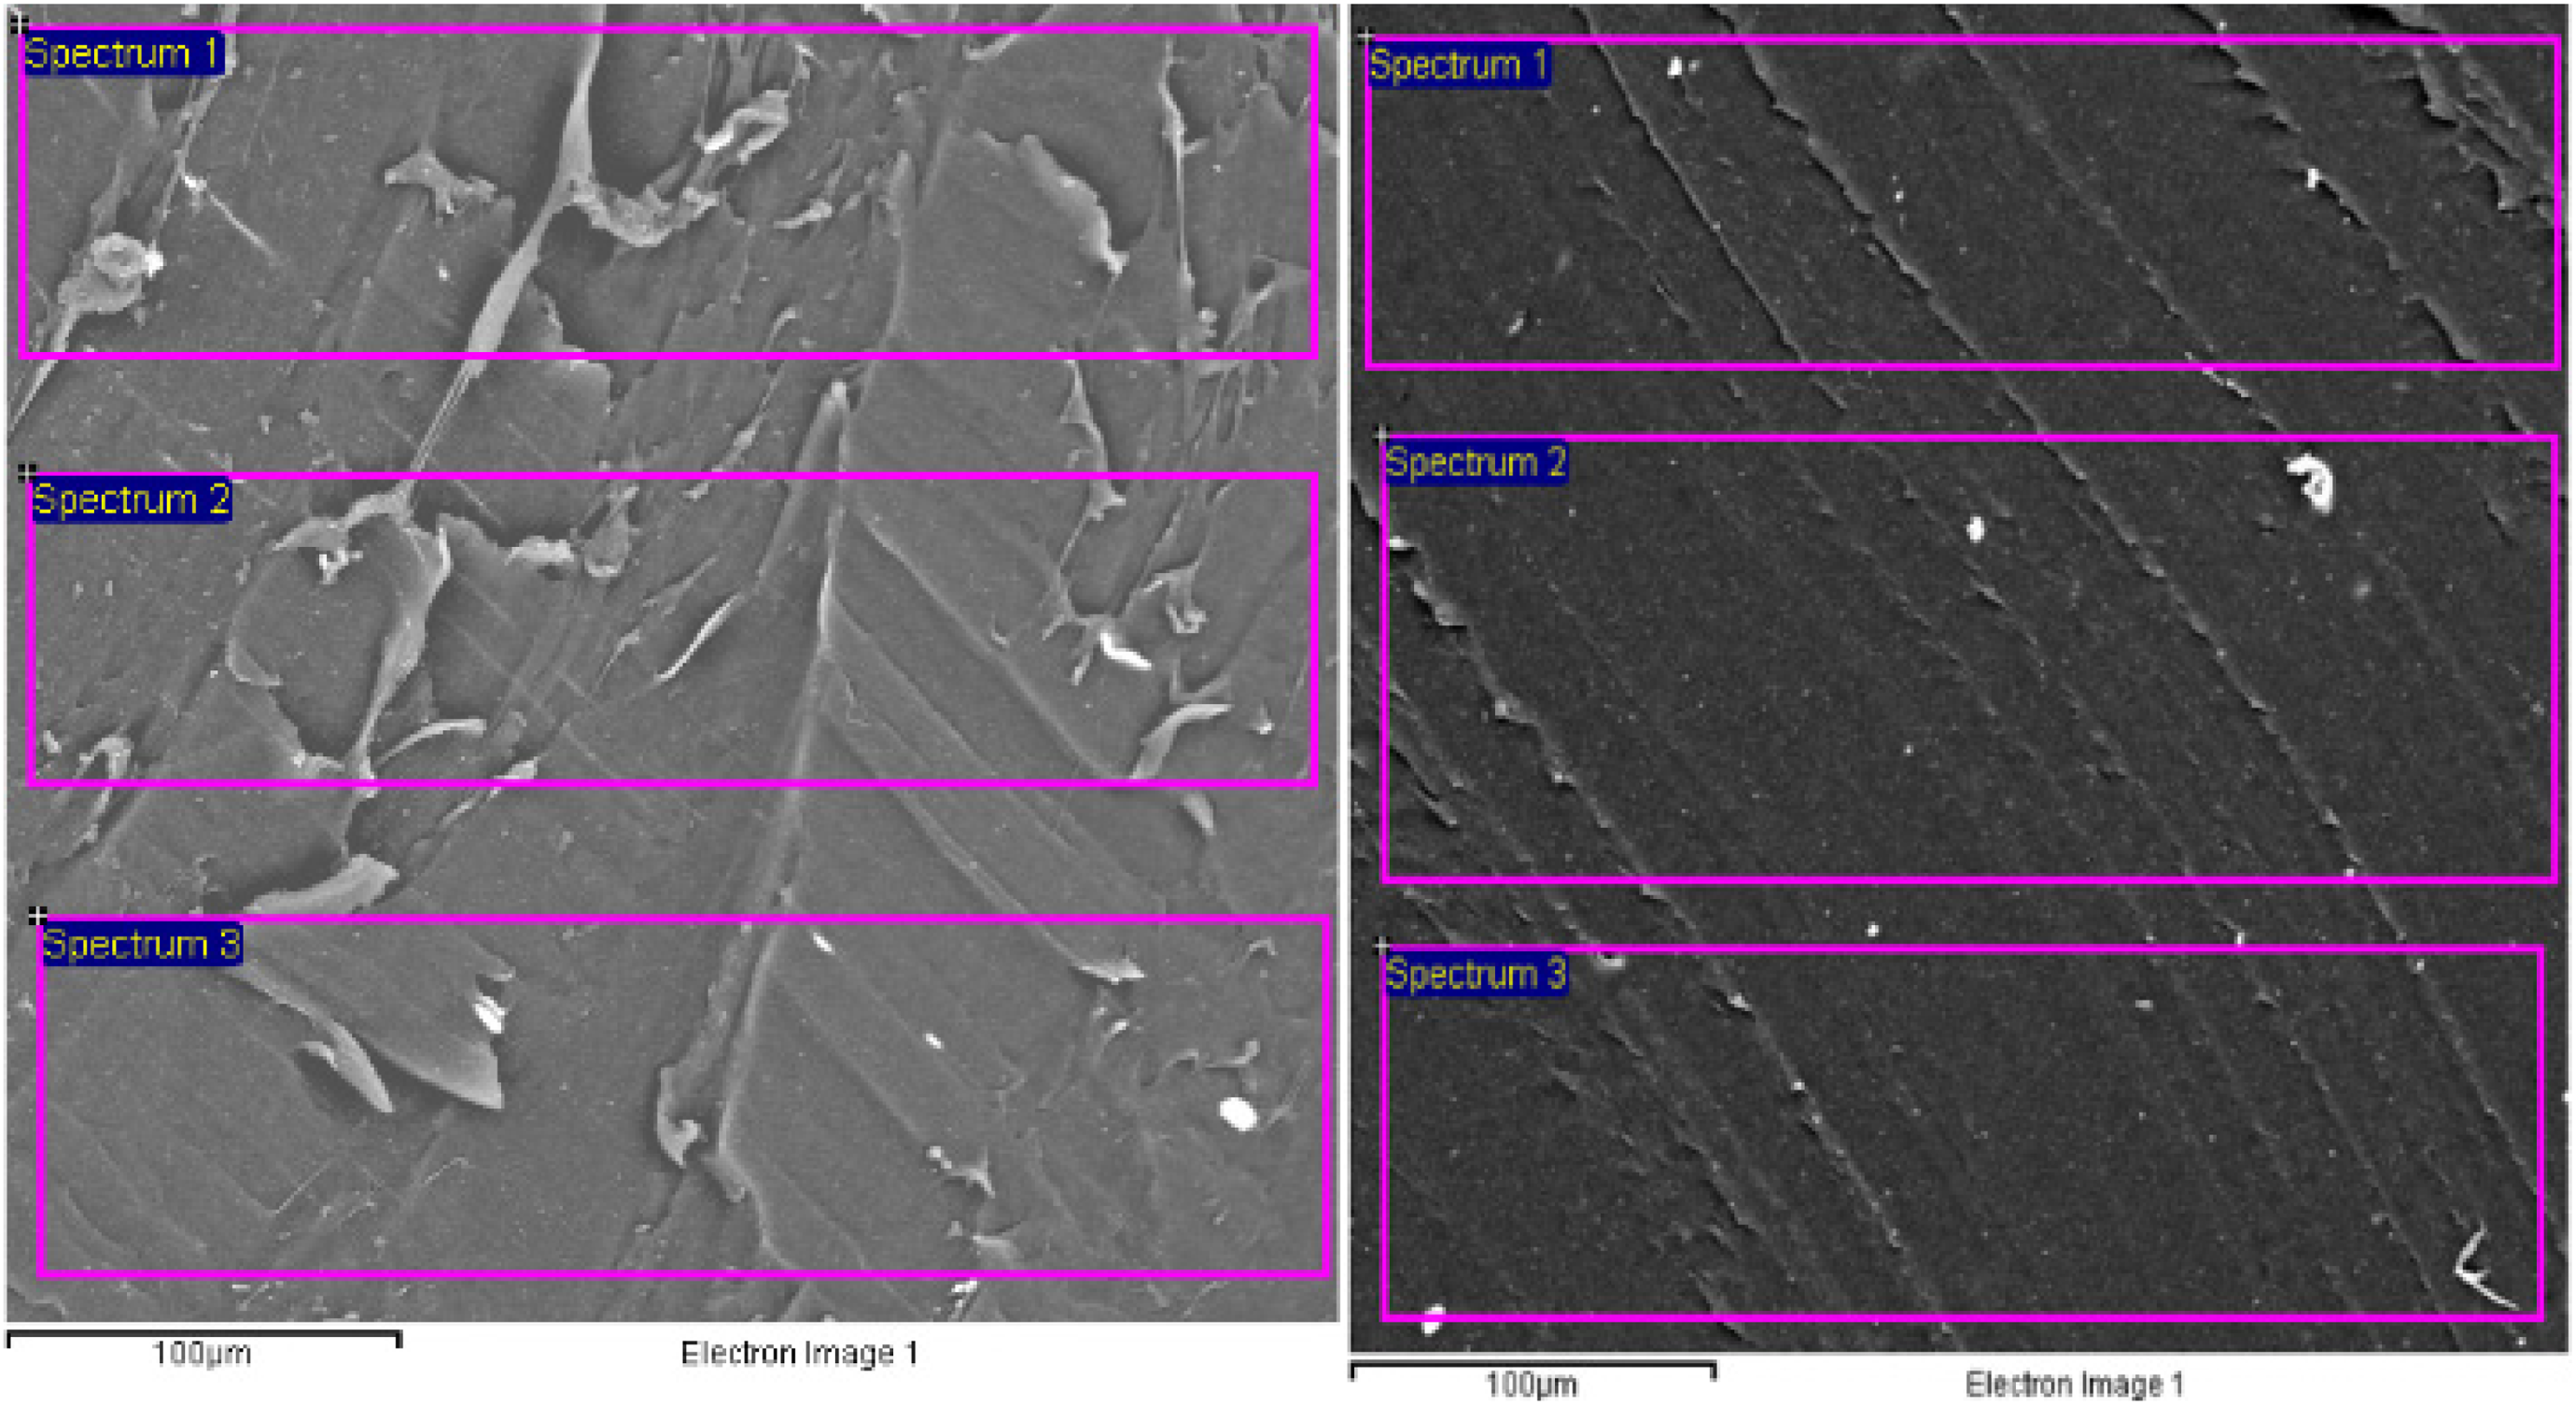
Selected area is used for element mapping of (a) SEBS left and (b) SEBS-g-MA Right.
For further analysis of dispersion of BT with SEBS and SEBS-g-MA, the element mapping was done along the thickness of each sample as shown in Figure 18
From Table 5, it was observed that the distribution of C, O, Ti, and Ba were not uniform along the thickness. The wt% of Ba element varies from 3.46 to 2.89 by weight making a wide range of 0.57 and SD of 0.26. Nonuniform dispersion of these elements gave rise to unexpected polarization as well as mechanical behavior during test conditions. Whereas, it can be observed that the dispersion of BT in SEBS-g-MA is uniform with the SD of 0.03 Ba element. The addition of a polarization group MA in SEBS was found very useful for increasing dielectric as well as compatibility to different polar materials to optimize dielectric and mechanical properties.
Distribution of Ba, Ti, O, and C element along different spectrum on by % weight.
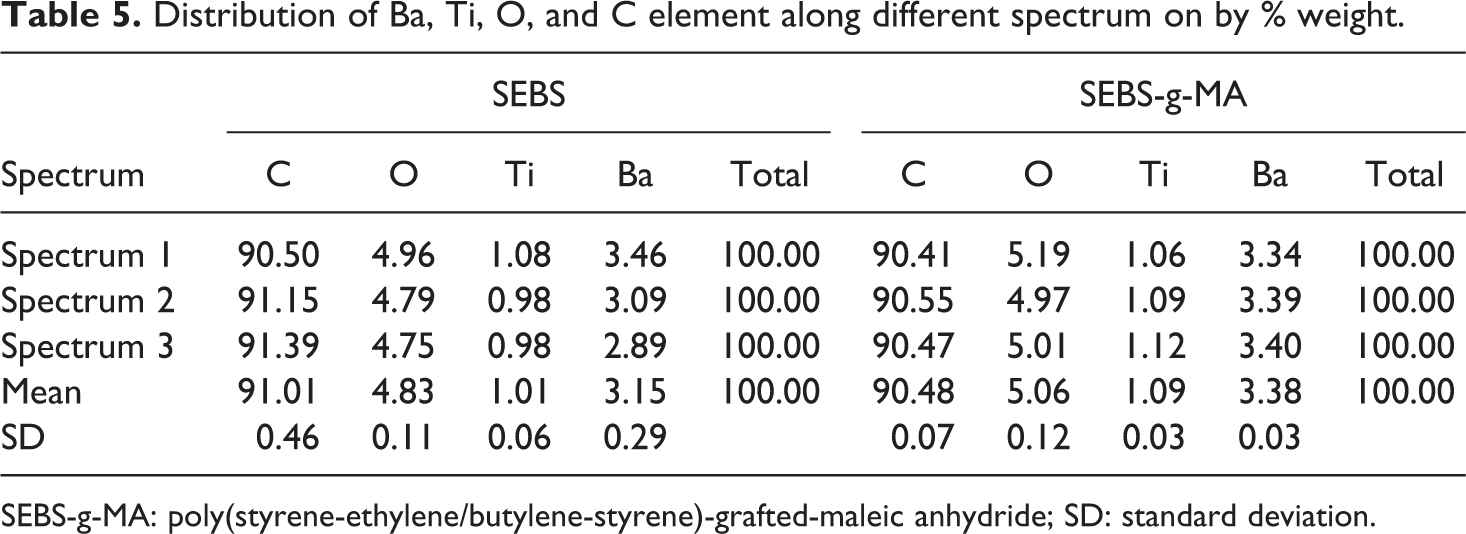
SEBS-g-MA: poly(styrene-ethylene/butylene-styrene)-grafted-maleic anhydride; SD: standard deviation.
From SEM images of SEBS and SEBS-g-MA, BT was found to be poorly distributed along the thickness of a sample for SEBS compared to SEBS-g-MA. Because of poor dispersion of BT in SEBS, SEBS-BT composite samples can be considered as different capacitors with different dielectric constant.


From equations (4) and (5)

where, ε1, ε2...εn correspond to the dielectric permittivity existed along the sample of capacitance C1, C2 ... Cn with thickness t1, t2 ... tn and cross section area A1, A2 ...A2 respectively due to poor dispersion of nanofillers into the polymer matrix. For simplicity, thickness and cross section area were considered to be constant for all small capacitors existed within a sample thickness.
Then, equation (6) reduces to equation (7)

If we consider three small capacitors with dielectric permittivity with 2, 5, and 10 arranged in parallel as shown in Figure 19, then the average dielectric permittivity measured by an instrument is valued at 3.5 only.
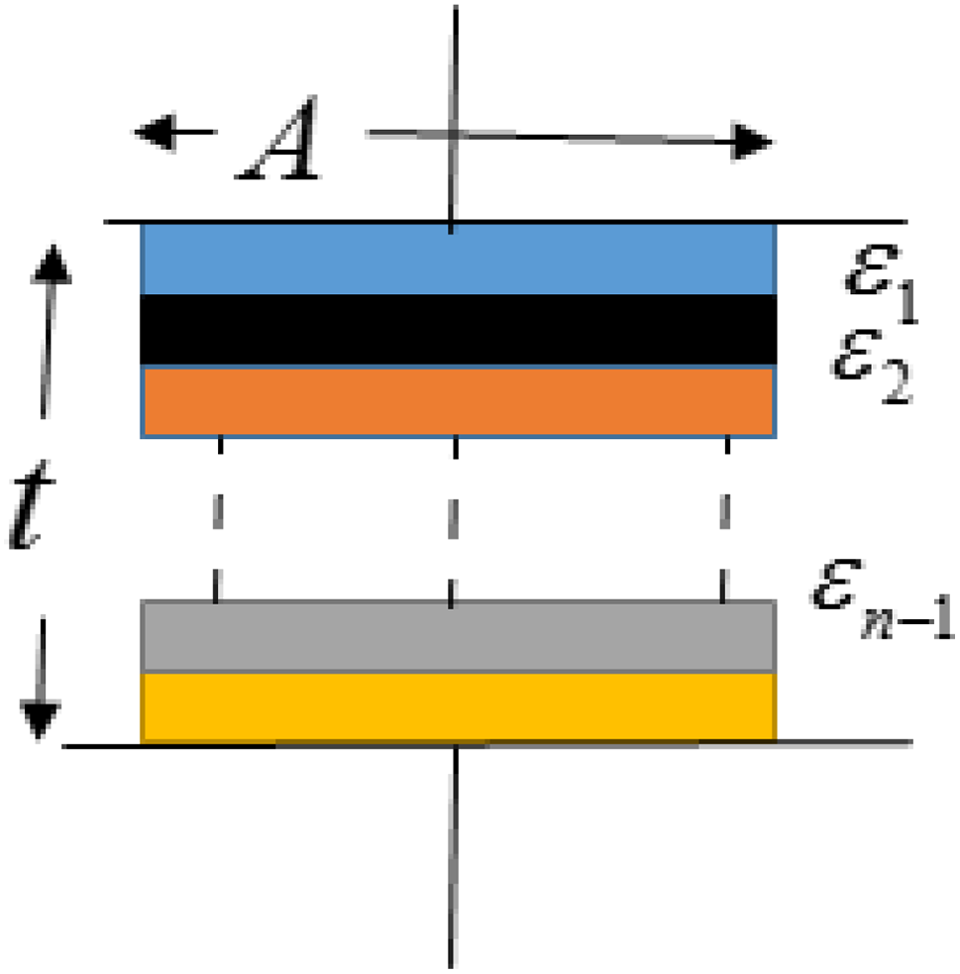
Nanocomposite with poor dispersion of additives.
But, as the dispersion level increases, the dielectric permittivity of all small capacitor becomes almost the same causing an increase in overall dielectric permittivity of composites.
Conclusions
Polarization enhancements with very low dielectric loss were achieved on nonpolarizing (SEBS) copolymers and polarizing copolymers (SEBS-g-MA) using a different concentration of dielectric filler materials (BT) by using a corotating twin screw extrusion system. However, the compatibility and interaction between polymers and additives were found to be crucial for increasing polarization as well as to obtaining better mechanical properties. FTIR, DSC, and DMA results showed the high interaction of BT with SEBS-g-MA compared to SEBS leading to the high dispersion of BT in SEBS-g-MA than SEBS polymer matrix. Change in heat enthalpy and rearrangement of micro-molecules upon BT addition on different polymer matrices had led to different thermal, electrical, morphological and mechanical behavior. However, no significant change in the glass transition of polymer matrix was observed upon addition of BT in all composite types.
The high increase in dielectric permittivity with the low dielectric loss with minimum change in loss factor was observed on SEBS-g-MA; this result suggests the potential of these manufactured nanocomposites, which can be used not only for stress and strain sensors, robotic artificial muscles applications but also for capacity energy harvesters and charge storing devices.
Minimum changes in mechanical properties (Young’s modulus, resilience as well as stiffness in both transverse as well as parallel to extrusion) compared to the high changes in dielectric permittivity in SEBS-g-MA composites also suggests that SEBS-g-MA-BT nanocomposites manufactured using this technology are highly sensitive to compression force as well as possess high Maxwell stress under an electric field. Moreover, from DMA and DSC analysis, it can be suggested that temperature plays a major role in defining the structural, and mechanical changes of nanocomposites and hence electromechanical properties.
Footnotes
Acknowledgements
The authors wish to acknowledge the Waterford Institute of Technology PhD scholarship program for financial support and also thank South Eastern Applied Materials Research Centre (SEAM), WIT and the Applied Polymer Technology Research Centre, AIT for their support throughout the work.
Declaration of Conflicting Interests
The author(s) declared no potential conflicts of interest with respect to the research, authorship, and/or publication of this article.
Funding
The author(s) disclosed receipt of the following financial support for the research, authorship, and/or publication of this article: This work was financially supported by the Waterford Institute of Technology PhD scholarship program and Science Foundation Ireland (SFI) for the financial support.