
Abstract
A composite material based on a polyester resin and fiberglass reinforcement was fabricated by the contact molding process with a fiber percentage of 40%. This material underwent a cyclic fatigue loading and 3-point bending at slow speed. The experimental results were used to plot the S–N curve based on a linear function, Hwang & Han’s relation and Basquin’s hypothesis. A probabilistic analysis based on the Weibull distribution with two and three parameters was used in order to adjust and predict the fatigue behavior of the material used in the study. This analysis made it possible to plot the fatigue curve for different levels of reliability (Ps = 99%, Ps = 90%, Ps = 50%, Ps = 36.8% and Ps = 10%), in order to identify first time to failure for material reliability and safety limits.
Introduction
The application of glass fiber reinforced polyester composite materials in various fields, such as the aeronautics, naval, automotive, and construction industries, is very important for the purposes of reducing the weight of structural components, saving fuel, and enhancing performance. 1 In fact, cyclic loads can be applied to parts and structural elements made of composite materials, leading to fatigue damage that worsens over time. Because of this, scientists and researchers expand their research in an effort to calculate the lifespans and long-term predictions of various structural components. However, most composite materials can have different properties, the nature and length of the fiber, the type of sizing, and the type of draping play a significant effect on the material’s anisotropy. 2 Furthermore, it is challenging to define composite damage in a singular way due to the variety of fatigue mechanisms directly associated to anisotropy, including numerous mechanisms such interfacial debonding, matrix cracking, ply cracking, fiber breaking, and so on. 3 In contrast to isotropic materials, like metals, where failures typically result from a dominant single crack in both dynamic and static loading, anisotropy in composite materials can cause a wide scatter in the mechanical properties, directly influence strength and stiffness, and also give very complex failure mechanisms under static and cyclic loads. Holmström et al. 4 investigated the anisotropic material behavior of injection-molded short glass-fiber reinforced polyamide-6, they found that the short E-glass-fiber reinforced polyamide-6 with 15 wt% (PA15) and 30 wt % (PA30) are considered to be moderately and highly anisotropic materials, respectively, but the anisotropy of PA15 seems to strongly depend on the anisotropy of the polyamide matrix. According to Mortazavian and Fatemi, 5 the anisotropy of fatigue behavior of short glass fiber reinforced polymer composites was more pronounced at high temperatures than at low temperatures.
When a fatigue load is applied to a composite element, one or more damage processes occur and the material’s original qualities gradually deteriorate. Therefore, in some test arrangements, it can be problematic or even harmful to define service life solely in terms of the number of cycles to failure. Additionally, materials that are fatigued can undergo a gradual development of damage and cracks that increase as the number of cycles and self-generated temperatures increase. These damages and cracks subsequently lead to changes in the behavior of the material, such as a reduction of the rigidity and resistance of the composite material. 6
The degradation is also linked to the nature of the materials, the manufacturing method, the fiber/matrix bond, and the degree of compatibility between the reinforcement and the matrix. It is therefore essential to understand the damage process by focusing on the initial failure mechanisms and then their progression during the life of the element. The fatigue damage for composite materials consists of cracks and deformation. The cracks form after a few cycles even if the loads are insignificant and much of the life is spent. 7 One strategy for dealing with fatigue damage is to treat cracks collectively for fatigue life, which calls for the characterization of an S–N curve model (S and N stand for stress and the number of fatigue loading cycles at failure, respectively) 8 A composite material’s fatigue test results can be characterized using an S–N curve, and its remaining fatigue life can be predicted using damage quantification and the stress ratio effect. To fit the S–N curve to the experimental data, a number of deterministic fatigue model curves, including parabolic, hyperbolic, and linear curves, have been proposed in the literature (such as those by Basquin, Hwang and Han, and Wohler). Abedin et al. 9 used an analytical model based on a novel Arrhenius theory to construct a fatigue master curve to evaluate the combined influence of water immersion and temperature on the fatigue strength of glass fiber epoxy composites. Basquin’s equation was used by Marques et al. 10 to assess the fatigue strength of weld joints. Despite all the heterogeneities that are present in weld joints, they came to the conclusion that Basquin’s equation can be utilized to determine the fatigue life of weld joints. However, Jeon et al. 11 discovered that because the equation of Hwang and Han includes more parameters to reflect the nonlinearity between the applied load level and the mean logarithm of the fatigue fracture cycle, it predicted fatigue life better than the usual S–N curve and Basquin’s relation. In addition, Momenkhani and Sarkani 12 claim that Hwang and Han’s equation, 13 when compared to a power-law relationship and a semi-logarithmic S–N curve model, provides the best match of experimental data for FRP laminates of low-cycle fatigue testing (less than 105 cycles). However, most metal and composite fatigue studies use the form of a power law function to express the S–N fatigue curve.14–18
Fatigue causes cumulative and uncontrollable damage. This damage subsequently causes catastrophic degradation in composite materials and reduces their lifespan, thus increasing maintenance costs. Therefore, it is crucial to use probabilistic models to forecast how these composite materials would behave under various loading and environmental conditions.19–21 In order to establish a statistical relationship between the applied stress and the resulting fatigue life, using statistical models. There are several probabilistic methods based on statistical equations which allow to interpret and analyze the experimental data of the fatigue test, among these methods, the Lognormal distribution,22,23 extreme value24,25 and the Weibull distribution.26,27 Venkata et al. 28 have studied the tension–tension fatigue life of three different hybrid composites. The experimental results have been correlated at various normalized peak stress ratios using the two-parameter Weibull distribution. Lee et al. 29 have proposed an improved method to analyze the scatter in fatigue tests and to estimate the Weibull parameter of carbon/epoxy composite material. The Weibull distribution has been used by Naito 30 to assess the flexural characteristics of carbon/glass rods in conjunction with fully reversed bending under fatigue loading.
In this paper, S–N curve models proposed by several researchers are used to evaluate and to fit the experimental data of bending fatigue tests. For samples of glass fiber reinforced polyester composite materials, the stress amplitude is displayed in terms of cycles to failure. Additionally, these experimental data are statistically examined using the Weibull analysis, in order to predict the lifespan of glass/polyester composite material during start up, by establishing survival probability curves of two-parameter and three-parameter Weibull distributions. The establishment of these curves makes it possible to determine the endurance limit and to obtain detailed real-life behavior of this type of composite material for each level of cyclic fatigue loading, and for any survival percentage.
Experimental procedures
Material manufacture
The composite material was manufactured with a randomly oriented short multidirectional glass fiber and matrix of polyester (Polylite 420-852) fabricated by the contact pressure molding technique with yarn weight fractions of 40%. The use of this manufacturing process allows producing rectangular plates (300 × 210) with a thickness of 4 ± 0.2 mm (Figure 1). The Polylite 420-852 (polyester resin) has a tensile strength of around 45 MPa, a bending modulus of approximately 2350 MPa, an ambient temperature density of approximately 1110 kg/m3, and a viscosity of approximately 20 dPa.s.
31
The elastic modulus of the glass fiber reinforcement is 5670 MPa, with an elongation at break of approximately 4.4%.
32
The glass reinforced polyester composite specimen’s average ultimate flexural strength is 180 MPa, and its Young’s modulus is 5950 MPa.
31
To conduct the cyclic fatigue test of composite material, the value of σr is required. Rectangular plate of glass reinforced polyester composite. 717 x 457mm (96 x 96 DPI).
Fatigue test specimen
Three-point bending fatigue specimens are rectangular with dimensions of l = 80 mm in length, h = 15 mm in width, and b = 4 mm in thickness (Figure 2). These dimensions represent the same dimensions in the bending strength static tests according to the ASTM D-790 standard
33
or EN ISO 14125 standard.
34
The load is applied to the middle of the sample up until the point of failure, with the fixed distance between the two supports being L = 64 mm. Using a “ZWICK ROEL” machine test type with a 20 KN capacity, constant flexure fatigue tests were carried out at a frequency of 1.25 Hz (Figure 3). Due to the material heating up, any adverse effects can be avoided thanks to the low frequency. At free air temperature, the load ratio between the minimum and maximum strength value is equal to zero since the loading is sinusoidal with constant amplitude. Different stress levels S (S = σ/σr; where σ is the maximum stress; and σr is the bending failure stress) of 80%, 70%, 60%, 55%, 45%, 35%, and 25% were used to measure the fatigue life. A minimum of six test specimens were tested for each level dose. The complete fracture of the material is the adopted criterion. Specimens used in Fatigue test. 750 x 287 mm (72 x 72 DPI). Cyclic fatigue test setup. 914 x 685 mm (72 x 72 DPI).

Statistical analysis
Most composite materials have significant heterogeneity due mainly to manufacturing defects (fiber, matrix), the distribution of the fibers, and the nature of the fiber-matrix bond. This heterogeneity leads to significant dispersion of experimental characterization results, in particular in fatigue tests. Therefore, it is very important to use statistical models such as the Weibull distribution in order to interpret and analyze fatigue scattering issues. Weibull’s distribution offers several benefits (both in its two-parameter form and with three parameters). The distribution is easy to use because it is modeled as a straightforward function. 28
The three-parameter Weibull distribution’s probability density function (PDF) is as follows

When the value of μ decreases to zero (Equation (2)), the three-parameter Weibull distribution transforms into a two-parameter Weibull distribution. According to Li et al.
35
the three-parameter Weibull distribution has a better fitting capacity than the two-parameter form. The cumulative density function (CDF) is derived by integrating equation (1)


For each value of the failure probability, Bernard’s median rank formula is applied19,36,37
It is possible to compute the standard deviation (SD), coefficient of variation (CV), and mean life time to failure (MTTF) of the three- and two-parameter Weibull distributions using the following equations
37


Result and discussion
S–N curve
In this section, several recent methods, including a linear function, the equation of Hwang and Han,
13
and Basquin’s equation
38
(Equations (9)–(11)), will be discussed in relation to S–N curve models created specifically for the characterization of experimental fatigue data subjected to a constant load amplitude


In Figure 4, the applied stress in a fatigue test is compared to expected values (linear function, Hwang and Han equation, and Basquin’s equation) as a function of the number of cycles. It is evident that as applied stress is raised, the cyclic fatigue failure number (N) of the glass reinforced composite material falls. The samples examined for the 25% loading level, however, are unharmed; hence, the analysis cannot continue using this data. S–N curve of glass reinforced polyester composite material. 238 x 226 mm (96 x 96 DPI).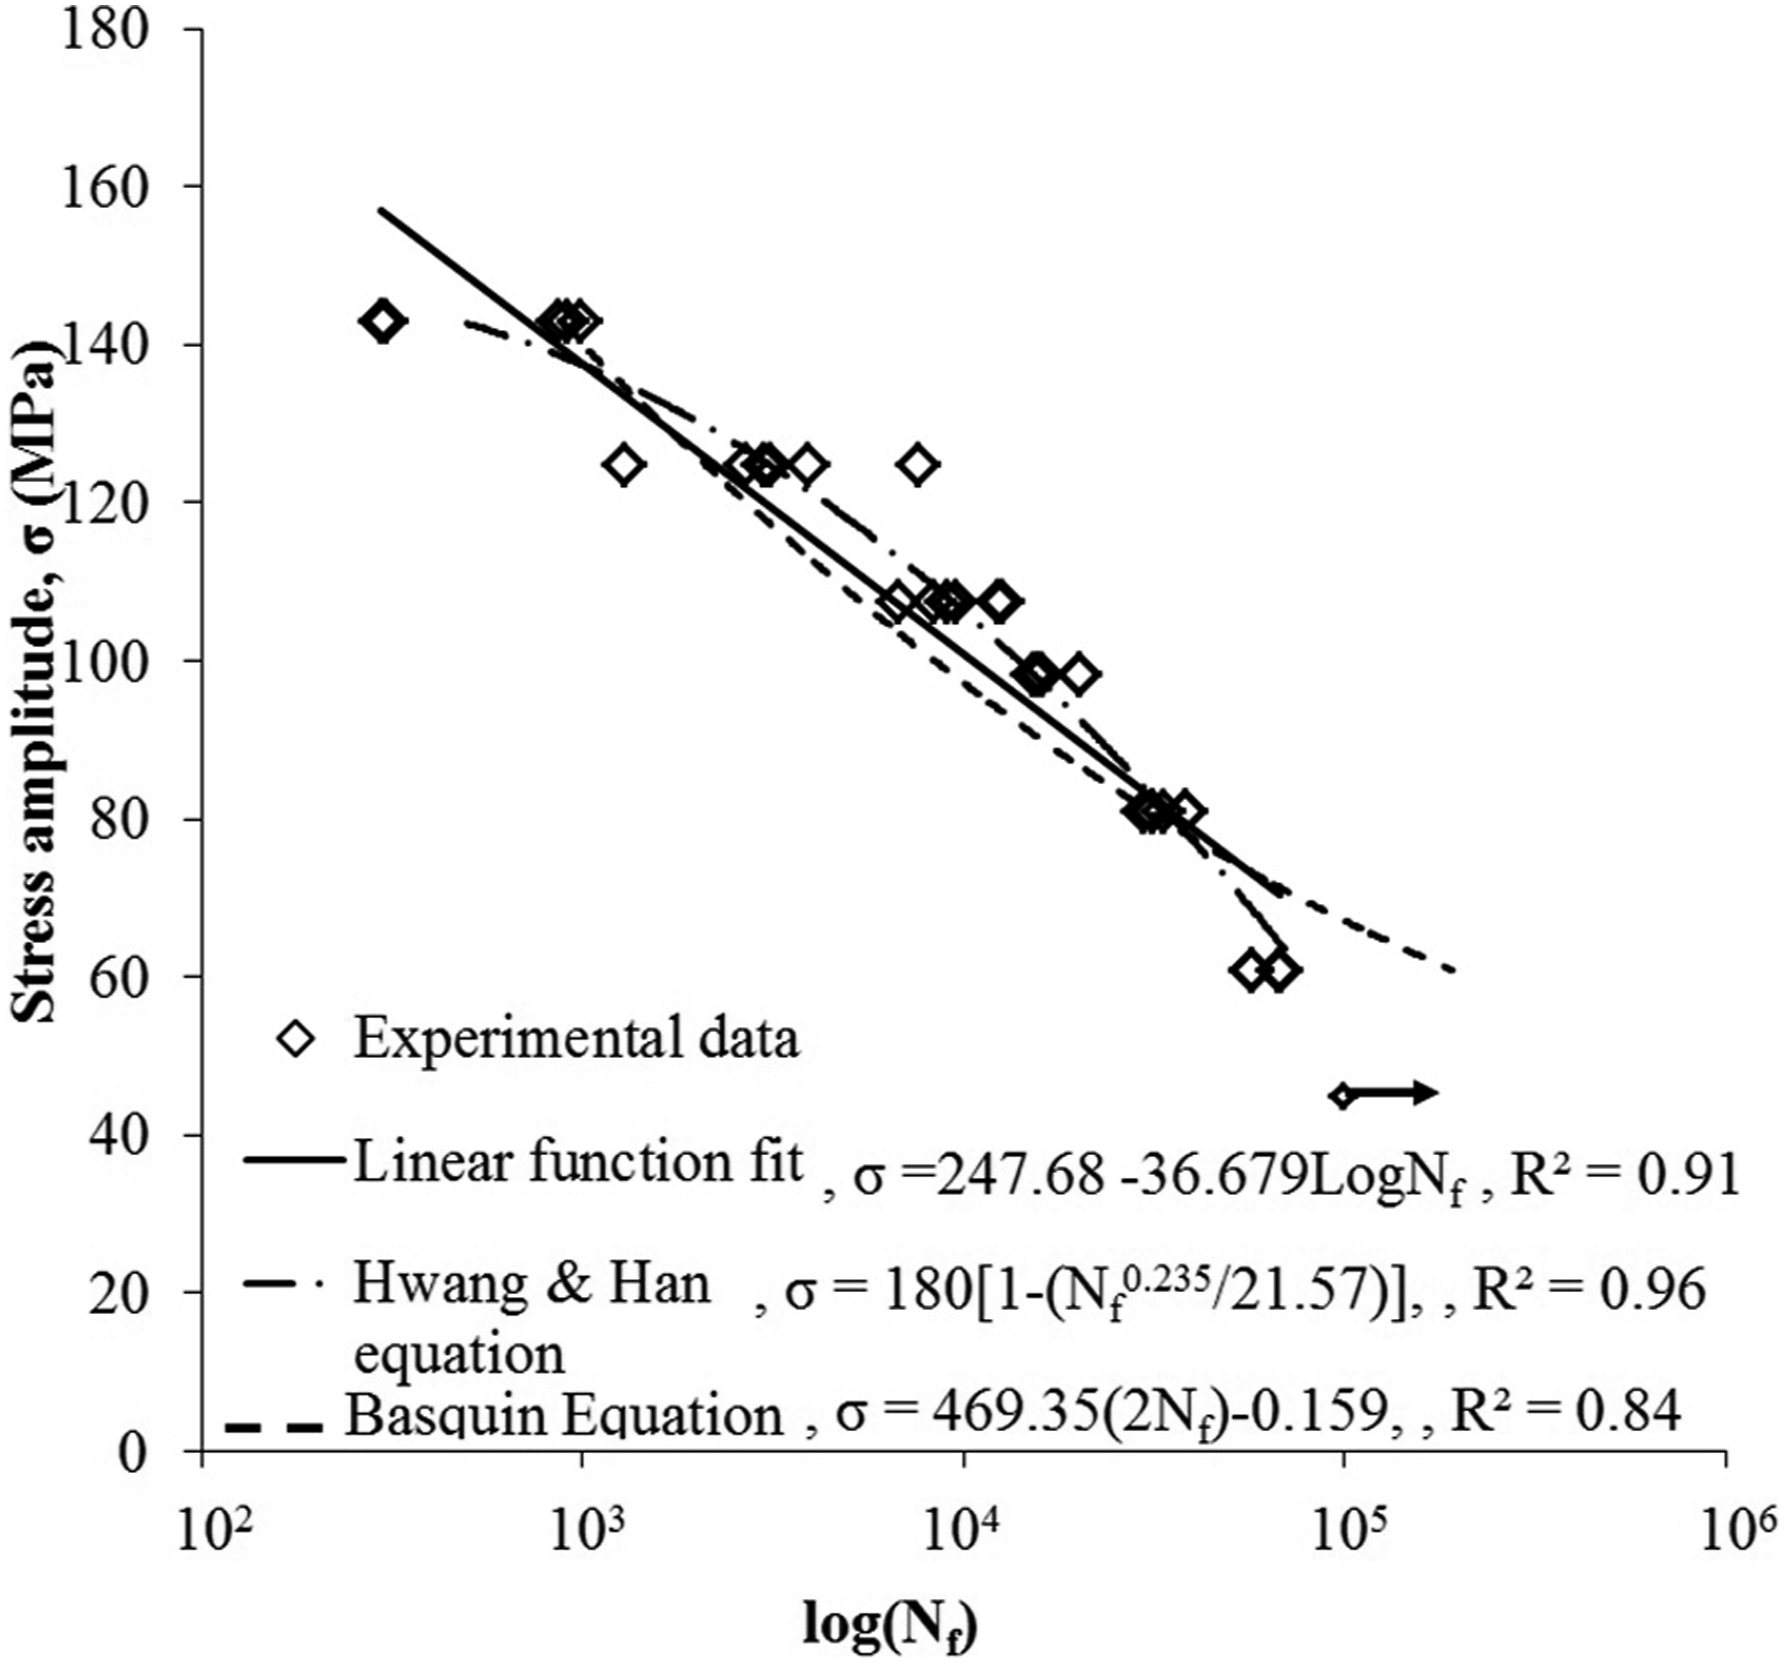
The cyclic fatigue test under different load levels causes visible damage to the area of contact with the applied load. This damage causes a change from the initial properties of the glass fibers and the polyester matrix. The damage in the composite material then progresses through an increasing number of cycles until the fibers and matrix of the composite are completely broken. Contrary to lower stress loading, however, where failure of the fiber and matrix recurs and leads to breakage and composite damage more slowly, high loading levels cause fiber damage instead, with fracture in the flexural failure band and interfacial shear and die cracking occurring over time. These mechanisms can then affect the material’s overall state of deterioration. In addition, the amount of damage that has built up in a particular area of the composite material during cyclic loading may be so large that failure results when the residual load-bearing capacity of the composite in that area drops to the level of the fatigue cycle’s maximum stress. Furthermore, the increase in the number of cycles can cause small viscoelastic movements in the polyester matrix. These movements may gradually lead to localized stress redistributions that allow for some random fiber damage, and identical damage will occur close to all the sections that are subjected to cyclic loading. After then, and depending on the quantity of stress failures, damage levels will increase up to a critical point at which the composite strength will fail since it will no longer be higher than the peak cycle stress level. 39
The experimental results of the cyclic fatigue test show dispersion in the lifespan (Figure 4) of the material studied. The main causes of this dispersion are the material’s heterogeneity, the density, and distribution of the defects within the composite. In addition, the physical and mechanical characteristics of the tested specimens rarely have the same mechanical response for the same loading level and the same test conditions.
Fatigue life: Comparison with experimental data.
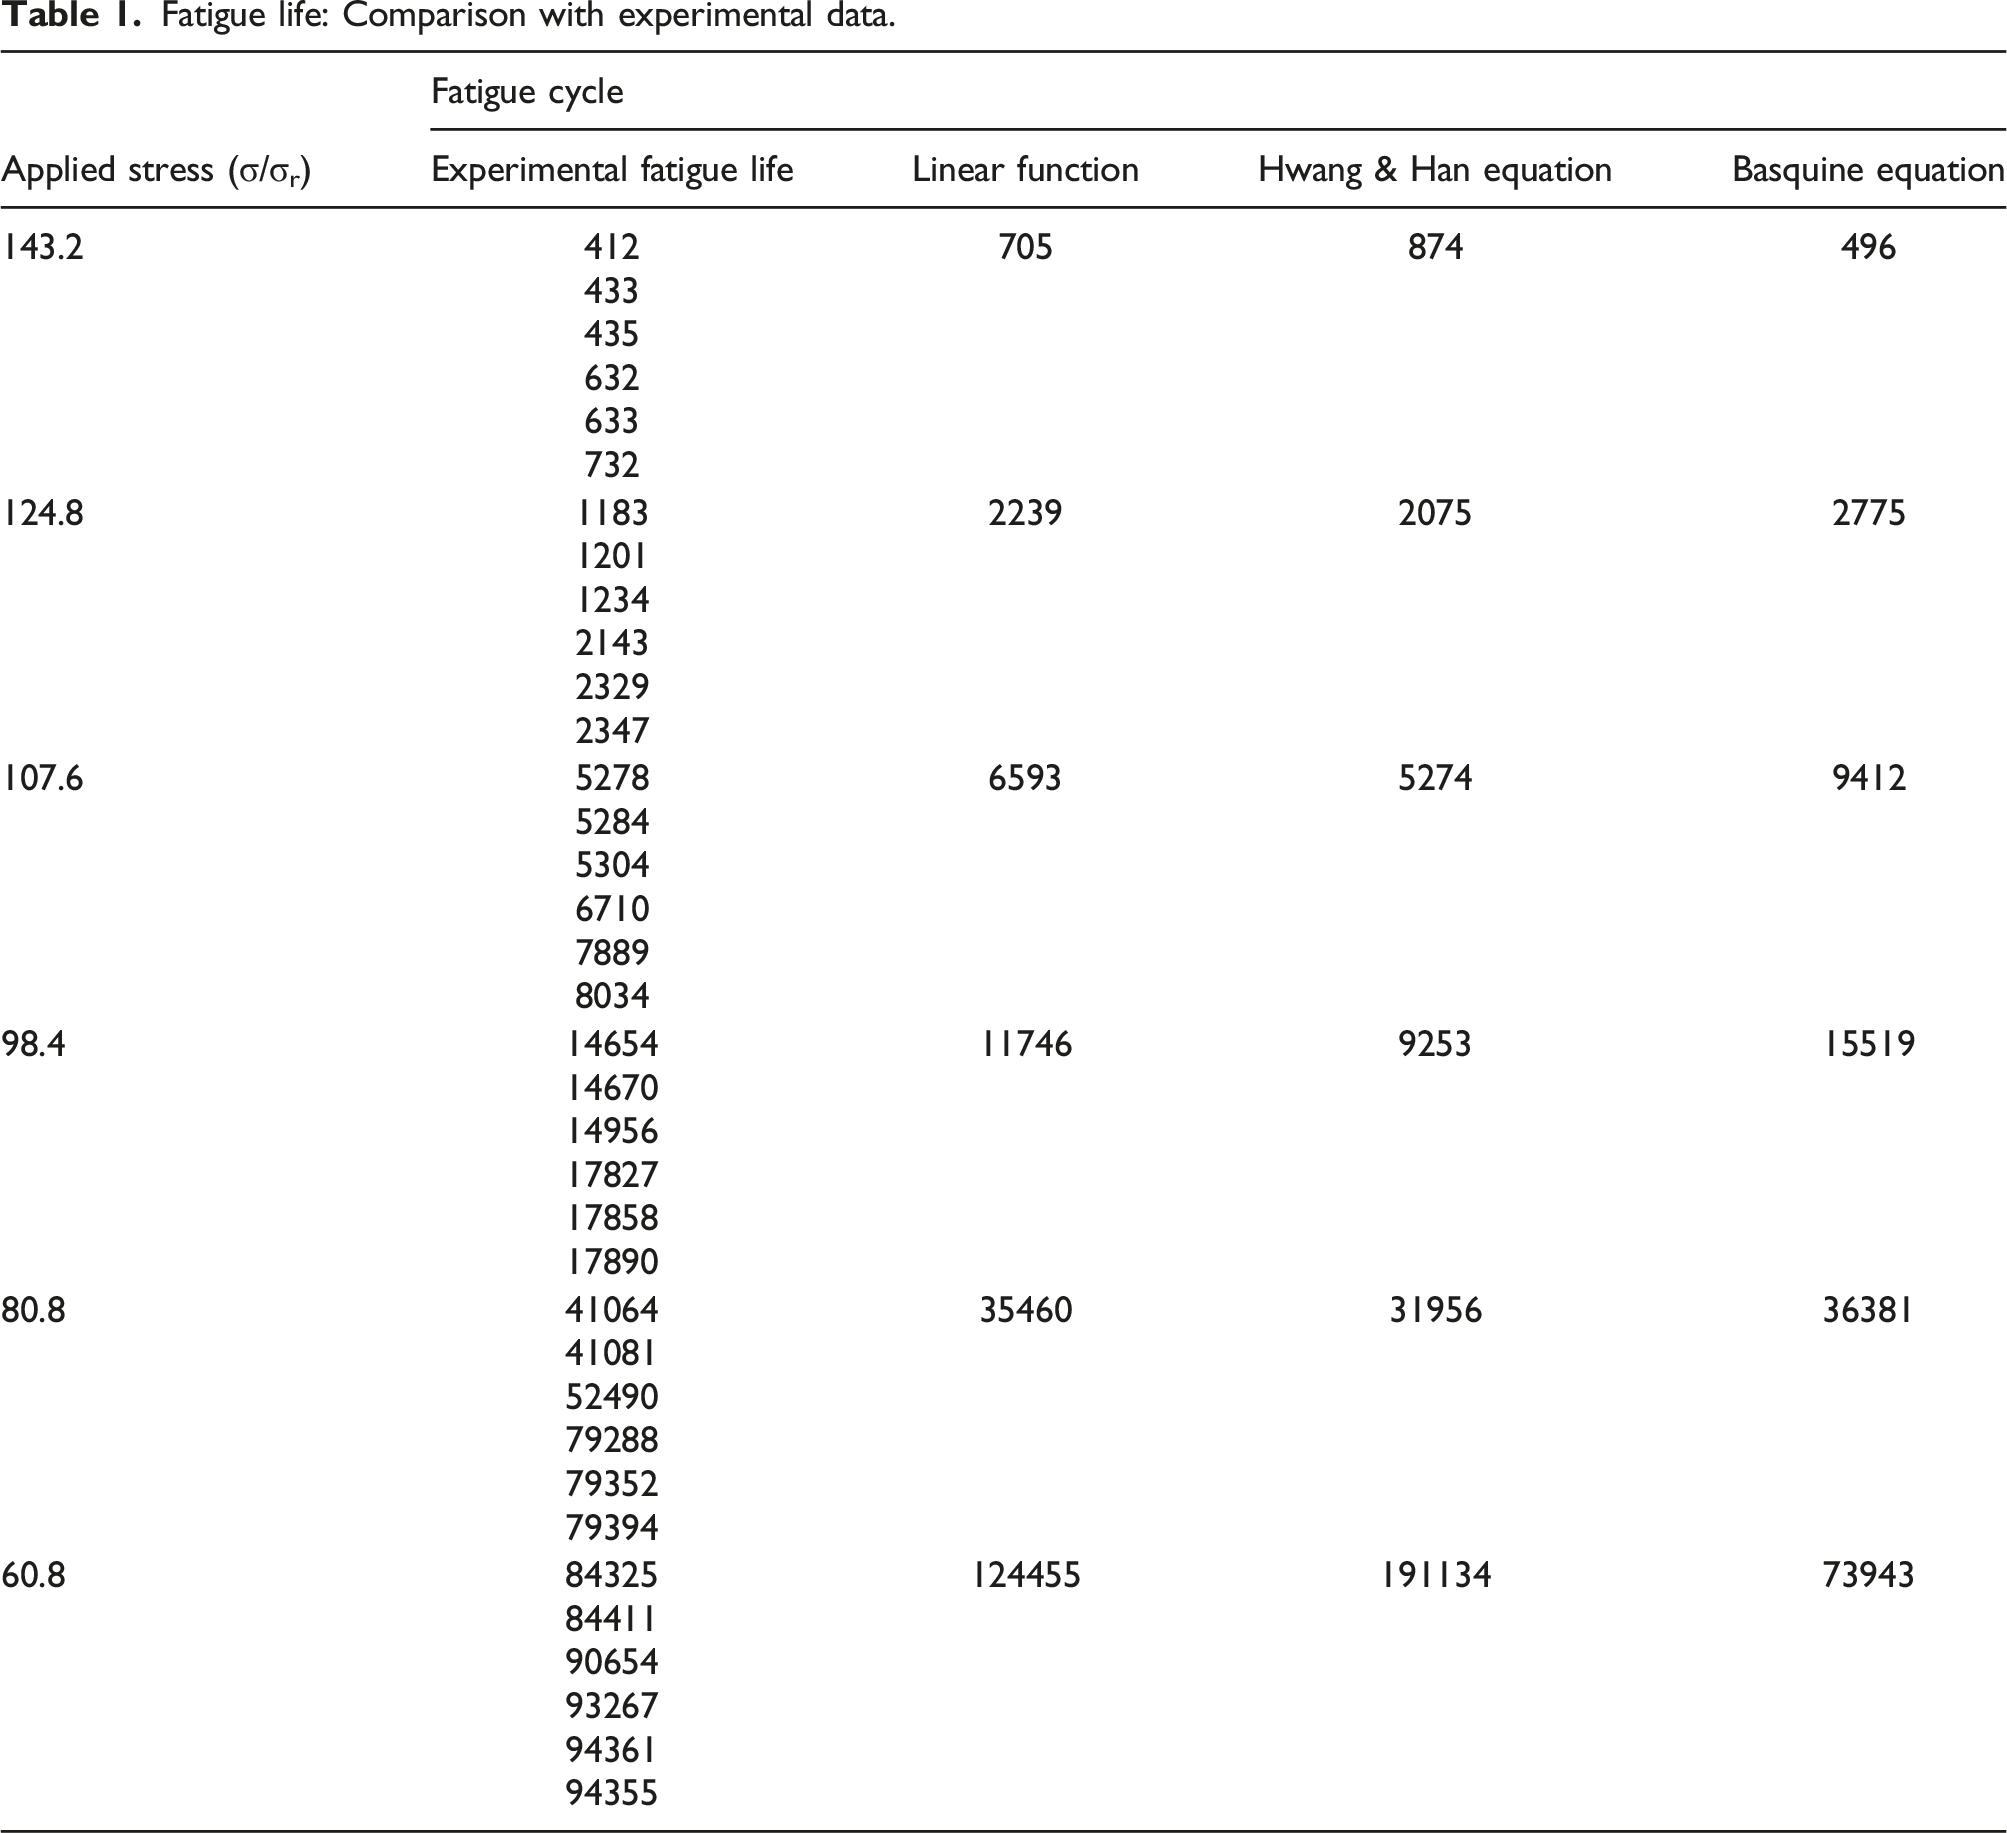
It is clear in Figure 4 and Table 1 that the number of cycles to fracture obtained from the Basquin equation for the 0.35 loading level is very large compared to those obtained from the linear function and the Hwang and Han equation. This difference in behavior across models indicates that the exponent b in the Basquin equation (11) noticeably affects the slope of the fatigue curve.
It would seem that the equation proposed by Hwang and Han more accurately captures the experimental data in the area of olygocyclic fatigue. The Basquin equation, which appears to have a curvature leaning towards an asymptote, allows for the determination of an endurance limit in the field of endurance higher than 105 cycles. The linear function, despite the fact that it cannot account for a horizontal branch, seems to frequently give a decent approximation of the middle part, according to the dispersion of the experimental points. It can be used to compare variations in endurance curve charting caused by changes in material composition, test frequency, environment, and stress amplitude.
Weibull distribution
The evaluation of the cycle fatigue life of glass-polyester composite material was covered in the part before, which described observations obtained on the basis of theoretical equations using the assumptions of Hwang & Han and Basquin. Due to the data’ high degree of dispersion, a statistical analysis using the probability distribution of Weibull with two and three parameters is necessary. The glass/polyester composite material’s service life can be predicted using a probabilistic approach, and the fatigue findings can be used to assess the material’s dependability and survival chances.
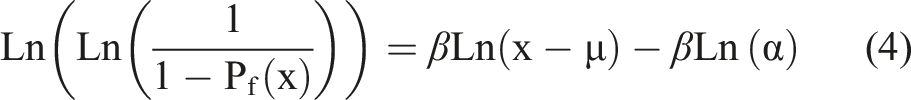
Indeed, Figure 5 presents the fitting of the two- and three-parameter Weibull distribution to the results of the fatigue test as a function of the loading levels with the use of equation (4). This adjustment is made by fixing the cumulative distribution function of the data in the sense of least squares. However, the loading percentage which corresponds to 25% with respect to the 3 point bending failure stress does not result in the total failure of the tested specimens; in this case, these data cannot be used further in the study. Weibull plots for the tested load amplitudes. 356 x 182 mm (96 x 96 DPI). (a) Weibull with two parameters. (b) Weibull with three parameters.
Weibull parameters in fatigue test.

By using the two Weibull distribution functions to predict the cyclic fatigue response of a glass/polyester composite, the analysis of the prediction results shows that the predicted values of the fatigue data have almost the same correlation coefficient, demonstrating the validity of this statistical analysis. However, the scale parameter (α) and the shape parameter (β) obtained by the three-parameter Weibull analysis exhibits smaller values than the values obtained by the two-parameter Weibull analysis, as reported in literature.41,42 This difference is mainly due to the inclusion of a threshold lifetime (location parameter μ) in the three-parameter Weibull distribution. In addition, for the elements which undergo a fatigue load with the establishment of a fatigue threshold which considers that the specimen does not suffer any damage below this threshold (the number of cycles at break in a range of µ-α for the three-parameter Weibull analysis). Unlike the two-parameter distribution method which considers that the minimum value of fatigue strength is 0 (the number of cycles to failure in a range 0-α). Therefore, the three-parameter Weibull analysis offers more precision and more security compared to the two-parameter Weibull analysis. Figure 6 shows a curve representing the mean fatigue life [MTTF] and coefficient of variation [CV] for various loading levels as determined by equations (7) and (8). It should be noted in this figure that the coefficient of variation [CV] of the Weibull distributions used has maximum values (32% and 62% for the two-parameter and three-parameter Weibull distribution, respectively) for high loading levels, which correspond to a lifetime between 102 and 103 cycles. These large values of [CV] indicate the large dispersion of the fatigue findings, which is mostly caused by the nonlinear behavior of the test samples under heavy stress. However, a remarkable decrease in [CV] was recorded for lower fatigue loads. This decrease is mainly due to the use of a lower fatigue load than the breaking load, which makes it possible to create damage with a large number of cycles (104–105 cycles). For the design and use of this kind of composite, this tendency of fatigue dispersion at various loading levels is quite significant and warrants careful consideration.
43
Effect of mean fatigue life on coefficient of variation [CV]. 224 x 182 mm (96 x 96 DPI).
Despite the large number of test pieces used for each loading level, the significant heterogeneity of this type of composite material—which is mainly due to the non-uniform distribution of glass fibers within the polyester resin and the manufacturing method—leads to a dispersion of the results of the cyclic fatigue test. Thus, it is imperative to apply the probability of survival to properly and prudently measure the crucial region that is subject to cyclic loads.
Equation (4), which depicts a linear function, can be used to determine the dependability of the samples collected in cyclic fatigue for different levels of loading: 
This equation enables the survival probability curve to be plotted as a function of the glass/polyester composite material’s cyclic fatigue life (Figure 7). Survival probability graphs for glass reinforced polyester composite material. 335 x 183 mm (96 x 96 DPI).
It is very important to note that the survival probability curves shown in Figure 7 are of great utility to the designer since they make it simple to calculate the cyclic fatigue life at any survival percentage. Drawing a horizontal line that intersects the fatigue life distribution curves will allow you to calculate the 10% probability of survival from these curves. The lifespan for a 10% probability of survival at various loading levels are shown by the values at the intersecting points. For instance, the intersection of the horizontal line for a probability of survival of 99% results in a number of life cycle cycles of approximately 190 cycles and 26 cycles for the two-parameter and three-parameter Weibull distributions, respectively, for a loading level of 80%, which corresponds to a stress of 143.2 MPa. This life cycle cycles for a loading level of 35% (60.8 MPa) becomes a value of 53,134 cycles and 22,608 cycles, for the Weibull distribution with two and three parameters, respectively.
It is very likely that some component will survive the cyclic load or typical life in the situation of (Ps(x) = 0.368). Equation (3) can be used to find this reliability value by changing x to α.
Equation (13) may be derived from equation (3) using the derivative, allowing the survival probability curves for all loading levels as a function of lifetime to be plotted. It is possible to forecast the cycle fatigue life of glass/polyester composite material by plotting these curves (Figure 8). These curves play a significant role in the design and actual use of this kind of composite material. According to the level of reliability, it enables the prediction of the mechanical behavior of the samples under cyclic fatigue at the time of service. For structural elements that contain defects or critical parts (may be damaged under repeated loading), it is highly recommended to use the calculated high reliability life (90%–99%). The results obtained from equation (13) were correlated with the linear function y = Ax + B, with A and B being material constants (Figure 8) S–N curves for different reliable levels for glass polyester composite material. 337 x 153 mm (96 x 96 DPI). (a) Weibull with two parameters. (b) Weibull with three parameters.

It is very important to note that the number of cycles to failure will be high for lower levels of security or confidence (Figure 8). For the Weibull distribution with two or three parameters, the constants A and B also underwent a remarkable increase with the decline in survival probability.
The curves in Figure 8 can be used to describe the data on the mechanical properties of the composite material studied, and to forecast how the sample will act and respond over time, as a function of degree of reliability, and as a function of service time. The reliability of members subjected to cyclic fatigue may then be evaluated, and the service life of glass/polyester composites can be estimated in accordance with design criteria, using the two- and three-parameter Weibull distribution models. 44
Conclusion
Based on the findings of cyclic fatigue test and Weibull statistical analysis of fiberglass reinforced polyester resin composite material, the following conclusions can be drawn: • Because of the material’s anisotropy and the way the cyclic fatigue test is conducted, there is a notable dispersion in the results. It is quite challenging to forecast the fatigue life given this behavior. • It was found that the linear equation, Hwang and Han’s equation, and Basquin’s equation all produced results that, in the majority of cases, came closest to the experimental data for the fatigue test’s number of cycles to failure, while the results obtained from the Hwang and Han equation strongly approach the experimental data of the cyclic fatigue test. • The probabilistic analysis of the fatigue data of 3-point bending tests by the use of the Weibull distribution with two and three parameters presents a lifespan very close to the experimental one, indicating the reliability of this analysis. • Under various loading percentages in cyclic fatigue, Weibull’s cumulative density function forecasts the probability that glass/polyester composites will survive and be reliable. For designers and engineers, the survival probability graphs produced by the Weibull analysis are of great importance, they enable the identification of the first failure time under any fatigue stress amplitude since the safety limitations are based on the confidence level. Furthermore, it is recommended to use reliability Ps(x) = 90%–99% when designing structural elements that have crucial components or defects. • To ensure the stability of elements made of glass/polyester composite material, the service life must be calculated at a high level of safety, in particular for structural elements which contain critical parts which may lead to breakage at the time of service. • The three-parameter Weibull distribution is highly recommended in this type of stress since it offers more security and reliability.
Footnotes
Declaration of conflicting interests
The author(s) declared no potential conflicts of interest with respect to the research, authorship, and/or publication of this article.
Funding
The author(s) received no financial support for the research, authorship, and/or publication of this article.