
Abstract
Composite materials have been manufactured using bidirectional jute yarn in a polyester matrix. The manufactured composite has been subjected to water aging for various times of immersion (90, 180, and 270 days). A significant decrease of fatigue strength has been observed during water aging. The number of cycles to failure of the aged and nonaged specimens were correlated using the two-parameter Weibull distribution function to determine the probability of failure and plot the S–N curves at different reliability levels. The results have shown that the two-parameter Weibull distribution describes the fatigue life probability distributions of jute-reinforced polyester composite material with highly significant statistical correlation coefficients.
Introduction
In recent years, there has been increasing interest in the use of natural materials for different applications due to growing environmental problems. Those involved in various fields, such as the aeronautics, naval, automotive, and construction industries, are forced by new, more challenging environmental policies to search for new composite materials that can be substituted for organic composite materials.
Jute fibers are one of the most widely used groups of natural fibers and have been extensively used for boats and submarines, ensuring low weight and optimizing protection against fire. Indeed, these fibers are naturally biodegradable, renewable, and less abrasive, with low density, specific strengths, and good modulus. 1,2 Reis et al. 3 have confirmed that hybrid jute composites which contain hemp fiber have economical, ecological, and recycling advantages and specific fatigue strength benefits when compared with full glass fibers reinforced with polypropylene laminates.
However, composite materials based on vegetable fiber have a very high water uptake because these fibers contain a high percentage of cellulose, 4 which is hydrophilic in nature and displays poor resistance to water absorption. 5,6 These major drawbacks of cellulose fiber restrict the use of vegetable fiber composites in many outdoor applications requiring high strength. Thus, prolonged immersion of these materials in water results in water aging of composites, which can lead to swelling of the fiber, forming microcracks at the fiber–matrix interface region, ultimately resulting in poor stress transfer efficiencies and a reduction in the composites’ mechanical properties. 7 Hazizan et al. 8 have affirmed that the mechanical properties studied in the static bending and compression tests of a jute-reinforced polyester composite decreased with the increase in water uptake. These decreases were explained by the plasticization of the matrix–fiber interface and the swelling of the jute fibers. Hossain et al. 9 have performed bending tests after the water aging of jute-reinforced composite material. The material’s flexural strength and modulus were decreased for up to 60 days after moisture absorption. Athijayamani et al. 10 have proved that the tensile and flexural strengths of sisal fiber hybrid polyester composite in dry conditions decrease when the samples are subjected to moist environments. This moisture-related decrease in mechanical properties is due to the formation of hydrogen bonding between the water molecules and the cellulose fiber.
Moreover, the structural composite material elements can be subjected to cyclic loads, which can lead to debonding and microcracking in the composite even through the loads are insignificant. This phenomenon is called fatigue of materials, which is vital to the design of structural elements. Hence, the study of the fatigue behavior of these composite materials is essential in predicting their behavior in various types of cyclic loading. In recent years, several publications have proposed explaining the fatigue behavior of natural composite materials. 11 –13 Fotouh et al. 14 developed a new model of predicting the fatigue behavior of hemp fiber–reinforced, high-density polyethylene composites at different fiber fractions and fatigue stress ratios. This model is capable of predicting fatigue life and accounting for the effect of moisture absorption. Towo and Ansell 15 studied the cyclic behavior of sisal/polyester composites under fatigue test to determine the effect of alkali-treated fiber. Gassan 16 performed a tension–tension fatigue test of flax and jute-reinforced epoxy composite material. He found that the textile architecture, interphase properties, and fiber properties and content affect the fatigue behavior of these composite materials.
To achieve better design and use of jute-reinforced polyester composite material, it is necessary to predict its fatigue life in various conditions using statistical methods. The Weibull distribution function is among the best probabilistic methods of predicting the fatigue life of composite materials. This distribution is expressed in high-precision, simple form functions based on mathematical equations. The reliability graphs for unidirectional glass fiber/random and glass fiber/epoxy hybrid composite laminates were constructed by Selmy et al. 17 to obtain the scatter in the experimental data based on two-parameter Weibull distribution function. Yang et al. 18 developed a statistical model using two-parameter Weibull cumulative density function (CDF) based on survival probability. The developed model was used to produce distribution diagrams which can predict the fatigue life behavior of wood flour–reinforced high-density polyethylene.
This study seeks to analyze the influence of water immersion on the fatigue strength of jute-reinforced polyester composite materials. The test results for these composite materials will be analyzed statistically using the two-parameter Weibull distribution function. Consequently, these figures for S–N curves will allow designers to determine the fatigue life for any survival probability.
Experimental protocol
The material investigated for this study is an unsaturated polyester matrix reinforced with three layers of bidirectional natural jute yarn manufactured by the contact molding method. This method produces rectangular plates (300 × 210 mm2) with a mean thickness of 4 ± 0.2 mm and a volume fraction of 40% jute fiber. The unsaturated polyester resin (Polylite 420-852) has a tensile strength of about 45 MPa, a density at ambient temperature of 1110 kg/m3, and viscosity around 20 dPa s. The breaking stress is 72 MPa and the bending modulus is about 2350 MPa. The jute fiber reinforcement has an average density of 1300 kg/m3, with an areal weight of 0.88 kg/m2, an elongation at break of about 1.6%, and an elastic modulus of 20–55 GPa. 19,20
The static tests are performed at a constant crosshead speed of 2 mm/min. Specimens for the bending strength static tests are in rectangular form (Figure 1) of l = 80 mm length, h = 15 mm width, and b = 4 mm thickness. 21

Specimens used in static and cyclic load.
The samples are immersed in a bath containing natural water and aged separately for 90, 180, and 270 days, respectively. Specimens are withdrawn from the water on the designated days, wiped dry to remove the water from their surfaces, and carefully dried with an absorbent paper until a constant weight is reached. The uptake water is calculated by comparing the initial and final weights according to equation (1). The average of five test pieces is adopted for each immersion time.

where mt represents the weight of the test specimen immersed in water for time t and m 0 is the weight of dry specimens (before immersion in water).
To facilitate the presentation, we will use the following symbols for the composites studied: JP0: nonaged jute/polyester composite material; JP90: aged jute/polyester composite material for 90 days; JP180: aged jute/polyester composite material for 180 days; JP270: aged jute/polyester composite material for 270 days.
The three-point bending static and cyclic fatigue tests were performed on nonaged jute/polyester composite material (JP0) using a Zwick/Roell Z020 universal testing machine with a load cell of 20 kN and controlled by the computer software “test expert.” The error percentage of the test was found to be 1% (Figure 2). The fixed distance between the two supports is L = 64 mm; and the load is applied to the middle of the sample until the point of failure.

Complete devices in static bending and cyclic fatigue test.
All samples test of nonaged (JP0) and aged (JP90, JP180, JP270) composite materials subjected to cyclic fatigue test were loaded and unloaded repeatedly with a sinusoidal waveform signal and the ratio R = 0 between the minimum and the maximum strength value. The loading frequency was set to 1.25 Hz frequency, and the test specimens were subjected to various loading levels at 80%, 70%, 60%, 55%, 45%, 35%, and 25% of the value of the static failure strength in the three-point bending test. For each level of load, a minimum of three specimens were tested.
Weibull distribution
The primary disadvantage of fatigue cyclic experimental test is the dispersion of results for composite materials in particular. This dispersion is caused due to the internal structure of composite material and the manner in which the manipulation test is conducted, necessitating the use of statistical analysis methods based on mathematical assumptions for safe utilization in manufacturing and design. One of the methods of statistical analyses is the Weibull distribution method, which has been recently used for the determination of fatigue properties of many materials. 22 –24
The following two forms of the statistical method of Weibull distribution function are very popular: the two-parameter and the three-parameter. The two-parameter Weibull distribution possesses several advantages, such as its ability to be expressed in a simple function form, making it easy to apply and compare with the reported data, as the distribution accurately describes composite fatigue life prediction and failure time. 25
The distribution function or probability density function (PDF) of the two-parameter Weibull distribution case can be written as follows 26 –29 :

where α is the scale parameter (representing characteristic life in the context of the present study), β is the shape parameter of the two-parameter Weibull distribution (representing the inverse measure of the dispersion in the fatigue life results in this specific context), and x is the independent variable (denoting, in the analysis of fatigue life in this study, the number of cycles to failure). For a higher scale parameter value, α indicates that the overall durability of the product is acceptable. The CDF or the probability of failure, Pf (x), is given by equation (3) and is obtained by integrating the PDF in equation (2). 27 –29

The survival probability, Ps (x), which indicates that the sample test performs its designed functions for a specific period of time without failure, is expressed as equation (4).

The distribution parameters, α and β, can easily be implemented by taking the natural logarithm of both sides of equation (3) which can be rewritten in the following form:

When equation (5) is considered as a linear function (y = mx + b) so that the relationship between ln[ln(1 / (1 − Pf (x)))] and ln(x) is linear, it can be concluded that

The probability of failure (Pf (x)) for each sample is determined by calculating Bernard’s median rank using the following equation 30,31 :

where i is the failure order number and n is the total test number of samples. 32 –34
The mean fatigue life of a sample test, also known as the mean time to failure (MTTF), is expressed as in equation (7). Equation (8) gives the standard deviation (SD), where Γ is the gamma function. The ratio between the SD and the MTTF gives the coefficient of variation (CV) as shown in equation (9) 35,36 :


According to Rovel et al., 37 the CV is a function of the parameter β, which can be calculated using equation (10) for values of β > 8.

Results and discussion
The bidirectional jute/polyester composites used in this study provide several significant results in a number of sample tests.
Water uptake
The aging of samples of jute/polyester composite materials in water causes a change in the samples’ physical properties. This change depends on the chemical nature of water and the characteristics of the composites: the nature of their fibers and matrices, the specimens’ geometry, and the architecture and percentage of reinforcement.
The jute/polyester composites present an increase in weight gain with the increase of immersion time (Figure 3). The water absorption curve shows that the water uptake is important at the first stage (zero to roughly thirty days), during which water penetrates predominantly voids and between preexisting microcracks. After approximately 30 days, this curve becomes almost constant until the end of the immersion time (270 days). The curve undergoes a significant stabilization as the material reaches to saturation, which is attributable to the swelling of the components. Thus, the final equilibrium is reached.
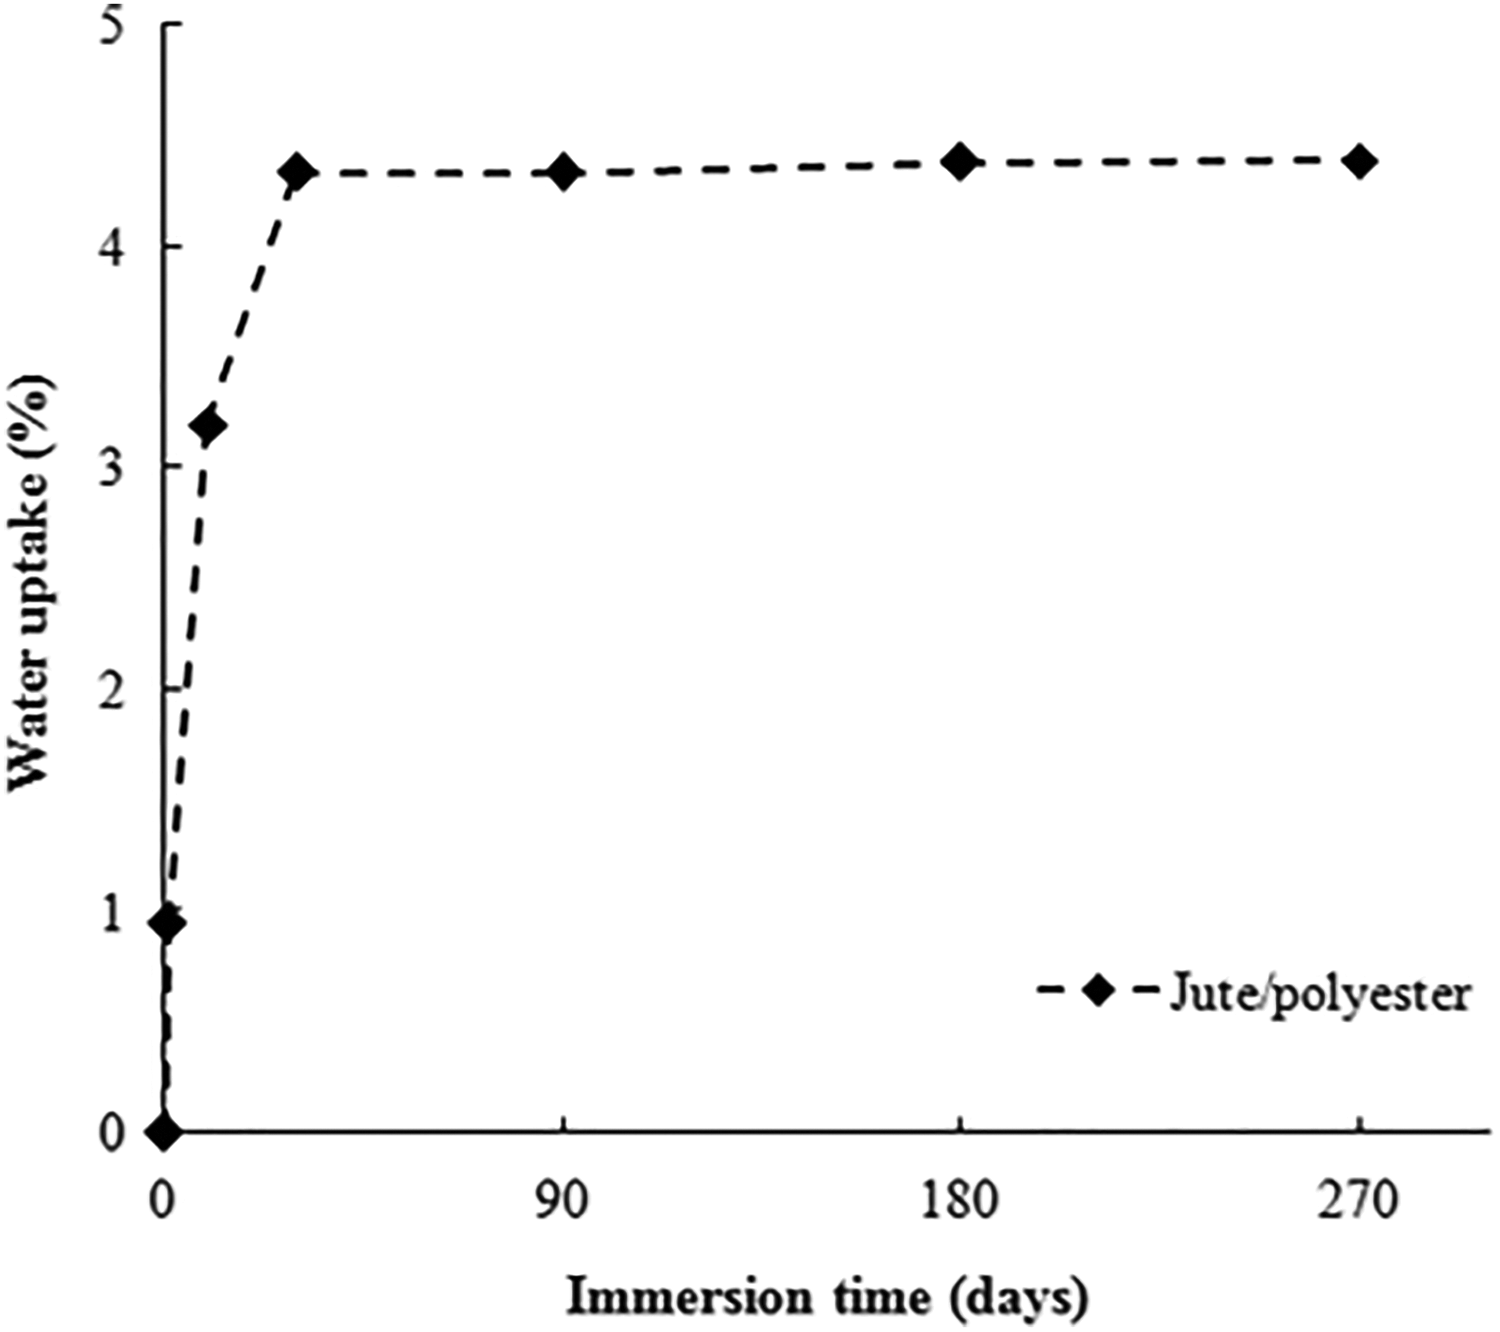
Absorption curve for jute polyester composites immersed in water.
Static bending test
The average values of the flexure of the mechanical properties measured in three-point bending of nonaged composite material (JP0) are ultimate flexural strength σr = 83.5 ± 7.2 MPa and Young’s modulus Ef = 4510 ± 563 MPa. These values are in agreement with those generally reported in open technical and scientific literature regarding measurements on similar composite materials. 1 The σr result is necessary to perform a cyclic fatigue test on composite material.
Figure 4 shows an example of the evolution of the typical stress–strain curve obtained from the three-point bending tests on nonaged specimens of jute/polyester composite material. This curve can be divided into three main regions. The first region is characterized by a linear increase of deformation under bending stress until a specific level of strain is reached, translating the elastic behavior of the material. The second region presents nonlinear behavior that is related to the initiation and the evolution of the progressive damage occurring in the composite material. Finally, in the third region, a sudden load drop beyond the maximum load announces the instability and ruin of the specimen.

Stress–strain curve of jute polyester composite material (JP0).
Fatigue test
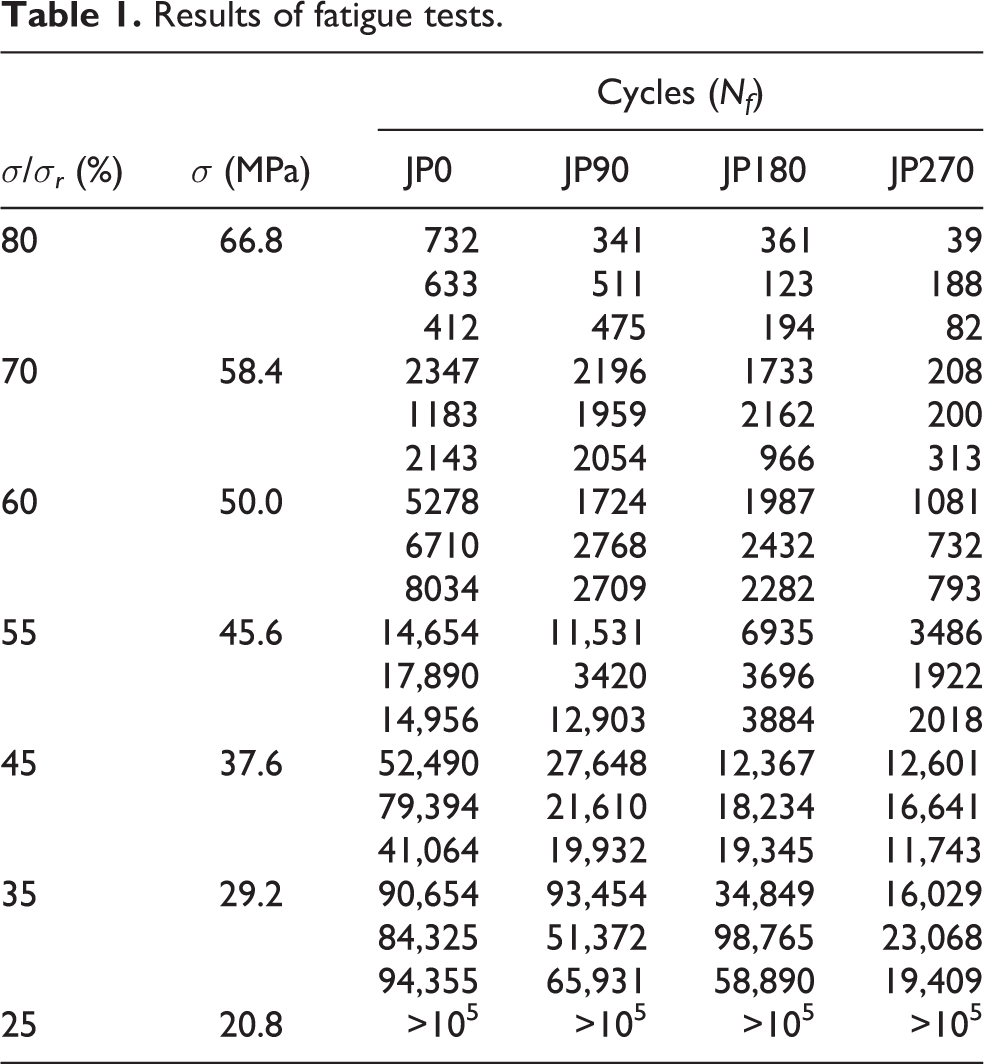
The fatigue characteristics of the jute/polyester composite materials after different periods of water aging are summarized in Table 1, which facilitates a quantitative analysis. It clearly shows that the cyclic fatigue failure number (Nf ) of the jute/polyester composite material decreases with an increase in the immersion time. Figure 5 represents the S–N curves of the jute/polyester composites used in this study (JP0, JP90, JP180, and JP270). The ordinate denotes the applied stress level, and the abscissa denotes the fatigue life (number of cycles to failure, ln(Nf ) for four periods of immersion of the composites. The experimental data results were curve fitted by the power function (equation (11)).
Results of fatigue tests.

S–N diagram of jute polyester composites with various immersion time in water.

Where A and B are constants with differing values depending on the material type. These two constants were calculated from the experimental data using least squares curve fitting. It is interesting to note that the water aging of jute/polyester composite material has a significant effect on the slope of the fitting curve of B. Indeed, for the aged composite material JP90, there is a slight increase in the value of B. By contrast, for JP180 and JP270, there are noticeable decreases on the slope of the fitting curve. The values of the constant A in Figure 5 indicate that at the same applied stress amplitude, the number of cycles required to fracture the aged specimens was decreased. Thus, fatigue strength decreases by an amount equal to 0.83%, 28%, and 47.9% in the aged specimens of JP90, JP180, and JP270, respectively. This occurs because the fatigue strength decreases with the decrease of static strength, and the static flexural strength decreases with an increase in the immersion time in water, as investigated by Sen et al. 1
The damage in aged and nonaged specimens tested under fatigue load depends on many variables, including fiber/matrix interface, void content, fabrication method, manufacturing procedures, and the reaction between water and the composite (both the fiber and the matrix). The mode of fracture and damage growth changed depending on the fatigue stress level. At higher fatigue load levels, yarn failure and delamination extension were the dominant damage modes; here, the matrix is damaged in that it fails before full use of its strength and the interface established between fibers and the matrix is weakened considerably. For lower stress levels, microcracks form at the fiber–matrix interface and the matrix of the composite material. Fiber failure and matrix still occurs. It does not lead fast enough to failure and composite damage; however, other mechanisms occur with loading time, such as interfacial shear and matrix cracking. They can then affect the composite’s overall state of damage.
The moisture absorbed plasticizes the polyester resin matrix and changes the state of stress by causing cracking through swelling. 38 The high cellulose content in jute fiber (approximately 64%) and the presence of the hydroxyl group further contribute to moisture absorption through the microcracks induced by the swelling of fibers, which leads to poor wettability and weak interfacial bonding between fibers and hydrophobic matrices. 39 The swelling of fibers can increase in the preexisting pores and voids within the fibers, creating swelling stresses that lead to composite failure 40 (Figure 6(a) and (b)).

SEM photographs of jute polyester composites: (a) void inside fiber of JP0; (b) large void of JP270; (c) damaged interface of JP270; (d) fiber length before fracture of JP0; (e) fiber completely damaged of JP270. SEM: scanning electron microscope.
In addition, with the presence of a high percentage of the group (–OH), the fibers tend to have low moisture resistance. This leads to dimensional variation of the material, the degradation of the fiber/matrix interface, and the alteration of the fiber itself (Figure 6(c)), which influences the mechanical properties of the material. Subsequently, the application of fatigue load causes gradual losses in lifetime in the material, 41 resulting in a reduction of stiffness in the cellulose structure. Therefore, the length of jute fibers and yarns before fracture in a nonaged composite is greater than those in the aged composite, which are completely damaged (Figure 6(d) and (e)).
Application of Weibull distribution
The cumulative probability distribution of the fatigue test data was fitted in the least-squares sense to compute the Weibull parameters. The distributions at Figure 7(a) to (d) show the two-parameter Weibull curve fittings obtained for fatigue resistance of the samples of JP0, JP90, JP180, and JP270, respectively, tested following different immersion times in water. These parameters were calculated using equation (4). However, all the samples tested for the 25% loading level corresponding to σ = 20.8 MPa are not broken; these data cannot be used in further analysis. The values of α and β are presented in Table 2, which indicate the lifetime and shape parameters, respectively.

Weibull lines for jute polyester composite material. (a) nonaged composite JP0; (b) aged composite JP90; (c) aged composite JP180; (d) aged composite JP270.
Weibull parameters in fatigue test for jute/polyester composite material.

CV: coefficient of variation.
It is evident from the data depicted in Figure 7 and reported in Table 2 that the value of the lifetime parameter α decreases as the time of immersion in water increases. Indeed, the decrease rate of nonaged specimens jute/polyester composite (JP0) in maximum stress amplitude values (σ = 66.8 MPa) is 27.21%, 60%, and 81.5% for aged specimen composites JP90, JP180, and JP270, respectively. In addition, the obtained values of β are greater than (1), which means that the damages were distributed throughout the stressed region by the fatigue load. This often reduces the stiffness of the composite material, although it does not always immediately reduce the strength. If there is a strength reduction, as might occur in the wear-out zone, small stress-induced, viscoelastic, or creep deformations follow in the matrix. 42
The [MTTF] and [SD] for fatigue life of the composite material comprising the nonaged and aged specimens are calculated using equations (7) and (9) to evaluate the relative data dispersion, as shown in Table 2. The effect of mean fatigue life on the [CV] is presented in Figure 8. According to these results, the fatigue life values are scattered the most for the aged specimen composite (JP270) owing to the greater defects in structure due to the presence of water within the jute/polyester composite. This phenomenon is particularly pronounced at a high stress level at the beginning of the test. Indeed, the smallest scatter was observed for the nonaged specimens composite (JP0) at a low stress level. This trend for the effect of water in the fatigue lifetime is extremely important for the application and design of composites materials. 43

Effect of mean fatigue life on the CV. CV: coefficient of variation.
Reliability probability or survival probability refers to the probability that a composite material used in an application continues to perform the function for which it was designed under a given set of operating conditions and for a specific period of time.
Figure 9(a) and (b) show the fatigue life distributions, that is, survival probability Ps(x), of JP0, JP90, JP180, and JP270, respectively, based on equation (4). These figures are of considerable value to designers because they allow fatigue life to be determined for any survival probability. For example, the fatigue life for a survival probability of 90% can be determined by drawing a horizontal line form the vertical axis to intersect with the distribution curve. For each loading level, the value at the point of intersection represents the lifetime with a 90% survival probability. Similarly, when the loading level is 80% (σ = 66.8 MPa), the intersection of the horizontal line for a 50% survival probability for nonaged specimens of composite JP0 gives a lifetime of 633 cycles. When a loading level of 35% (σ = 29.2 MPa) is used, this lifetime becomes 91,285 cycles.

Survival probability graphs for jute polyester composite material. (a) nonaged composite JP0; (b) aged composite JP90; (c) aged composite JP180; (d) aged composite JP270.
According to equation (4), when x = α, the survival probability becomes (equation (12)):

So, if Ps (x) = 0.368, this indicates the characteristic lifetime (in terms of the number of cycles) at which 63.2% of the population is expected to fail.
Equation (13) (which has been derived from equation (4)) can be used to plot S–N curves at different reliability levels for aged and nonaged specimens of jute-reinforced composite material. Such curves for Ps = 10%, 36.80%, 50%, 90%, and 99% are shown in Figure 10. These curves are of considerable value when designing practical applications, as they allow adjustments to be made depending on the degree of the reliability required. 44 If the sample contains a weaker or critical part, a higher confidence level should be used when calculating a safe lifetime

The S–N curves for different reliable levels for jute polyester composite material. (a) nonaged composite JP0; (b) aged composite JP90; (c) aged composite JP180; (d) aged composite JP270

These curves (Figure 10) are characterized by the number of three-point cycles that the bidirectional jute/polyester composite material can support without any catastrophic damage. They allow predictions of the fatigue lifetime that the designer requires and the reliability limit or safety limit. The results obtained from equation (13) have been fitted using a power function (equation (11)).
The constants, A and B, of this power function were determined using jute/polyester composites immersed in water for various lengths of time. It is clear that when higher levels of safety or reliability are required, the number of cycles at failure will be fewer. In addition to this, constant A decreases as the survival probability increases. A comparison of the values of A for various curves (Figure 10) when the survival probability is 50% shows that A decreases as the immersion time increases. A has its largest value (A = 271.8) for nonaged specimens of the composite material, JP0 (Figure 10(a)), and at the same survival probability, the smallest value of A (A = 128.1) is seen in composite specimens (JP270) that have been aged for 270 days.
Conclusion
Bidirectional jute/polyester composites were aged in water for 90, 180, and 270 days. Water absorption behavior was investigated, and an analysis of fatigue test was performed using the two-parameter Weibull probability for fabricated composites. Based on the results of the test and analysis, the following observations for fatigue design of the jute-reinforced polyester composite materials have been made: Study results indicate that the mode of fracture and damage in fatigue load depends on the type of loading, the load levels, and the time of immersion in water. Thus, the cyclic load of fatigue causes a degradation of the fiber–matrix bond. The damage is generally formed on the faces of the material, the areas experiencing the highest stresses. Thereafter, the crack propagates with the increase in the numbers of cycles and under the effect of stresses concentration, until the area resistant to stress decreases. Prolonged exposure of the jute/polyester composite material in water causes chemical aging which occurs simultaneously by hydrolysis, with chemical etching on the ester bonds of the polyester resin; moreover, water absorption causes a swelling of the fibers, forming a hydrogen bond between the water molecules and the jute fiber subsequently which leads to poor wettability and weak interfacial bonding and a decrease in the fatigue strength. Therefore, at the same applied stress amplitude in fatigue test, the number of cycles required to fracture the aged specimens was decreased, especially for the aged composite material, JP180 and JP270; there are noticeable decreases on the slope of the fitting curve. The construction of fatigue life distribution diagrams for the nonaged and the aged composites using the two-parameter Weibull cumulative function (probability of survival) is a simple way to determine the fatigue life at any survival percent. The widest scatter was observed for the aged composite material JP270 which is attributable to the presence of water in the material, particularly, under a high stress level. This tendency in the dispersal of fatigue life at varying stress levels and under varying conditions such as water aging is extremely important and deserves much attention in composites’ design and application. Safe design life for brittle composites material has great importance, in particular, for structural applications. S–N curves for several levels of reliability have been drawn and presented to designers such as R = 0.99, R = 0.50, R = 0.368, and R = 0.10. These diagrams can be considered as reliability or safety limits in the identification of the first failure time of a component under any stress amplitude. Especially, the usage of S–N curves (R = 0.99) should be advised in the design of aircraft, which have to have higher safety and reliability.
Footnotes
Acknowledgments
The authors thank Professor Bachir Redjel from University of Annaba, Algeria, for his encouragement in writing the manuscript. The authors also thank Mr A MIR MC, from University of Boumerdes, for the production and dispatch of composite materials.
Declaration of conflicting interests
The author(s) declared no potential conflicts of interest with respect to the research, authorship, and/or publication of this article.
Funding
The author(s) received no financial support for the research, authorship, and/or publication of this article.