
Abstract
In this paper, fracture toughness of banana fiber reinforced thermoplastic starch (BF_TPS) material was studied. Fiber weight percent (30, 40, and 50 wt.%) to starch polymer was fabricated using hot press at a pressure of 5 MPa of 160°C for 30 min. Experimental result shows that 40 wt.% BF_TPS biocomposite gave optimum tensile strength. Furthermore, nanoclay with varying weight percentage (1–5 wt.%) of dry cornstarch (CS) powder was added to enhance the property of the optimum 40 wt.% BF_TPS biocomposite, hence, forming hybrid clay/BF_TPS biocomposite. Tensile, impact, and fracture mechanics (Mode I fracture test) through Single End Notched Bending (SENB) Test were studied concurrently. Thermal properties and degradations were equally studied through Dynamic Mechanical Analysis (DMA) and Thermogravimetric Analysis (TGA). Results show that tensile strength and impact resistance increased to the maximum of 65% and 15.6%, respectively, at 3 wt.% clay addition. Critical stress intensity factor (K IC ) was approximately higher by 276% when compared to neat BF_TPS material. Strain energy release rates (G IC ) values were minimal. Delamination and catastrophic failures occurred with less fiber crack propagation along the crack initiation notches. In TGA, less weight reduction was observed at 3 wt.% clay/BF_TPS material, while a positive shift occurred in DMA tan delta (Tan δ) T g by 30°C. The micrography of the clay-enhanced biocomposites resulted in better bonding interaction between the polymer and fiber.
Keywords
Introduction
Background
Natural fibers offer good potential as alternatives to glass and other man-made fiber used as reinforcement in both thermosetting and thermoplastic polymer. The opportunity to produce inexpensive and lightweight biocomposite materials from these renewable and potentially sustainable resources is not far-fetched, due to their good stiffness and strength. These materials have inherent potential for use in many engineering applications. 1 Thus, natural fiber reinforced composites (NFRCs) are promising and sustainable green materials for industries especially automotive, interior applications, construction, and fundamental research.2–4 Due to the global warming emergency caused by the uncontrolled production of greenhouse gases, industries are working to minimize their reliance on petrochemicals and petroleum-based industrial components and replace them with biobased, sustainable, and environmentally friendly alternatives. 5 However, the major issues with natural fibers are variation in properties and their susceptibility to moisture absorption because of their hydrophilic nature, which reduces the interfacial adhesion between fiber and matrix that affects the mechanical properties.6,7 To tackle these problems, hybridization of natural fibers with mineral or synthetic fibers has been used to have superior moisture resistance and thermal stability properties.8,9
More recently, attention has focused on natural fibers hybridized with synthetic fibers, such as glass fibers 10 and mineral fibers, such as basalt fibers.11,12 The latter has lower amount of energy consumption compared to glass fibers. 13 There are three possible ways to hybrid natural fibers into composites based on the type of materials, for example: natural–synthetic, natural–mineral, and natural–natural fibers. The hybridization of composite materials provides a better properties than single fiber reinforced composites such as strength, stiffness, and ductility. 14 Of recent, Sahayaraj et al. 15 examine dispersion of tamarind (Tamarindus indica L.) seed nano-powder, incorporated in jute-hemp fibers reinforced epoxy composites, while focusing on the effect of hybridization on their properties. It was discovered that composites containing 40 wt.% JF and 10 wt.% HF showcased reduced amount of void content because of the appreciable compatibility existed between matrix and the fibers. Effect of hybridization can also influence mechanical, wear, and hydrophobic behavior, including the surface-treated. 16 In another research, the aging behavior and properties of pineapple and sisal leaf hybrid fiber reinforced polymer composites were investigated experimentally by Deeban et al. 17 The experiments reveal that the hybridization of sisal and pineapple leaf fiber (PALF) has a significant influence on the properties of the composites. Nevertheless, various physical structure and chemical characteristics including moisture content, cross-section, fiber structure, cellulose content, and fibrillar angle of the plant-based fibers govern the mechanical and physical properties of plant-based natural fibers.18,19 However, volume fraction of the natural fiber reinforcements played a significant part in determining the physical as well as mechanical properties of the NFRCs. 20 One of the factors for this is having enough test data on how these composites behave under different fracture toughness modes. Although, the extension of structural application uses of natural fiber has been very slow because of delamination and cracks, as well as the need for high quality products. Detailed knowledge of crack resistance by improving fiber toughness is highly necessary. Natural fiber composites as far as their mechanical (tensile, flexural, and impact), thermal, and environmental behaviors are a concern and have been well investigated.21–24 However, there are very limited reported works investigating the fracture toughness behavior of natural fiber reinforced composite materials.
Structural composites are essential to sustain external loads for long period of time. Thus, sufficient ability to absorb fracture energy is an important requirement for structure design, which is dependent on the fiber and matrix properties. Because of this, the use of natural fibers, in the form of non-woven mats or short fibers mat, is limited in non-structural applications. 25 It is well established that composite materials undergo different failure modes when different loading conditions are applied. These include delamination, matrix cracking and fiber breakage. However, in the case of natural fiber composites, there are further limitations in their application of structural or semi-structural applications as their delamination cracking and fracture toughness behavior are not well investigated and understood.
Hughes et al. 26 investigated the fracture toughness of jute and hemp laminates reinforced polyester composites. It was found that hemp/polyester composite demonstrated better critical stress intensity factor and energy release rate. At 20% of fiber volume fraction, 313% and 870% improvement in fracture toughness and critical strain energy release rate were achieved for jute/polyester composite, respectively, whereas for hemp/polyester composite, the improvement was 466% and 1740%. Aimi and Anuar 27 studied the effect of plasticizer on fracture toughness of mono-composites and hybrid biocomposites. The result showed that the fracture toughness of plasticized PLA/KF/MMT yield 24.2% higher than non-plasticized hybrid composite. Observation under scanning electron microscope (SEM) revealed that the fiber bridging, fiber pullout, and fiber breakage contributed to high fracture toughness of plasticized hybrid biocomposites. Natural fiber reinforced thermoplastic starch biocomposites was processing Torres et al. 28 form the mechanical properties reported, tensile strength appears was improved with the addition of 10 wt.% of sisal fibers. An improvement of almost 100% in tensile strength of potato starch occurs with a reinforcement of 10% w/w of sisal fibers, while for jute and cabuya fibers at 12.5% w/w, improvements in tensile strength of 54 and 15%, respectively, were reported.
Faruk et al. 29 reported on natural fiber reinforced composites progress; they concluded that the success of natural fiber reinforced polymeric composites will be dependent upon on appropriate processing techniques, the modification of fibers to improve the adhesion between fiber and the biopolymer, the matrix modification and after treatment to improve performance as well as long-term durability and fire retardancy. However, understanding the fracture toughness and crack resistance behavior is important and these are still at an early stage requiring more research for NFRCs to be used in load-bearing applications.
The study, however, explores utilizing starch-based polymer biocomposite prepared through evaporation casting method, 30 The starch is reinforced with hybrid nanoclay/chopped strands banana fiber to fabricate biocomposite material. Banana fiber is selected due to its relatively excellent physical and mechanical properties in terms of density, strength, stiffness, and strain at break. 31 Banana fiber with 40 wt.% fiber fraction was hybridized with nanoclay weight ratio (1–5 wt.%) of dry cornstarch (CS) powder to study the fracture toughness of the starch-based biocomposite material. Impact fracture toughness was assessed using Hounsfield Impact Tester to study the impact resistant. Single-Edge Notched Bending (SENB) Mode I fracture resistance was conducted to study the crack propagation rate, while the critical stress intensity factor (Kic) and the critical strain energy release rate (Gic) relating to the crack propagation rate through the Mode I fracture test were established. Thermal degradation of the hybrid biocomposite material was equally verified. It was observed that the interfacial adhesion of the clay/BF_TPS biocomposite was improved with very small amount of nanoclay.
Fracture mechanics
The separation of material into two a variety of pieces when subjected to stress can be defined as fracture, while the tendency of a material to withstand the crack propagation is known as toughness. This can be classified as brittle or ductile fractures. For example, rapid and unstable crack extension which absorbs low energy and has little plastic deformation like ceramics and glass fibers are as a brittle fracture. However, ductile fracture behavior results in slow and stable crack extension which absorbs high energy and has large plastic deformation such as steel and aluminum. 32
Fracture toughness is related to the amount of energy required to create fracture surfaces that describes the ability of the material to resist the crack when applied to stress action.33,34 There are basically three type of fracture modes; this includes Mode I—opening mode, Mode II—the sliding shear mode, and Mode III—the tearing mode. Crack initiation and propagation occur in composite because of theses fracture modes. The prediction of crack initiation and propagation requires the determination of material fracture toughness. The expressions for these are in terms of critical intensity factor, K IC , K IIC , and K IIIC .
In the study, Mode I fracture toughness was carried out. There are two important factors considered. The critical stress intensity factor (Kic) and the critical strain energy release rate (Gic). The former is a local parameter or a function of stress, strain, and displacement near the crack tip, and the latter describes a measure of energy necessary for crack initiation. 35
Experimental study
Materials
The raw materials used in this experiment for the fabrication of biocomposite are banana fiber, corn starch, glycerol, and Cloisite 25A nanoclay. Dried banana fiber extracted from banana pseudo-stem was purchased from REDDCOLT Enterprises in India. Cornstarch and nonhazardous Glycerol AR with chemical formula CH2OHCHOHCH2OH were purchased from RADCHEM Laboratory supplies (PTY) LTD, Johannesburg, South Africa. Cloisite® 25 nanoclay was natural montmorillonite (MMT) clay supplied by Southern Clay Products, Inc., USA. Cloisite® 25A nanoclay is an off-white additive particle for plastic and rubber, normally used to improve various physical properties, such as reinforcement, synergistic flame retardant, and barrier properties.
Biocomposite preparation
Banana fibers were cut into chopped strands of critical length 40 mm length. The chopped fibers were chemically treated using sodium hydroxide (NaOH) solution. 25 g of NaOH were dissolved in 500 mL of distilled water (5% NaOH to distilled water), and the chopped Banana fibers were soaked in the mixture for 30 min. This is to remove impurities from the fiber surface and make the fiber surface smooth and to achieve better bond of fiber-resin interface, improved fiber bonding, and improved wetting characteristics. The chopped fibers were rinsed thoroughly in water and sun dried. Cornstarch with distilled water was plasticized by 30 wt.% glycerol to cornstarch powder on the stove to form bioplastic polymer matrix solution. Cornstarch powder (5 g) was dissolved in 80 mL distilled water. The solution was maintained at 80°C and stirred at 500 r/min using a temperature-controlled magnetic stirrer for about 10 min. Following this, glycerol (1.5 g) was added to the solution. Thereafter, nanoclay of varying weight (1–5 wt.%) to cornstarch powder was individually added into the heating mixture. The whole mixture was stirred until the white viscous solution became colorless, and on achieving biopolymer, the mixing was stopped. More details about the plasticization technique can be found elsewhere. 36 The resulting cornstarch biopolymer was further thoroughly hand mixed manually with the chopped banana fiber in a baker and spread in a lid-driven square cavity. Banana fiber reinforced thermoplastic starch (BF_TPS) biocomposite with fiber fraction (30%, 40%, and 50%) to starch polymer was fabricated using hot press at a pressure of 5 MPa and temperature of 160°C for 30 min. Having achieved a progressively improved mechanical property, reaching a maximum of 40 wt.% fiber fraction, BT_TPS biocomposite with 40 wt.% fiber reinforcement was further hybridized with Cloisite® 25 nanoclay at a percentage ratio of (1–5 wt.%) of the dried corn starch. Specimens were cut from the 300 × 320 mm biocomposite sheet for various testing and characterization.
Thermal degradation
Thermal degradation of biocomposite materialand its volatile component was performed on a TA Instruments Thermal Universal Analyzer V4.5A. A heating run of 100 C/min was conducted under a dry nitrogen gas flow at rate of 100 mL/min from 20°C to 600°C. The thermal degradation was studied by Thermogravimetric Analysis (TGA). The weight loss to the temperature was examined. Likewise, dynamic mechanical analysis (DMA) was performed using a TA Instruments (Model Q800 V20.6, New Castle, USA). The DMA tests were performed in tensile mode on specimen geometry size (60 mm × 10 mm × ∼5 mm) by the length, width, and thickness at a strain amplitude of 1.0%. The testing parameters range from 20 to 250°C and a frequency of 1 Hz. The viscoelastic parameters such as E′ (storage modulus), E″ (loss modulus), and tan δ = E″⁄ E′ (damping ratio) were plotted against the temperature (°C) as determined.
Quasistatic tensile test
Tensile test specimens were prepared according to ASTM D3039-76 testing standard. 37 The specimens have a standard rectangular configuration with the dimensions of 250 mm × 25 mm × ∼5 mm (length × width × thickness). The tensile tests were performed using MTS Criterion C43.304 computer-controlled electro-mechanical machine with an increasing force up to the maximum of 30 kN load-cell. The tensile load was applied to the specimen with the displacement control mode at a constant rate of 5 mm/min until the fracture of specimens. During the test, the load versus displacement curves were recorded. Tensile tests were conducted on five samples each for the neat BF_TPS and clay/BF_TPS biocomposite materials. The mean values were recorded for final strength.
Impact fracture test
To identify the fracture resistance of the BF_TPS biocomposite, Charpy V-notch impact tests were conducted using a Hounsfield Balanced Impact Tester (Tensiometer Ltd., Croydon, England). The Hounsfield Impact Machine is loaded in a three-point impact manner. This test was performed according to ASTM D 6110 – 10 testing standard. 38 Test specimens’ geometry was 50 mm × 12 mm × ∼5×mm by the length, width, and thickness. All impact specimens were notched 2 mm deep in the middle part opposite the impact area, leaving the impact width to be 10 mm. Five specimens were tested for the BF_TPS biocomposite materials at an impact velocity of the of 6.7 m/s. Energy absorbed in Joules (J) were calculated and further converted to kJ.
The impact resistant was calculated using the following expressions

Fracture toughness test
Single edge notched bending (SENB) specimen was prepared and tested through Mode I fracture toughness,
The stress intensity factor
40
was calculated using the following expressions

Hence, the correction factor

Furthermore, Mode I Fracture toughness,

Characterization
Fracture surface of the biocomposite specimen samples was observed Axiocam 208 color optical scanning microscopy machine to study the fracture resistant of the BF_TPS biocomposite. The microscope is a Modern Industrial Square 3-B Axiolab 5, manufactured by Carl Zeiss Suzhou Co., Ltd. China. Microscopic investigation was done to ascertain the interaction of the starch polymer-based biocomposite and the nanoclay reinforcement effect relating to the fracture toughness strength. The optical scanning test was performed at a total magnification of 5x.
Results and discussions
Tensile properties
Tensile test was conducted on BF_TPS biocomposite with fiber fractions (30 wt.%, 40 wt.%, and 50 wt.%) to starch polymer to study biocomposite with the maximum mechanical properties. Experimental results show that BF_TPS biocomposite with fiber fraction 40 wt.% gave the best mechanical properties when compare with 30 wt.% and 50 wt.% BF_TPS biocomposite as shown in Figure 1a. Biocomposite with 40 wt.% fiber fraction was further hybridized with nanoclay weight ratio (1–5 wt.%) of dry cornstarch powder to study the fracture toughness of the BF_TPS biocomposite material. The tensile strength to nanoclay % weight ratio and the stress versus strain graph of neat and clay-filled BF_TPS are shown in Figure 1(b) and 1(c), respectively, while their moduli were taken from the slope and displayed in Figure 1(d). Magnified view of the stress–strain curve is included in Figure 1(c) to understand the difference in the slopes and to justify the moduli values of all sample variations. The tensile strength gradually increases with an increasing amount of nanoclay up to 3 wt.% clay loading and eventually dropped at more clay loading. It can be found that as the load drop occurs, the curves are non-linear at the lower curve slope. This is due to fiber breakage along the material elongation leading to final failure. Tensile properties showing (a) strength of 30, 40, and 50 wt.% BF_TPS, (b) strength of neat and clay/BF_TPS at 40 wt.% fiber, (c) stress versus strain curve of neat and clay/BF_TPS at 40 wt.% fiber, and (d) modulus of neat and clay/BF_TPS at 40 wt.% fiber.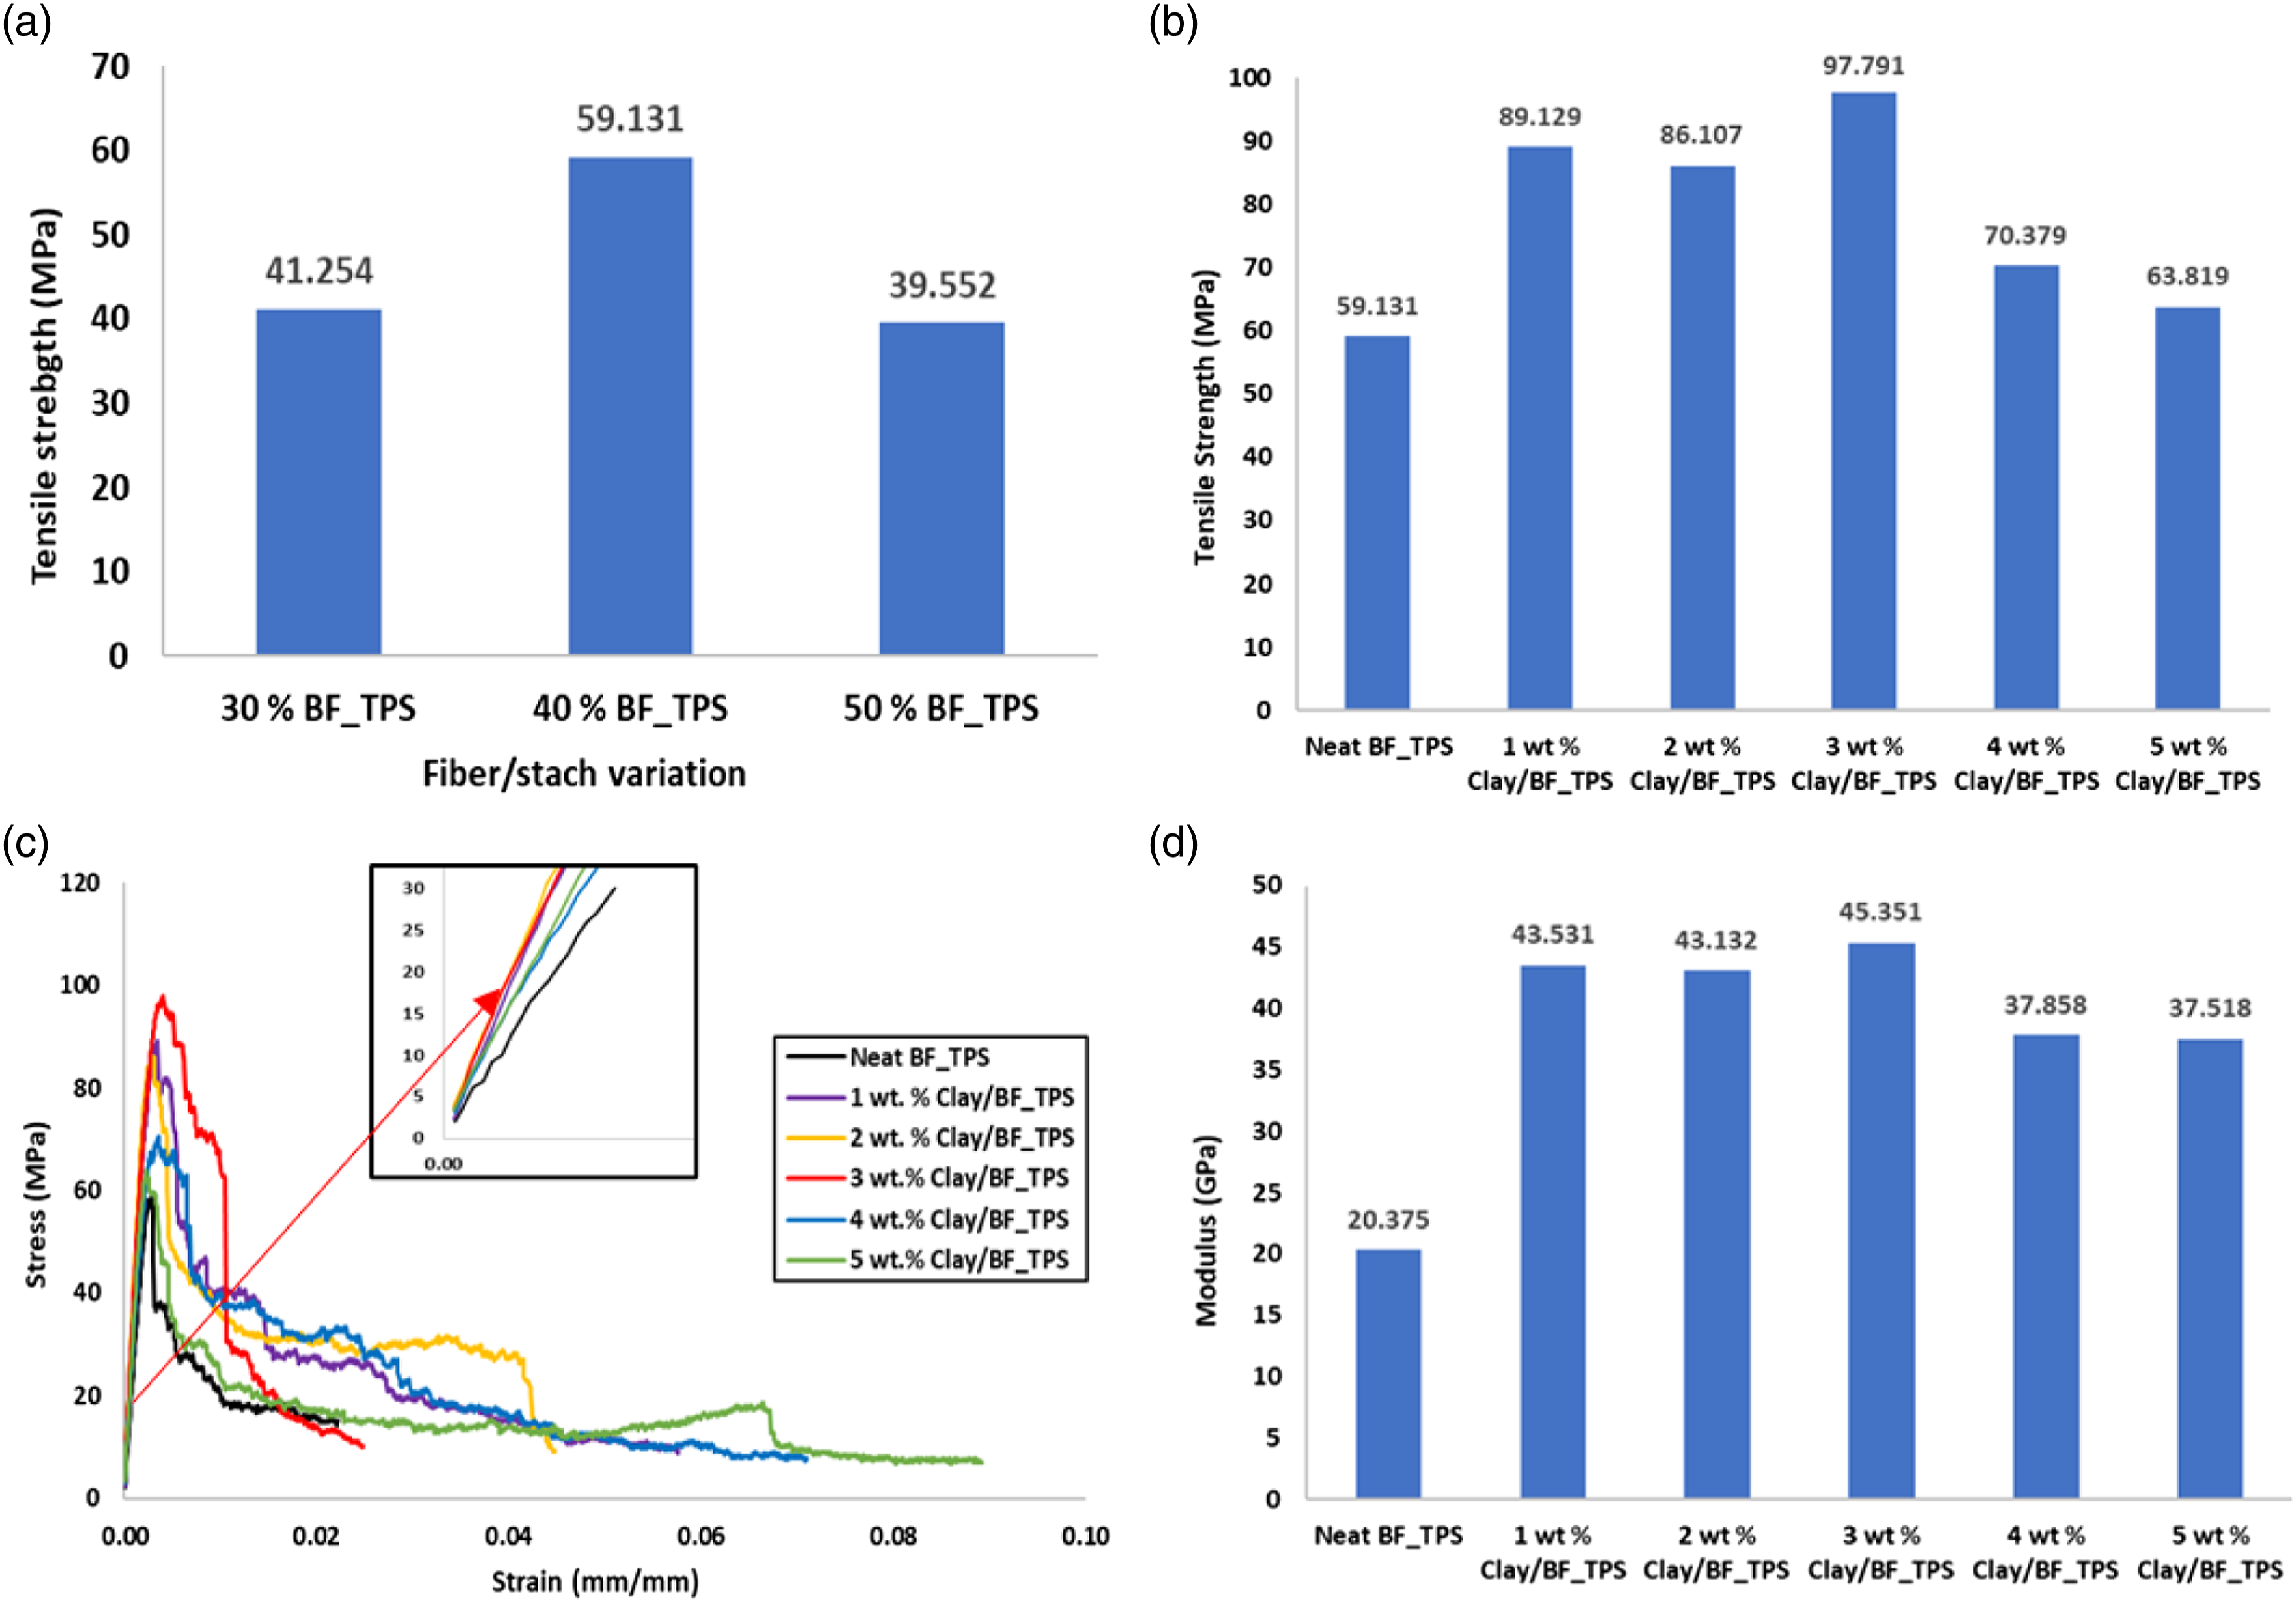
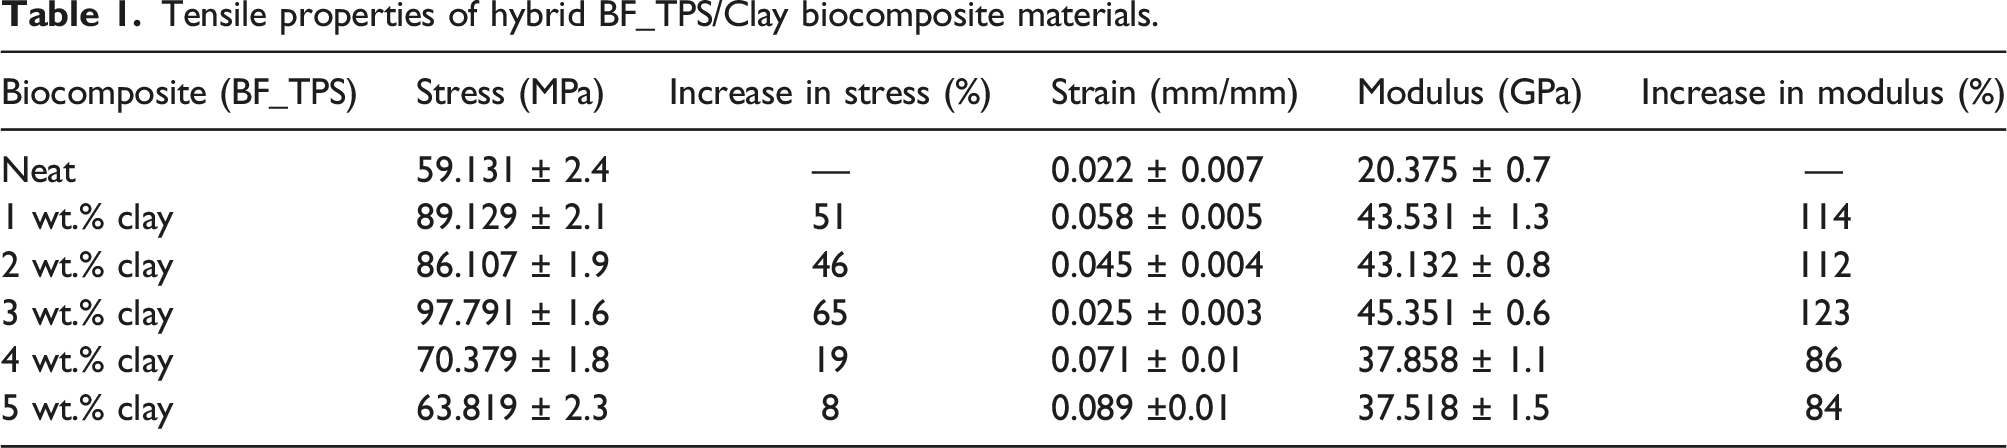
Tensile properties of hybrid BF_TPS/Clay biocomposite materials.
Impact resistance properties
Impact resistance properties of hybrid BF_TPS/Clay biocomposite materials.
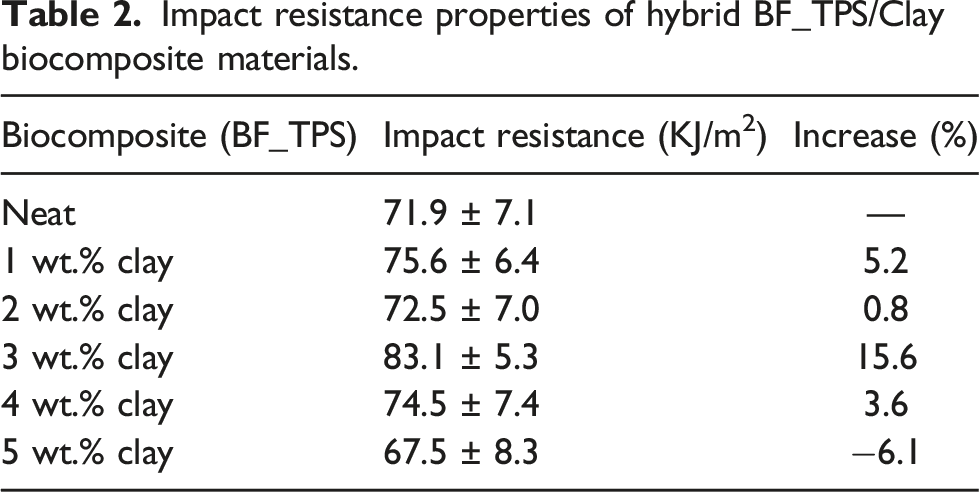
The reduction at 5 wt.% clay loading in turn reduced the energy-absorbing efficiency in the hybrid clay/BF_TPS biocomposite. It is worth mentioning that the high impact resistance values of the 3 wt.% clay/BF_TPS over the corresponding neat BF_TPS depict great improvement of the biocomposite material.
Fracture toughness properties
Single-Edge Notched Bending (SENB) test were performed on neat BF_TPS and clay-filled BF_TPS biocomposite structures. All tests were conducted under Mode 1 test condition and the critical stress intensity factor (Kic), strain energy release rate (Gic), and other various related properties for each biocomposite materials were determined. Various fracture mechanics were observed during the SENB fracture testing, such as delamination, buckling, and out-of-plane fracture as shown in Figure 3. However, the effect of clay/fiber hybridization was typically observed to have influence on the fracture toughness of the biocomposite materials.
The addition of nanoclay in the biocomposite continuously increased the failure load, Kic and Gic values, respectively. It can be observed that cracks are initiated along the biocomposite materials. However, sample with 5 wt.% clay/BF_TPS showed irregular and sideward fracture behavior. It is well understandable that such fracture is likely to be expected since the material is biocomposite structures and the evidence of this is as shown in “d” part of Figure 2. Irregular fracture failure was observed with failure loading as well as fracture, especially in materials majorly comprises of chopped strand fibers. Also, agglomeration of clay in the 5 wt.% clay/BF_TPS could have also led to this behavior. This may have resulted in less superior load when compared with other clay-filled BF_TPS biocomposite. The debonding of the biocomposite resulting in delamination is another observation found in 5 wt.%. This shows that there is existence of structural change in the biocomposite at higher clay loading. Fracture toughness behavior of (a) neat BF_TPS, (b) 1 wt.% clay/BF_TPS, (c) 3 wt.% clay/BF_TPS, and (d) 5 wt.% clay/BF_TPS biocomposite materials.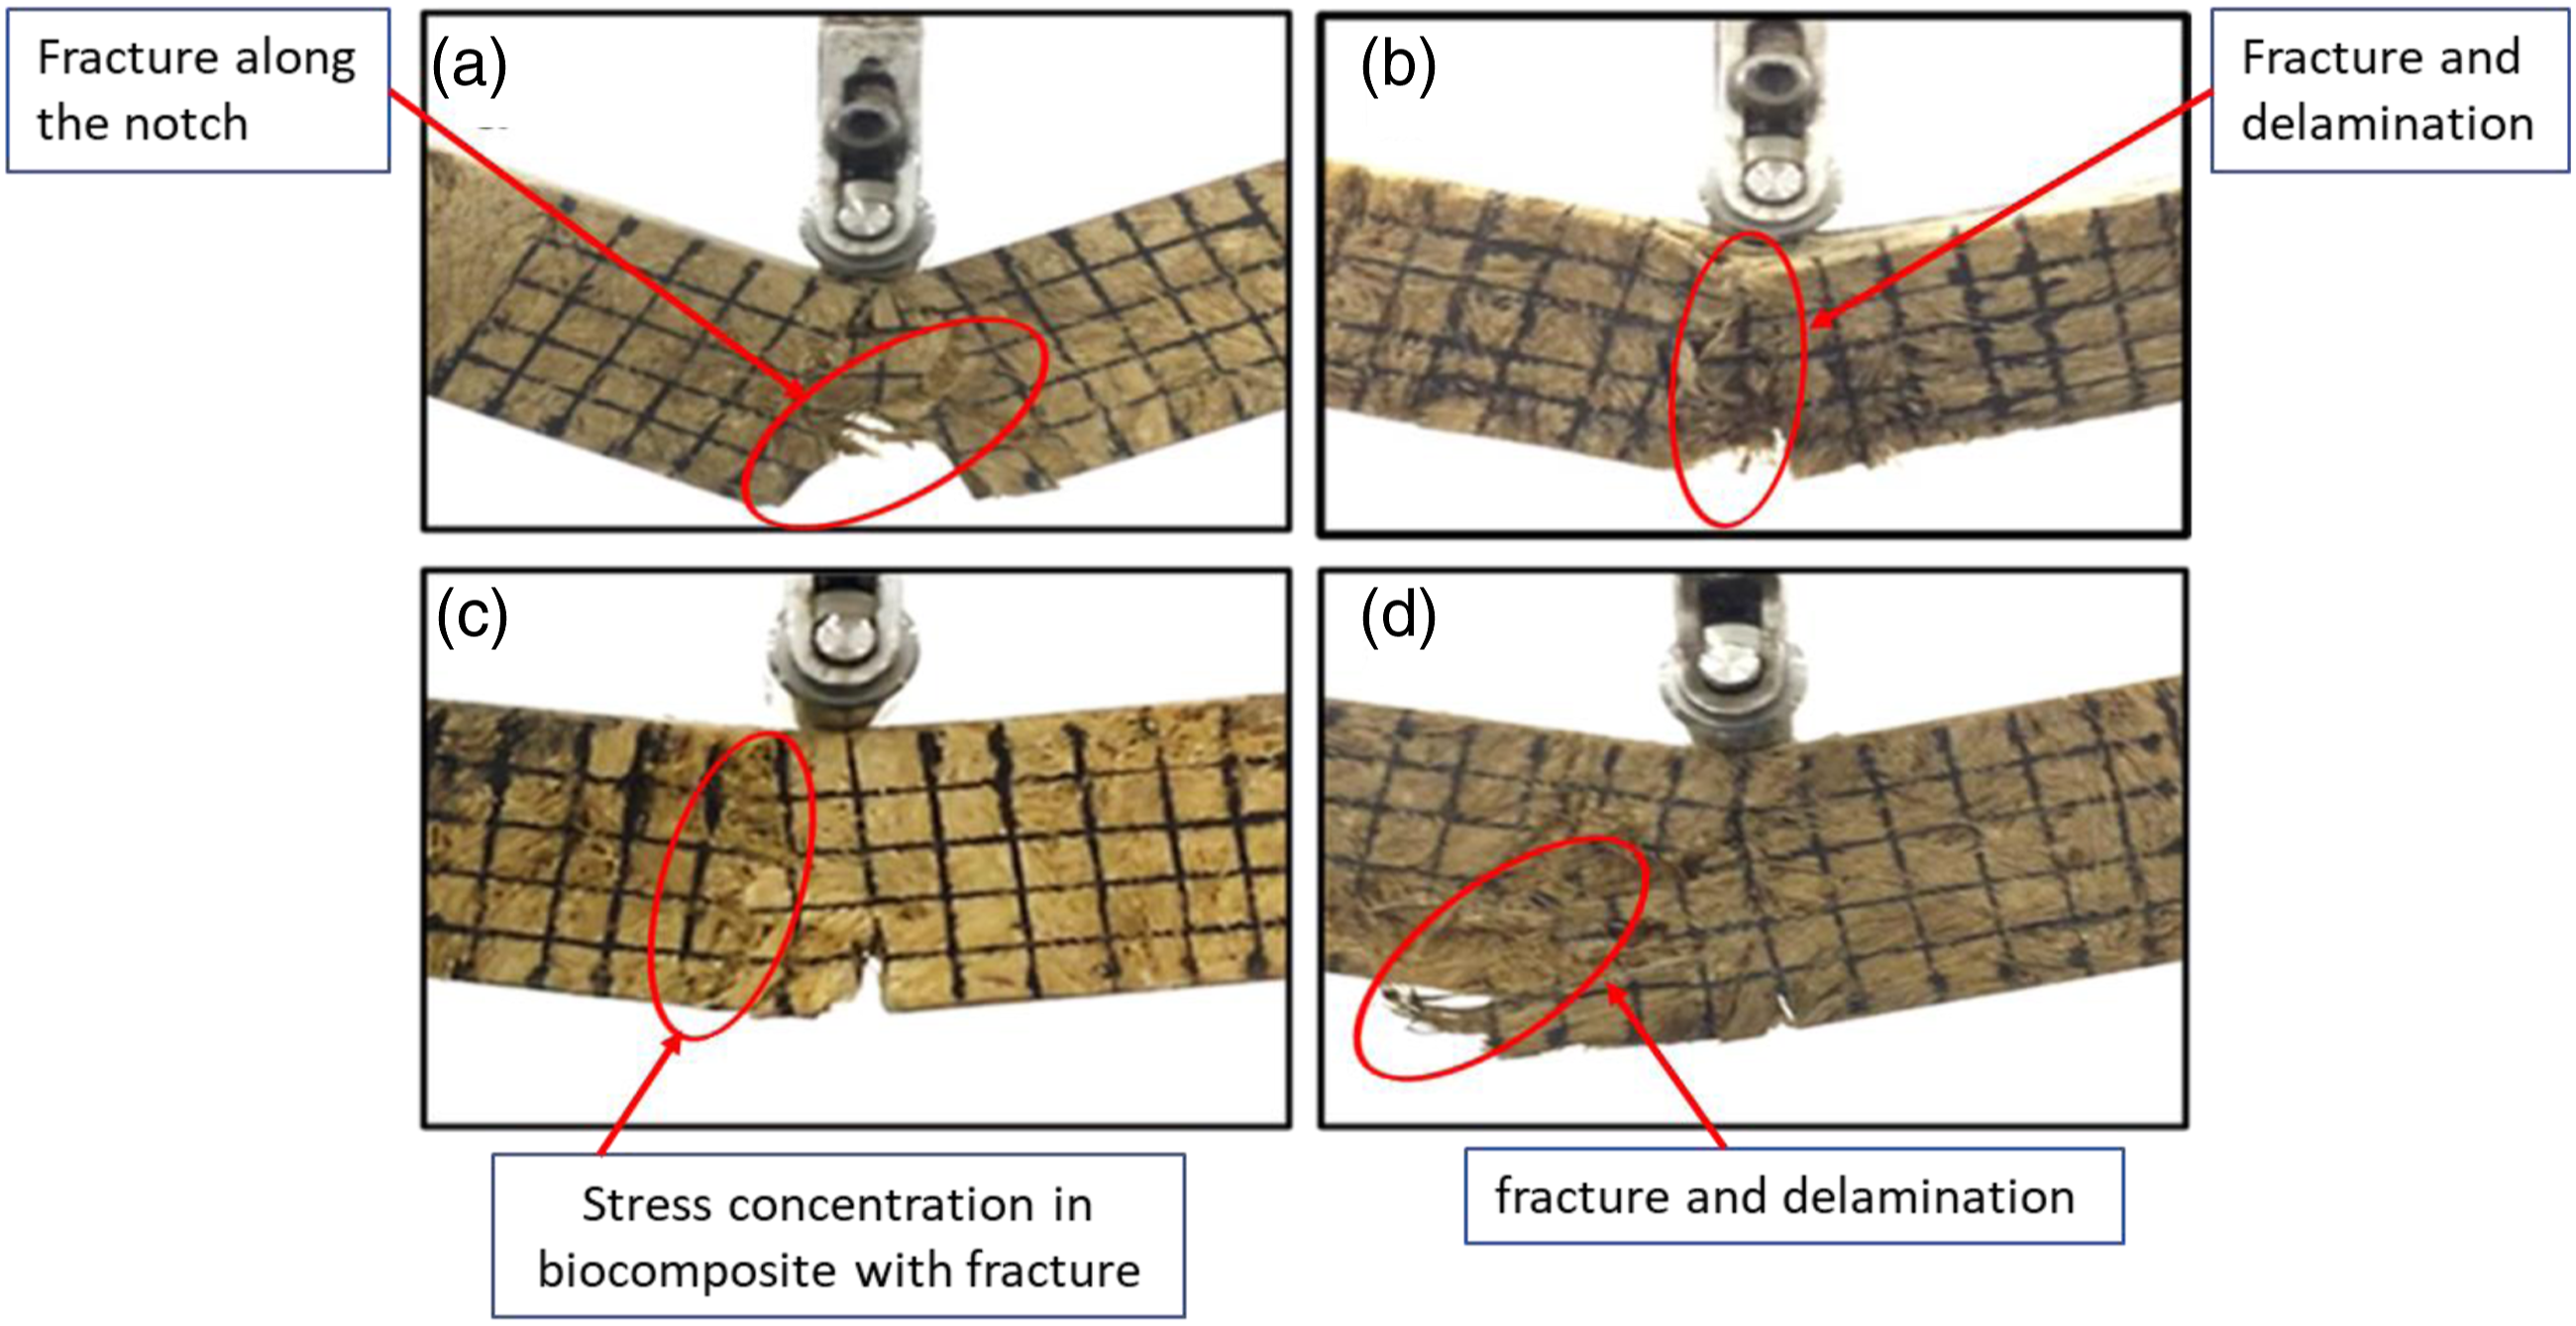
Various fracture mechanisms were observed in the hybrid clay/BF_TPS Biocomposite highlighted in the schematic illustrations of the damage mechanisms shown in Figure 3. The neat BF_TPS and 1 wt.% clay/BF_TPS biocomposite were seen to undergo a proper fracture along the notch. However, there was an indication of fiber pullout. This shows that the lower percentage of nanoclay at 1 wt.% clay BF_TPS biocomposite was less effective to cause a proper bridging of the polymer to the fiber. Likewise in 5 wt.% BF_TPS biocomposite with higher clay loading, there is a possibility of improper interaction of clay with the starch polymer which might have led to fracture and delamination of the biocomposite. Hence, in 3 wt.% clay BF_TPS biocomposite, the case was different. Crack arrest at the notch was observed, which prevents crack propagation in the biocomposite. This shows a moderate and better reinforcement of nanoclay in the biocomposite. Although it was observed that there were stress concentrations at the loading edge of the biocomposite due to the nature of the semi-soft materials. Nevertheless, the materials were able to withstand the SENB fracture toughness test. Schematic illustration of the fracture mechanics observed in (a) neat BF_TPS, (b) 1 wt.% clay/BF_TPS, (c) 3 wt.% clay/BF_TPS, and (d) 5 wt.% clay/BF_TPS biocomposite materials.
Although, both tension and compression part revealed that fibers are the key factors for bearing extra load and impeding crack propagation. Hence, crack paths were found to be minimal in 3 wt.% clay BF_TPS biocomposite and the interface between fiber and polymer in the SEMB test was observed to be typical fracture characteristics in tension due to stress concentration at the loading point. Moreover, fiber bundle bridging, micro-matrix cracking, interface debonding, and splitting of cell wall layers were found to be important fracture characteristics in bending of the low and high clay percentage in the biocomposite material. It can therefore be concluded that strong interface in the fracture toughness of the biocomposite material both in tension and compression was exhibited within 3 wt.% clay BF_TPS biocomposite.
The load versus displacement curve of the BF_TPS biocomposite shown in Figure 4(a) displayed a variation in strength and elongation to break. It can be deduced from the image that all clay-filled biocomposite possesses higher strength in terms of failure load when compared to neat BF_TPS. However, biocomposite enhanced with 3 wt.% nanoclay was observed to show the highest strength resulting to 110 N, which is 120% more that neat BF_TPS. (a) Image showing load versus displacement curve of hybrid clay/BF_TPS biocomposite. (b) Image showing stress intensity factor versus load of hybrid clay/BF_TPS biocomposite. (c) Image showing strain energy release rate versus time of hybrid clay/BF_TPS biocomposite. (d) Image showing crack length versus time of hybrid clay/BF_TPS biocomposite.
The stress intensity factor describes the stress state at a crack tip. This is related to the rate of crack growth and is used to establish failure criteria due to fracture. Consequently, under the fixed applied stress, the magnitude of Kic increases as the crack depth increases because the stress state near the tip of a crack is caused by a remote load or residual stresses. It can be observed from Figure 4(b) that the Kic of 2 wt.% BF_TPS biocomposite gave 0.079 MPa√m and occurs to be the closer Kic to that is 3 wt.% BF_TPS biocomposite with a value of 0.053 MPa√m. All clay/BF_TPS biocomposite Kic were basically higher than that of neat BF_TPS which is observed to be at a value of 0.021 MPa√m.
Fracture toughness properties of BF_TPS biocomposite.

According to the crack length, normalized crack propagation was observed in 3 wt.% clay/BF_TPS biocomposite as seen in Figure 4(d). The crack length was taking during the SENB test. A camera was positioned to record the testing process. Each sample was cross ruled out with ink on the surface creating rows and columns of 5 mm distance to each other. The layout of the cross rule was 25 mm away from the notch area (left, right, and above) to allow easy crack propagation reading (distance per time). The effect of clay addition in the biocomposite delayed the propagation with time by revealing a lower crack length value of 0.008 m (8 mm). However, 2 wt.% BF_TPS gave highest crack length value of 0.018 m (18 mm), but the propagation of crack was relatively shorter with the time. Apparently, there was an increase in time for crack propagation as nanoclay content was increased to 3 wt.% and further to 4 wt.%, which later drops at 5 wt.% clay/BF_TPS biocomposite.
The values of the failure load, critical stress intensity factor, Kic and the strain energy release rate, Gic, of the hybrid clay/BF_TPS biocomposite were all recorded in Table 3. It can be observed that 3 wt.% clay/BF_TPS biocomposite has higher failure load as well as higher Kic, while higher Gic was observed in 2 wt.% clay/BF_TPS biocomposite.
Microscopy of fracture surface
The fractured biocomposite specimens were examined using scanning electron microscopy (SEM). The images of the SEM images are as shown in Figure 7. Various fracture behaviors were observed, such as fiber breakage, fiber pullout, instantaneously deformation, delamination, and quasistatic deformation under flexural loading. The fracture of the neat BF_TPS which is “a” part of Figure 5 shows a relative fiber separation along the notch area leading to fracture. However, the incorporation of nanoclay resulted in better bonding of the fiber polymer matric of the starch and banana fiber because of hybridization technics. Homogeneous distribution of nanoclay in the starch polymer causes a firm and proper bonding of the biocomposite as shown in “a,” “b,” and “c” part of Figure 5, leading to consistency in fracture damage of the biocomposite. Nevertheless, limited crack structures were observed when compared to the neat BF_TPS biocomposite structure. At the increase of the nanoclay to 5 wt.%, agglomeration of nanoclay set in within the starch polymer leading to catastrophic failure. SEM images of fracture samples observed in (a) neat BF_TPS, (b) 1 wt.% clay/BF_TPS, (c) 2 wt.% clay/BF_TPS (d) 3 wt.% clay/BF_TPS, (e) 4 wt.% clay/BF_TPS, and (f) 5 wt.% clay/BF_TPS biocomposite materials.
Thermo-gravimetric analysis
The weight range of the biocomposite was studied by the thermo-gravimetric analysis (TGA) technique. Figure 6(a) shows weight loss as a form of temperature increase. Thermal decomposition of each sample takes place in a programmed temperature range from 20°C to 600°C. It was observed that the decomposition temperatures start changing around 370°C. This indicated nanoclay influenced the decomposition temperature of BF_TPS. Three stages of weight losses were observed. The first weight loss up to 100°C corresponds to the heat of vaporization of moisture in the samples. The second weight loss at about 270°C corresponds to thermal depolymerization. While the third weight loss at around 370°C corresponds to further breakage of the decomposition polymerics starch in the biocomposite. Thermal degradation parameter of BF_TPS biocomposite is recorded in Table 4. It was found that the thermal decomposition of the materials was independent of temperature. The temperature at which the mass was volatilized provides a good idea of the stability thermally. The TGA curves demonstrate that the incorporation of clay in starch polymer gives significant improvement to the thermal stability of the material. At temperatures higher than 370°C by the cross-over between degradation curves, a higher Tg value was observed in the 3 wt.% biocomposite regarding the thermal stability. Volatile degradation products are adsorbed on the surface of the biocomposite, resulting in steady thermal stability of the biocomposite material.
42
(a) Thermogravimetric (TGA) degradation curve of hybrid clay/BF_TPS biocomposite. (b) Thermogravimetric (DTG) curve of hybrid clay/BF_TPS biocomposite. Thermal degradation parameter of BF_TPS biocomposite.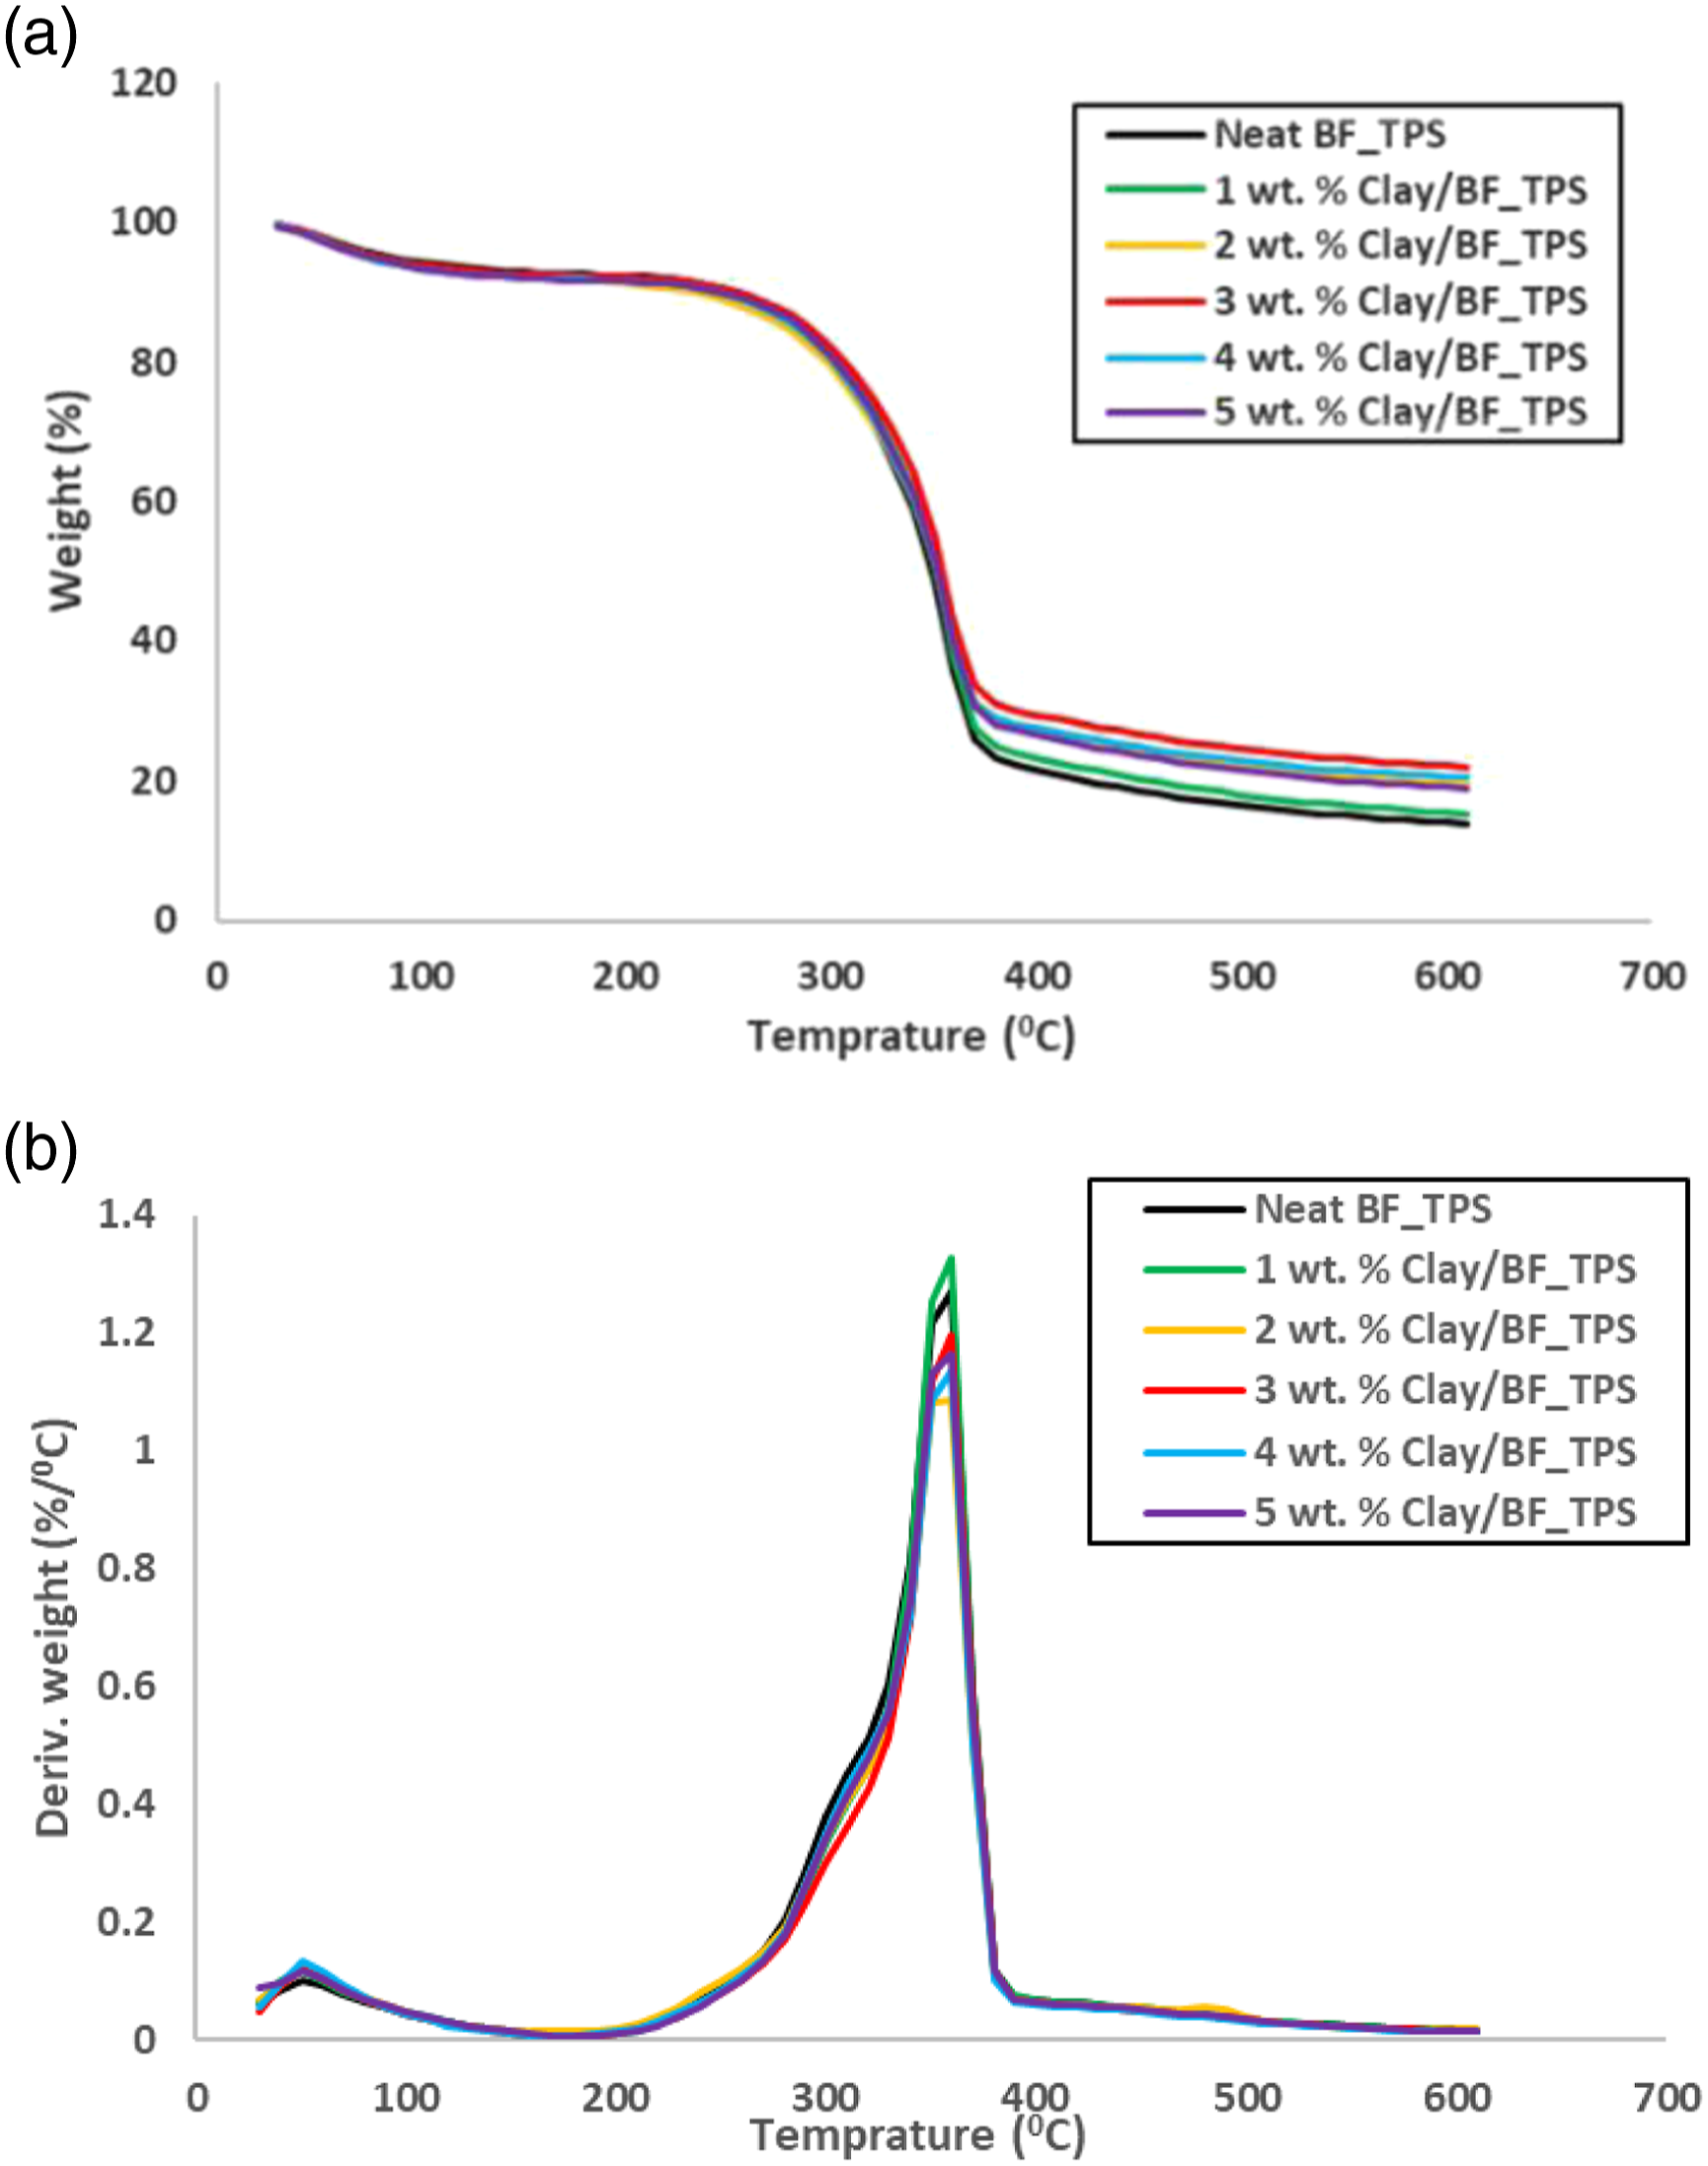

Subsequently, the derivative thermogravimetry (DTG) curve which is the rate of change of mass with respect to temperature shown in Figure 6(b) showing displayed the temperature at which the material loss is the most. This was considered to evaluate the thermal behavior change at the addition of nanoclay into the biocomposite. It can be observed that clay infused biocomposite delayed increase weight loss due to cay dispersion at lower percentages. Hence, at higher clay percentage, weight loss occurred drastically.
Dynamic mechanical analysis properties
The BF_TPS biocomposite was studied by dynamic mechanical analysis (DMA). Curves for the logarithms of the storage modulus (E’), loss modulus (E”) and tan delta (tan δ) were obtained for the biocomposite as shown in Figure 7a, 7b and 7c respectively. Increase in the storage modulus with a corresponding temperature was observed in clay/BF_TPS when compared to the neat BF_TPS. The loading of the biocomposite drastically increases the storage module of the hybrid clay/BF_TPS because of the cross-linking existence of nanoclay with the starch polymer in the biocomposite throughout rubbery region. This is in consistent with the result reported elsewhere. 43
It was therefore observed that the loading of the hybrid clay/BF_TPS enhances the storage modulus of the biocomposite in proportional to the corresponding neat BF_TPS as shown in Figure 7(a). The performance of the hybrid clay/BF_TPS indicates the effectiveness of the clay infusion in the starch polymeric matrix. Although, a slight reduction was observed in sample with 2 wt.% clay. This could have resulted in agglomeration of clay particles in the starch polymer matrix because of improper dispersion during the manufacturing process of the biocomposite. (a) Storage modulus of neat and clay-filled BF_TPS biocomposite materials. (b) Loss modulus of neat and clay-filled BF_TPS biocomposite materials. (c) Tan δ of neat and clay-filled BF_TPS biocomposite materials.
Figure 7(b) shows that the loading of the BF_TPS biocomposite material degraded due to the limited viscous motion of the starch polymer in the biocomposite. It was observed that when the biocomposite was exposed to heat, the decrease in the dissipation heat energy on the starch polymer in the biocomposite may have resulted to softness of the material when exposed to heat. A significant increase in the intensity of the loss modulus for hybrid clay/BF_TPS at all clay loading was observed in the biocomposite when compared to neat BF_TPS. However, there was a reduction in 2 wt. clay loading as shown in the loss modulus graph. This can be related to less dissipation of heat energy capacity of the biocomposite due to improper or incomplete clay dispersion by which the biocomposite was unable to dissipate energy along the stiffness stage. The increase in the loss modulus of all other clay/BF_TPS biocomposite shows that there is homogeneous dispersion of clay in the starch polymer matrix, having and effective strength support for the biocomposite. Also, the bonding process enhances the workability and processability clay/BF_TPS which reduced the stiffness as the temperature increases in during the loss modulus margin.
An entanglement dynamics and mobility of the polymer chain are more influenced by filler concentration. This makes polymer chains to be entangled or entrapped when they have an encounter with nanoparticles. The increase in height in the tan delta peak (Figure 7(c) and 8(c)) reveals that there is an accelerating amount of mobile polymer chains present during the transition process, and therefore, it can be used to quantify improvement in the mechanical properties of the clay/BF_TPS when compared to neat BF_TPS. It was well noted that the effective restriction of extensive molecular motions of the hybrid biocomposite materials resulted in better reinforcement, restricting the plastic deformation of the clay-filled starch polymer biocomposite.
As shown in Figure 8(c), the damping factor (Tan δ) of all the nanoclay reinforced biocomposite samples revealed greater values in clay-filled biocomposite samples than that of the neat BF_TPS biocomposite. Hybrid biocomposite with 1 wt.% to 5 wt.% showed 0.09524, 0.07653, 0.08138, 0.07605, and 0.07465, respectively, in comparison to the damping factor (Tan δ) of the neat biocomposite, which is 0.06789. In terms of the temperature difference in relation to the Tg values of all biocomposite materials, lesser Tg were observed in 2 wt.% and 4 wt.% biocomposite. However, 1 wt.%, 3 wt.%, and 5 wt.% exhibited better Tg values in comparison to neat BF_TPS. The Tg values of neat BF_TPS was observed to be 60°C, while 1 wt.%, 3 wt.%, and 5 wt.% were 80°C, 90°C, and 80°C, respectively. A shift in tan delta (Tan δ) Tg of 30°C was observed toward 3 wt.% clay/BF_TPS, which was 50% greater than that of neat BF_TPS. The decrease in the Tg values at 2 wt.% and 4 wt.% depicts that the biocomposite was less effective to withstand heat mobility due to possible agglomeration of nanoclay in the biocomposite, which could have eventually led to lower energy dissipation within the biocomposite. The thermal incident depicts that the cyclic structure of the starch polymer together with strong hydrogen bonding of nanoclay in the biocomposite structure led to highly ordered crystalline structure.
Conclusion
Fracture mechanics of hybrid clay/banana fiber reinforced starch-based polymer thermoplastic (clay/BF_TPS) was studied. Fracture resistance was conducted to study the crack propagation rate, while the critical stress intensity factor (Kc) and the critical strain energy release rate (Gc) relating to the crack propagation rate through the Mode I fracture test was established. The mechanical and thermal degradation were equally investigated and compared. The result shows that banana fiber with 40 wt.% fiber fractions gave the best mechanical property. This was further hybridized with varying percentage of nanoclay (1–5 wt.%) to study the fracture resistance of the biocomposite. From the result deduced, it was observed that 3 wt.% clay/BF_TPS gave the highest tensile strength value of 97.791 MPa and 83.1 kJ/m2 impact resistance, respectively.
On the contrary, the critical stress intensity factor (Kc) as well as the critical strain energy release rate (Gc) at 2 wt.% clay/BF_TPS biocomposite was observed to be 0.079 MPa√m and 0.037 kJ/m2, respectively. The TGA curves demonstrate that the incorporation of clay in starch polymer gives significant improvement to the thermal stability of the material. Higher Tg value was observed in the 3 wt.% biocomposite regarding the thermal stability. Also, a shift in tan delta (Tan δ) Tg of 30°C was observed toward 3 wt.% clay/BF_TPS. The thermal incident depicts that the cyclic structure of the starch polymer together with strong hydrogen bonding of nanoclay in the biocomposite structure led to highly ordered crystalline structure, and hence, improved fracture resistance of the hybrid clay/BF_TPS. Therefore, thermal, and mechanical properties of the biocomposite suggest material for automobile interior panels.
Footnotes
Declaration of Conflicting Interests
The authors declare that the authors have no conflict of interest as all authors are affiliated to the same institution as academic staff and students.
Funding
The author(s) disclosed receipt of the following financial support for the research, authorship, and/or publication of this article: The first author would like to acknowledge the funding support of the Research and Postgraduate Support of Durban University of Technology, as well as National Research Foundation (NRF) of South Africa. The second and third authors also acknowledge the funding support provided by National Research Foundation (NRF) of South Africa, grant numbers 132582 (2nd author) and 119779 (3rd author), to carry out this study.