
Abstract
Plastics reinforced by natural fibers attract growing attention, particularly in the automotive industry. The properties and performance of these composites are usually determined before application. However, many mechanical tests of composite materials are destructive, expensive, time-consuming, and can cause operator fatigue. The objective of this research is to model the tensile properties of sisal fiber reinforced polyethylene terephthalate (PET) composites and compare the model outcomes with the results of experimental tests. For the experiment, PET was reinforced with 25% wt. of sisal fiber and composite samples were produced by compounding and injection molding processes. Modeling and simulation have also been carried out with ABAQUS/CAE software. The outputs on the tensile properties of the experiment and the model were statistically compared to see the accuracy of the model against the experimental results. The two-sample t-test indicates that, at 95% confidence interval, the mean differences for the stress, strain, and modulus for the experimental tests and the model results are not significantly different from zero. The research shows that the experiment can be effectively modeled with ABAQUS-based modeling and simulation techniques by linking with appropriate mathematical predictive models.
Introduction
A few decades ago, fiber reinforced plastics (FRPs) began to gain momentum. 1 Because of their desirable strength and stiffness properties, they are an integral part of lightweight engineering. Their high strength-to-weight property makes FRPs very suitable for structural applications. 1 According to Schranzinger, 1 for example, approximately 30% of the aircraft’s interior and exterior structures are made of fiber composites.
Both long and short fibers can be used as a reinforcement for polymer matrices. However, difficulty to manufacture and highly aligned fibers are some of the limitations of continuous fiber reinforced composites, which can be overcome by short fiber reinforcements. 2 Apart from their wide applications in injection molded composite parts, short fiber reinforced composites (SFRCs) achieve complex fiber distributions and orientations during the injection molding making the mechanical properties hard to predict.3–6
However, the application of short fiber reinforced thermoplastic (TP) composites is not widely practiced due to the inability to accurately predict the performance and durability. Besides, the mass development costs for SFRCs is too expensive.1–3,5,7–9 Therefore, to develop affordable body parts for various applications such as for automobiles, a reduction of the production costs is necessary. In order to reduce the development costs for FRCs, the expenses for experimental testing must be lowered. Traditionally, a structural design process involves making scale models, hand calculations and a lot of lengthy tests in the lab. 10 Thus, it is the goal of researchers to utilize FEA commercial programs like ABAQUS, ANSYS, and NASTRAN to conduct virtual tests and get approximate results of the response of the real structure.1–10
ABAQUS is a FEA based simulation and modeling software containing an extensive library of elements that can model virtually any geometry.1,11 ABAQUS/Explicit, one of the ABAQUS packages, provides an explicit integration scheme to solve nonlinear dynamic and quasi-static models. It can simulate the behavior of engineering materials including metals, rubber, polymers, composites, reinforced concrete, crushable and resilient foams, and geotechnical materials such as soils and rock. It includes capabilities for creating models, interactively submitting and monitoring ABAQUS jobs, and evaluating results.1,11–15
Several works have been done concerning the simulation and modeling of composite materials. Kulkarni et al. 6 developed a micromechanics model based on the finite element modeling (FEM) which aimed to facilitate the design of a new injection molded FRP part. When comparing the predicted quantities to experimental results, a good correlation was obtained. They finally concluded that the model successfully predicts the load deflection curve of a composite injection molded part.
Swinnen 10 did FEA modeling of FRP open hole tensile tests with ABAQUS. Avdic and Saha 12 simulated a tensile test of a carbon fiber composite with ABAQUS. The 3D model for simulation of the tensile test on the composite specimen was developed with ABAQUS/CAE software. Swinnen recommended the importance of using the XFEM modeling techniques to bridge the problem with the damage propagation direction orthogonal to the fiber direction. In the XFEM framework, ABAQUS has the ability to simulate cohesive cracks using an adapted version of the superimposed element formulations. Rappolt 15 conducted an analysis of a carbon fiber reinforced polymer impact attenuator for a formula one vehicle using FEA. Kancharla et al. 16 performed an orthotropic structural analysis of short fiber filled thermoplastics with ABAQUS-moldflow interface and performed an experimental validation. Nirbhay et al. 17 studied the tensile test simulation of CFRP with ABAQUS. The rule of mixtures was used to determine the input data for the elastic and plastic properties of the model composites. In addition, load in the form of surface traction was applied to better simulate the application of tensile force in the experimental testing system.
Abhilash et al. 18 performed the tensile characterization and finite element modeling of Bamboo-PP Composite. Daghigh et al. 19 evaluated the finite element modeling of tensile properties on fiber reinforced polymer composites with ABAQUS. Glouia et al. 20 analyzed the numerical study of mechanical behavior of Agave fibers reinforced composites with ABAQUS. Serra et al. 21 evaluated the experimental and numerical analysis of carbon fiber reinforced composites under tensile loading. The simulation outputs were validated against the experimental observations. Carranza et al. 22 also conducted the characterization and modeling of the mechanical behavior of polymeric foams under complex loading.
This research work aims at modeling the tensile properties of PET composites reinforced with 25 wt. % of sisal fibers with ABAQUS/CAE with standard/explicit model. A comparative study between the experimental results and the outcome of the model was also performed to evaluate the predicting capability of the ABAQUS model on the experimental results based on the stress-strain, strength, and modulus properties. The results are compared statistically with a linear fitting curve, correlation and with a two-sample t-test.
Materials and Methods
Materials
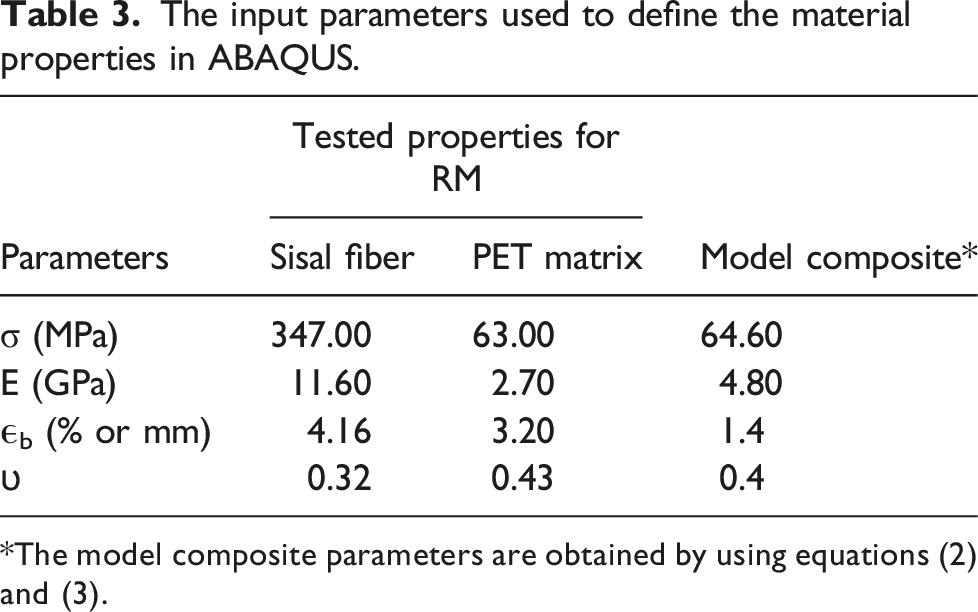
Commercial grade sisal fiber was purchased from Seilerei SAMMT Elsterberg, Germany, with an individual fiber length ranging 20–100 cm. PET was purchased in pellet form from Lotte Chemical Deutschland GMBH, Kölner Str. 12, 65760 Eschborn, Germany. It is a PET copolymer with a density of 1.4 g/cm3 and a melting point of 245 ± 3°C., and is characterized by excellent processability, optical clarity, high-stress cracks resistance, toughness, and thermal stability. The mechanical properties of the utilized sisal fiber and PET, which are of relevance to this work in Table 3 in the results section.
Experimental determination of sisal fiber diameter
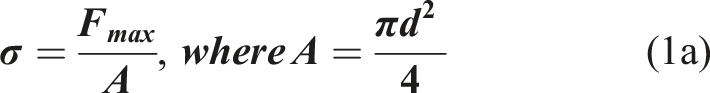
The diameter of sisal fiber is important in this experiment to calculate its tensile strength based on equations (1a), and (1b). Sisal fiber diameter was determined with KEYENCE Digital Microscope VHX-500F equipped with a real-time observation, recording, and measurement of diameter on the monitor screen.
A bundle of around 30 fibers was mounted with a mounting instrument facing the cross-section outwards, placed into a cup, and filled with a mixture of thickener and epoxy, as shown in Figure 1(a). The cup which is filled with epoxy thickener was allowed to solidify in the laboratory at room temperature for 2 days to make it suitable for polishing. After 2 days, it was polished with a Struers Tagramin-25 polishing machine and finally observed under a digital microscope for measurement which the outputs are shown in Figure 1(b) and (c). Twenty measurements were taken. Determination of sisal fiber diameter under KEYENCE digital microscope (a) after polishing, (b) under the microscope and (c) on the screen measurement.
23

Tensile properties of the constituents
An experimental investigation of the mechanical, moisture absorption, thermal, morphological, fiber diameter, and FTIR studies of the neat and surface modified sisal fiber were discussed in a separate paper by the same authors. 23 The properties which are relevant to this work are presented.
Tensile strength of a single sisal fiber
Sample preparation was performed according to ASTM C1557 with test speed of 2 mm/min, load cell capacity of 200 N with a gauge length of 25 mm. A thick paper of 90 g/m2 is used to hold the fiber firmly. The sample preparation step is performed based on the steps a to c, as shown in Figure 2. Sample preparation for tensile testing of natural vegetable fibers.
24

The tests were carried out with a universal tensile testing machine of Zwick Roell, TestXpert®II. As the tensile test outputs were in maximum force, elastic modulus and elongation at break, the tensile strength and modulus of the sisal fiber were determined based on equations (1a) and (1b) as used by Gudayu et al.
23
based on ASTM C1557-20.
25

Tensile strength of PET polymer
A dog bone shaped tensile test PET specimens were prepared with ARBURG 320 C injection molding machine based on ISO 527 type 1A specimen size. The test was performed according to DINEN ISO 527–1 and 2, with Zwick Roell universal testing machine with a load cell capacity of 20 KN. A test speed of 2 mm/min and 115 mm gap between the jaws was used. The tensile test of sisl-PET composites with 25% sisal fiber content was also performed in the same manner as the pure PET.
Feed material preparation
The fiber was cut into bundle lengths of up to 30 mm for making it suitable for further processing. Prior to injection molding, the PET polymer was blended with a 25 % wt. of sisal fibers using a laboratory scale (60 cm3) HAAKE PolyLab OS RheoDrive 7 co-rotating screw compounder (kneader). The mixed compound was then granulated with DREHER S15/20L crushing device for suitable feeding to the molding machine. Finally, drying of the pellets were completed with a vacuum-assisted drier at 80 C for 72 hrs to minimize the formation of interfacial aggregates.
Composite preparation
Tensile test specimens were prepared with ARBURG 320 C injection molding machine based on ISO 527 type 1A specimen dimensions as shown in Figure 3 and Table 1. Iso 527 type 1A test specimen. Dimension of ISO 527 type 1A tensile test specimen.

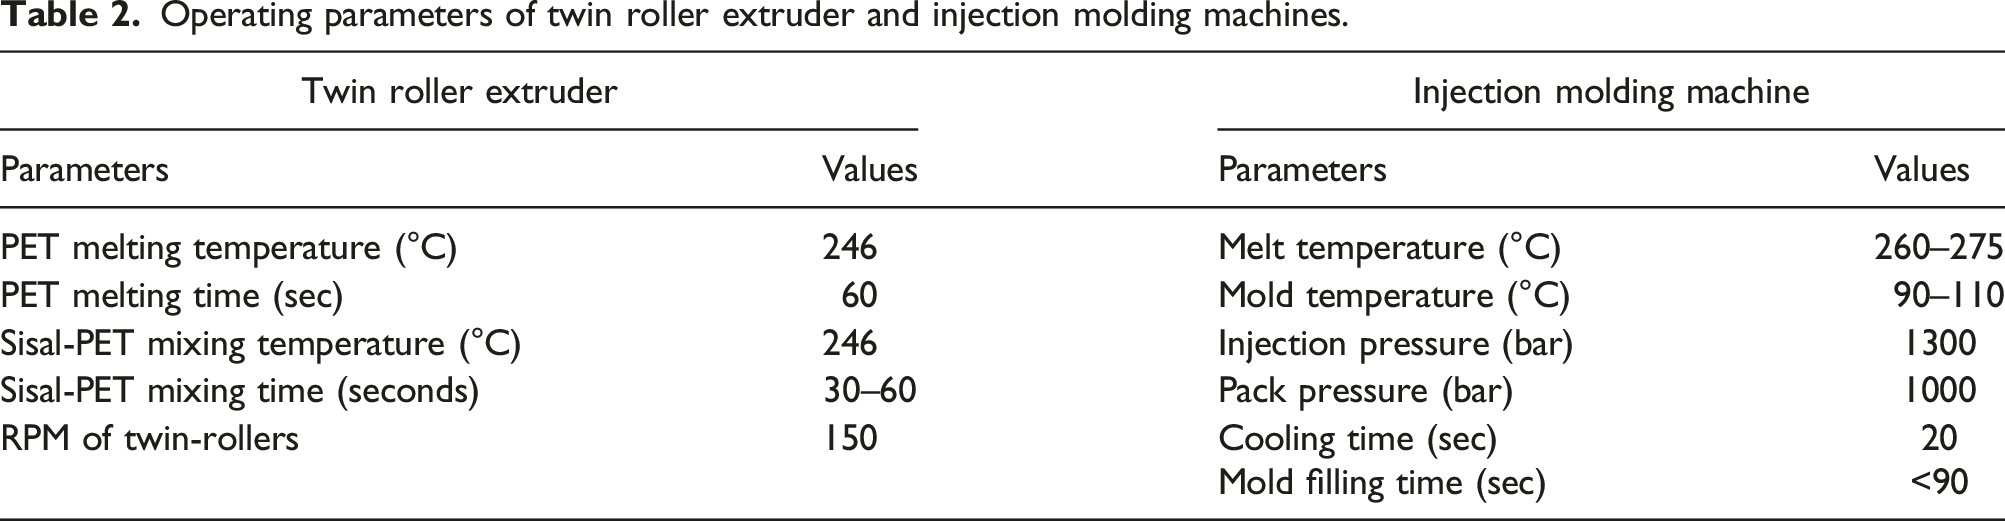
Operating parameters of twin roller extruder and injection molding machines.
Model development with ABAQUS for the tensile test simulation
Generally, it is possible to develop a FEA model based on ABAQUS/CAE by using the available predictive methods. The following preprocessing and processing procedures were followed to obtain a better predictive post-processing result out of the ABAQUS-based model. a. Model description
A micromechanical model was used to predict the mechanical properties of the model composite based on the properties of its constituents and by considering the fiber distribution as random and constant.7,8,26 For a completely random distribution of fibers, the distribution function is constant, as the distribution is assumed equal in all directions. Therefore, among the various mathematical models developed for randomly oriented short fiber reinforced composites,4,9,27–32 the assumptions by Manera
27
were taken as valid for the injection molded sisal-PET composites. According to Manera, equations (2) and (3) are the proposed approximate equations to predict the elastic properties of randomly oriented SFRCs.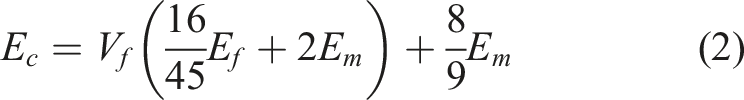
Thus, for composites having fibers which are random in 3D, the suggested an upper strength is, b. Model geometry development 1. Part development The input parameters used to define the material properties in ABAQUS.
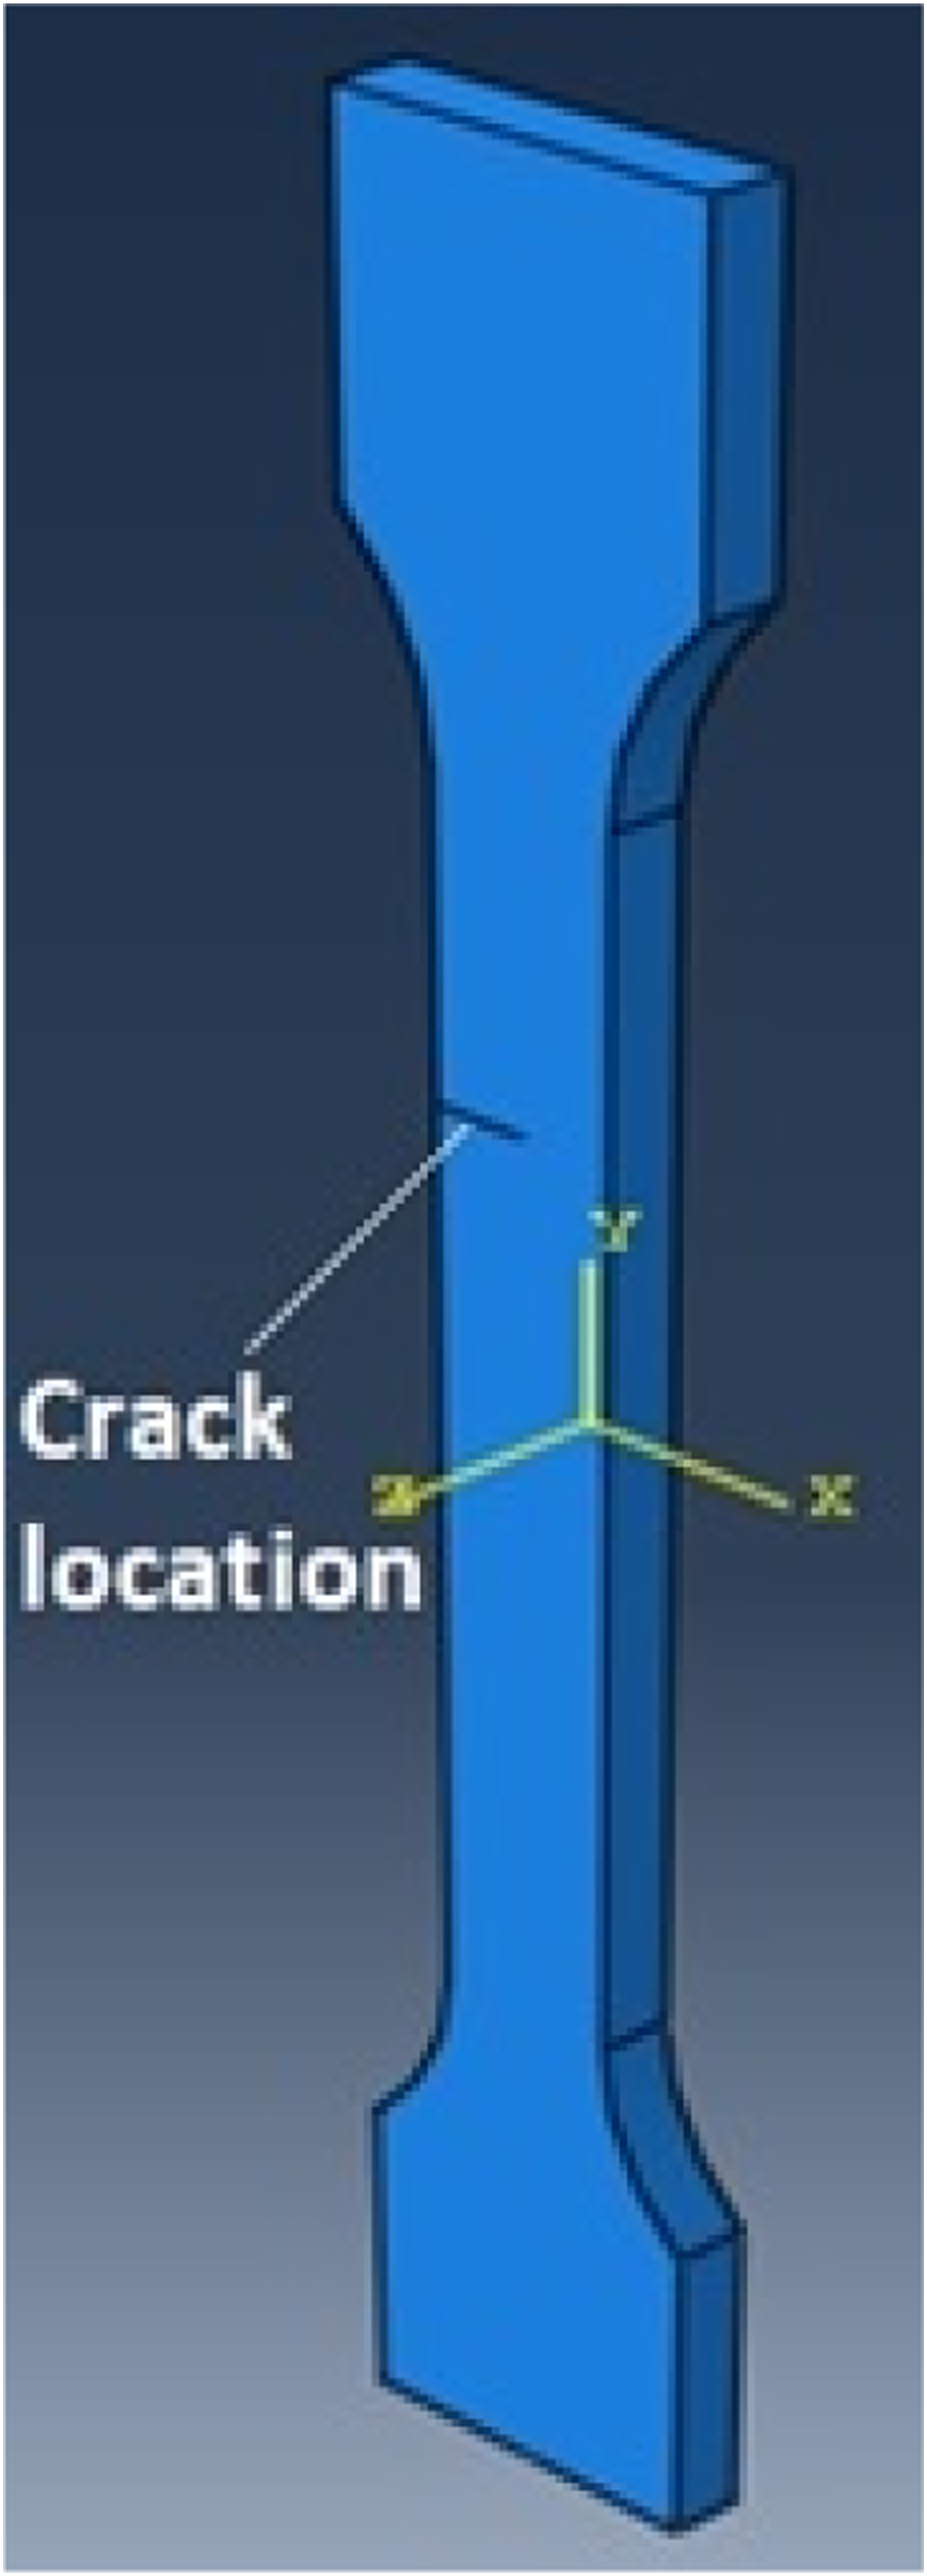
Since the fiber orientation in injection molded composites takes a random alignment with short fibers,3–6,8,9,14,26,28,30 the behavior of the composite is the same in all directions, that is, the composite specimen considered in this study is assumed isotropic. Therefore, a uniform material model was used in this work. Accordingly, a dog bone tensile test specimen shown in Figure 4(a) was developed with ABAQUS based on the specimen dimension of ISO 527-1A. Figure 4(b) was also used to locate the initial location of the crack based on XFEM crack growth method. 2. Assembly Developed parts; (a). the tensile test specimen (b) the XFEM crack.

The extended finite element method (XFEM) was used to model the crack location and crack growth.
The two parts, the tensile test specimen shown in Figure 4(a) and the crack part shown in Figure 4(b), are assembled as a single part. A separate part shown in Figure 4(b), a 3D shell, deformable, was used to locate the crack in the part. The XFEM crack, its initial location, and crack growth are defined in the Interaction module. The location of the crack during the analysis was determined by ABAQUS based on the value of the maximum principal stress or strain calculated in the crack domain, as presented in Table 2 for the model composite. The assembled part with its crack location is shown in Figure 5. 3. Property definition The location of the crack after assembly of the two parts.
The values listed for the model composite in Table 2 are used to define the properties of the model composite under the property module. In addition, section creation and section assignment are other procedures to be completed under the property definition module. 4. Step
A basic concept in ABAQUS is the division of the problematic history into steps. In its simplest form, a step can be just a static analysis, in ABAQUS/Standard, of a load change from one magnitude to another. This process can be imitated with the constant rate of loading (CRL) type of the tensile testing machines. The step definition includes the type of analysis to be performed and optional history data, such as loads, boundary conditions, and output requests. ABAQUS has two measures of time in a simulation. The first is the total time, which increases throughout all general steps and is the accumulation of the total step time from each general step.
Each step also has its own time scale (known as the step time), which begins at zero for each step. Time varying loads and boundary conditions can be specified in terms of either time scale. In this analysis, as shown in Figure 6, a static, general step is created with a total time of 1 which is equal to the maximum increment time, initial increment time of 0.01 with a minimum increment time of 0.1. The field output was requested to execute the crack initiation, propagation, and final breakage under the step menu. The field output request manager indicates in which step the output request was created and into which steps it was propagated. From the list of field output requests in the manager, the Failure/Fracture and State/Field/User/time output variables were selected to get the tensile fracture based on the XFEM crack growth method. Under the Failure/Fracture output variable, the PHILSM, (level set value phi), and the PSILSM, (level set value psi) were activated. Similarly, under the State/Field/User/Time output variable, the STATUS, status (some failure model; UVMAT) and STATUSXFEM, status of XFEM element were activated.
35
5. Load and boundary conditions (BCs) The steps dialog box in ABAQUS standard/explicit for editing step parameters.

After specifying the steps in which the loads and BCs become active, the prescribed conditions of loads and BCs, which are step-dependent, must be specified. After defining the steps in the analysis, three boundary conditions were created: • The first BC (BC1) locates the specimen as a cell and constrains the 1, 3, 4, 5, and 6 degrees of freedom and allows the 2nd degree of freedom, which is the load to be applied only in the Y direction as a distributed load. This BC allows the distributed load to be applied in the Y direction and the crack to be initiated at the location which was indicated by a plane shown in Figure 6. It should be applied during the initial step in the procedure with a type “Displacement/rotation” as the tensile extension is only on the Y direction. • The second BC (BC2) constrains the lower end of the tensile bar shown in Figure 7, in the X-, Y-, and Z-directions which should be applied during the initial step having a type “Symmetry/Antisymmetry/Encastre” as shown in Figure 7. • For, the 3rd BC, a surface traction load was applied on the upper surface of the specimen to assign a distributed tensile load on the top face of the model composite. The load is applied during the general analysis step. BCs for the application of loads and constraints (the red lines at the edges of the BCs indicate the surface or body in which the BC is active).

On the third BC (BC3), the 1, 3, 4, 5, and 6 degrees of freedom will be set zero and finally the BC should be modified, the 2nd degree of freedom (U2) activated, and the value of the distributed force shall be set. The force applied will be in the form of stress as it is applied on the surface. 6. Mesh
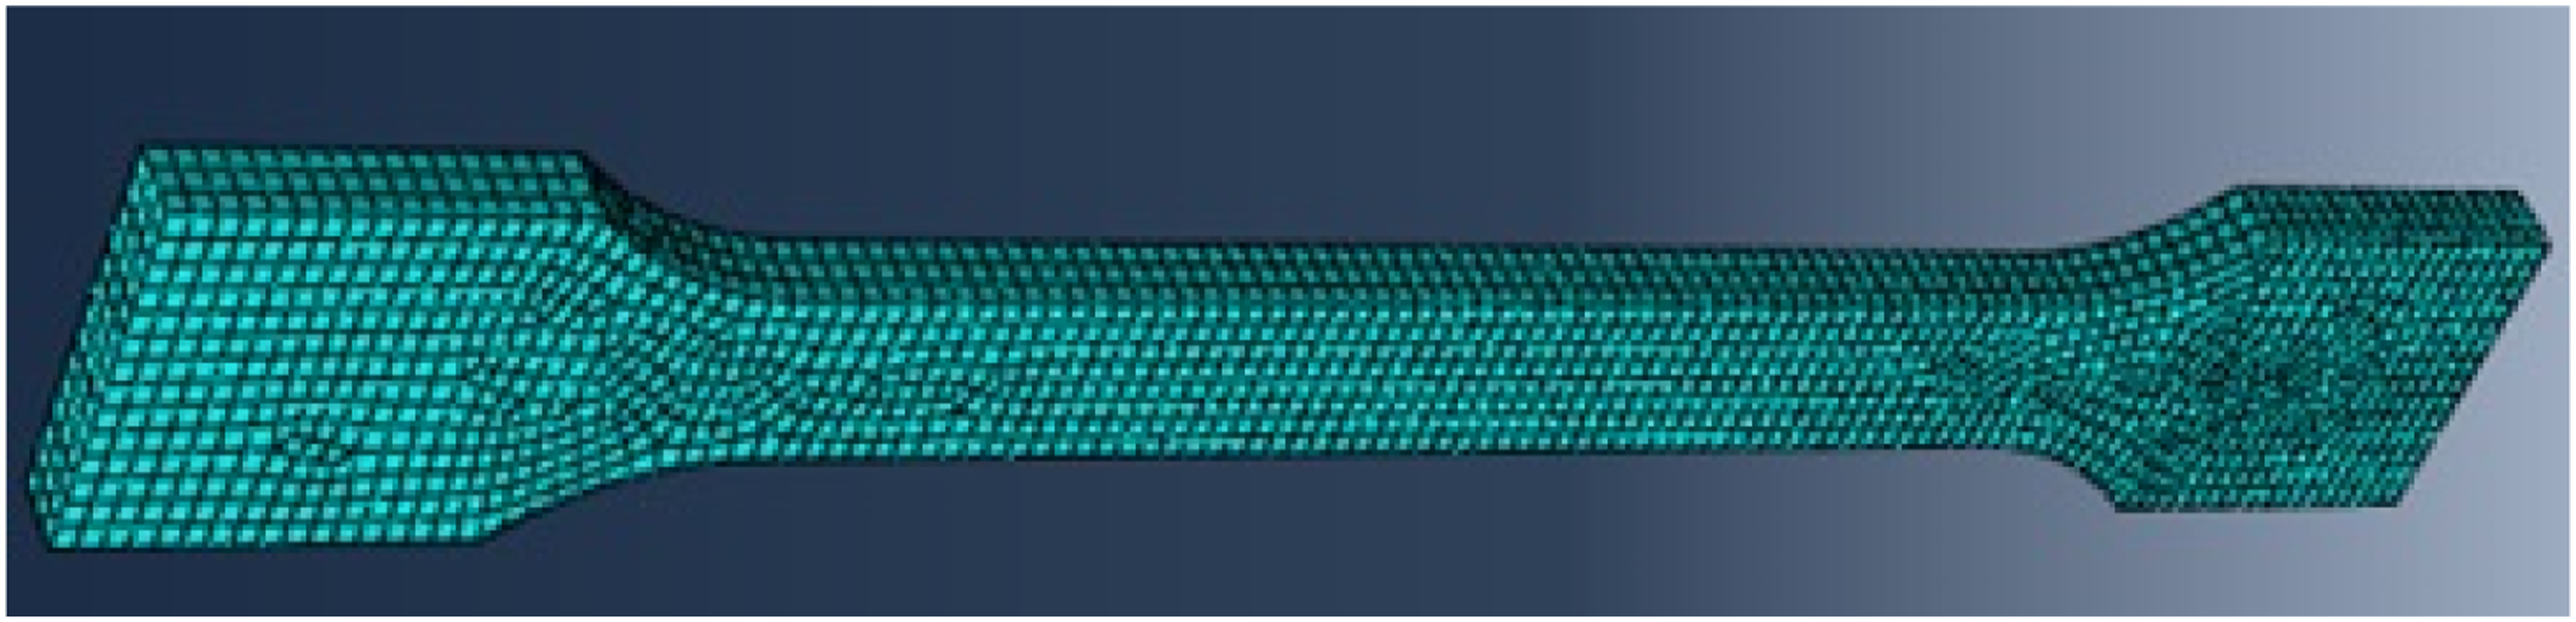
A free meshing technique was used for seeding the part instance and applying the mesh to the instance. This technique was used because the whole part is not partitioned into cells for easy and convenient application of the crack initiation and growth.
The meshed part shown in Figure 8 was created with a global seed size of 1.5 and meshed with a dependent mesh, i.e., meshing on a part. The global seed size of 1.5 is selected to be optimum. 7. Job The meshed part.
With the Job module, a job is created, submitted for analysis, and its progress can be monitored. If there is no error in the previous steps performed, the submitted job will be completed successfully and the output will be prompted for the visualization module, which will be discussed in the results section. Several jobs have been run by varying the crack location and five outcomes were selected for better simulation and comparison of the five experimental tests.
Comparative study with the experimental findings
The outcomes of the tensile test simulation of the model composite were discussed based on a comparative study of the stress-strain curves of the experimental plot and the plot obtained from the model tensile test simulations. A stress-strain data was extracted from the ABAQUS XY-data menu under the visualization module by selecting elements at different crack locations. Five sets of stress-strain data were extracted from five different crack locations for better simulation of the experimental testing. A linear curve fitting was used together with the correlation coefficients and errors on the slopes and intercepts of the graphs to elaborate the outcomes. Finally, a mean comparison test for the stress, strain and modulus were conducted with a two-sample t-test at 95% confidence interval to see whether the two means for each parameter differ significantly.
Result and discussion
Sisal fiber diameter
Fiber diameter and aspect ratio (length to diameter ratio) are essential parameters that affect the tensile strength and other mechanical properties of the fiber and its products. 23
The variation in sisal fiber diameter for each test coupon is plotted in Figure 9. From the vertical drop line, it can be observed that most of the sample tests show a good precision against the mean value. There are some test coupons which can be considered as outliers such as tests 1, 11 and 20. The variation in diameter from one coupon to the other is due to the nature of natural fibers. Sisal fiber is composed of multiple individual, more delicate tissues bound together by lignin.36,37 Fiber individualization depends on the efficiency of the fiber extraction process. Generally, larger sample sizes are considered during testing to minimize variations caused by the natural variability of the fibers. Measured sisal fiber diameters and the mean value.
Feasibility of injection molding of sisal-PET granules
As studied in a separate paper by the same researchers, 38 a composite with better mechanical, thermal and water uptake properties was produced from sisal fiber and PET polymer by injection molding. There are no literature or experimental trials concerning the injection molding of sisal or any NF with PET, an engineering TP. The reason could be a generalization that the higher processing temperature may degrade the natural fibers.
However, it can be understood from 38 that injection molding of natural fibers with PET is possible with some thermal effects on the fiber which could lead researchers to further investigate on the mechanisms to improve the thermal properties of sisal and other natural fibers.
As it is illustrated from Figure 10, the color of the composite specimens was gray to dark brown. This is mainly due to the formation of smoke and char because of the pyrolysis of sisal fiber resulting from the high processing temperature of PET.39–41 Smoke forms voids in the injected parts which gets trapped in the viscus molten plastic. After cooling down, the smoke condenses into droplets which is absorbed again by the sisal fibers which can be detrimental to the mechanical properties of the composites. These water molecules and condensed droplets are bad as they will create interfacial imperfections and deteriorate the mechanical properties of the produced composites. They also are responsible for the interruption of the injection molding process. To minimize this effect efficient drying of the sisal-PET granules prior to injection molding is normally performed. It is reported in different works that the chars formed during the pyrolysis of cellulose serve a favorable effect to the composite by preventing further fiber degradation and improving the stiffness of the composite.42,43 The produced sisal fiber reinforced polyethylene terephthalate composites.
Mechanical properties of the constituents
The mean values of the tensile properties of sisal fiber and PET.

As can be understood from Table 4, the stress, modulus, and strain values vary from test to test for the sisal fiber. This is because of the property variability of natural fibers. The properties of natural fibers depend on many factors, including chemical constituents such as cellulose, efficiency of fiber extraction, and fiber maturity.
Visualization of the model output
Figure 11 shows the output of the simulation after a job is submitted for analysis. The figure shows the distribution of the stress (the left), crack initiation and growth in the specimen before breakage and the broken specimen (to the right). A model tensile test with ABAQUS/CAE; (from left to right) stress distribution, crack initiation, crack growth, final breakage.
As can be observed from the stress distribution image (on the left), the stress distribution is on and below the neck of the model specimen. In addition, as the crack continues to grow, the applied force and the resulting stress starts decreasing as shown in the mises (on the right side). During final breakage, the stress becomes nearly zero. This is a good simulation of what is happening in the experimental testing. Thus, it can be said that the assumptions considered in this research and the model are valid. The crack initiation is activated at the XFEM part, when maximum stress is applied, the crack is propagated as indicated by the crack growth in Figure 11. When maximum stress is applied, the stress is distributed at the necks of the specimen as indicated on the same figure (on the left).
Figure 12(a) shows a stress-strain graph that is obtained from an experimental test of the sisal-PET composite specimen containing 25 wt.% of raw sisal fiber while Figure 12(b) shows a stress-strain graph obtained from the ABAQUS model output of the model specimen. Sample stress-strain plots of the experimental and the model tensile test outputs.
The breaking strength (stress), breaking strain and modulus for the experimental and model tensile tests.

Two-sample t-test results for the modeled and tested tensile properties.

Furthermore, the stress-strain graphs of the five model outcomes which were obtained by varying the crack location regions were plotted altogether in Figure 13 with the five experimental tests which were conducted based on ISO 527 1 and 2 tensile test standards. As can be observed from the figure, the plots for the ABAQUS-based model lie among the experimental plots. Tensile stress-strain curves for the experimental results and the model.
Specifically, the experimental plots of tests 2 and 3 bound the model plots from the upper and tests 1, 4, and 5 from the lower. This indicates a very good prediction of the experimental tests by the ABAQUS-based model.
Conclusion
A promising result was achieved for the injection molding of sisal fiber with an engineering polymer, PET. The details are studied in another paper by the same authors. However, for efficient commercialization of the production process, further research will be conducted regarding improving the thermal stability of sisal fiber, further optimization of the compounding and injection molding processes and improving the mechanical properties.
The ABAQUS-based FEA with XFEM crack growth technique was joined with the micromechanical analysis to characterize the tensile properties of the sisal and PET phases. From this research, it is encouraging that physical tests can be effectively simulated with FEA based modeling and simulation techniques by coupling with appropriate mathematical predictive models such as those proposed by Pagano 33 and Piggott. 34 Selection of appropriate modeling technique and failure mechanism, such as the XFEM crack growth method, which is already used in this research work, is another important step towards better simulation of the mechanical tests. This is a vital technique for minimizing the overall costs related to testing and product development.
Footnotes
Declaration of conflicting interests
The author(s) declared no potential conflicts of interest with respect to the research, authorship, and/or publication of this article.
Funding
The author(s) disclosed receipt of the following financial support for the research, authorship, and/or publication of this article: This work was supported by the Deutscher Akademischer Austausch Dienst Kairo (57375975).