
Abstract
Continuous fiber additive manufacturing technology has developed rapidly in recent years, and pore has a great influence on the properties of composites. Through the optimization process of aramid fiber (AF) reinforced composite filament forming, the internal porosity of composites filament was reduced, and stable wire was provided for continuous fiber additive manufacturing. A mathematical model of 0° fiber orientation porosity was established, and the porosity of composites was measured by Micro-CT, and the correctness of the mathematical model was verified with the absolute error of 0.26%, and the relative error of 2.16%. The process parameters of printing speed, printing layer thickness, and printing spacing were designed by orthogonal experiment. The relationship between interlaminar shear properties and porosity of composites with 0° fiber orientation was studied.
Introduction
Fiber reinforced composites have been widely used in aerospace field due to their excellent mechanical properties such as light weight and high strength. In recent years, continuous fiber additive manufacturing (AM) technology has developed rapidly. Scholars at home and abroad have successively carried out research on AM technology of continuous fiber reinforced composite materials,1–3 and most of them adopt the fiber filament into FDM for online composite and printing. As represented by Heidari-Rarani et al., 4 Dou et al., 5 Tian et al.,6–11 Akhoundi et al., 12 and Matsuzaki et al., 13 all adopt the above process to introduce carbon fiber (CF), glass fiber (GF) or AF into Polylactic acid (PLA), nylon (PA), and other resin forming composites and study their mechanical properties. Shan et al. proposed the continuous fiber AM forming technology, which mainly prepared the composite filament by adjusting the ratio of fiber and resin, and prepared composite material components by heating and melting the composite filament by using the continuous fiber additive manufacturing forming equipment.14–17 This method could be used to form thermoplastic resin matrix composites reinforced by high performance fibers such as CF and AF, and realize direct forming from raw materials to composites. The forming technology has the characteristics of layer by layer superposition and layer by layer manufacturing. And there are pores in the composites; however, porosity directly affects the properties of traditional composites. Yang et al. 18 established a nonlinear relationship model between porosity and compressive strength for carbon fiber reinforced epoxy resin composites, and predicted the compressive strength of composites, and the prediction result was more accurate than the classical Gürdal index model. Yoshida et al. studied the effect of pore content on the interlaminar shear performance ILSS of carbon/epoxy composites. 19 Liu et al. 20 conducted ultrasonic C-scan to identify the porosity distribution of laminates, adopted ultrasonic secondary penetration and reflection method to detect and accurately measure the content of pores, and sampled to test the ILSS, so as to establish the quantitative characterization relationship between porosity and interlaminar shear performance in laminates. Lei et al. 21 proposed a cross-scale analysis method based on Micro-CT to predict the tensile behavior of three-dimensional braided composites with pore defects.
The pores were inevitably produced in the process of continuous fiber AM and have obvious influence on its mechanical properties. The study of the porosity model for additive manufacturing and the relationship between porosity and ILSS had not been found, so the porosity of AF reinforced composites was studied in both composite filament and composite forming by AM.
Experimental section
Materials and equipment
. Mechanical and physical properties of AF, PLA and PBS materials.

Continuous fiber composite filament forming machine and continuous fiber additive manufacturing principal prototype were both independent research and development.
Sample preparation
Firstly, the AF reinforced thermoplastic composite filament was prepared by the continuous fiber composite filament forming machine. Then, slice layering and path planning were carried out according to the planned printing sample by the Repetier-Host software, which was the open-source slicing software, and G-code was generated. Then, the composite filament was printed into the target sample by the continuous fiber additive manufacturing principle prototype. The process flow chart was shown in Figure 1. The process flow chart of composite filament forming and AM forming.
Due to the water-soluble oiliness sizing agent on the surface of AF, defects such as resin knot and air bubbles were easily produced when the composite filament was prepared by traditional technology. This paper proposes an optimized forming process of AF with low damage, short process, and integration to develop the forming of AF reinforced thermoplastic composite filament. The optimized process consists was the three-stage fiber pretreatment melt impregnation preparation method and process, which included fiber surface desizing, multistage heating fiber spreading, and resin powder adsorption and impregnation. And the optimized process was online and efficiently integrated with melt impregnation, as shown in Figure 2. The process parameters of composite filament and composite material sample preparation in this paper were shown in Table 2. The three-stage fiber pretreatment melt impregnation preparation method and process of AF/PLA composite filament material.
22
The process parameters of preparation.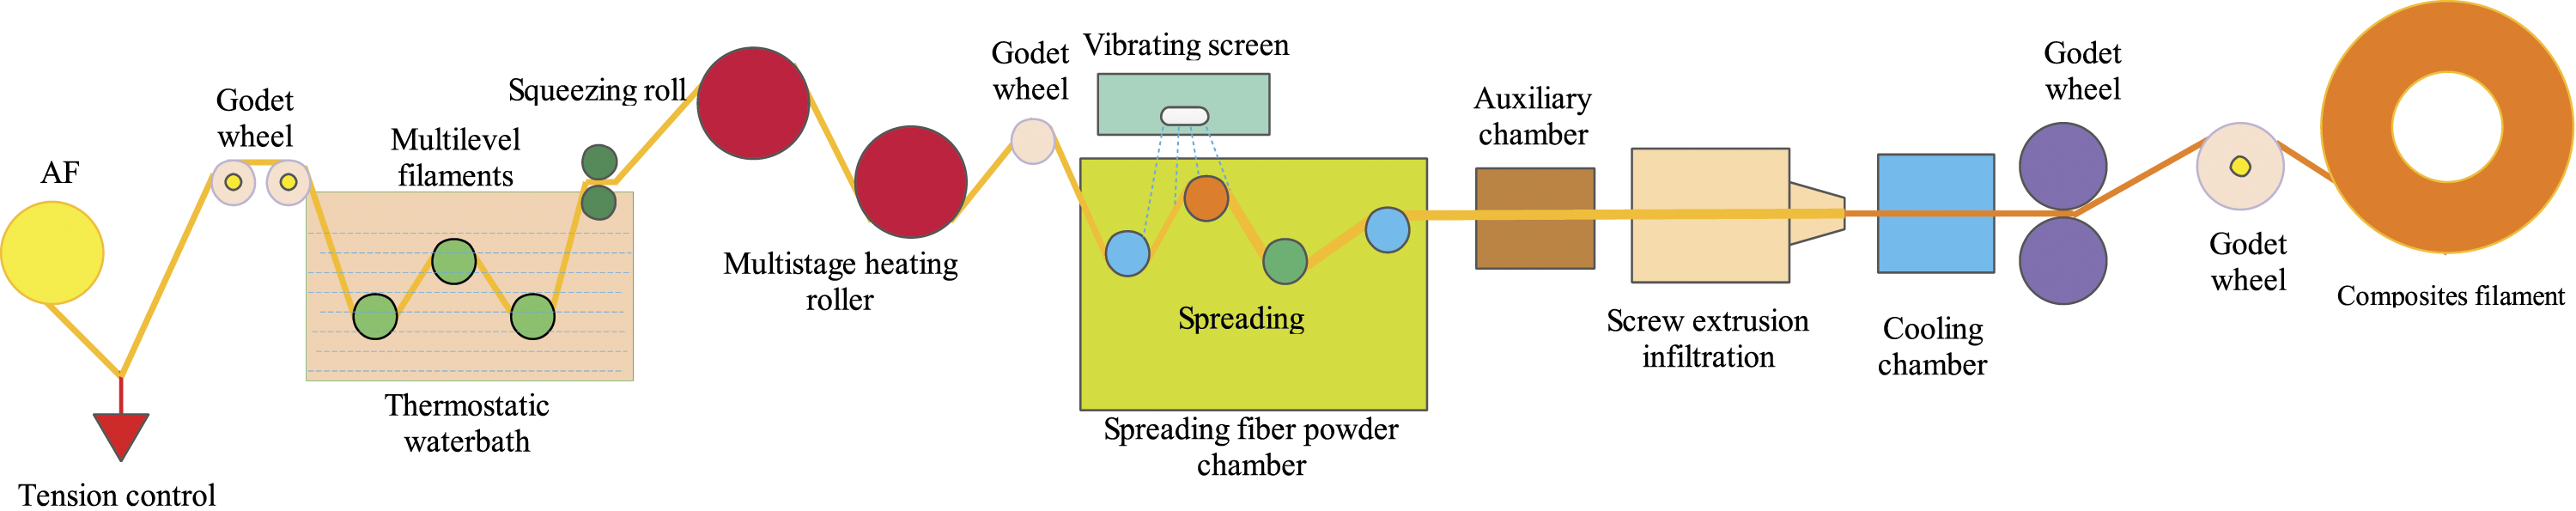

Main test instrument
Geminisem 500 Field Emission Scanning Electron Microscope (SEM) from Carl Zeiss AG in Germany had been used to observe the end face of composite filament. INSTRON5567 Material Testing Machine from Instrang Corporation in USA had been used to test the ILSS of composites. Nanovox EL-3000 Equipment from Sanying Precision Instruments Co., Ltd. in China had been used to observe the internal pores of the composite filament and the composite material.
Performance test
A sample of 1 cm was selected from the composite filament, and its end face was sprayed with gold and observed in GeminiSEM500 Field Emission Scanning Electron Microscope. The radiation voltage was 3 kV and the magnification was 70–900 times.
The porosity of composite filament samples was measured by Micro-CT. The observation conditions were set as follows, the voltage of 100.0 kV, the current of 400.0 μA, and the resolution of∼ 0.7 µm.
The porosity of the composite sample was measured by Micro-CT. The observation conditions were set as follows, the voltage of 60 kV, the current of 70 μA, and the resolution of 3 μm.
The ILSS of the composite test sample was tested according to ISO 14130-1998. The span was half of the width of the test sample. The empirical loading speed was 3 mm/min. Both the fillet radius of the loading head and the fillet radius of the support were 2 mm ± 0.2 mm.
Study on porosity of composite filament
The impregnation quality and pore defects of composite filament had certain influence on the properties of composite material. The internal pores of the composite filament would increase the internal pores of the composite. In order to improve the impregnation of the composite filament and reduce the internal porosity, the composite filament was prepared by the optimized process. Because the composite filament was not conductive, the SEM observation was carried out after gold spraying of composite filament samples, as shown in Figure 3. AF was wrapped inside the composite filament, and there was resin in the fiber bundle, as shown in Figure 4. Compared with the observation results of the composite filament prepared by melt impregnation process, as shown in Figure 5, the AF was not completely immersed into PLA, and there were unimpregnated area and different fiber lengths in the composite filament. It could be seen that, after the optimized process, the fiber impregnation inside the composite filament were improved. Because SEM observation requires sample preparation of the composite filament, the observation position was only in the end face area. The gold spraying of AF reinforced thermoplastic composite filament samples. End face and part of AF reinforced thermoplastic composite filament prepared by optimized process. SEM scanning electron microscope test diagram of composite filament prepared by melt impregnation process.


Porosity calculation of composite filament at different positions.
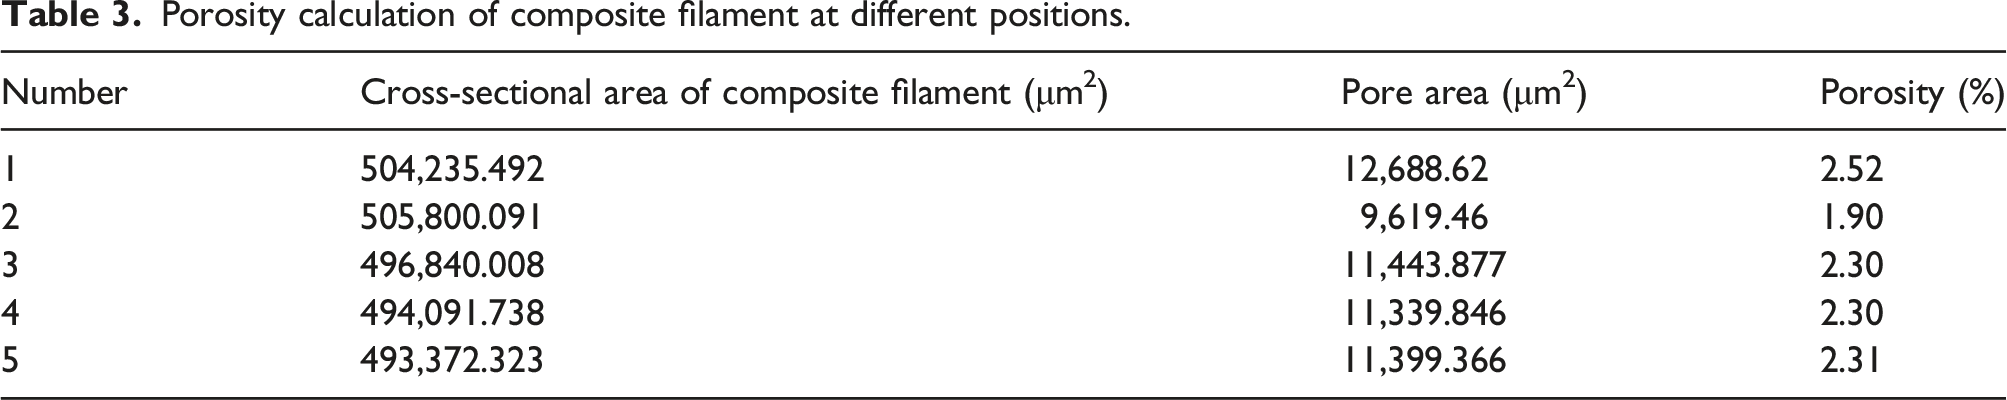
Figure 6 showed that the internal pores of the composite filament only exist between the fiber bundles, and the outermost region of the fiber bundles was uniformly impregnated. By comparing the Micro-CT results of composite filament by melt impregnation process, as shown in Figure 6, the surface of the composite filament was significantly uneven, while the surface of the composite filament by optimization process was relatively smooth, and there were many pores in the composite filament, including the inside and around the fiber bundle. The same method was used to calculate the porosity of the composite filament by melt impregnation process. The porosity of the composite filament by melt impregnation process was ∼11.62%. The porosity of the composite filament by optimized process was ∼80% lower than the porosity of the composite filament by melt impregnation process. The pores of the composite filament by melt impregnation process were as shown in Figure 7. According to the Micro-CT section shown in Figure 8, the pores of composite filament not only existed around the fiber bundle but also presented multiple pores in the matrix. The above situation did not appear after the optimized process. It could be seen that the pore of the composite filament could be greatly reduced after the optimized process, which was three-stage fiber pretreatment melt impregnation preparation method and process, which were online and efficiently integrated with the surface desizing of AF, heating fiber spreading, resin powder adsorption and impregnation, before melt impregnation. Then the preparation of composite filament was improved from one impregnation to two impregnations, while the impregnation effect of composite filament was improved. Micro-CT section of AF composite filament by optimized process: (a)The axial section diagram, (b) and (c) The two different radial sections diagram. Micro-CT sections of two parts of AF reinforced thermoplastic composite filament by melt impregnation process: (a) and (b) The two different axial sections diagram. Micro-CT images of multiple parts of AF reinforced thermoplastic composite filament by melt impregnation process: (a), (b), (c) and (d) the four different radial sections diagram.


It was found that the surface of the composite filament was significantly uneven before optimization, while the surface of the composite filament was smooth after the optimized process. The optimized composite filament was more suitable for the subsequent continuous fiber additive manufacturing, which laid a foundation for the stability and controllability of the subsequent forming manufacturing.
Study on the porosity of composites
Porosity calculation model of 0° fiber orientation composites
The interlaminar shear properties of AF continuous fiber additive manufacturing composites with 0° fiber orientation have better performance,
23
while the porosity calculation model of composite with 0° fiber orientation in continuous fiber additive manufacturing process would be established to predict porosity and study the relationship between porosity and ILSS. A calculation model was established for the porosity of composite component, and a 3D model of composite component was prepared, as shown in Figure 9. The length, width, and height of the sample were L, D, and H. And Figure 10 showed the printing paths of 0° fiber orientation, and the AF continuous fiber additive manufacturing composite was alternate stacking of the first and second layers. The three-dimensional model of AF continuous fiber additive manufacturing composites with 0° fiber orientation. The printing paths of 0° fiber orientation.

Based on the 0° fiber orientation printed composite formed by continuous fiber additive manufacturing, Micro-CT observation was carried out. Assuming that the cross-sectional geometry of the printed single bundle of composite filament was the runway of athletic field, as shown in Figure 11. Micro-CT section of continuous fiber additive composite forming.
The pore distribution of 0° fiber orientation composite formed with different printing layer thickness and printing spacing was analyzed, as shown in Figure 12. It could be found from the cross section of composite material formed by continuous fiber additive manufacturing, as shown in Figure 12(a), the pores of composite material without gap between channels were mainly internal and external pores, while the inner pores of composite material with gap between channels were through upstream and downstream, as shown in Figure 12(b). Due to the large printing spacing or printing layer thickness, the printed composite filament could not contact the printed area, forming a gap. Therefore, in view of the above situation, the porosity calculation model was established. The pore distribution of composites formed by 0° continuous fiber additive manufacturing. (a) No gaps between raster (b) Gaps between raster.
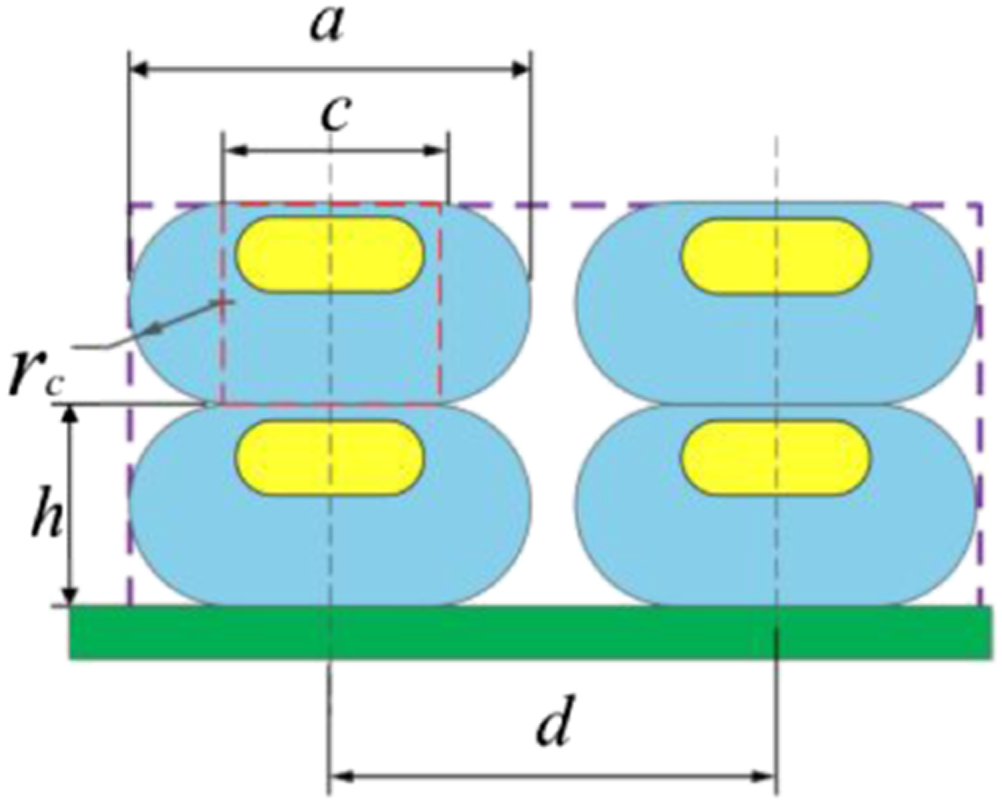
The pore diagram of composite material was as shown in Figure 13. Schematic diagram of pore structure of 0° fiber orientation.
In the above equation, S is the sum of the cross section areas of the printed composite filament, assuming that the internal pores of the printed composite filament were ignored.
According to the forming of continuous fiber additive manufacturing composites with 0° fiber orientation, it was found that the fiber orientation forming had two kinds of structures, for example, no gap between raster and gap between raster. The schematic diagram of pore structure was shown in Figure 13. If equation (2) was satisfied, the adjacent raster overlapped, so the extrusion width was equal to the printing spacing, as shown in Figure 10(a)
As shown in Figure 13, 

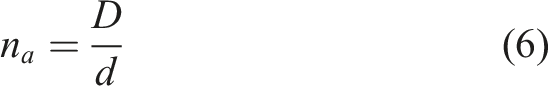
AF continuous fiber additive manufacturing composites with 0° fiber orientation was composed of multiple grids and layers. As shown in Figures 10(a) and (b), the formula of cross section area of formed components was established


In the equation (8), 
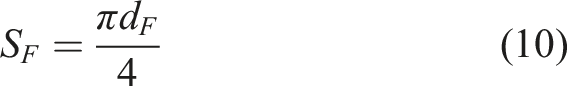
In the equation (10), 
Micro-CT measurement of composite porosity
The images of porosity relative to the resin matrix were captured and AF had high gray level, and the porosity of composite was calculated by ImageJ. The pixel values of porosity in the image were adjusted to appropriate thresholds by ImageJ software, while the porosity was the pixel values of pore to the total pixels of the image. Figure 14 shows the pore analysis of CT scan images by ImageJ software. According to ImageJ measurement and calculation, the porosity was ∼12.06%. Pore analysis of CT scan image by ImageJ software: (a) The pore of CT scan images, (b) The pore analysis picture by ImageJ software.
According to the porosity model of continuous fiber additive manufacturing, the porosity of two-layer and three-layer composite component was calculated theoretically. The printing process parameters were as follows: the printing spacing was 1.2 mm, the printing layer thickness was 0.66 mm, the diameter of composite filament was 0.94 mm, and the diameter of printing nozzle was 1.5 mm, and the printing spacing was smaller than the diameter of printing nozzle. Multi-channel and multi-layer unidirectional composite forming was considered. According to equation (11), the porosity was calculated as 11.80%. Compared with the measured value of CT test, the absolute error was 0.26% and the relative error was 2.16%. During the measurement process, the unimpregnated pores in the fiber were completely identified, and some of the pores were caused by the air in the environment not being discharged in time during the printing process. Therefore, the porosity measured in practice was greater than that calculated in theory. The error between theoretical value and measured value was small, so the porosity calculation mathematical model was effective.
Study on interlayer shear performance and porosity
Orthogonal experimental design table.

The ILSS of factor 3 level experiment.

It could be seen from the table that in the experimental group of selected process parameters and Settings, when the printing speed was 8 mm/s, the printing layer thickness was 0.66 mm and the printing spacing was 1.2 mm, the ILSS of the sample was the best, which was 14.55 MPa. At the printing speed of 8 mm/s, printing layer thickness of 0.85 mm, printing spacing of 1.6 mm, the shear strength of the sample was the worst, only 6.11 MPa. The range and variance analysis of the experimental results were carried out to determine the optimal technological parameters of the AF reinforced PLA additive manufacturing composites. According to the orthogonal analysis, the order of the range values of the three different influencing factors was as follows: printing layer thickness (B) > printing spacing (C) > printing speed (A). It was shown that the change of printing layer thickness had the greatest influence on the interlayer shear strength, followed by the printing spacing, and the printing speed had the least influence on the ILSS. The effect curves of each parameter on ILSS were shown in Figure 15. Effect curves of process parameters and ILSS.
Porosity of factor 3 level experiment.


Effect curve of process parameters and porosity.
By comparing the porosity results shown in Table 4 with the ILSS results shown in Table 6, it could be seen that under the same printing spacing condition, the ILSS and the porosity increases with the increase of printing layer thickness. With the increase of printing spacing, interlayer shear strength decreases and porosity increases under the same printing layer thickness. When the maximum ILSS was 14.55 MPa, the porosity was 14.15%, and when the minimum ILSS was 6.11 MPa, the porosity was 48.96%. It could be seen that the ILSS was inversely correlated with the porosity, which was consistent with Figure 17. With the increase of porosity, the ILSS gradually decreased. But the porosity of experiment 6 was smaller than that of Group 2, 5, and 7, because its printing layer thickness was the largest among the four groups, while its interlayer performance was the lowest. Relationship between ILSS and porosity in orthogonal experiment.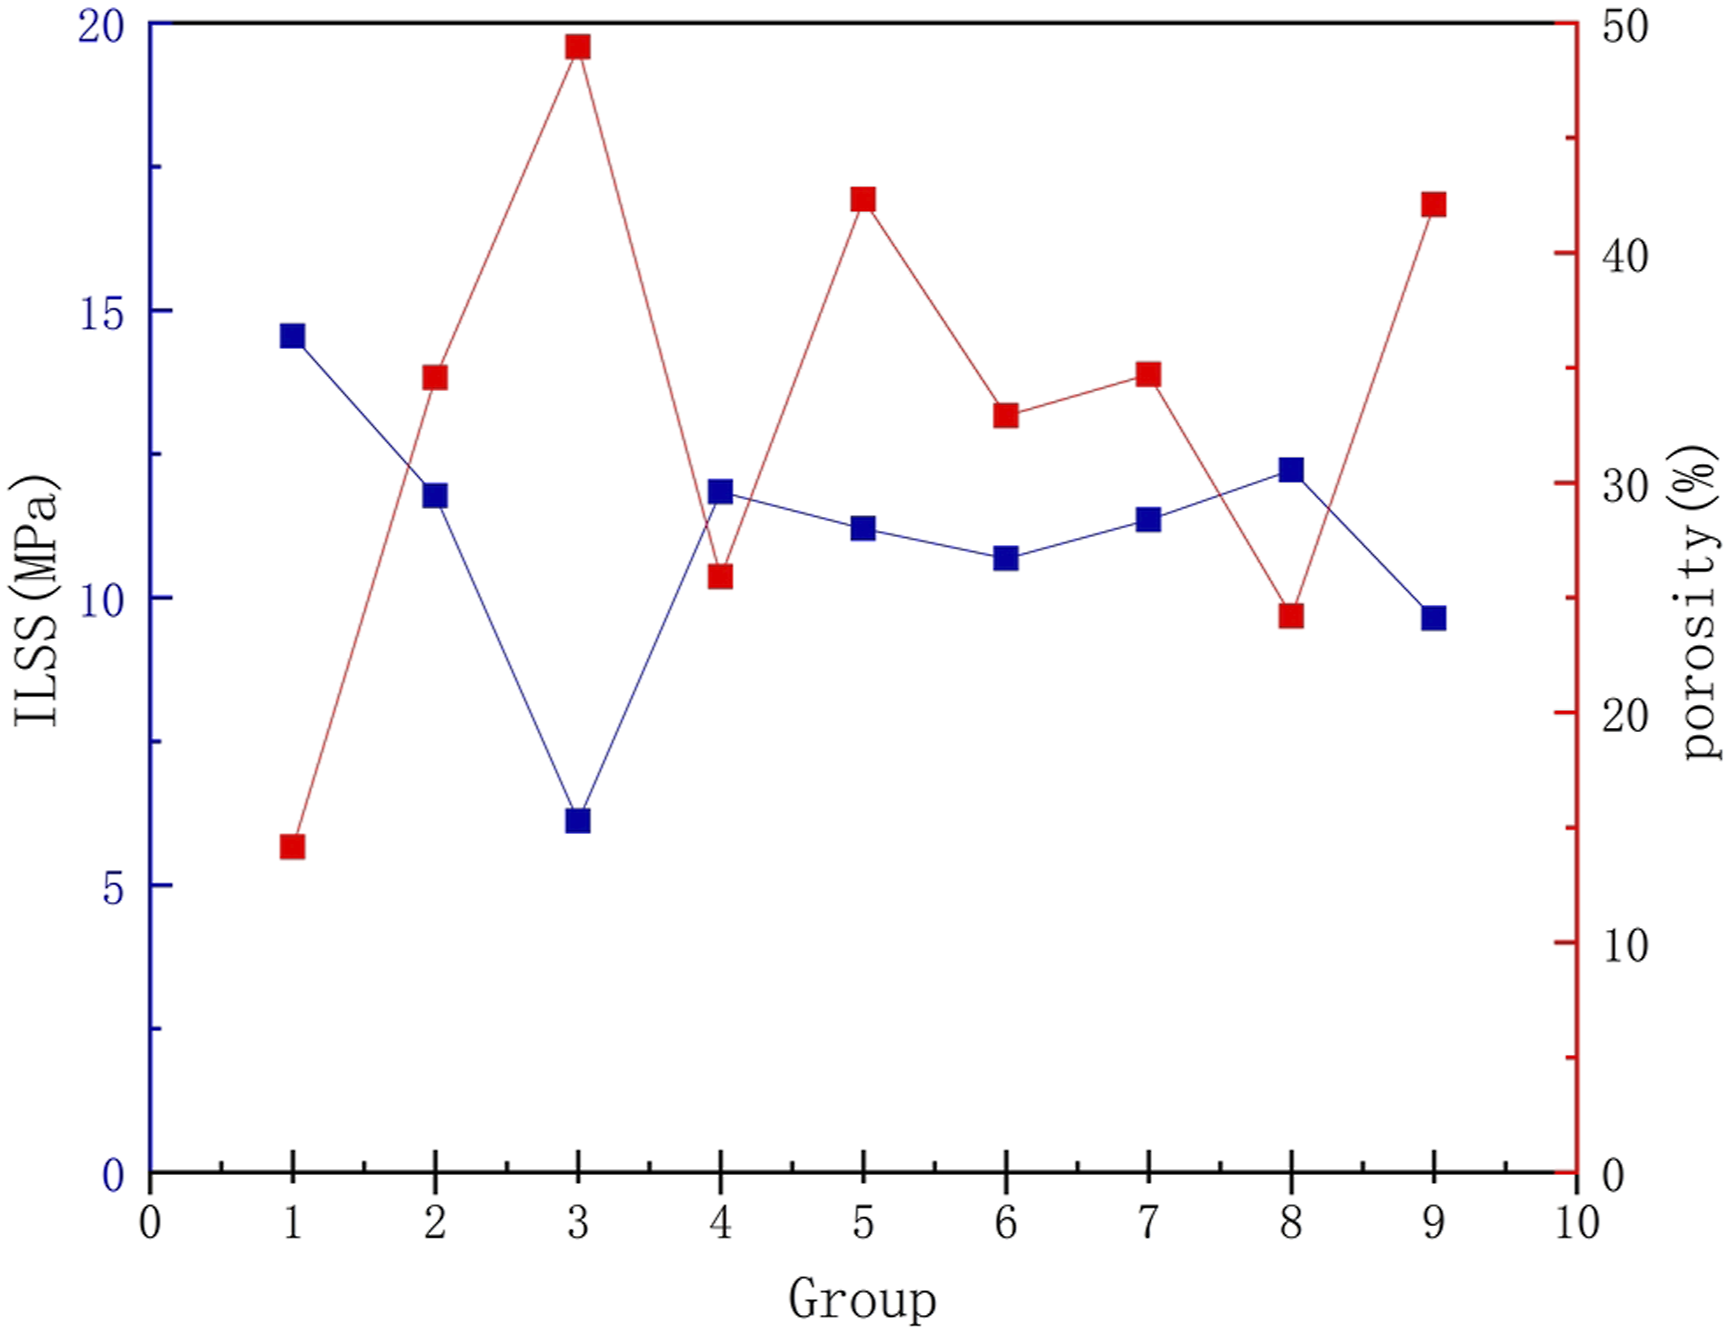
Through the numerical analysis of ILSS and porosity of printing layer thickness and printing spacing, it was found that interlayer shear performance decreases and porosity increases with the increase of printing spacing under the same thickness condition. With the increase of printing layer thickness, the interlayer performance decreases and porosity increases. For the above two parameters, when one parameter was fixed, interlayer shear performance was inversely correlated with printing spacing, the porosity was positively correlated with it, and interlayer shear performance was inversely correlated with porosity. As shown in Figure 15, the relationship between porosity and ILSS in sixth group was different from that in other groups. Above all, the ILSS decrease with the porosity of AF reinforced thermoplastic composites increasing. But the ILSS of composite members with larger thickness was lower when the porosity of was similar.
Conclusion
In this paper, the porosity of continuous fiber reinforced thermoplastic composite filament forming and continuous fiber reinforced composite material forming was studied. The results were described as follows. • The internal porosity of the composite filament was greatly reduced by the optimized process. The porosity of the composite filament was about 2.27% by Micro-CT scanning technology and ImageJ image processing technology. The porosity decreased by about 80%, which laid a foundation for the forming of continuous fiber composites. • The porosity calculation model of continuous fiber reinforced composites was established. The validity of the porosity calculation model was verified by Micro-CT scanning technology and ImageJ image processing technology. The error between the porosity calculation model and the absolute error was 0.26%. • The effect of process parameters on ILSS and porosity of composites was studied by orthogonal experiment, and the relationship between interlaminar shear properties and porosity was studied. The ILSS was inversely correlated with porosity under the same printing layer thickness or printing spacing. When the printing layer thickness and the same printing spacing change, the ILSS was greatly affected by the printing layer thickness, while the porosity was affected by the variation of process parameters.
In the paper, Micro-CT calculation and ImageJ software were used to calculate and compare the porosity of composite filament before and after the optimized process. The porosity of composite filament could be greatly reduced after the optimized process, and the porosity of composite filament was about 2.27%. According to the relationship between interlaminar shear performance and porosity, a variety of compaction methods could be used to reduce the porosity of composites and improve the ILSS, and the porosity calculation model in this paper was also applicable. The composite filament forming process could be used for the preparation of AF reinforced thermoplastic composite materials, such as PA, ABS, PEEK, and so on. It laid a foundation for further study on the properties of continuous fiber reinforced composites. Based on this study, the porosity calculation models of structural composites with 0°/90° fiber orientation and three directions orthogonal fiber orientation could be developed.
Footnotes
Author contributions
Ailing Zou: Methodology, Validation, Formal analysis, Writing original draft. Zhongde Shan: Conceptualization, Resources, Writing review & editing, Funding acquisition. Shaozong Wang: Project administration, Funding acquisition. Xiaojun Liu: Data curation. Xueya Ma: Data curation. Dongming Zou: Visualization. Xibin Jiang: Validation.
Declaration of conflicting interests
The author(s) declared no potential conflicts of interest with respect to the research, authorship, and/or publication of this article.
Funding
This research work was financially supported by the National Defense Science and technology foundation strengthening plan, the Strategic Research and Consulting Project of Chinese Academy of Engineering (2021-XZ-26), and the Technology Development Fund of China Academy of Machinery.