
Abstract
This paper presents experimental study on the response of a sustainable structure 3.65 x3.05x3.35 m, made with confined hollow concrete block masonry (CHCBM). The model was tested under quasi-static cyclic test to assess the response against seismic load and to determine the potential vulnerability. Based on test data, envelope curves and bilinear idealized curves were drawn according to both Magenes–Calvi and Elnashai methods. Different performance levels i.e. Immediate Occupancy (IO), Life Safety (LS) and Collapse Prevention (CP) were evaluated based on both methods. Damage pattern and force-deformation behavior of CHCBM building was compared with models of the similar configuration and loading conditions. Similarly values of Response modification factor (R), Displacement Ductility (µD) and Displacement amplification factor (Cd) were calculated and compared with the previously tested models and it confirmed that CHCBM building was ductile and structurally integrated under earthquake loading.
Keywords
Introduction
Masonry is the oldest technique known to mankind for constructing shelters/houses. 1 During its lifetime, it can be exposed to further solicitations caused by accidental, environmental, and seismic activities. 2 Masonry has wide range of variety which involving different material and different construction methods. Due to good compressive strength unreinforced masonry can bear gravity loads very well but due to smaller/negligible tensile strength, it is very weak against lateral/seismic loading. 3 A typical mortar-joint may have tensile strength in the range of 1/30th of its compressive strength; therefore, its tensile strength is considered negligible for design purpose. 4 In moderate to high seismicity regions, the extreme events such as earthquakes, considered as the main hazard to masonry, usually produce joint actions of tension-compression, flexure and shear in-and out-of-plane, which often leads to catastrophic failure. 5 The engineering community has always tried to extend the understanding of the masonry response subjected to lateral loadings and aspects leading its strength.6–11 Recently, in 2017 Lesvos earthquake happened at a seismically alive region of the Aegean. The Aegean tectonic microplate is confined by the Hellenic Trench in the south along with the western augmentation of the North Anatolian Fault in the north. 12 Three major faults have been documented in the Lesvos Island, 12 and the 2017 Lesvos earthquake burst the eastern part of the that fault. 13 Further details of the seismological features of the event can be found in.12–17 The earthquake resulted in one fatality and 15 casualties. Harsh damage was done to the built environment, whereas all plagued inhabitants were moved to provisional housing. During the building inspection process, 3426 buildings were inspected, amid which 937 were found as directly uninhabitable, 319 were marked as “unsafe for use,” and 867 as “temporary usage is not permitted.” About the environmental effects, slope movements were stimulated in some areas;14,18 whereas a non-destructive tsunami of about 0.35 m was observed at the Plomari port. 19 The damage induced by the earthquake caught the attention of the engineering community. 17
Similarly, Pakistan also lies in the active tectonic Himalayan orogenic belt, come into being as a result of collision of Eurasian, Indian and Arabian tectonic plates, roughly 30–40 million years (Ma) ago. This northern region of Pakistan is considered one of the world’s most earthquake prone region. 20 From the past earthquake data, it is evident that northern areas and Quetta region have been hit by devastating earthquakes. During 31 May 1935, Quetta earthquake, more than 60,000 people were killed and the city of Quetta was almost leveled to ground. Hunza Earthquake of 1974 claimed 5,300 lives, 17,000 injured and rendered 73,000 homeless. 21 Kashmir Earthquake of October 8, 2005 was the deadliest earthquake in the history of Pakistan during which 73.000 people were killed, 8000 wounded and about 350,000 become homeless. More than 400,000 houses were completely or partially damaged. 22 This region has been repeatedly subjected to moderate magnitude earthquake up to a range of Mw 5.5, but this Himalaya region has the potential of producing earthquakes of magnitude eight or above once or twice every 100 years.23–26 After the earthquake of 2005, it has been fully realized that unreinforced masonry structures cannot sustain the seismic forces effectively.27–28 Therefore, efforts have been made either to modify the existing masonry techniques for strengthening the unreinforced masonry structures against the seismic forces or to discover new methods of construction used worldwide in areas of prone to high seismicity, which are equally economical as well as practicable. 3, 29
After 2005 Kashmir earthquake, extensive work has been carried out at earthquake engineering center of UET Peshawar on various masonry models for ascertaining its seismic capacities. In this connection numerous full-scale single-story models of size 13’x10’x11’ were constructed and tested under quasi-static cyclic test. The first model constructed with unreinforced unconfined brick masonry (URBM). 26 in 2011 and tested for seismic capacity. Crack formation and failure pattern was thoroughly observed and different performance levels were determined. In 2014, another research study was undertaken 30 on an identical model structure constructed with confined brick masonry (CBM) and it was observed that the seismic capacity enhanced approximately 100% due to confinements. In 2016, again a research study on a full-scale model constructed with unconfined solid concrete block masonry (USCBM) 31 having similar dimensions was tested, with the same boundary conditions and its seismic capacity, different performance levels, crack pattern and failure modes were observed.
Hollow concrete block masonry has got significance attention due to its unique properties and has become ultimate choice to designers and engineers and its use in masonry construction is constantly increasing due to the various advantages like thermal insulation, sound insulation, adequate strength and structural stability, high durability, good resistance against fire, economical, require low maintenance and appealing architectural look. 32
As the use of hollow concrete block masonry is increasing day by day in Pakistan, but the society has lack of information and experience regarding this type of masonry, therefore, a research study was direly needed to study basic requirement of hollow concrete masonry and to determine its seismic performance and compare the resultant data with the previous data so that the society may be guided to use suitable masonry amongst the economically available options for constructing masonry structures/houses. The construction details of typical hollow concrete block masonry construction are presented in Figure 1. Details of typical hollow concrete block masonry.
To estimate the seismic performance of masonry, various kinds of laboratory tests, viz., monotonic, cyclic quasi-static, pseudo-dynamic, and shake table tests have been mentioned in the published literature. While the dynamic test replicates the actual situations noted in an earthquake, the cyclic quasi-static test is the most widely used33–36 as it provides the opportunity to quantity the forces and displacements and to track crack pattern during the test. 37 Therefore, cyclic quasi-static test was opted in this paper.
Experimental programme
Mechanical properties of the hollow concrete block masonry used in the model.

A typical single-story model room of 366 cm x 305 cm, according to available working space in earthquake center of UET Peshawar, identical to model buildings previously tested26,30–31 in the research studies for seismic capacity assessment of unconfined brick masonry (UBM), confined brick masonry (CBM) and unconfined solid concrete block masonry (USCBM) buildings. Boundary conditions of the model building were so arranged that replicated an internal room of a building. The sizes of openings and aspect ratios of each pier were also kept similar to the previous buildings so that comparison of the result data could be made. The openings and the aspect ratios of individual pier of the model were so provided to produce in-plane and out-of-plane effects in the model. The Eastern wall of the model building was kept solid (without any opening and the load was applied perpendicular to the model via that solid wall so as to avoid any complexity in the analysis of the force transformation through the model. In the Western out-of-plane wall a window was provided for studying the flange effects in the model as shown in the Figure 2. Details of the model building (a) Plan, (b) Elevation and (c) sectional details.
A 760 mm wide and 150 mm thick reinforced concrete pad was provided under the walls of the model building which was rigidly fastened to the strong floor of the lab, through 25 mm dia. Nut bolts provided in a staggered manner. The walls of the model building were constructed with 400 mm x 200 mm x 200 mm hollow concrete masonry units in stretcher bond, as commonly used in concrete block masonry construction. At all the four corners and door jambs, 12 mm bars were erected in foundation mate for providing 200 mm x 150 mm vertical RCC confining elements. Similarly, at selected position as shown in Figure 2, one 12 mm bar was also anchored in the strip footing at selected positions for partial reinforcing and grouting in the concrete masonry hollow cells. Cleanouts were provided at the bottom of cells to be grouted, for cleaning the cells before grouting. At the door and windows openings, 200 mm x 150 mm RCC confinement, fabricated with 12 mm rebar with 6 mm ties @ 150 mm c/c was provided. After construction of walls up to window sill level, the selected cells were grouted. Similarly, at lintel level, an Construction phases of model building.
Quasi-static test
For full scale model, the testing facility available at earthquake center of UET Peshawar, could be quasi-static test. Displacement-controlled method was applied to the model building with a very slow rates and structural performance of the model structures was studied, from the rate of cracks propagation, order of collapse, corresponding levels of damage, etc. Each displacement cycle was repeated three times.
Experimental set up and test procedure
The potential loading capacity of the loading assembly was approximately 222.5 KN which was more than the estimated strength of the model building. 12 linearly variable displacement transducer (LVDT) were fixed to the model building for recording the displacements as shown in Figure 4. LVDT #1 was fixed at center of the slab which served as control gauge. LVDT # 2 and 3 were meant to measure the torsional rotation in the model building, LVDTs # 6 through 10 were used to measure the in-plane displacement at top level of piers 1 through 5, respectively. LVDTs #11 and 12 were dedicated to measure the possible global rocking of the structure. All the LVDTs were mounted to stiff steel reference frames and connected to the respective components with flexible wires. The testing was conducted with Static data acquisition system UCAM-70, with a maximum data scanning speed of 20 channels per second. Experimental Test set up (a) Load Application Mechanism and (b) Model Building, and (c) instrumentation details.
Displacement was applied to the model at roof level. The displacements were gradually increased and each cycle was repeated three times in both positive and negative directions. The model building was vigilantly checked, cracks were marked and photographs were taken during and after each cycle. The test was discontinued when the peak load was decreased more than 20%, with increased displacement.
Crack pattern
The quasi-static test, performed on model building was according to displacement-controlled environment and kept the lateral load value as variable. The test was started from a control lateral displacement of 0.25 mm and was ended with a lateral displacement of 40 mm when the strength of the model structure degraded more than 0.8Vu.
Up to fifth displacement cycle of 1.5 mm (story drift of 0.04%) which took a lateral load of 142.34 KN, no crack was observed in the model structure.
At displacement cycle of 2.0 mm (story drift of 0.060%) with applied load of 151.23 KN, hair cracks in some bed joints of in-plane piers #1 and #2 were observed but no cracks were noticed in other walls, piers etc.
At a displacement cycle of 4 mm (story drift of 0.12%) with applied load of 173.45 KN, stepped diagonal shear cracks appeared in pier #1 and #2 whereas fine hair cracks in some bed joints of piers # 3 and # 5 were also noticed. No cracks were noticed in other walls, piers etc.
At a displacement cycle of 6 mm (story drift of 0.18%) with applied load of 179.80 KN, the existing diagonal (shear) cracks, in pier #1 and #2, propagated further and got wide, hair cracks appeared around most of head and bed joints and along the joint of confining elements between concrete and masonry. A stepped diagonal crack appeared in pier # 3, whereas hair cracks appeared along the bed joints of pier # 4 and 5 Figure 5(a)). Crack Pattern after story drift of (a) 0.18%, (b) 0.42%, (c) 0.60%, (d) 0.90%, and (e) 1.19%, At displacement cycle of 34 mm (story drift of 1.015%) with applied load of 186.80 KN, the cracks in Western Confining Columns at lintel level of Piers # 2 #3 become deeper and widened.
At displacement cycle of 14 mm (story drift of 0.42%) with applied load of 191.25 KN, the existing cracks of head and bed joints of piers #1, #2, #3, #4 and #5 of the in-plane walls, got wide due to crushing of mortar and propagated further, no changes were observed in out-of-plane walls. The cracks pattern at this displacement cycle is shown in Figure 5(b).
At displacement cycle of 20 mm (story drift of 0.60%) with applied load of 198 KN, the western confining columns of piers # 2 and # 3 got cracked. Diagonal crack in pier #1 propagated up to eastern toe of pier #1 passing through the CMU as shown in Figure 5(c). Similarly, the existing cracks in all the piers got wide due to crushing and crumbling the head and bed mortar-joints.
At displacement cycle of 26 mm (story drift of 0.78%) with applied load of 200 KN, the Eastern confining column of piers # 2 got cracked at lintel level and the diagonal cracks in pier #2 propagated up to base slab. Similarly, the existing cracks in all the piers got wide due to crushing and crumbling the head and bed joints.
At displacement cycle of 30 mm (story drift of 0.90%) with applied load of 202 KN, the confining at jambs of windows of pier #4 got cracked both at top and bottom levels and the western confining columns of pier #2 and pier #3, cracked at lintel level (Figure 5(d)). Similarly, the existing cracks in all the piers got wide due to crushing and crumbling the head and bed joints.
During displacement cycles from 34 mm to 40 mm the crack pattern remained almost the same but its depths and widths increased and the mortar of head and bed joints of piers #1 and #2 almost completely crushed and crumbled. No significant cracks were observed in the out-of-plane walls and in-plane spandrels. The test was disconnected after displacement cycle of 40 mm (Story drift of 1.19%) as the strength degraded more than 20% (Figure 5(e)). The damages after final loading cycle are presented in Figure 6. Final crack pattern of (a) pier 01, (b) pier 02, (c) pier 03, (d) pier 04 and (e) pier 05.
Force-deformation behavior
Due to varying openings in different walls and different aspect ratios of various piers, results different stiffness of the building in different directions, therefore, the force-deformation behavior of the building both in positive and negative directions is not the same. For the sake of simplicity, an average curve is drawn to obtain average typical behavior of the structure using the method of superposition. For the model building under consideration an average force-deformation curve between average lateral load and corresponding drift ratio has been drawn as shown in Figure 7. Similarly hysteresis loops have been drawn between positive and negative lateral loads and corresponding lateral story drift as shown in Figure 8. The load in western direction and its corresponding displacement in terms of drift ratios have been taken positive and lateral loads and corresponding displacements in Eastern direction as negative. Force-deformation hysteresis response of full scaled CBCBM model building. Back-bone curves of CHCBM model.
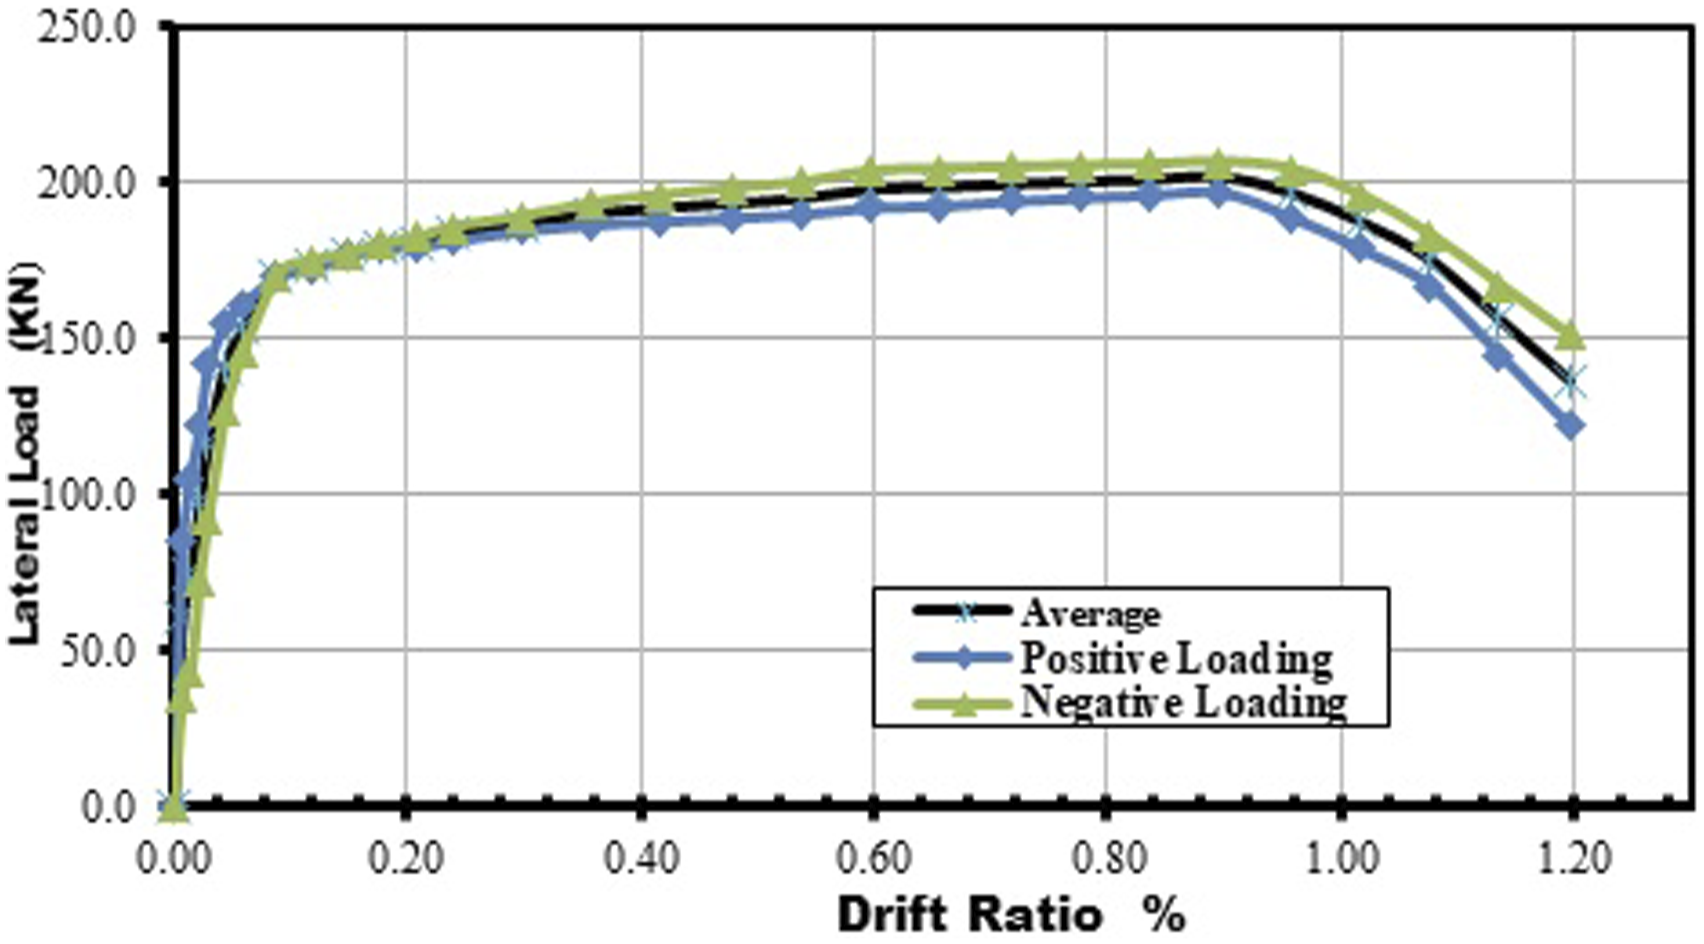
The average envelope curve, illustrates that model structure offered stiff resistance against deformation up to the story drift of 0.12%, with average lateral load of 133.5 kN and corresponding lateral displacement of 4 mm and beyond that the stiffness gradually decreased with increase in displacement. The model building resisted an average peak lateral load of 202 KN for a lateral displacement of 30 mm (story drift of 0.90%). Beyond lateral displacement of 30 mm, gradual degradation of the structure started and at 40 mm lateral displacement (story drift of 1.19%), the model structure took a lateral load of 136.55 KN which is less than 80% of the peak lateral load; therefore, the test was disconnected.
Hysteretic damping
The variation of hysteretic damping expressed as equivalent viscous damping with corresponding story drift, is shown in Figure 9. Equivalent viscous damping is calculated as the ratio of dissipated energy (Ediss.) and input energy (Einp.) in accordance with equation (1). Equivalent viscous damping of CHCBM model building.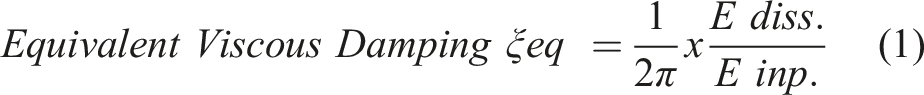
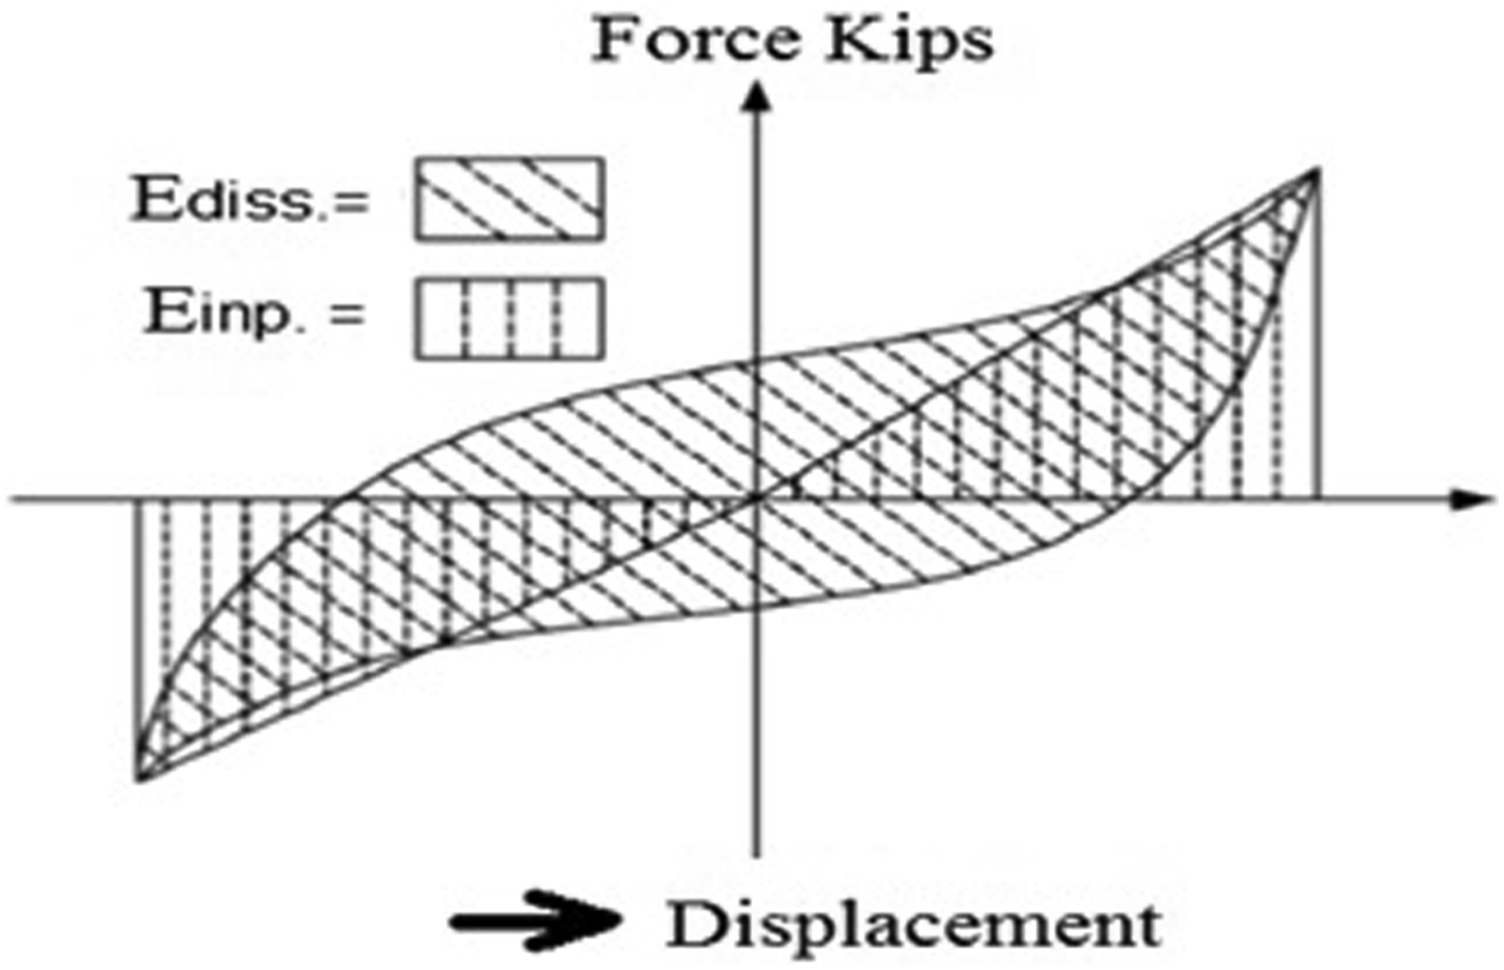
The dissipated energy Ediss. Is equal to the enclosed area by a hysteresis loop and is directly related to the crack formation and vibration control in the structure. The total input energy Einp. May be calculated as shown in Figure 10. Calculation of equivalent viscous damping ratio (EVDR).
The CHCBM building, due to reinforcement and grouting in hollow cells and RCC confining elements, exhibited higher damping, starting from 16.3% at drift ratio of 0.022% and decreased to 8.01% at story drift of 0.179%. The viscous damping remained fairly constant with damping ration of about 7% up to a story drift ratio of 1.194%. This shows that the vibration control in elastic phase was almost double than the plastic stage. However, the damping value in plastic state is 8.01% which is much higher than the recommended value of 5% used in the response spectrum analysis.
Performance levels of confined hollow concrete block masonry structure
The average force-deformation curve was idealized as a bilinear curve for the model building and using Magenes–Calvi 97
40
procedure based on equal energy principal, elasto-plastic curve for the model building was developed. According to Magense and Calvi, the ultimate strength of the structure Vu is 90% of the maximum strength of the envelope curve (equation (2)).
Effective stiffness Keff is the secant stiffness at 0.75 Vu. The ratio of the ultimate strength Vu to the effective stiffness is taken yield displacement (equation (3)).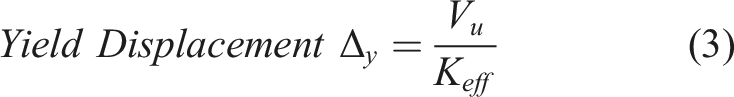
Ultimate displacement ∆u is the displacement corresponding to point of 0.80Vu on the envelope curve after peak value Vmax and displacement ductility µD of the structure is calculated as the ratio between ultimate displacement ∆u and yield displacement ∆y (equation (4)).


From the bilinear curve of the full scale CHCBM model building shown in Figure 11, the values of ultimate displacement ∆u and yield displacement ∆y is worked to be 1.167 and 0.055 respectively, therefore, displacement ductility µD = 21.22, the response modification factor, R and displacement amplification factor, Cd is calculated (using equation (5) and (6) as 6.44 and 3.30 respectively. The performance levels obtained are given in Table 2. Building Performance Levels and bilinear curve 40. Building performance levels.

Elnashai performance levels of confined hollow concrete block masonry structures
Elnashai-2008
41
expressed different performance levels of a building in terms of strength, stiffness and ductility. He attributed various levels of performance to the intensity of earthquake. According to Elnashai, if an earthquake of small intensity hit a structure at may impart little damages to the structure but will not make it functionless and will serve its purpose but if the same structure is subjected to earthquake of moderate intensity the building may likely receive damages to the extent that sufficient repair may be required to make it functional. He also related the magnitude of damages with the economy of the structure i.e. lesser the extent of damages less will be the cost of repair and vice versa. According to Elnashai, Immediate occupancy (I.O) limit state as the displacement (drift) at which the first crack appears in the structure, Life Safety (L.S) is the drift corresponding to the peak shear strength and Collapse prevention (C.P) level is the drift corresponding to the point of 0.85% of peak strength value on the capacity curve after peak value. Figure 12 below depicts the three limit states of the Confined Concrete Hollow Block Masonry (CCHBM) model building. Different performance levels obtained are mentioned in Table 2. Performance levels of CHCBM model building 41.
Comparison with identical models of different masonries tested
For comparison of the seismic capacity of different types of masonry models, the backbone curves drawn on the basis of test data,26,30-31 having the same architectural details constructed with Unreinforced unconfined brick masonry, unreinforced unconfined solid concrete block masonry, unreinforced confined brick masonry and partially reinforced-confined-hollow-concrete-block masonry. Figure 13 below shows the backbone curves of the identical model structures constructed with different types masonry for comparison.26,30-31 Graphical comparison of performance levels of different masonry models tested in UET Peshawar.
Conclusions and recommendations
By comparing the data, it is evident that partially reinforced-confined-hollow-concrete-block masonry is more robust and ductile against earthquake induced vibrations because of the confining elements, reinforcement and grouting in hollow cells holds the entire model to act as single mass unit and to control the earthquake induced vibrations.
The following conclusions are made on the basis of just one full-scale tested structure with given dimensions and boundary conditions. Seismic performance of hollow concrete block masonry increases due to the confinement effect along with grouting the hollow cells. The lateral load capacity reached up to 200 kN with a story drift ratio of 1.167%. The experimental results indicated that the collapse prevention level was reached at a drift ratio of 1.2% or lesser. Which leads to the conclusion that such building only performs well in small and moderate earthquakes. Masonry piers are most susceptible to damages due to lateral forces. The out-of-plane walls experience little to no damage however, the piers of in-plane walls were cracked specially the piers of northern wall experienced severe cracking. Hollow concrete block masonry should be provided with RCC confinement in addition to appropriate partial reinforcement and grouting in hollow cells of CMU. The Hollow Concrete Block Masonry partially reinforced and grouted allow distribution of cracks around the CMU in the entire surface of in-plane piers, which avoid concentration of damages due to flexure and shear, resultantly the structure can survive larger displacement/deformation without much strength degradation. As piers received more damages than squat spandrels, therefore, in areas prone to high seismic activities, the piers should be given special attention and it may be additionally strengthened by full grouting and reinforcing in the hollow cells of CMU. As toothing in hollow concrete masonry cannot be provided, connectors or horizontal reinforcement should be provided to bond masonry with confining columns that will ensure flange effect with out-of-plane walls. It will also hold the CMU of in-plane walls/piers during earthquake when the head and bed joint-mortar crushes/crumbles and CMU tends to get thrown away of the wall, resultantly the middle part of in-plane walls/piers will be prevented from disintegration and strength and energy dissipation capacity of the masonry will be fully utilized which will enhance the seismic capacity of the masonry.
Footnotes
Acknowledgment
The authors are grateful to Pak Dream Private Limited for their logistic support in conducting the experimental investigation.
Declaration of conflicting interests
The author(s) declared no potential conflicts of interest with respect to the research, authorship, and/or publication of this article.
Funding
The author(s) received no financial support for the research, authorship, and/or publication of this article.