
Abstract
This article puts forward the concept of “digital food apartheid” to articulate differentiation in terms of one’s agency concerning their food that is mediated by, reified through, or materialized from data or digital infrastructure given the omnipresence of racial capitalism. We examine the digitization of public food assistance in the United States in conversation with Black digital geographies, food geographies, and critical GIS, paying particular attention to the US Department of Agriculture’s COVID-19-era Online Grocery Purchase Program (OPP), which gives Supplemental Nutrition Assistance Program (SNAP) participants access to online grocery shopping and delivery. We call into question the conditions of possibility that gave rise to this program through a historicization of US food assistance. Empirically, we map the “Amazon Fresh” grocery delivery area around Seattle overlaid with SNAP participants and census tracts designated as “low income and low food access” by the US Department of Agriculture (USDA) to visualize the program’s current operationalization. Our critical GIS approach allows us to analyze our empirics in relation to the rhetorical and political moves of the state to demonstrate how digital food apartheid determines which foods are marketed to, available to, and accessible to whom.
Introduction
Our exploration bridges scholarship from Black, digital, and food geographies with critical geographic information systems (GIS) to examine the Online Grocery Purchase Program (OPP) launched by US Department of Agriculture (USDA) during the first wave of the COVID-19 pandemic. The OPP gives Supplemental Nutrition Assistance Program (SNAP) participants access to online grocery shopping and delivery from select grocers through Electronic Benefits Transfer (EBT). We begin by historicizing the US food assistance policy, paying special attention to its technological transformations over the past few decades. After laying this groundwork, we justify our decision to focus specifically on Amazon. We then outline key theoretical frameworks that situate the food stamp program within the broader context of racial capitalism. Specifically, Black Geographies scholarship gives us language to describe the convergence of food apartheid and digital geographies as “digital food apartheid.” Following this, we review critical GIS literature and discuss its role in how we approach our empirics. To organize our empirics, we apply an existing framework to digital food apartheid that conceptualizes digital geographies as “by, through, and of” the digital (Ash et al., 2018). The empirics open discussion concerning where and which people get what food, why certain foods are marketed to whom, and how digital maps are both a tool that enables us to visualize digital food apartheid and operate as spatial data that underwrite neoliberal forms of intervention concerning food access, especially timely given Amazon’s public pledge to reduce food deserts through delivery. Finally, we draw conclusions with ramifications across disciplines about the role that digital food apartheid plays in allowing us to better understand and counter uneven geographies of food produced by the digital, especially in the context of the OPP but also within food policy more broadly.
Given that EBT was racialized long before digitization–materially through intergenerational wealth accumulation by dispossession tied to the legacy of slavery in the United States (i.e. Jim Crow laws, redlining policies) that ultimately determines who is food insecure in the first place, and rhetorically—though interrelatedly—through campaigns like the War on Drugs and the War on Poverty—this article argues that (1) Amazon and other food retailers with similar capacities perpetuate digital food apartheid and (2) that gaining a richer understanding of how the OPP has unfolded thus far, both materially and discursively, is necessary to develop policy interventions that counter emergent racialized inequalities in food assistance related to the digital domain.
Paper or plastic? A brief history of food stamps and EBT
The first food stamp program was enacted by the Roosevelt administration in 1939 as part of the New Deal with the goal of pulling the United States out of the Great Depression. Originally, the food stamp program provided color-coded stamps which limited the types of foods one could obtain and dictated where one obtained that food. People had to buy into the program: orange stamps were purchased dollar-for-dollar and could be used to purchase eligible food from eligible retailers. Upon purchasing orange stamps, blue stamps valued at 50% of the orange stamps were given to the purchaser. However, blue stamps could only be used to buy surplus food, a designation determined by the government through the Agricultural Adjustment Act, which allowed the program to channel surplus commodities from farms to “the poor,” but not all of “the poor.” Key to understanding this context is to remember that this era was defined by segregation and explicit racism. On top of this, relief programs—including food—were administered by local governments, an obvious issue considering that the South was still segregated. By and large, food relief was intended for the “worthy white widow”; the majority of poor and working-class Black women saw little change (Hancock, 2004). Most “people of color . . . were deliberately excluded” (Gilmore, 2002: 18).
The story of why food assistance is administered by the USDA in the first place is worth noting: in an attempt to prevent a plummet in the price of pork, the Roosevelt administration slaughtered millions of piglets, faced public outcry at waste amid widespread hunger, and responded by quickly creating a program to transfer “surplus” food to the unemployed. Beginning in the 1940s, this system gave rise to supermarkets as places where commodities could be shipped and stored, and where food stamps could be redeemed (Poppendieck, 1986). This is an early example of how the logistics embedded in food assistance policy dictate where and from which vendors’ food could be obtained, foreshadowing the decades to come. Small stall operators, door-to-door vendors, and those running temporary stands—the “hucksters”—were left out of this arrangement (Reese, 2019).
The program ended alongside the country’s recovery from the Great Depression and reemerged in the 1960s as part of the legislation enacted in the name of the War on Poverty. This time around, the pilot food stamp program still required a partial buy-in component but eliminated the concept of special stamps for surplus foods. After 3 years of piloting the program in 22 states, the Food Stamp Act was signed in 1964, making the program permanent. The next couple of decades were marked by building out program criteria, including those stipulated by the 1996 Welfare Reform Act: more severe penalties for violating the rules of the program, substantial budget cutbacks, and the particulars related to states’ involvement in the program, all with consequences that we will soon discuss.
Around the same time, and spurred in part by the Financial Services Modernization Act of 1999, paper food stamps began their conversion to a debit-style card. This digitization had several consequences: it created a new revenue stream for the banking sector (Orr, 1997), it—at least initially—excluded grocers who lacked or lagged in terms of the capacity to implement the corresponding infrastructure (Klee, 2008), and it increased the surveillance power of the state (Oliveira and Levedahl, 1998: 36). In terms of the new revenue stream, the American Bankers Association (ABA) journal, described the implementation of this system as turning the “handling of food stamps from a tedious chore outside the bank’s normal workflow into an automated fee generator” (Orr, 1997: 80). The promise of billions for onboarding “the unbanked” evangelically spread (Orr, 1997).
By 2004, all states had digitized their food stamps program, which forced EBT shoppers into grocery stores that were set up to accept a digitized form of payment, another example of how food policy can disperse and concentrate capital: grocers who accepted credit and debit cards had an edge in terms of transitioning to EBT since the hardware is the same, but others who were unable or unwilling to implement the point-of-sale system, lost out. Programs like the Farmers Market Technology Improvement Pilot Program reveal the types of grocers who needed assistance or incentivization to implement this new system (i.e. farmers markets). Grocery store operators’ reluctance to rely on financial technology (or “fintech”) to handle grocery transactions continues to be a valid concern; implementation challenges and system failures are perennial with the EBT system (Bryan, 2012; Underwood, 2013). As recently as the 2022 White House Conference on Hunger, Nutrition, and Health, the issue of increasing EBT program participation among small grocers in Washington State is identified as a priority.
The 2014 Farm Bill included a provision for the USDA to pilot the OPP, creating the capacity for SNAP participants to purchase groceries online. Before this, EBT, while equipped for a brick-and-mortar, debit card-style transaction still did not allow for “click and mortar” grocery shopping because of the PIN requirement. Here is how it worked: Point-of-sale terminals owned by banks must verify card and PIN combinations before authorizing the transaction and transmitting the information via the Automated Clearing House system. 1 The PIN required the customer to physically be in the store where the point-of-sale terminal was located, with no exceptions. The reason for the PIN requirement in the first place is worth noting. EBT benefit card holders are ineligible for the same protections as debit and credit card holders due to a piece of legislation called Regulation E. One particularly important difference is that if EBT funds are lost or stolen, they are not replaced. When EBT originally converted from food stamps to debit-style cards, law-makers fought against Regulation E protections insisting that benefits would be dishonestly reported as lost or stolen and were unsure whether replacing benefits would then become the state’s responsibility. In sum, those with EBT cards are perversely excluded from a federal law that protects against fraud because of the assumption that they are more likely themselves to commit fraud. 2
In 2017, the Food and Nutrition Service (FNS) announced the eight firms chosen to pilot the program: Amazon, Dash’s Market, Fresh Direct, Hy-Vee, Inc., Safeway, ShopRite, Walmart Stores Inc., and Wright’s Markets, Inc. (USDA Office of Communications, 2017). 3 In response to the COVID pandemic in 2020, the USDA and FNS expedited the OPP’s rollout which began with seven of the eight firms listed earlier. 4 Over the first year of the program, the amount received by these firms for online grocery EBT redemptions was nearly one billion dollars or 1% of SNAP’s total budget. 5 The share going to these seven firms grew between 2020 and 2021 such that online EBT redemption surpassed the share realized by small, medium, and large grocery stores (United States Department of Agriculture Food and Nutrition Service (USDA FNS), 2021).
The infrastructure and security requirements stemming from Regulation E precipitated the dominance of Internet retail giants from the outset. Though smaller grocers have since come on board, they had little chance to become first adopters given the requisite technology and security requirements. The application for OPP retailers, first posted in 2016, corresponds to a 124-page guide outlining the specific criteria, including capacities to “detect trafficking,” quite a process for, say, a family-operated grocery store. To become a selected grocer, the company must be “experienced,” have an e-commerce platform that separates eligible EBT items from noneligible items, and employ an online version of a PIN solution. As of May 2023, there is only one company that provides the approved PIN solution: FISERVE/Paysecure, a private company with 1.4 billion accounts on file globally that processes 12,000 financial transactions per second (FISERVE, 2023).
Over the very same decades in which food assistance programs—and those who accessed them—came under intense fiduciary scrutiny, billions of public dollars facilitated the implementation of digital systems that continue to funnel money to the companies that own and operate them. When the USDA press release announced the shift to EBT, it focused on cost savings rather than the financial frontiers through which fintech partners stood to profit and the bedfellow of this cost savings was the increased capacity for state surveillance. One way this surveillance operates is through an electronic audit trail which serves as “a deterrent to potential traffickers” and as “a tool for successful prosecution” (Oliveira and Levedahl, 1998: 36). Trafficking, in this context, is the exchange or sale of EBT benefits. While the most extreme cases are the very ones that make the headlines, trafficking can include acts like exchanging EBT benefits for diapers. Prior to the shift to an electronic audit trail (via plastic card), a person paying for groceries with physical food stamps would receive coins as a change since the smallest denomination of a food stamp was equivalent to one dollar. Small changes could add up and be used—legally—for diapers or gas money or pet food. This small degree of flexibility materialized in significant ways in peoples’ everyday lives. However, the electronic audit system changed this and states found themselves better equipped to cut their welfare costs through benefit disqualifications, sanctions, and prosecution of welfare fraud violations. A briefing on state policy choices since welfare reform found that “policies restricting cash assistance—such as shorter time limits, more severe sanctions, and family caps—are also more common among states that have a high percentage of African Americans on the caseload” (Weaver and Gais, 2002: 6). Along the same lines, Schram et al. (2009) concluded that Black welfare participants were more likely than white participants to be punished for welfare-related “non-compliance.” We examine the policies and particularities of this evolution from paper to plastic in conversation with Black Geographies scholarship in the subsequent section.
Theoretical frameworks
Racial capitalism and the surveillance of blackness
One framework that is necessary to understand the conditions of possibility for the emergence of a welfare state in the first place is racial capitalism (Penniman, 2018; Robinson, 1983). Capitalism requires inequality; a parsing of resources and value, of capital and labor, such that privilege and poverty not only coexist but are coconstitutive, coproductive, and codependent (Lawson and Elwood, 2018). Enter racialization, the process of othering, a sort of sorting that is both paradigmatically and practically required to uphold capitalism (Robinson, 1983). Gilmore et al. (2022: 451) wrote that while “capitalism requires inequality, racism enshrines it” and described this as the “fatal power-difference couplings” that push “disproportionate costs of participating in an increasingly monetized and profit-driven world onto those who . . . cannot reach the variable levers of power that might relieve them of those costs” (Gilmore, 2002: 16).
Present-day constructions of and policies around poverty and welfare, then, are saddled with a legacy that is both already racialized and criminalized. Operationally, this perversely explains the (il)logic that presumes EBT cardholders guilty of fraud and thereby necessarily excluded from protections that those who are deemed worthy of credit are afforded through Regulation E. Rhetorically, we see proof of racialized criminalization in the creation of the welfare queen trope. To better situate the scope of our work, here we treat blackness as “a spatially and temporally differentiated produced, and real, condition of existence and category of analysis” (Gilmore, 2002: 22). Beginning in the 1970s, the “War on Drugs” rhetoric permeated public consciousness and a suite of policies were put into place that particularly harm communities of color (Lynch, 2012). The War on Drugs rhetoric also catalyzed the study of “black ghettos” as objects of inquiry within academe (Jefferson, 2020). Theories on “black disorganization” did the work of upholding racialized forms of governance, which the media substantiated. Between 1988 and 1994, 65% of network television news stories about welfare featured African Americans (Gilens, 1999). The welfare queen trope tunnels easily into the national psyche because she so perfectly aligns with “black disorganization” theories as a Black woman whose amoral behaviors should be watched out for, should be punished (Collins, 1990; Finney, 2014; Hancock, 2004). Browne (2015) describes how already extant “racism and antiblackness undergird and sustain the intersecting surveillances of our present order” (p. 9). She traces practices of policing black life to show that the surveillance of blackness is not new.
Nonetheless, there are newer forms, and the intersectional nature of Black Geographic thought (Collins, 2019; Crenshaw, 1991) identifies carceral aspects of surveillance and digitality (Benjamin, 2019; Browne, 2015; Jefferson, 2020) and aspects that certainly pertain to the OPP. We situate the digitized infrastructure of food assistance in the United States as an “extension of the carceral apparatus,” incentivized by racialized surveillance and prosecution (Jefferson, 2020: 18). One example comes into sharp relief when we return to the subject of EBT fraud detection. The USDA cannot estimate a recipient fraud rate because they do not have jurisdiction in terms of how states compile, track, and report fraud (Aussenberg, 2018). This lack of standardization is both why a national recipient fraud rate does not exist and grants autonomy for states to do their own surveillance, giving rise to fraud hotlines and online portals through which anyone can report suspected welfare fraud. Washington State’s strategies for fraud identification include crowdsourced reporting, and also the mining of social media accounts by law and agency officials. While unpacking fraud detection mechanisms helps underscore the various scales of surveillance at work in the digitized infrastructure of food assistance, it also prompts related questions, like who, exactly, is suspected of fraud? 6 The answer to this question is inextricably connected to the formation of “preexisting beliefs about women who exist at the intersection of marginalized race, class, and gender identities” (Hancock, 2004: 2). Hancock, who interrogates coded language circulating in political, academic, and media realms argues that “controlling images” of women (Collins, 1990) which can be traced to the slavery era in the United States—like the “Jezebel” who chooses personal pleasure over care for her children—always have and continue to inform present-day welfare policy. “The portrayal of bad mothers emanating from slavery became a part of the assumptions undergirding the implementation of New Deal programs, as the state sought to regulate maternal behavior” (Hancock, 2004: 26–26). One example of how this has extended forward is the Personal Responsibility Act of 1996—the moment when employment became a requisite for receiving food stamp benefits. In this way, the work requirements embedded in modern-day welfare policy stem from tropes of black laziness which were intended to justify the enslavement (and the corresponding surveillance) of Black bodies (Gilens, 1999). The material realities of surveilling poverty, which to a large degree are discursively associated with blackness, are both structural and decentralized, embedded in systems of oppression and intimacy, but at whatever scale and in whatever form, antiblackness has particular ramifications for Black people. In addition, these ramifications ripple to many others, particularly those who are in a poverty relation, like the 42 million people—nearly half of whom are white—who currently rely on the SNAP program. 7 As Williams and Freshour (2022) remind us, the practices and implications of carceral geographies—including those embedded in our food systems—extend beyond Black and Brown people. Returning to Gilmore (2006) here, racial capitalism is the reality that group differentiation for the purpose of exploitation marks people who are part of said group not only as surveilled and punishable but also vulnerable to premature death.
Racialized dispossession and the digital
The poverty relation is produced and circulated through practices of racialized dispossession (Lawson et al., 2023: 1983). This happens in ways that are directly material, like taking land from people (Coulthard, 2014; Holt-Giménez, 2017; Lappé et al., 2015), and in ways that are invisibilized through layers of presumably neutral and not directly material actions. Such is the case with data dispossession. While land dispossession funnels the landless into a system of capital production as laborers; data dispossession separates us from our data which is then “fed back to us. . .to produce specific actions, to sell specific commodities” (Gregg, 2015). Both are processes that demonstrate how colonialism serves capitalism (Couldry and Mejias, 2019: 4). Data dispossession is characterized not only by the incorporation of data into capitalism but also by the lack of control one can exert over their own data. This has been described as an “asymmetric relation” (Kitchin et al., 2018; Thatcher and Dalton, 2022 [2021]). These asymmetries have life-altering material implications. For example, risk assessment algorithms are used by judges to recommend an incarcerated person’s release date (Alexander, 2010) and Microsoft’s Pedestrian Route Production, “safely” guides walkers through some neighborhoods while stigmatizing others (Thatcher, 2013). Directly related to our focus, and yet to be sufficiently examined, are mechanisms like targeted online food marketing, which we describe in the section Food Apartheid of the Digital.
One implication related to data dispossession is “technological redlining”—the power of digital decisions made by algorithms to reinforce oppressive social relationships and enact new modes of racial profiling (Noble, 2018). Tracing this concept back, “digital redlining” first emerged in the late 90s as speculation that data collected on us by way of the (then) future Internet may be used to both sell us things or deny us things, from jobs to housing (Bartow, 2000). Sure enough, this speculation on what was then termed “cyber-indicia” —digital information on a person’s race, gender, or income—became a reality, a decision-making metric for those who could access this data. This digitization was brought about by the aforementioned Modernization Act which ironically overhauled the Depression-era banking landscape. In other words, the landscape in which the original redlining practices pervaded was transformed to give banks unprecedented access to personal information (Clausing, 1999) giving rise to technological red-lining. Housing is a particularly strong example that highlights this throughline in time between the analog and the digital and their co-constitution in terms of space: neighborhoods segregated by the FHA and banks by way of color-coded paper and ink zoning maps that determined who gets a home loan and who does not often became neighborhoods where people of color are more likely to pay higher interest rates based on metrics predicated on racialized data, like credit scores and interest rates (Noble, 2018). This is what Noble terms “digital data discrimination” and the growing propensity of the United States to embrace this type of decision-making means that more people find themselves–often without knowledge or consent–in the “digital poorhouse” (Eubanks, 2018). Data, even when speculative, are relied upon to calculate deservedness, vulnerability, and distribution of public resources, including food (Eubanks, 2018). One fundamental problem is that “the cultural authority of digital technology is still claimed by the fields that design the platforms and protocols on which we work” (Drucker, 2013 [2012]: 85). If this is true, then Amazon is both emblematic of the privatization of public assistance provision and infuses its values into the very operation of the program. We argue that the convergence of big data, the OPP, and this privatization produces new forms of technological red-lining in the domain of food. We term this apparatus digital food apartheid.
Digital food apartheid
“Food apartheid” first used by activist LaDonna Redmond and the organization Food First, is argued as more apt than “food desert” because it implores us to both acknowledge structural racism and disrupt the spatial fixity and deficit-centered thinking associated with the term (Bradley and Galt, 2014; Brones, 2018; Joyner et al., 2022; Reese, 2019; Sbicca, 2012; Widener, 2018). Food apartheid captures the reality that food injustices are rooted in social, political, and economic failures. . .all of which are racialized and none of which are new. Reckoning with these baked-in structures is necessary to create a world with any semblance of food justice. The food apartheid concept is deployed by farmers/activists, like Karen Washington and Leah Penniman, and is gaining favor in food banks (Greater Pittsburgh Community Food Bank, 2021) and advocacy organizations, like the National Resource Defense Council (Turrentine, 2023).
Inarguably, some scholars have found the food desert framework useful but by and large, these geographies have been overdetermined by flattened notions of space (miles between residence and supermarket). This strictly cartesian geographical lens is even less useful now, given that the OPP has increased grocery delivery coverage in many areas (Foster et al., 2022). Now is the time to ask questions that go beyond access, questions like, why a dearth of grocery stores in some places in the first place? And, from what other avenues do people obtain their food?
Though the term food apartheid is not unequivocally favored over “food desert” in academic circles, some geographers have sought to complicate analyses of food landscapes through engagement with critical mapping (De Master and Daniels, 2019; Shannon, 2014; Shannon et al., 2021). One example is measuring the distance to grocery stores through public transit travel time rather than cartesian distance, which disrupts the idea that points in space (grocery stores) are always equally accessible (Jung and Anderson, 2017). Another example considers hours of operation as a factor in food access (Chen and Clark, 2016). In this way, geographers and those engaged with mapping praxis have played an important role in framing the conversation as we discuss in the next section.
Critical GIS and geovisualization
As with the aforementioned mapping examples, visual representations are critical in understanding and revealing the geographic dimensions of social relations. However, researchers have also called into question the ontological, epistemological, and methodological positions and limits of traditional forms of GIS and geographic visualization through feminist, queer, and nonnormative analyses that push against strictly positivist approaches (Brown and Knopp, 2008; Elwood et al., 2011; Harvey, 2005; Kwan, 2002; Mark, 1999; Pavlovskaya, 2018; Pickles, 1995; Schuurman, 1999). The past three decades have seen tremendous growth in efforts to understand the roles of GIS and geovisualization, the theory behind in both research and everyday life (e.g. critical cartography, socially-relevant GIS, and critical data studies), and mapping and visualization practices that draw connections between local community-based, participatory, and policy work (e.g. participatory GIS, radical-counter-feminist-indigenous mapping/GIS). These diverse evolutions of critical GIS have extended the discussions and conceptualization of GIS as they relate to social, political, and cultural practices and as a way of knowledge production. Exploratory approaches that highlight complicated situated meanings and lived experiences allow us to reveal deeper insights embedded in data. In keeping with earlier discussions and practices in critical GIS, the work on which we particularly focus is explicitly engaging with transformative theories and politics from Black digital geography as well as critical food studies, following Jefferson’s (2020) insistence that “a thorough critique of racialized governance must confront its sociotechnical dimension” (p. 3).
Critical GIS and geovisualization provide a unique opportunity for us to continue the tradition of GIS and mapping as an innovative methodology to analyze data, database, and spatial analyses related to spatial practices but also as the result of critical inquiry and reflexivity attuned to the broader social, political, and digital processes that influence areas or issues being mapped. Critical GIS emerges in the praxis of engaging GIS as an always-interconnected set of technical and social practices, mindful of both the possibilities and limits of GIS (Elwood and Wilson, 2017; Lally, 2022). Our goal is to demonstrate a certain kind of “processual” and relational approach to GIS and geovisualization that opens new ways of understanding and mapping relational digital food geographies in both physical urban and digital space by exploring fluid, multiscalar processes, which combine critical GIS practices with accompanying geovisual artifacts to reflect/represent theory directly in the form of visualization. This approach is different from simply “mapping” critical data and issues in and of itself. Instead, it seeks to embed, situate, and understand data as one part of a larger discussion with social and spatial theories and to socially engage with, in, and through mapping and geovisualization—using maps and visuals as part of the process of producing new knowledge while also using theory to speak back to the possibilities and limits of visualization and mapping themselves and in doing so confront racial capitalist logics. One example is the White-Collar Crime Risk Zone Map (Clifton et al., 2017). Reappropriating often racially biased predictive policing machine learning algorithms overwhelmingly targeting traditional street crimes committed, the White-Collar Crime Early Warning System (WCCEWS) maps the predicted density of white-collar criminal activity and a generalized white-collar criminal subject. 8
These multiepistemological and ontological “processual” approaches of making, engaging, and representing spatial knowledge and complexity constantly opens up new ways of seeing and revealing relational geographies in space (Edney, 2019; Kitchin et al., 2013), which might be considered as one of the multiple valences of “extraordinary politics” with/of critical GIS (Elwood, 2022). Our intention is to demonstrate a deliberate, reflexive, and processual approach to critically engage mapping and geovisualization—that addresses how critical mapping and visualization practices might be used to draw connections between digital food geographies, public food policy and assistance, and social/spatial inequality on the one hand, and larger structural processes and relational dynamics on the other. In the following section, we operationalize these methods to provide empirical examples of digital food apartheid. The word “apartheid” originates from Afrikaans and means “separate.” Digital food apartheid describes the separating apparatus that exists under racial capitalism between people in terms of one’s agency concerning their food that is mediated by, reified through, or materialized from data or digital infrastructure. We ground our understanding of critical GIS and geovisualization and justify our employment of these methods as ways to catalyze broader questions of digital food apartheid as related to the OPP in the subsequent section.
Mapping digital food apartheid
We have found it useful to think through the consequences and conditions of possibility that give rise to digital food apartheid using a categorical framework conceptualizing digital geographies as produced “by,” “through,” and “of” (Ash et al., 2018). Adopting a categorical structure, though we advocate for the conceptualization of these categories as interrelated, allows us to better articulate the shapes that digital food apartheid can take, as we will further discuss.
Food apartheid by the digital
Critical GIS approaches point out how capitalistic and algorithmically generated digitality can control and constitute new forms of digitally mediated injustices, marginalization, and oppression through technological redlining, a form of digital data discrimination that Safiya Noble (2018) argues is directly linked to the distribution of goods and services in society. We argue that the simple reality that Amazon determines which foods can be delivered to which areas is a form of technological redlining. In the specific context of food, this can be understood as food apartheid by the digital.
One of the first seven firms to join the OPP pilot, Amazon quickly became an approved grocer in 48 states plus the District of Columbia (USDA FNS, 2022). While more than 90 retailers were approved nationwide for this program as of February 2022 (Foster et al., 2022), Amazon, A & J Market, and Walmart were the only approved grocers in Washington State during the first year of this program (2020–2021). 9 A & J Market has just one location in a small town in Washington State. Remarkably, A & J Market partnered with a senior services organization and was able to deliver fresh produce purchased with EBT to seniors within their town throughout the pandemic. 10 Walmart, on the other hand, was mercurial over this period with the roll-out of their “Express” grocery delivery program pilot in April 2020, which drew criticism concerning its significant delivery fees and their subsequent pivot to “Walmart Plus” in September of 2020. For these reasons, we chose to focus on Amazon’s delivery area with respect to the OPP. In addition, Amazon’s existing dominance in the Internet retail market and their demonstrated push for dominance in both the “click and mortar” and “brick and mortar” grocery retail markets, as evidenced by their early efforts at grocery delivery through Amazon Fresh, Amazon Go, Prime Now, and most recently, their acquisition of Whole Foods Market, serve to justify our interest in their specific practices and policies.
Figure 1 depicts a simple, descriptive map of the “Amazon Fresh” delivery area in and around Seattle along with concentrations of SNAP participants derived from 2020 data. While Amazon will ship shelf-stable food virtually anywhere, home delivery of perishable food in all of Washington State for those using EBT was only available within this delivery area, Amazon’s “Fresh City” boundaries. We ascertained this coverage by entering the 172 zip codes associated with the Seattle-Tacoma-Bellevue Metropolitan Statistical Area in November, 2021 (the Amazon Fresh website landing page allows users to type in their zip code to see whether “Fresh Delivery” is available). The blue areas depict the 87 zip codes in which Amazon Fresh delivery is available. 11 Figure 1 reveals that “Amazon Fresh” boundaries do not follow the City of Seattle boundary (outlined in black), nor the larger King, Pierce, and Snohomish County boundaries. We see that this area extends into Snohomish County but does extend into Pierce County. A mapping project that we encountered during our research demonstrates that Amazon’s fulfillment centers correspond to wealthier metro areas. 12 “Amazon happens to sell products, but they are a data company,” a former Amazon executive reports (Burgess, 2021). This data sorting materially spatializes through Amazon’s decisions about where to locate various physical structures, like fulfillment centers and Amazon Fresh stores. Though the particulars of Amazon’s decision-making methods surrounding where to locate are proprietary, Amazon’s Vice President of North American Operations stated that, “There are several factors we consider when deciding on where to place a new fulfillment center. Most importantly, we look to see where we can improve Prime benefits with faster shipping speeds for customers” (Business Wire, 2017). Purchase history, inventory, logistics, and other quantitative bits and bytes make their way through our devices to servers and networks, are aggregated and analyzed, and result in decisions that result in physical geographies. Indeed, the Amazon Fresh boundaries depicted in Figure 1 adhere to the correlation found by Good Jobs First and align with the company’s stated priorities: the per capita income of Pierce County, where there was no delivery coverage, is $39,036 while that of King County, where there is nearly full coverage is $59,843. 13 This profit-driven approach—indeed exactly how corporations are expected to operate in the context of racial capitalism—reifies rather than remedies inequalities in terms of which people have access to which foods.
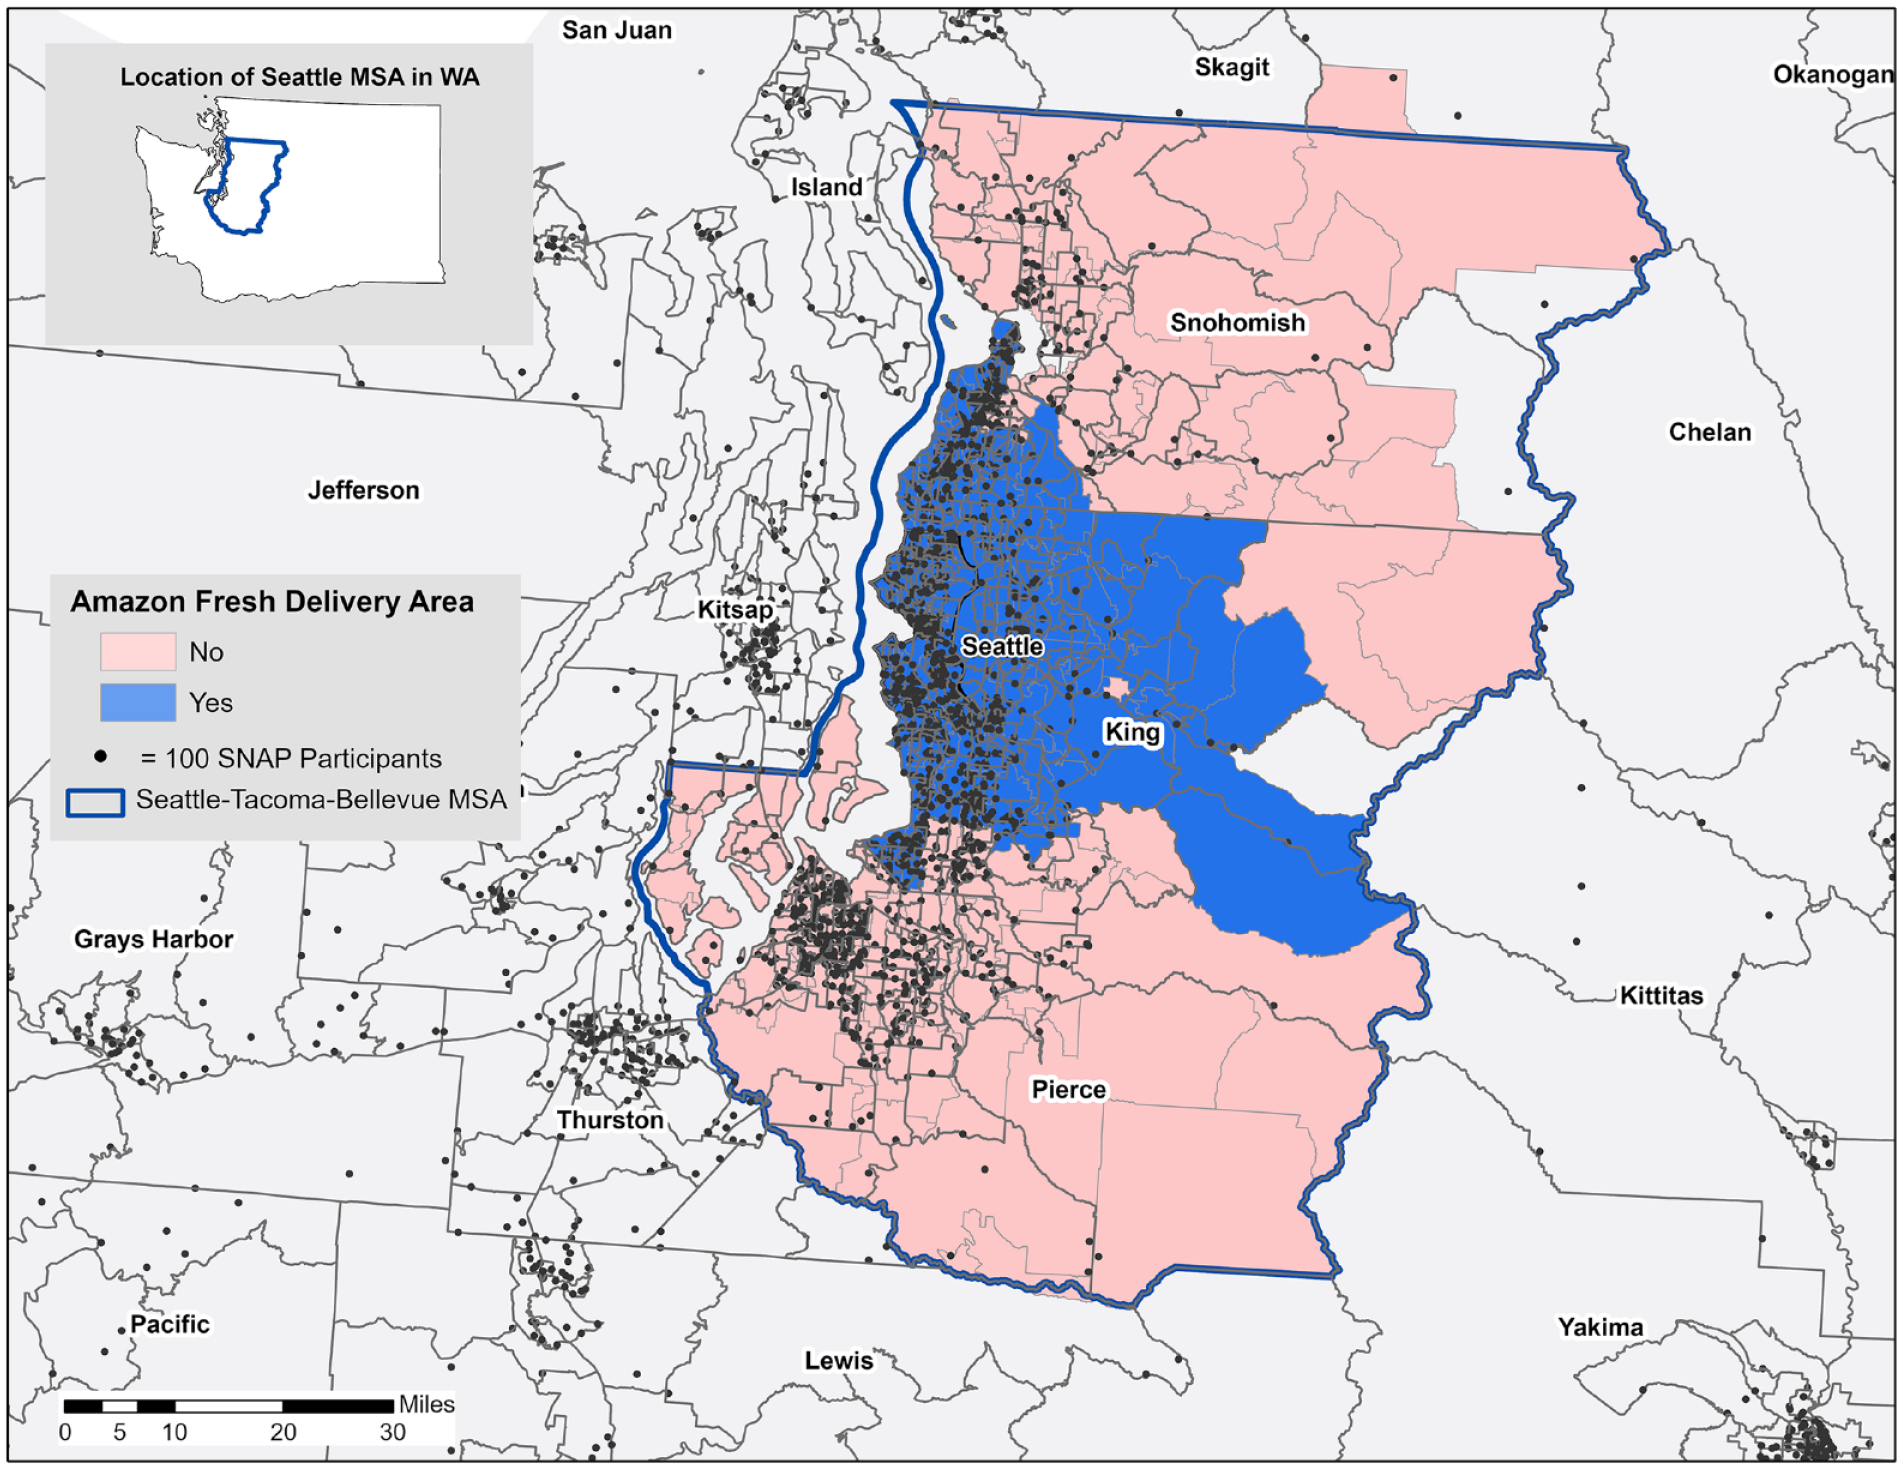
Map of Seattle’s “Amazon Fresh City” delivery area and SNAP participants.
In addition, the dominant conceptualization of data-driven decision-making as neutral perpetuates the narrative of deracinated dispossession (McElroy and Werth, 2019; Roy, 2017) and ignores the ways in which the United States is built upon and steeped in racial capitalism. Though Amazon’s decision-makers state that they do not factor race into their decision-making processes, historic red-lining and present-day gentrification embed in zip codes (Rothstein, 2018; Shabazz, 2015; Wilson, 1987) and influence flows of capital that determine who and what is where. As Noble and Roberts (2019) write, “the maintenance of power and control is done under the cover of technologically-mediated neutrality” (p. 1). One manifestation of food apartheid by the digital, then, is the differentiation in terms of availability and access to fresh food at the retail level due to the creation of grocery delivery area boundaries that are defined by grocery giants, informed by ongoing and historic flows of capital, and determined by data.
Food apartheid through the digital
Geographies through “the digital” are those which produce “geographic knowledge and enact knowledge politics” (Ash et al., 2018: 3). The example we offer begins with the USDAs interactive “Food Desert Locator,” launched in 2011 (the name has since been changed to the Food Access Research Atlas or FARA). The atlas provides a “spatial overview of low-income neighborhoods with high concentrations of people who are far from a grocery store,” by depicting low-income and low food access, or LILA, tracts (United States Department of Agriculture Economic Research Service (USDA ERS), 2021). LILA tracts are defined as a low-income tract with at least 500 people, or 33% of the population, living more than 1 mile (urban areas) or more than 10 miles (rural areas) from the nearest supermarket, supercenter, or large grocery store.
14
A low-income census tract is any tract where the tract’s poverty rate is twenty percent or greater; or the tract’s median family income is less than or equal to eighty percent of the State-wide median family income; or the tract is in a metropolitan area and has a median family income less than or equal to eighty percent of the metropolitan area’s median family income. (USDA ERS, 2021)
FARA is implicated in food apartheid through the digital in that—especially before its name change from The Food Desert Locator—it helped to legitimize and perpetuate the food desert framework which has served as a basis for both implementing food policy and assessing its efficacy. Relating this to the OPP, a press release about Amazon’s OPP involvement states that “Amazon believes the program will dramatically increase access to food for more remote customers and help to mitigate the public health crisis of food deserts” (Bose, 2019). Building off of our critical interpretation of Figure 1, we map Seattle’s “Fresh City” delivery area with data derived from FARA and offer a critical interpretation.
Though Amazon was approved as a vendor in most states at the onset of the OPP, fresh produce delivery was limited to 19 cities, Seattle being the only one of these cities within Washington State. 15 In Figure 2, we used the 1-mile distance measure for urban tracts (>2500) and the 10-mile distance measure for rural tracts (USDA ERS, 2021). Spatial boundary definitions present a challenge because data from municipal-, regional-, and state-level policy makers, as well as private entities, like Amazon, are all associated with different geographic units. Zip codes are the spatial units we used to map Amazon Fresh boundaries, while LILA units are census tracts, so to interpret coverage areas, we used a spatial analysis tool that determines how many of these areas intersect. We are aware that the choice of spatial size and the shape of the measurement input determines the output, known as the Mapping Areal Unit Problem (MAUP), and the assumption that a statistical relationship observed at one aggregated level—in our case, census tract-level aggregation of LILA data—affects this analysis since the same relationship observed at a different level of granularity may not be necessarily true, known as the Ecological Fallacy issue.
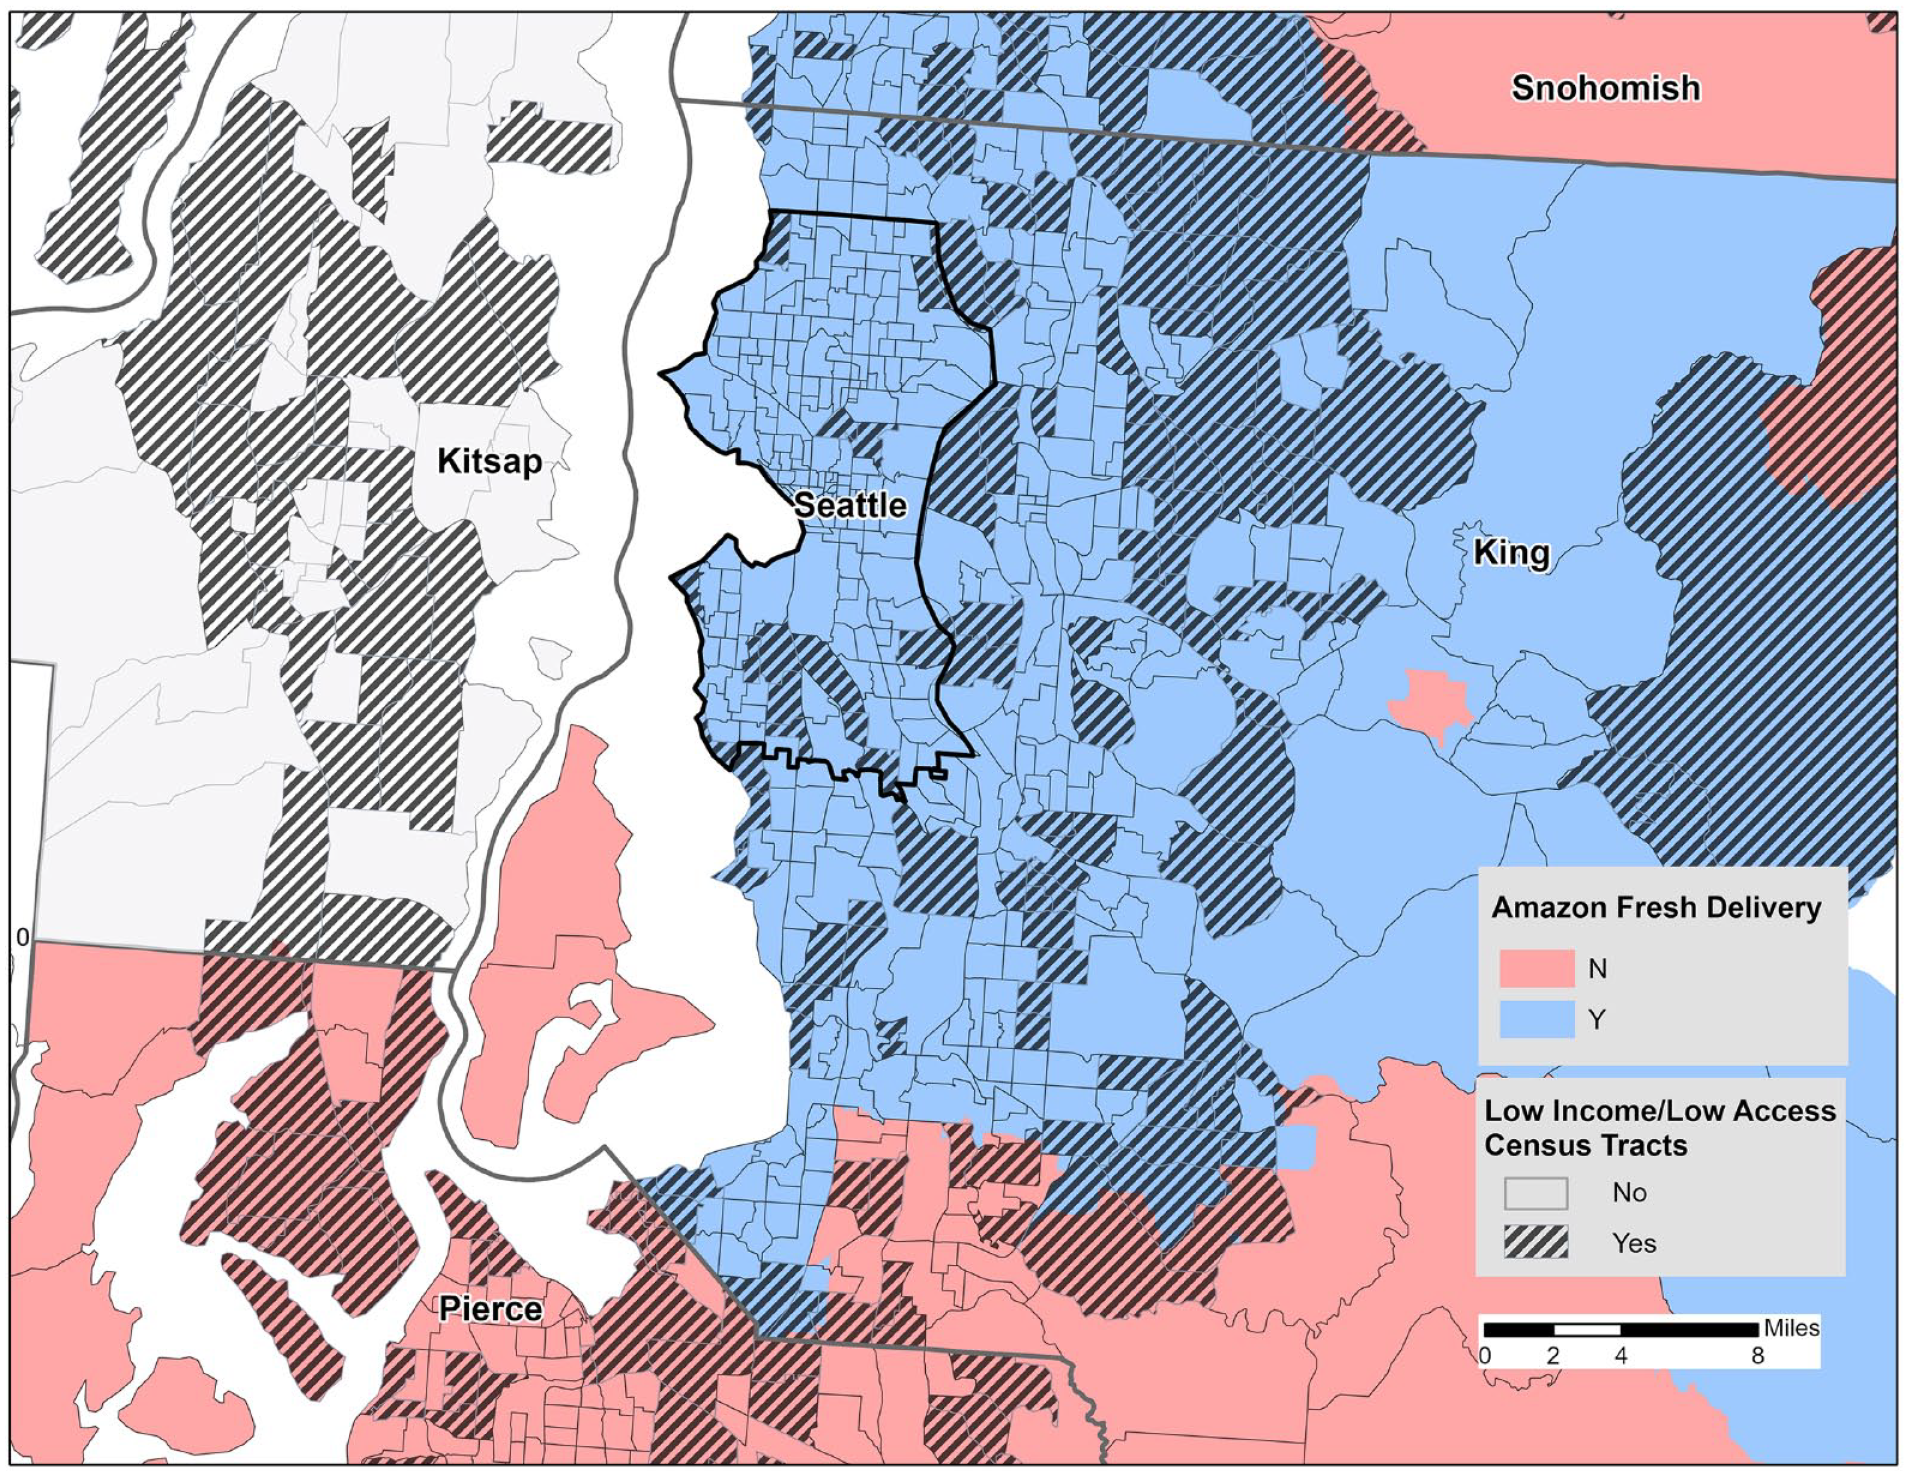
Map of Seattle area’s “Amazon Fresh City” delivery area overlaid with Low-Income Low-Access (LILA) census tracts.
This mapping process illuminated that of the 251 LILA tracts in the Seattle Metropolitan Area, 42.6% (107/251) are located outside of Amazon Fresh delivery areas (Table 1). Calculating this same statistic for the entire state of Washington, we found that 69% of LILA tracts (318/462) are located outside of Amazon Fresh delivery areas, many of these tracts being rural. A recent study examining the disparities in SNAP online grocery delivery in California similarly found that, perhaps unsurprisingly, rural areas especially lacked fresh grocery delivery options; the authors go on to conclude that “Such lack of access may contribute to, rather than mitigate, the geographic and income-based health disparities that the SNAP OPP program aims to address” (Foster et al., 2022). This study, however, does not address racial disparities but rather controls for them. This, despite that in the United States, 1 and 10 experience food insecurity, yet for Black people this rate is closer to 1 and 5. Given this reality, we chose to conduct another spatial analysis to see the extent to which Black census tracks were included or excluded from these fresh produce delivery areas.
Number of LILA census tracts within Amazon fresh delivery area boundaries in the Seattle metropolitan area.
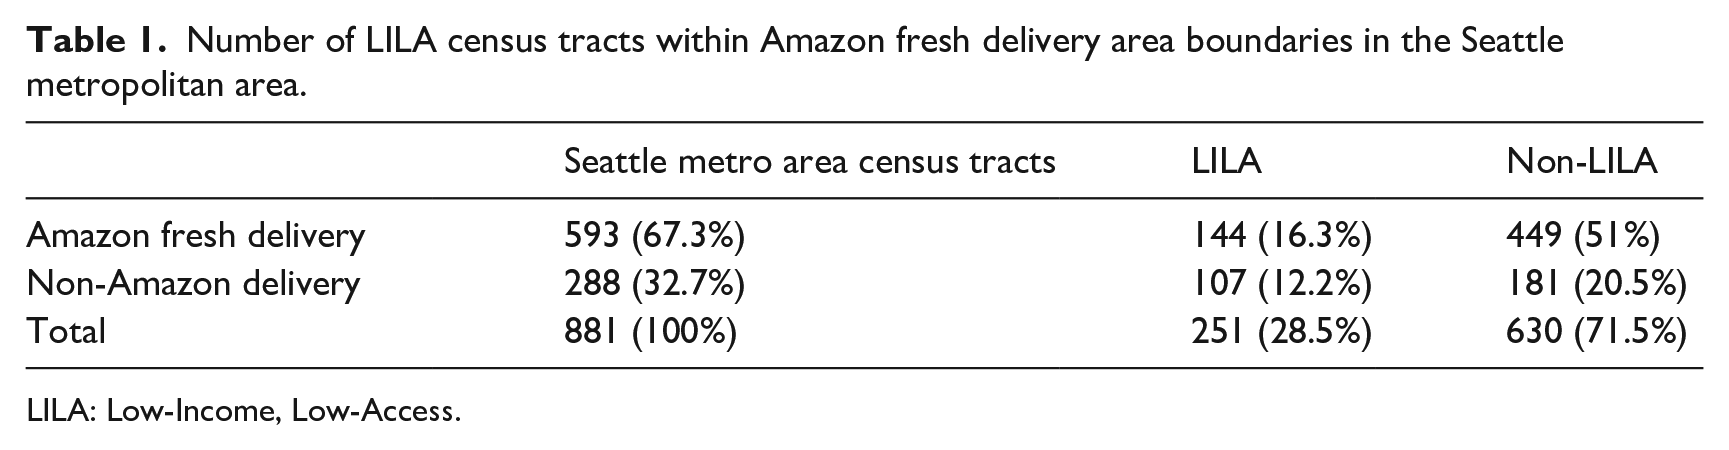
LILA: Low-Income, Low-Access.
Figure 3 shows the number of individuals who are low-income Black or African American living more than 1 mile from the nearest supermarket, supercenter, or large grocery stores. There are 32,219 low-income African Americans living in the Seattle Metropolitan Area (SMA) and only 9515 (29.5%) of this group live inside the Amazon delivery area.
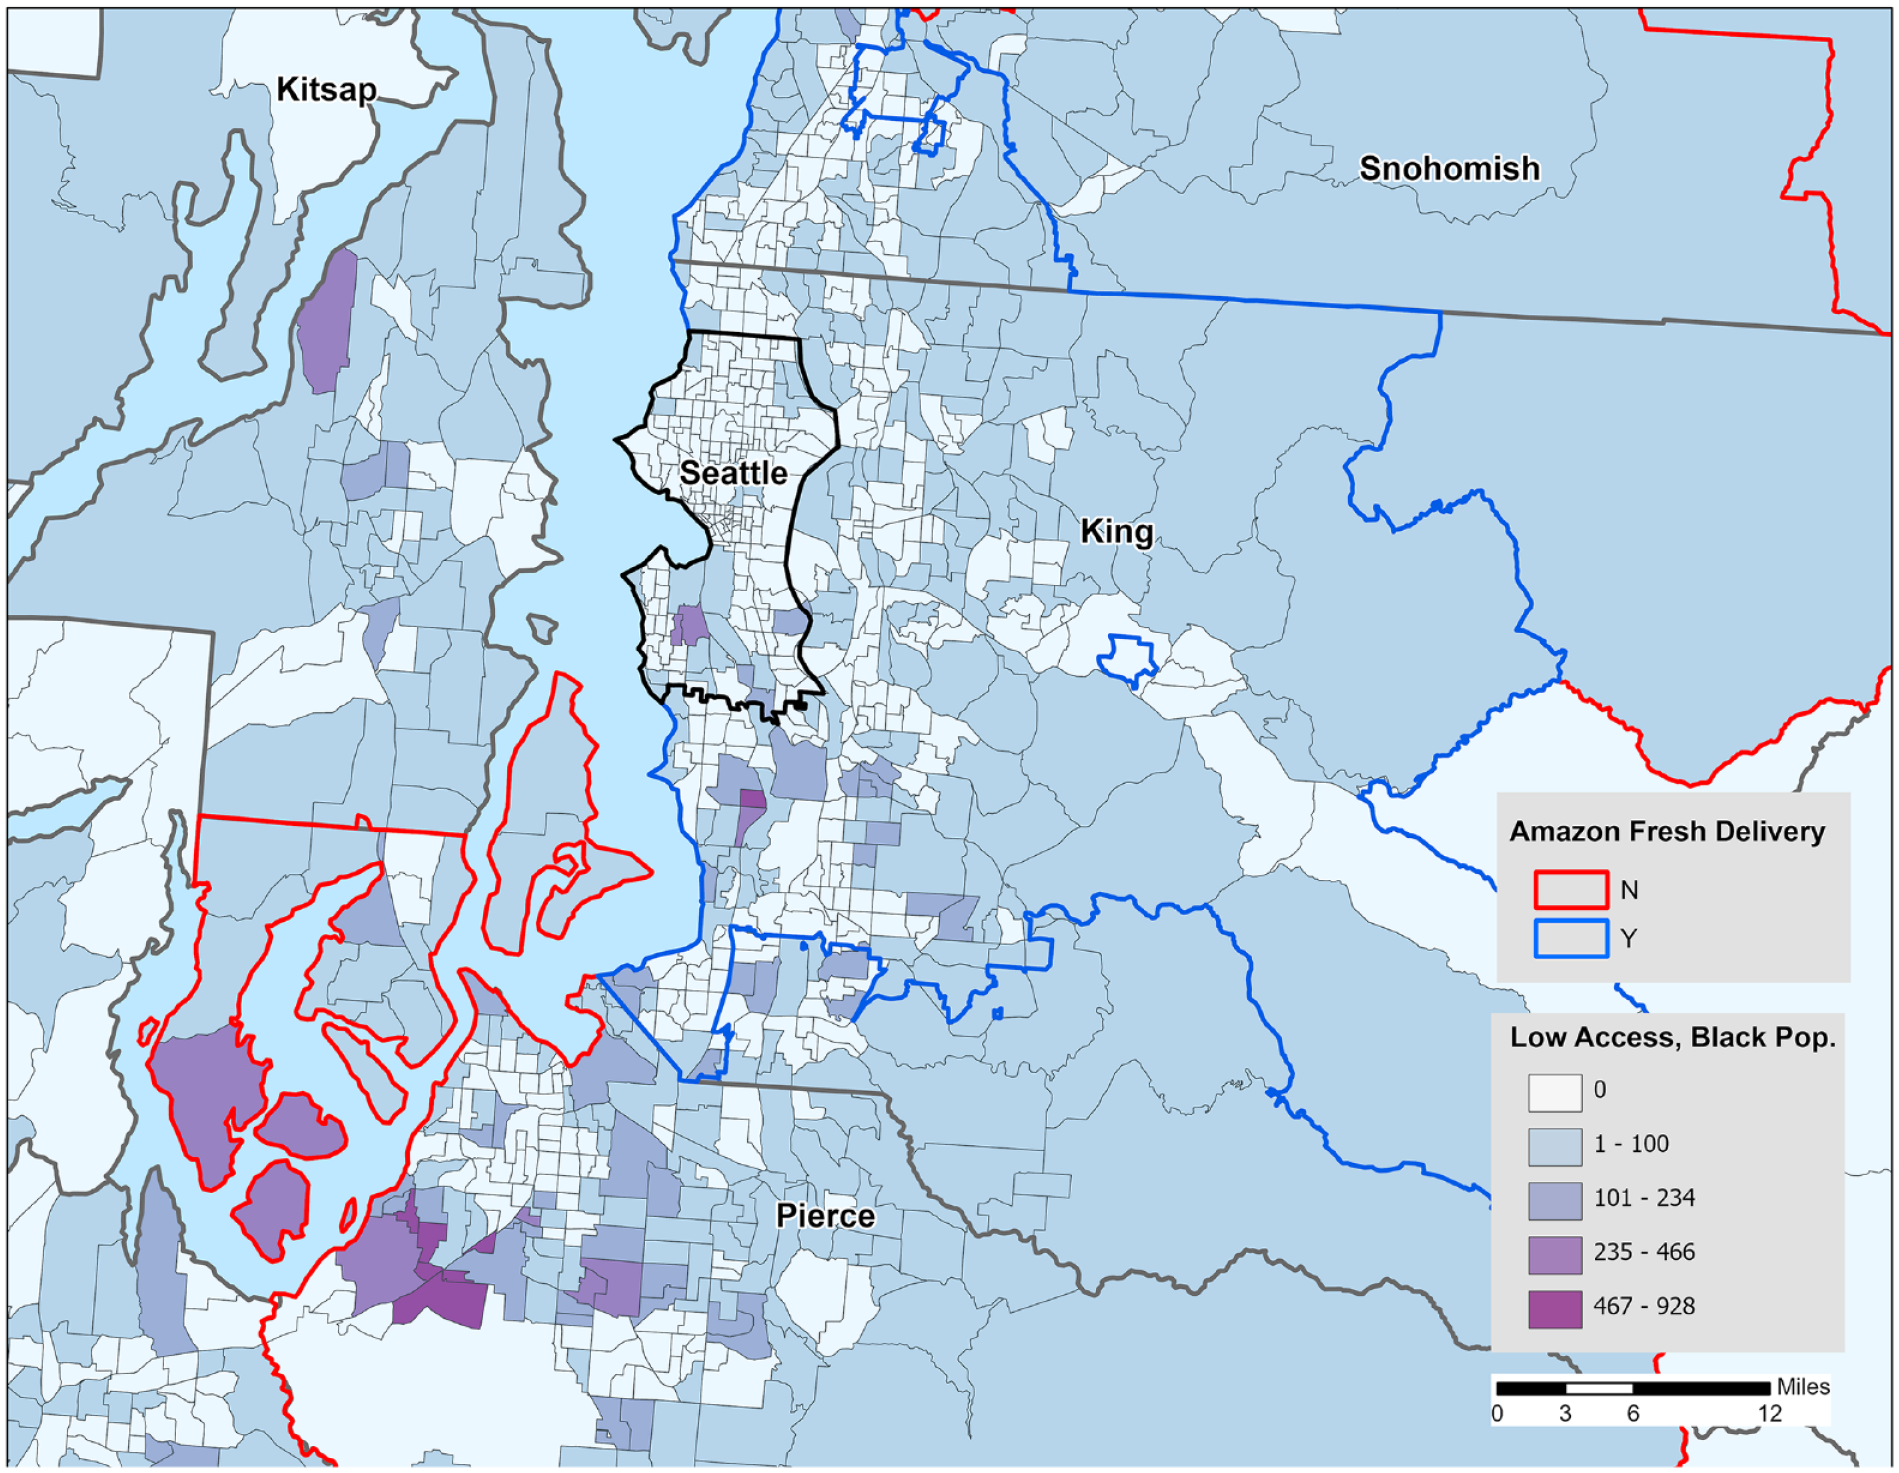
Map of Seattle’s “Amazon Fresh City” delivery area overlaid with Low Income Low Access (LILA), Black or African American population census tract.
Without a relational approach rooted in a food apartheid framework, this type of mapping would be an example of the very practice we criticize here: one more data point created to reinforce some lack in Black communities, a digital artifact that highlights a separation between Black people and fresh food. However, our relational approach prompts us to question the limits of our map and understand that the story it tells is dependent on decisions we made, decisions about what and where, yes, but also related to why we decided to go this direction in the first place. The data inherently foreclose on visualizing anything other than lack of access. It is the very definition of deficit-centered. And yet, we cannot ignore the entanglements between race and food. Indeed, we align our argument with other geographers who assert that “it is necessary to consider race when studying food” (Ramirez, 2015: 749; Slocum and Saldanha, 2016 [2013]). As geographers committed to a critical mapping approach, we can flip the script that pens these spaces as lacking by looking to food-related mutual aid and resilience found within them. We are able to do this because we are in a relationship with the area that we are mapping as well as the people who live here with us.
One example is the Black Farmers Collective. One of their farms is located in the Yesler Terrace neighborhood, most of which is mapped by FARA as a LILA area.
16
They do not shy away from addressing the intersections of race and food; they “envision Black liberation through food sovereignty.” Here is how they work toward this: We grow food and share growing space with Black urban farmers from around Seattle, with all the produce going directly to BIPOC-led and owned organizations, businesses, and mutual aid efforts to feed our community and support economic development. We are modeling sustainable urban agriculture centered around the needs of the communities of color whom are likely to experience the impacts of health disparities as a result of food apartheid, redlining and gentrification, and systemic oppression as a result of white supremacy.
17
Another example is the Urban Fresh Food Collective (Turnbull, 2021). Again, in an area that has been called a food desert, residents banded together during the pandemic to set up a weekly, free, fresh foods market. Yet, another example is Good Food Kitchens, which, if we were to map its geographical reach, would include 11 local farms sourced for fresh food, 19 community organizations that distribute meals, and 25 restaurants and caterers who prepare these meals (97% of which are owned by people of color).
When thinking about our data, maps, and spatial analyses from a grounded, community-oriented perspective, we can at once acknowledge food apartheid, point to the ways that people are countering it, and debunk the presumption that Amazon, which operates with the same capitalistic logics that created food apartheid in the first place, can make good on the fairy tale of technological solutionism. While this section focused on what is missed when we operate through an inadequate framework (food desert), the next section provides examples of how digital food apartheid materializes in harmful ways.
Food apartheid of the digital
Digital geographies scholars first conceptualized geographies of the digital as domains where the experience is digitally mediated (i.e. virtual space) (Ash et al., 2018) and affects sociospatial configurations (Leszczynski and Elwood, 2022: 3). We conceptualize geographies of digital food apartheid as those precipitated by algorithmic food-based marketing, which is an asymmetric relation that operates through data dispossession. Food-based marketing is racialized with the intent of capital accumulation (Harris et al., 2019) so digital food-based marketing is always already racialized as well (Chester et al., 2020). In spaces where personal purchase data and algorithms meet, market segmentation groups buyers according to purchase history and demographics so that targeted ads yield more profit. “The rise of Big Data and the expansion of digital technologies have created a massive retail and e-commerce surveillance system, with unprecedented scope and granularity” (Chester et al., 2020: 14). ESRI’s Tapestry Segmentation is an example of this, classifying US neighborhoods into 67 unique segments, based on demographics and socioeconomic characteristics, including race and ethnicity, income, and net worth, then selling these data to companies—including grocers—looking to better “know” their potential customer. However, larger companies, like Walmart, another key corporate beneficiary of the OPP, need not rely on third parties for Big Data. Its headquarters house their Data CAFE (Collaborative Analytics Facilities for Enterprise); an analytics hub with the goal of developing insights collected from its 20,000 stores so that the data of literally hundreds of millions of shoppers can be leveraged (Chester et al., 2020). These data inform internal marketing and are also provided to brand marketers who make decisions both based on consumer behavior and in an effort to steer that behavior. In and of itself, targeted food marketing practices may seem harmless; however, “food-related companies often target Black and Hispanic consumers with marketing for their least nutritious products, primarily fast-food, candy, sugary drinks, and snacks” (Rudd Center for Food Policy and Health, 2020). Moreover, companies such as Frito-Lay, Coca-Cola, Nestle, and Walmart have formed alliances to realize their “multicultural market growth potential” in the form of profits (Alliance for Inclusive and Multicultural Marketing, 2023).
While everyone who shops for groceries online is subject to these marketing practices, a recent report from the Center for Digital Democracy concludes that “SNAP participants are likely to be disproportionately harmed by them” (Chester et al., 2020). Intensifying this exposure is the fact that those companies who have the sophisticated digital infrastructure needed to participate in the OPP in the first place are the very ones who have the means to use data for marketing purposes. Through their involvement in the OPP, they gain exclusive access to the food purchasing-related data of roughly 40 million SNAP participants.
Shopping for groceries online through Amazon with an EBT account is similar to online grocery shopping for those with debit cards but with some key distinctions. One difference is that to purchase food on Amazon with SNAP benefits, a person must first enter their EBT card number for verification before they are even able to browse (those paying with credit or debit cards are not required to divulge their account numbers until they are ready to make a payment). This step, though necessary to track EBT customers into an interface that only shows eligible items, creates the scenario in which Amazon has access to the EBT account numbers of people before they actually are customers, and in some cases, of people who never become their customers but just intend to comparison shop or check availability. While this presumably poses no security threat given the stringent technology requirements in which these transactions take place, it provides Amazon with the specific data point: the shopper’s payment type. The significance of this is explicated in a report from the Center for Digital Democracy (Chester et al., 2020): . . . manufacturers of unhealthy products like soda, candy, and chips have greater resources to take advantage of evolving technology than do fruit and vegetable farmers. While these retail and e-commerce practices affect all consumers online, they are likely to have a disproportionate impact on SNAP participants, which include low-income communities, communities of color, the disabled, and families living in rural areas. The increased reliance on these services for daily food and other household purchases could expose these consumers to extensive data collection, as well as unfair and predatory techniques, exacerbating existing disparities in racial and health equity. (p. 15)
More empirical research examining the actual purchasing patterns of SNAP participants who shop online is needed to ascertain whether the OPP will follow this pattern, but because any person using Amazon is able to filter what is EBT eligible–even without entering an EBT account number or even logging in—we chose to include some screenshots that correspond to this browsing process (Figure 4).

Results of search on Amazon for “EBT eligible” in February 2023.
Searching A & J Markets website with “EBT Eligible” as a filter yielded very different results including bananas, avocados, 2% milk, and whole chicken. We understand that this “search and screenshot” method is inadequate to fully understand food apartheid of the digital, but wish to direct attention toward the questions it prompts. We know that online ordering has the potential to increase or decrease healthy food choices, depending on how platforms are designed (Pitts et al., 2018). However, questions around healthfulness, cultural relevance, and any other aspect that is not strictly related to profits falls by the wayside when we speculate given what we know about the logics of big food marketing. This example demonstrates how digital mediation that exists for some and not for others is subject to a larger context that prioritizes capital accumulation, which undergirds always already racialized US food assistance policy (Holt-Giménez, 2017).
Conclusion and discussion
The framework of digital food apartheid is meant to help reveal the entanglements of racism—historical and ongoing, structural and quotidian—in emerging digital spaces related to our food system. Food apartheid by the digital occurs when technological redlining determines where and which people get what food. Examining food apartheid through the digital unpacks how digital maps create a narrative that justifies techno-solutionism as an answer to food access. Articulating the food apartheid of the digital can visualize why certain foods are marketed to whom by thinking with the concepts of asymmetric algorithmic relations and data dispossession. Digital food apartheid is a way to consider, connect, and articulate these effects which allows us to better understand otherwise unseen and differentiated relationships with food at multiple scales. At a personal or embodied scale, EBT participants (10% of all US households) can remove themselves from physical space through online grocery shopping. Doing so at the onset of the pandemic would have grossly diminished where one could shop, and consequently one’s food choices, but also would have reduced the risk of contracting or transmitting COVID. At a neighborhood scale, the big-chain dominated trajectory of the OPP could shift flows of capital out of the local economy given that places like corner stores, mom-and-pop shops, and other independently owned local food retailers—are more likely to be unable or unwilling to build out the digital systems required to participate in the OPP and thus compete with online behemoths, similar to the way that supermarkets outcompeted small-shop “hucksters” during the rise of big grocery stores in the 1940s. This pattern damages neighborhoods’ networks of food exchange and the corresponding social relationships—a form of dispossession for the sake of capital accumulation (Freshour, 2020; García, 2021; Melamed, 2015; Reese, 2019).
The privatization of public welfare provisioning is nothing new (Brenner and Theodore, 2002; Harvey, 2005; Mitchell, 2001; Smith, 1996; Staeheli, 2013). Neither are the complex and numerous entanglements between race and food, only some of which we have examined here. What is new is the unparalleled presence of big food and fin-tech companies in the OPP, and the ways that the correspondent digital spaces have material effects on people’s lives and livelihoods. This relation accommodates the spatialization of corporate power such that material boundaries are co-constituted with the digital. When a company like Amazon goes on record as stating their intention to mitigate the food desert crisis, it is incumbent on researchers and activists to critically examine how exactly the landscape is being reshaped. Looking ahead, it is not difficult to imagine that as this program gains traction, the concentration of market power will skew toward corporations such that food welfare dollars—roughly 125 billion in 2021—would cycle through to the shareholders of Amazon, Walmart, and other big retail food chains. The possibility that the public provisioning of food could be rendered a new frontier for financial investment, as is already happening with public housing (Roy, 2017), is worthy of vigilance.
Contribution of this work
That maps have the power to circulate knowledge is a given. More recently, however, geographers have begun to articulate maps’ specific potency as digital mediums (Leszczynski, 2012; Rose, 2016; Wilson, 2017). When a space is mapped as empty, as having a deficit, or as a “desert,” a pathway is paved that favors grocers, like Amazon, who have the capacity to be “everywhere all at once.” Operating within the food desert framework, the logical response to a dearth of grocery stores is to remedy this access gap through an equivalent. This may include recruiting grocers to the area or looking to Amazon for online grocery delivery, both solutions predicated on commodified food systems that have contributed to hunger in the first place. Our solutions—and our imaginaries—are shaped by our framework. Food apartheid carries the generative potential to catalyze a research agenda at the intersection of Black Feminist frameworks and food (Reese and Cooper, 2021). Just as food apartheid conceptually does the work of visualizing political and rhetorical moves that (mis)place emphasis on individual actions in cultivating a just food system (i.e. “vote with your fork”), acknowledging the existence of digital food apartheid can help us reveal how racial capitalism materializes in our ever-enlarging digital food systems.
Data points, like Cartesian distance from markets and Census-constructed race categories, have led to the proliferation of a faulty metaphor (food desert) which has been instrumentalized as justification for food policies that, rather than address root causes of food (in)access, have the potential to retrench patterns of accumulation through dispossession in new, digital spaces. Given this landscape, questions beyond the availability of greens in grocery stores in Black neighborhoods must be asked and these questions demand intersectional thinking. In this way, our work adds to the growing chorus that digital geographies scholarship needs “robustly intersectional theory” (Elwood and Leszczynski, 2018; Gieseking, 2018; Shelton, 2018) because the concept of digital food apartheid relies on interventions, theory, and praxis of digital geographies, black and feminist geographies, and critical data and food studies.
Finally, we hope that our work serves as a counter against the presumed whiteness of food studies (Ramírez, 2015; Reese, 2019) as one author is a descendant of the Fort Peck Assiniboine Sioux who grew up on food assistance programs, the other a Korean immigrant who came to the United States as an international student and has also significantly benefited from food assistance programs while completing his education.
Implications for further research
Public health scholars have long seen potential for online ordering to fill a gap in access, particularly for those who are homebound and/or lack easy access to transportation. We also already know that not all digital platforms are beholden to capitalist logics; it is possible to connect food and people through digital spaces (i.e. fallingfruit.org, freedge.org, and even—or maybe especially—information sharing in threads like Reddit/foodstamps). However, given the risks of digital food apartheid, we must continue to ask questions like “Will the data point ‘EBT card payment type’ be incorporated into a marketing algorithm that is beholden to the bottom line rather than public health? What options for sustenance exist outside of a capitalist context? With digital food apartheid as a foundation, we see several fruitful facets for future research: (1) grounding this research with qualitative and ethnographic work and digital geohumanities-oriented research that would further align it with principles of critical GIS. Simply asking EBT participants if and how the OPP is working could be a start and the incorporation of qualitative and situated perspectives may allow us to apprehend and visualize connections across scale in new ways, (2) tracking OPP statistics in years to come especially since this program is evolving and was launched during the COVID pandemic, paying particular attention to where benefits go, and (3) exploring the differentiated ways in which algorithms employed by big food are manipulating the online grocery shopping experience of 40 million EBT participants.
Footnotes
Acknowledgements
The authors wish to express their gratitude for conversations with Drs Carrie Freshour, Sarah Elwood, Dan Berger, Kessie Alexandre, Victoria Lawson, Winona Wynn, María Elena García, Christian Anderson, Michael Brown, and Gunwha Oh, all of whom have guided, inspired, and supported this work. Early versions of this article were presented in a University of Washington graduate seminar, Writing for Publication, and we wish to thank each participant for their invaluable insights. In addition, the authors are grateful for the editorial expertise of Dr Noel Castree and to each of the journal’s anonymous reviewers for their positive reception and substantive feedback. Finally, the corresponding author would like to acknowledge that this article was supported by the West Coast Poverty Center via a grant from the Institute for Research on Poverty at the University of Wisconsin–Madison, University of Washington’s Office of Graduate Student Equity & Excellence (GSEE) and Office of Minority Affairs and Diversity (OMAD), and the Alfonso Carlos Peña Graduate Fellowship.
Declaration of conflicting interests
The author(s) declared no potential conflicts of interest with respect to the research, authorship, and/or publication of this article.
Funding
The author(s) received no financial support for the research, authorship, and/or publication of this article.