
Abstract
This paper examines offenders’ perspectives about acquisitive crime targets and stolen goods markets in Australia that have not been comprehensively reviewed since 2005. Over the last 18 years there have been significant changes in the rates of property crime, reductions in cash usage, and rapid movements to online markets as a disposal outlet, that motivate this updated analysis. In late 2022, N = 107 detainees in a Western Australian police watchhouse were interviewed about their property offending frequency, offence preferences, target selection, disposal methods, and estimated financial return for targeted goods. Results demonstrated (a) meaningful shifts towards shoplifting and away from the other stealing offences, (b) increases in stealing for personal consumption rather than selling on, (c) declines in preferences for small electronic items, (d) ongoing dependence on drug dealers as a preferred outlet for off-loading stolen goods, (e) disposal of stolen goods is still quick, easy, and typically offenders receive about one-third of the original purchase price for items, and (f) growth in the use of online markets to dispose of stolen goods. The theoretical and applied implications of these findings are discussed, emphasising the importance of opportunity-focused interventions to prevent crime.
Keywords
The most recent research that has surveyed offenders about acquisitive crime targets and stolen goods markets in Australia was undertaken in 2017 as an addendum to the Drug Use Monitoring Australia (DUMA) study (see Clare et al., 2022, for a summary of these findings). Prior to that, the only comprehensive review of Australian stolen goods markets in the last 25 years involved data collected in Western Australia (WA) in 2005 (Ferrante & Clare, 2006). Significant trends relating to sustained declines in acquisitive crime, increases in the proportion of burglaries without loss, reductions in cash usage, and surging movements towards online market places as a disposal outlet determined a need for more contemporary knowledge to assess the relevance and effectiveness of current crime prevention strategies to reduce acquisitive crime. To fill this gap, the current paper summarises the findings from detainee interviews conducted in WA in late 2022 and examines a range of acquisitive crime trends including offending frequency, offence preferences, target selection, disposal methods, and estimated financial return for targeted goods. Methodological similarities between the current study and the 2005 work (Ferrante & Clare, 2006) and DUMA addenda (Clare et al., 2022) mean that the findings of the current study simultaneously provide insight into contemporary trends and also allow comparisons to be made with earlier time periods in Australia. The results are discussed with respect to theoretical and applied implications and the authors conclude by advocating for ongoing work to design out crime and implement targeted crime prevention in retail and in online markets to reduce the accessibility and disposibility of highly desired items. The remainder of the introduction summarises what is known from previous stolen goods research in Australia, what the current relevant trends are relating to acquisitive crime, cash use, and online market demand, and how these patterns can be explained in terms of criminological theory. Following this, the aims of the work are outlined, the data collection methodology is explained, the main findings are presented, and the applied significance of this work is discussed.
Main findings from previous Australian stolen goods research
In 2005, Ferrante and Clare (2006) undertook a mixed-methods audit of stolen goods markets in WA. This study involved 241 incarcerated offenders who had at least one prior conviction for burglary. This work asked offenders questions about their first burglaries, their most recent burglary, general burglary target preferences, and the methods of disposal for stolen property. The results demonstrated offenders developed stealing and disposal expertise through practice (Clare, 2011). The types of items that were preferably targeted were jewellery, cash, and small electrical items: trends consistent with the CRAVED framework (Clarke, 1999, demonstrating preferences for Concealable, Removable, Available, Valuable, Enjoyable, and Disposable goods) and paralleling analysis of stolen property records undertaken in New South Wales (Fitzgerald & Poynton, 2011). This work also revealed that offenders were able to dispose of stolen property quickly (73% on-selling stolen items in less than one day), the most preferred outlets for stolen goods were drug dealers (54% of the time) and family/friends (18% of the time), there was a 50:50 split between receiving drugs and cash for stolen property, and the items were typically “sold” for about one-third of the new purchase price.
More recently, Clare et al. (2022) examined the 16-year window into Australian property crime offenders’ target selections and disposal methods. These data were collected through seven iterations of the DUMA survey, which used similar stolen goods addenda in 2002, 2003, 2005, 2007, 2012, and 2017. The Clare et al. (2022) analysis involved data from 6,079 arrestees, 21% of whom indicated they had stolen something in the 12 months leading up to the survey. Comparisons of stealing preferences over this 16 year period demonstrated (a) a shift towards shops as targets (and away from houses), (b) increased tendency to take food, clothes, and personal consumables, with a corresponding reduction in targeting electrical items, (c) an increased rate at which offenders kept things they stole and a reduction in selling stolen goods, and (d) continued preferences to sell to drug dealers and people known to the property offenders at a consistently low value of about one-third to one-quarter the original purchase price. There was also an indication that more offenders were moving towards online marketplaces as a disposal outlet for stolen goods.
These findings relating to the disposal of stolen property are supported by other Australian research with Gately et al. (2014) and Rock et al. (2022) both finding that stolen goods are most commonly sold/traded with drug dealers. Disposal with a drug dealer means that perceived needs for drugs or money can be met quickly and reliably. Furthermore, earlier qualitative research by Treadwell (2012) highlighted offenders shifting towards online methods of disposal. Aniello and Caneppele (2018) went further by contending that there were fundamental differences in the online and offline markets, providing offenders with a plethora of choices for where and how to dispose of stolen goods. While this research outlines the disposal of stolen goods from burglary offences and considers the use of online markets for disposal, to date, research has not examined the general disposal of stolen goods. This paucity of research highlights a gap in the knowledge base which could inform police and community strategies to combat property offences.
Contextual factors that mean updated insight into acquisitive crime trends is required
These most recent trends towards targeting shops, to keep rather than sell stolen goods, and to use the internet at a greater rate when sale of stolen items was a goal, are all worth examining again (given the most recent DUMA data was from 2017). There is also a range of additional contextual factors that merit the updating of acquisitive crime targets and stolen goods disposal preferences in Australia. These include long term declines in acquisitive crime in Australia, with increases in the relative percentages of burglaries that sustain no loss, declines in cash usage, increased dependence on online markets, and indications that people who regularly buy goods online show a lack of concern about buying suspicious second-hand goods through these platforms. Each of these points are discussed briefly, below.
Australian victimisation surveys demonstrate sustained declines in the prevalence of property offences over the last 14 years (from 2008–2009 to 2021–2022): with burglary reducing from 3.3% to 2.0%, attempted burglary reducing from 3.1% to 2.0%, theft from motor vehicles reducing from 4.5% to 2.4%, and other theft reducing from 4.4% to 2.0% (Australian Bureau of Statistics, 2023). In addition to this, Quinn and Clare (2021a) have discussed the concomitant increase in Australian burglaries where entry without property loss occurred (a trend which is mirrored in the United Kingdom, extending back to the early 1990s). In combination, these findings suggest houses are being targeted for acquisitive crime less often, and when houses are broken into, property is being stolen less of the time. These trends are discussed by Quinn and Clare (2021a) with respect to the combined effects of increased security and declining reward.
In parallel with these trends, recent years have seen retail theft increase according to the 2022 Australia and New Zealand Retail Crime Study (Townsley & Hutchins, 2023). Customer theft was reported as the largest source of loss in the retail sector, costing an estimated 2.29 billion Australian dollars in 2021–2022. Building on the patterns discussed by Clare et al. (2022), recent victimisation surveys demonstrate the items stolen most frequently from residential burglaries were personal items such as jewellery and clothing (22%; 43,200); tools (15%; 28,900); money (including purses/wallets, 14%; 27,100); and sporting equipment (14%; 27,100; Australian Bureau of Statistics, 2023). Food has also commonly been stolen by young people who burgled and was in some cases the only thing stolen (Rock et al., 2022).
Furthermore, there have been dramatic reductions in cash use, with cash payments constituting 69% of all payments in 2007 reducing to only 13% of payments in 2022 (Nguyen & Watson, 2023), which could be attributed to advances in and accessibility to technology: a situation that was super-charged because of many “no cash” responses to the COVID-19 pandemic. Recent years have also seen significant shifts towards online marketplaces with online purchases in food and non-food items increasing steadily (Australian Bureau of Statistics, 2021). Additionally, there is anecdotal evidence from regular online customers that there is a willingness to purchase highly-suspicious goods in online markets, provided the price is right (Quinn et al., 2023a).
How can we explain these acquisitive crime trends?
In aggregate, these trends indicate declines in burglary and reductions in stealing electrical items. In parallel, up to 2017, there have been increases in stealing from shops and keeping the stolen items for personal use. Disposing of stolen items still focuses on drug dealers and people known to offenders, with some indication of a move towards online markets. Drawing on what has been established in other criminological research, it is important to briefly outline some key, related findings to help explain these trends.
The general declines in acquisitive crime are best explained in terms of the security hypothesis (Farrell et al., 2011) working in conjunction with explanations that focus on reduced availability of highly desired items and reduced reward when seeking to sell quickly aging small electronic items (Clare et al., 2022; Quinn & Clare, 2021a, 2021b; Quinn et al., 2022, 2023b). An economic incentive has consistently emerged as a primary motivation for acquisitive crime, with offenders converting stolen goods into cash/drugs (Stevenson et al., 2001; Wright & Decker, 1996). Furthermore, offenders’ decisions are based on proximal perceptions of risk, reward, and effort, consistent with the rational choice perspective (Cornish & Clarke, 2016). Property offenders also demonstrate task-specific expertise relating to target selection at the property (Nee et al., 2017) and item-level (Meenaghan et al., 2023), with experienced offenders able to select goods that were valuable and disposable in stolen goods markets (Clare, 2011). These patterns are all consistent with the CRAVED framework (Clarke, 1999), discussed above.
Another trend that is important to understand relates to the increase in the proportion of burglaries with entry that experienced no loss (Quinn & Clare, 2021a). Much like the parts of a play, crimes can be considered to unfold according to a script (Leclerc, 2017). Based on this understanding, factors that occur after a completed property offence can influence future events. If offenders learn they cannot sell items they have previously stolen, they are much less likely to steal them again in the future. According to this logic, one potential avenue to reduce property crime is by closing avenues to dispose of stolen goods: termed the market reduction approach (Sutton, 1998).
Aim and focus of the current study
To assess the changes in stolen good disposal and markets, this research was designed to investigate and compare stolen goods disposal between two time points: 2005 and 2022. The current research addressed the 17 year knowledge gap by exploring the contemporary process of stealing and the methods of stolen goods disposal used by offenders. The purpose of the research was to provide empirical data to inform an evidence-based approach to local policing and crime reduction strategies, particularly those targeted at disrupting stolen goods markets in WA. Understanding these changes in property crime offences and stolen goods markets within WA will facilitate targeted crime prevention that will simultaneously reduce victimisation and reduce the burden on policing resulting from acquisitive crime. By understanding more about what offenders target when stealing and how they dispose of these items, locally-focused market reduction strategies (similar to the recent changes requiring identification when selling second-hand copper) can be developed. With a grounding in situational crime prevention, this approach simultaneously reduces the reward and increases the risk/effort associated with selling stolen goods, which in-turn can reduce the likelihood of offenders engaging in future property crime.
As such, the research questions guiding this project are:
What types of goods do property crime offenders prefer to steal? What are property crime offenders’ preferred methods of disposing of stolen goods? How do stolen goods outlets differ regarding speed of disposal, payment, and types of goods traded? Have there been changes in the types of goods stolen and methods of disposing of stolen goods between 2005 and 2022?
Materials and methods
Sample
Detainees arrested within the previous 96 hours and held at the Perth Police Complex Watchhouse, WA, were eligible to participate in this voluntary confidential survey. A total of 107 detainees met the eligibility criterion of having ever stolen something in their lifetime, gave their consent to be interviewed by an independent, trained researcher, and completed the interview. Exclusion criteria included individuals who were excessively intoxicated, mentally unfit, aggressive, needed an interpreter, or those deemed ineligible by the police custody manager involved. 1
Survey design
A survey instrument was developed based on one used previously by Ferrante and Clare (2006) and the stolen goods survey addenda to the DUMA program. The first section of the survey comprised basic demographics and background questions (which concluded with a question asking if detainees had stolen anything in the last 12 months, and if yes, what stealing offences they had committed). The next sections asked questions about the specific stealing offences detainees had committed in the last 12 months, followed by sections on stolen goods disposal and stolen goods markets used by detainees in the last 12 months. The final two sections then asked questions about general stealing preferences and the detainee's first stealing offence, respectively. The average duration to complete the survey was 11 minutes. 2 The survey instrument was hosted on the online platform Qualtrics to ensure efficient data collection and retrieval.
Data collection
Edith Cowan University’s Forensic Interview team conducted the surveys with police detainees. This involved following a pre-determined interview script obtaining verbal informed consent and administering the survey instrument by reading aloud each question and asking the participant to provide a verbal response. Interviews were conducted from August 18, 2022, to September 11, 2022. In addition to the self-reported police detainee survey dataset, current chargesheet data were also provided by the Western Australian Police, with this data linked to the survey dataset on the police detainee number before being deidentified. For the purposes of some of the long-term comparisons presented below, data were also obtained from the Australian Institute of Criminology DUMA 2005 Annual Report which included results to the Stolen Goods Survey addenda.
Results
This section presents overall demographics of the sample involved, before outlining the main findings with respect to the four research questions.
Sample demographics
Of the 107 detainees who indicated they had stolen at any point in their life, 87 identified as male (81.3%), 40 (37.4%) identified as Aboriginal and/or Torres Strait Islander, and ages ranged from 19 to 61 (mean = 34.3, SD = 8.8). The three most represented current charges of the participants were “breach” (22.9%), “stealing” (17.9%), and “drug offences” (9.0%). 3 A subset of 46 participants indicated that they had stolen in the previous 12 months (43.0%, with this time period referred to as “recent stealing” for the remainder of the paper). Within this subset, 23 respondents self-reported having been charged by police for less than five recent stealing offences, and 16 indicated they had been charged more than 20 times. Many participants who self-reported recent stealing indicated that they had committed shoplifting offences (71.7%). Also of note, 65.2% of the respondents who self-reported recent stealing (n = 46) indicated that they committed only one type of the stealing offences listed, 10.9% committed two types of stealing offences, 15.2% committed three types of stealing offences, and 8.7% committed four types of stealing offences listed (with no participants committing all five types of stealing offences). The self-reported stealing frequency for specific recent stealing offences are displayed in Figure 1. This figure demonstrates that the largest proportion of offenders of each offence type were those that stole at a frequency of less than monthly or monthly, and the only offences being completed daily were shoplifting and stealing from cars.
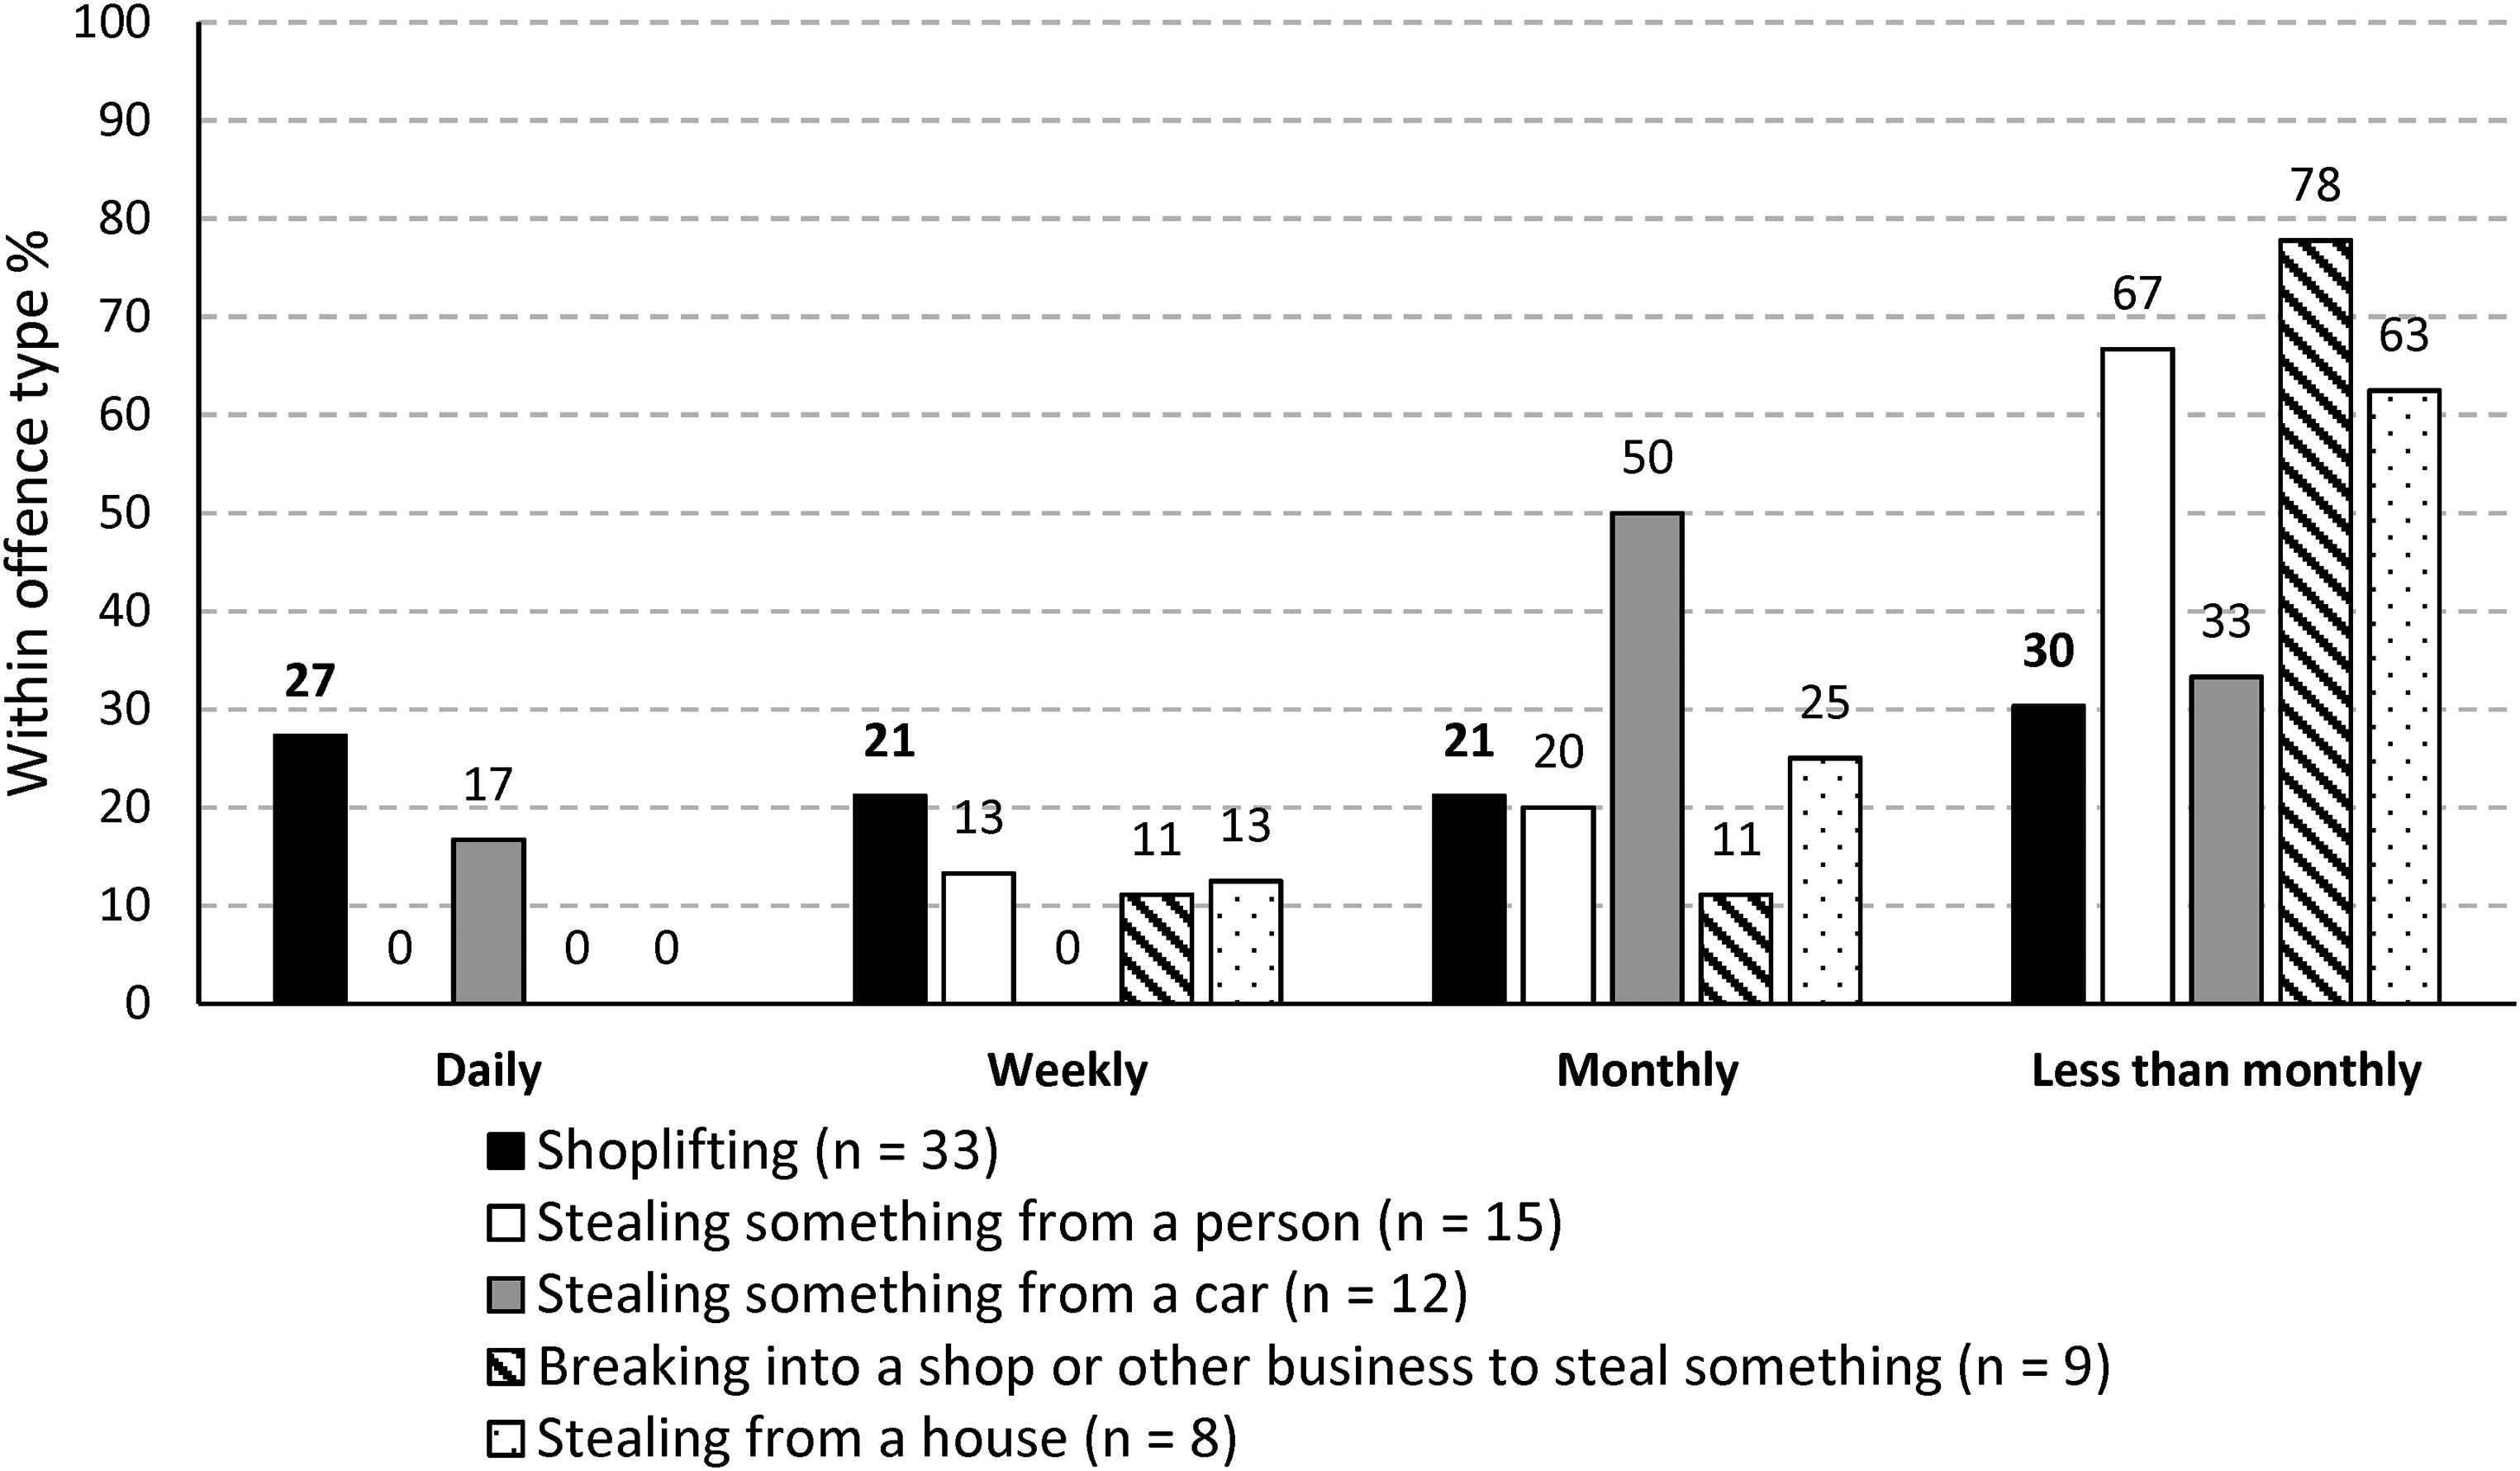
Self-reported stealing frequency by stealing offence for subset of participants who stole something in the previous 12 months.
Property offenders’ stealing preferences
All participants (N = 107) were asked what goods they prefered to take in general when they commit stealing offences. The types of goods most frequently selected by participants were food (n = 49; 45.8%), cash (n = 29; 27.1%), clothing (n = 23; 21.5%), and alcohol (n = 16; 15.0%). Despite the sample predominantly comprising detainees who self-reported committing shoplifting offences, except for cash, there are notably low proportions of detainees identifying that they generally prefer to steal the traditionally CRAVED products such as jewellery/watches (12.1%) and electronics (each electronic item option was selected by less than 8.5% of participants).
The types of goods taken by police detainees in recent stealing events were also compared. Table 1 shows a breakdown of the types of goods taken in recent stealing by offence type. The most frequently stolen goods differed by offence type. The three most stolen goods from shoplifting offences (n = 33) were food (n = 24; 72.7%), clothing (n = 12; 36.4%), and alcohol (n = 11; 33.3%). For stealing from a person offences (n = 15), the most stolen items were cash (n = 6; 40.0%) and cigarettes (n = 5; 33.3%), with food and mobile phones both stolen by 4 participants (26.7%). When stealing from a car (n = 12) the most targeted goods were cash (n = 10; 83.3%) and credit cards (n = 6; 50.0%), with jewellery/watches, cigarettes, and mobile phones all stolen by 4 participants (33.3%). Commercial burglary (n = 9) targeted alcohol (n = 3; 33.3%) and “other” property which comprised keys, paperwork, and lottery gaming tickets (n = 3; 33.3%). Finally, for residential burglary offences (n = 8), the few offenders who had recently engaged in this offence reported targeting cash (n = 3; 37.5%) and vehicles or vehicle parts (n = 3; 37.5%), with various electronics (mobile phones, Tablets/eBooks/iPads/Kindles, laptop computers, gaming consoles/games, and televisions) all stolen by two participants each (25.0%).
Self-reported types of goods taken by self-reported stealing offences committed in the last 12 months (n = 46).
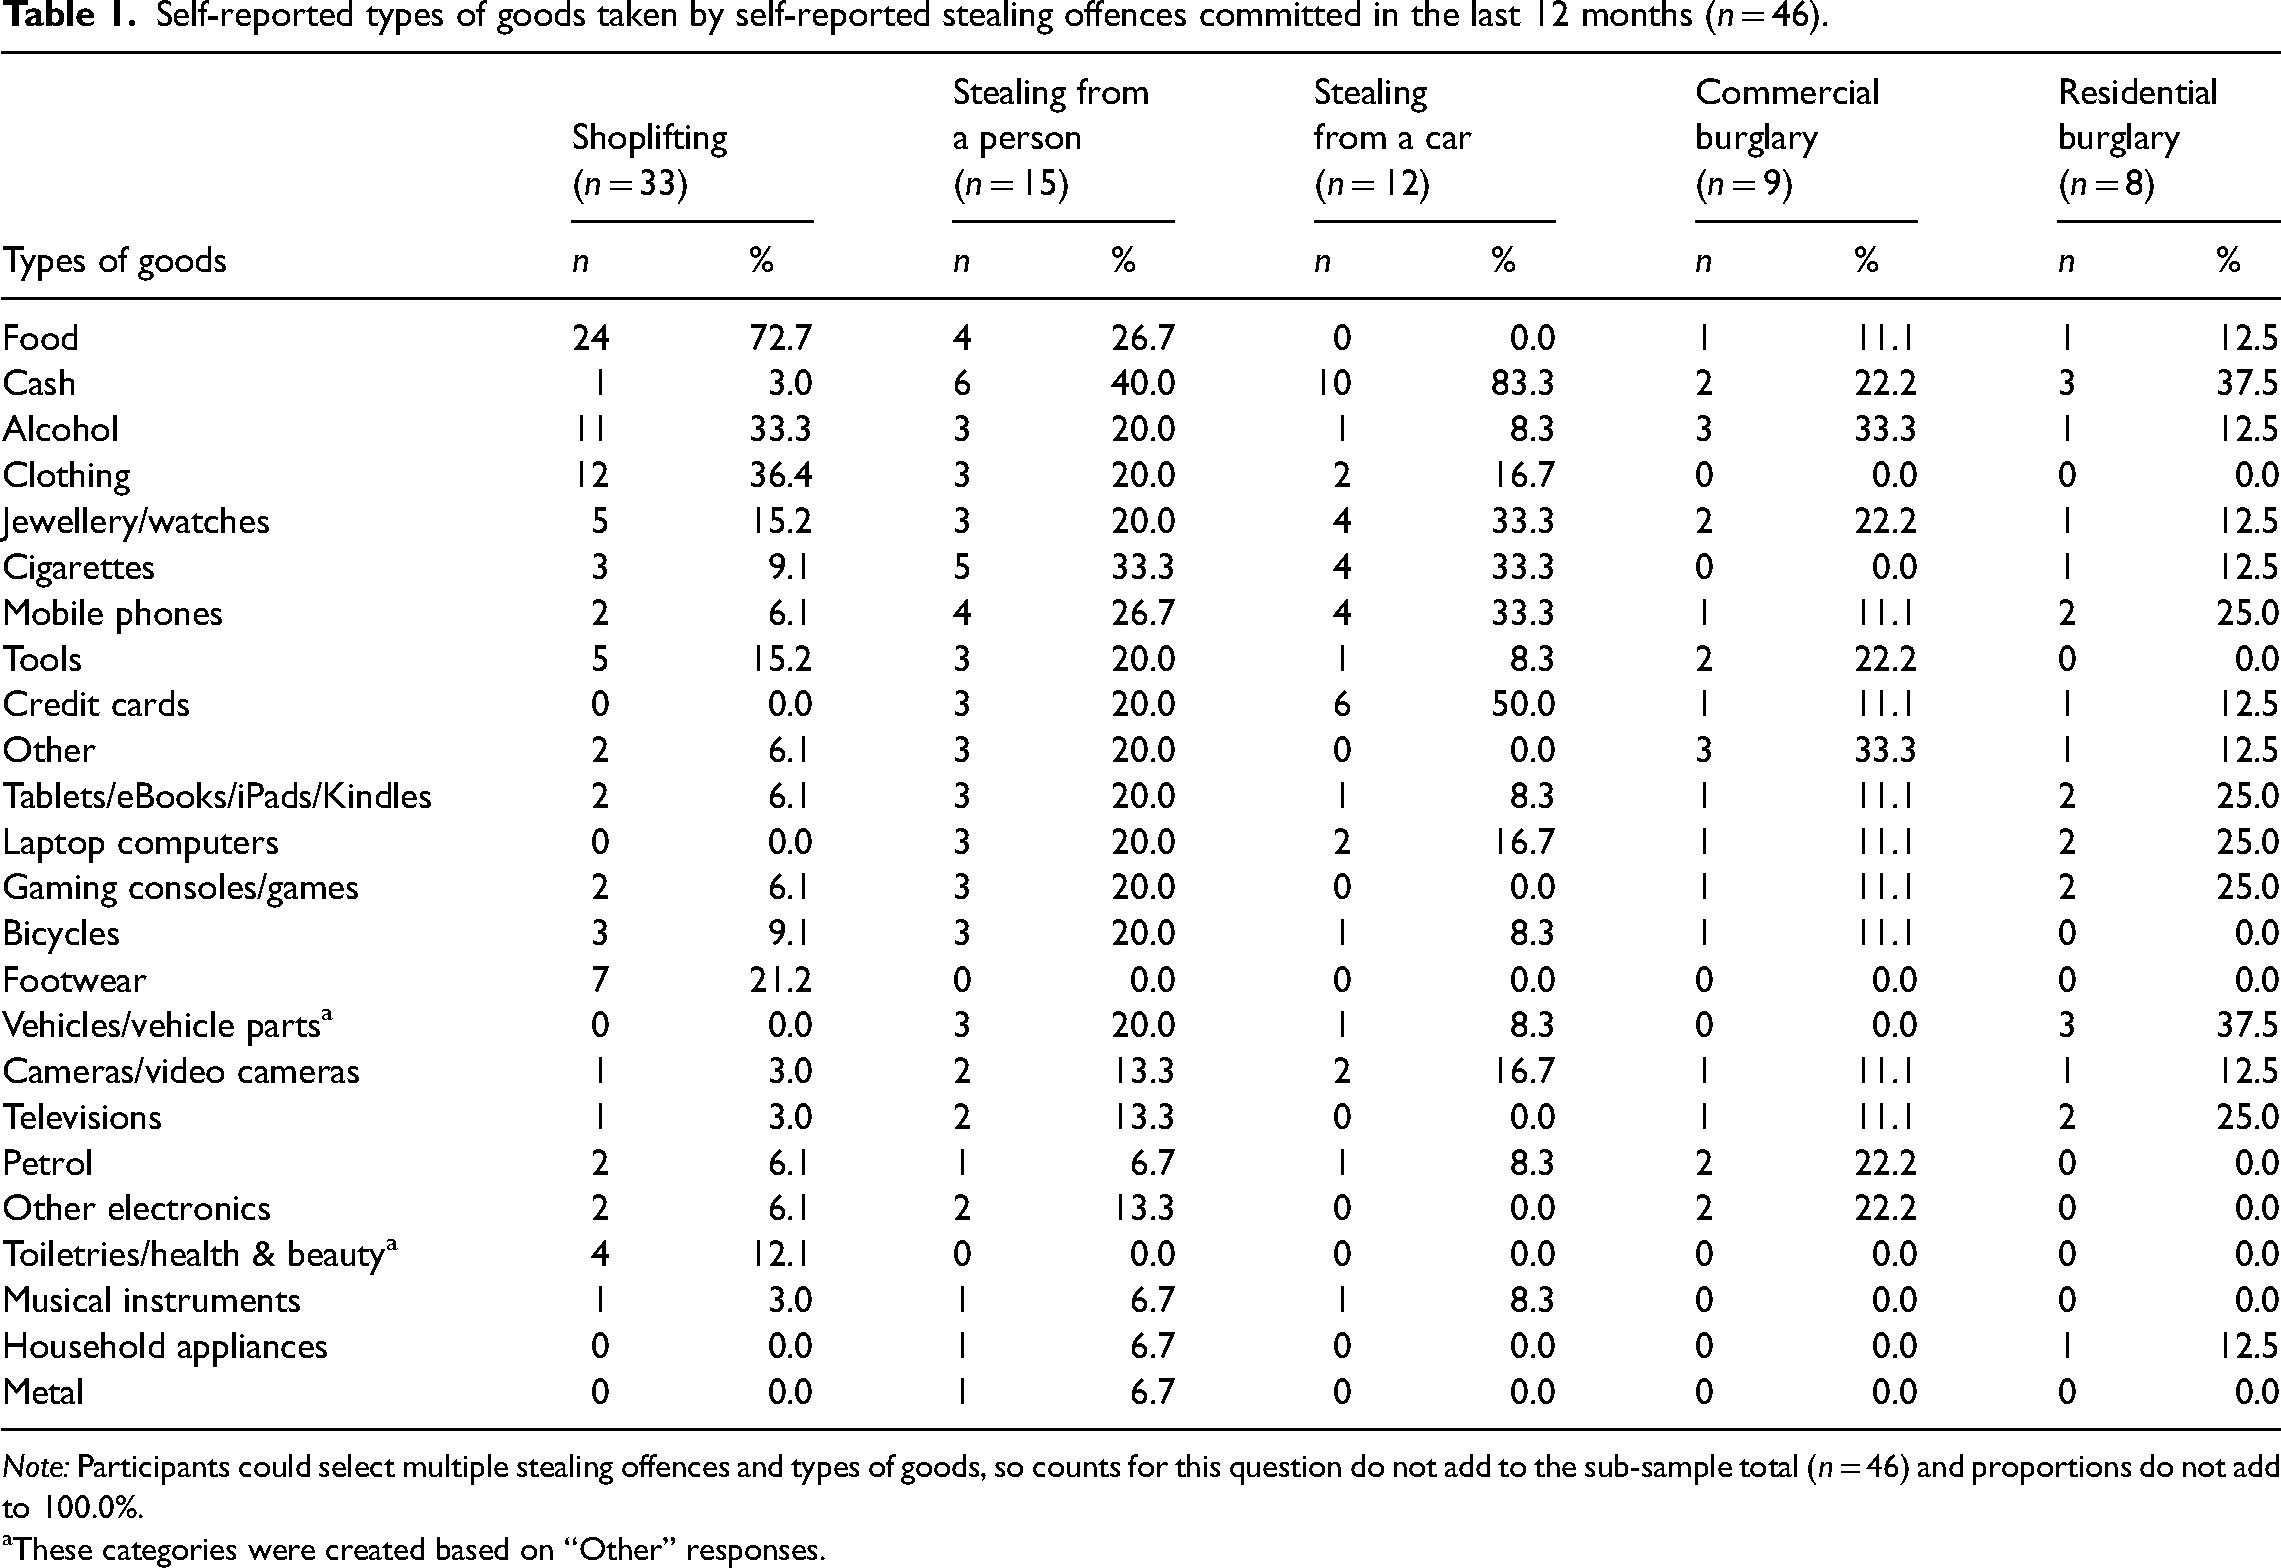
Note: Participants could select multiple stealing offences and types of goods, so counts for this question do not add to the sub-sample total (n = 46) and proportions do not add to 100.0%.
These categories were created based on “Other” responses.
Property offenders’ preferred methods for disposing of stolen goods
All participants (N = 107) were asked how often they generally sell or trade stolen goods via different stolen goods markets. The two stolen goods markets detainees (generally) most frequently engaged with were drug dealers (n = 17, 15.9% of the sample indicated that they “always” or “mostly” sold/traded stolen goods with drug dealers), and family or their “mates” (n = 10, 9.3% of the sample indicated that they always or mostly sold/traded stolen goods with family or mates). Perhaps unsurprisingly given the strong representation of stealing personal consumable items among the sample, many comments in response to the “other” market option suggested that detainees generally kept stolen goods for themselves.
Police detainees who had recently committed a stealing offence (n = 46) were also asked in more detail what they did with the goods they stole. First, these participants were asked whether they kept any of these goods for themselves. Supporting the earlier finding that the majority of the whole police detainee sample did not sell/trade goods in any of stolen goods markets, 73.9% (n = 34) of police detainees who had recently stolen kept some or all of the goods for themselves. The stolen goods most frequently kept were food (n = 14; 41.2%), clothing (n = 9; 26.5%), and alcohol (n = 7; 20.6%); again, consistent with stealing personal consumable items for personal use.
Participants who indicated that they had committed a recent stealing offence (n = 46) were also asked if they discarded any of the goods they stole. Most participants indicated that they did not discard any of these goods (n = 36; 78.3%). Of the participants who did throw away some or all the goods they had recently stolen (n = 10), the most common goods disposed of in this way were credit cards (n = 5), food (n = 3), and mobile phones (n = 2). Potential reasons for discarding credit cards and mobile phones related to concerns around these items being highly traceable, an inability to use the items due to security measures in place (i.e., password protection), and/or an inability to sell or trade these goods in stolen goods markets.
Less than half the sample sold or traded any of the goods they stole in each of the stolen goods market options. 4 This, combined with the finding that most participants who recently stole kept at least some of the goods for themselves, suggests that a reasonable proportion of this sample exclusively kept the goods for personal use. However, a meaningful proportion of the subsample also appeared to readily engage with stolen goods markets. Indeed, 45.7% (21 of 46) of police detainees who recently stole indicated that they sold/traded at least one of the stolen goods with drug dealers during this time, and 34.8% (n = 16) indicated that they sold/traded at least one of the stolen goods with family or mates. Additionally, 9 of the participants sold/traded with fences (19.6%), 8 sold/traded with legitimate businesses (17.4%), 5 7 sold/traded with strangers in person (15.2%), 6 and 5 sold/traded with strangers online (10.9%).
Disposal outlet market variations
The third research aim was to investigate how stolen goods markets differ with respect to types of goods traded, speed of disposal, remuneration received, and difficulty involved in trading. Table 2 summarises the types of goods targeted, the speed/ease of disposal at each disposal outlet, and the types of remuneration received for detainees who self-reported recent stealing. First, this table demonstrates how the types of goods traded differed according to the different stolen goods outlets. Family/mates disposal avenues were dominated by personal consumables (e.g., food, alcohol, and clothing) 7 , drug dealers and in-person sales to strangers contained a mix of personal consumables and high-value traditional hot-products (e.g., electronic goods, jewellery/watches, and tools), while legitimate businesses, fences, and online sales to strangers online almost exclusively involved sales of high-value traditional hot-products.
Disposal outlet use, targeted items, disposal speed, and disposal ease by self-reported stealing offences committed in the last 12 months (n = 46).
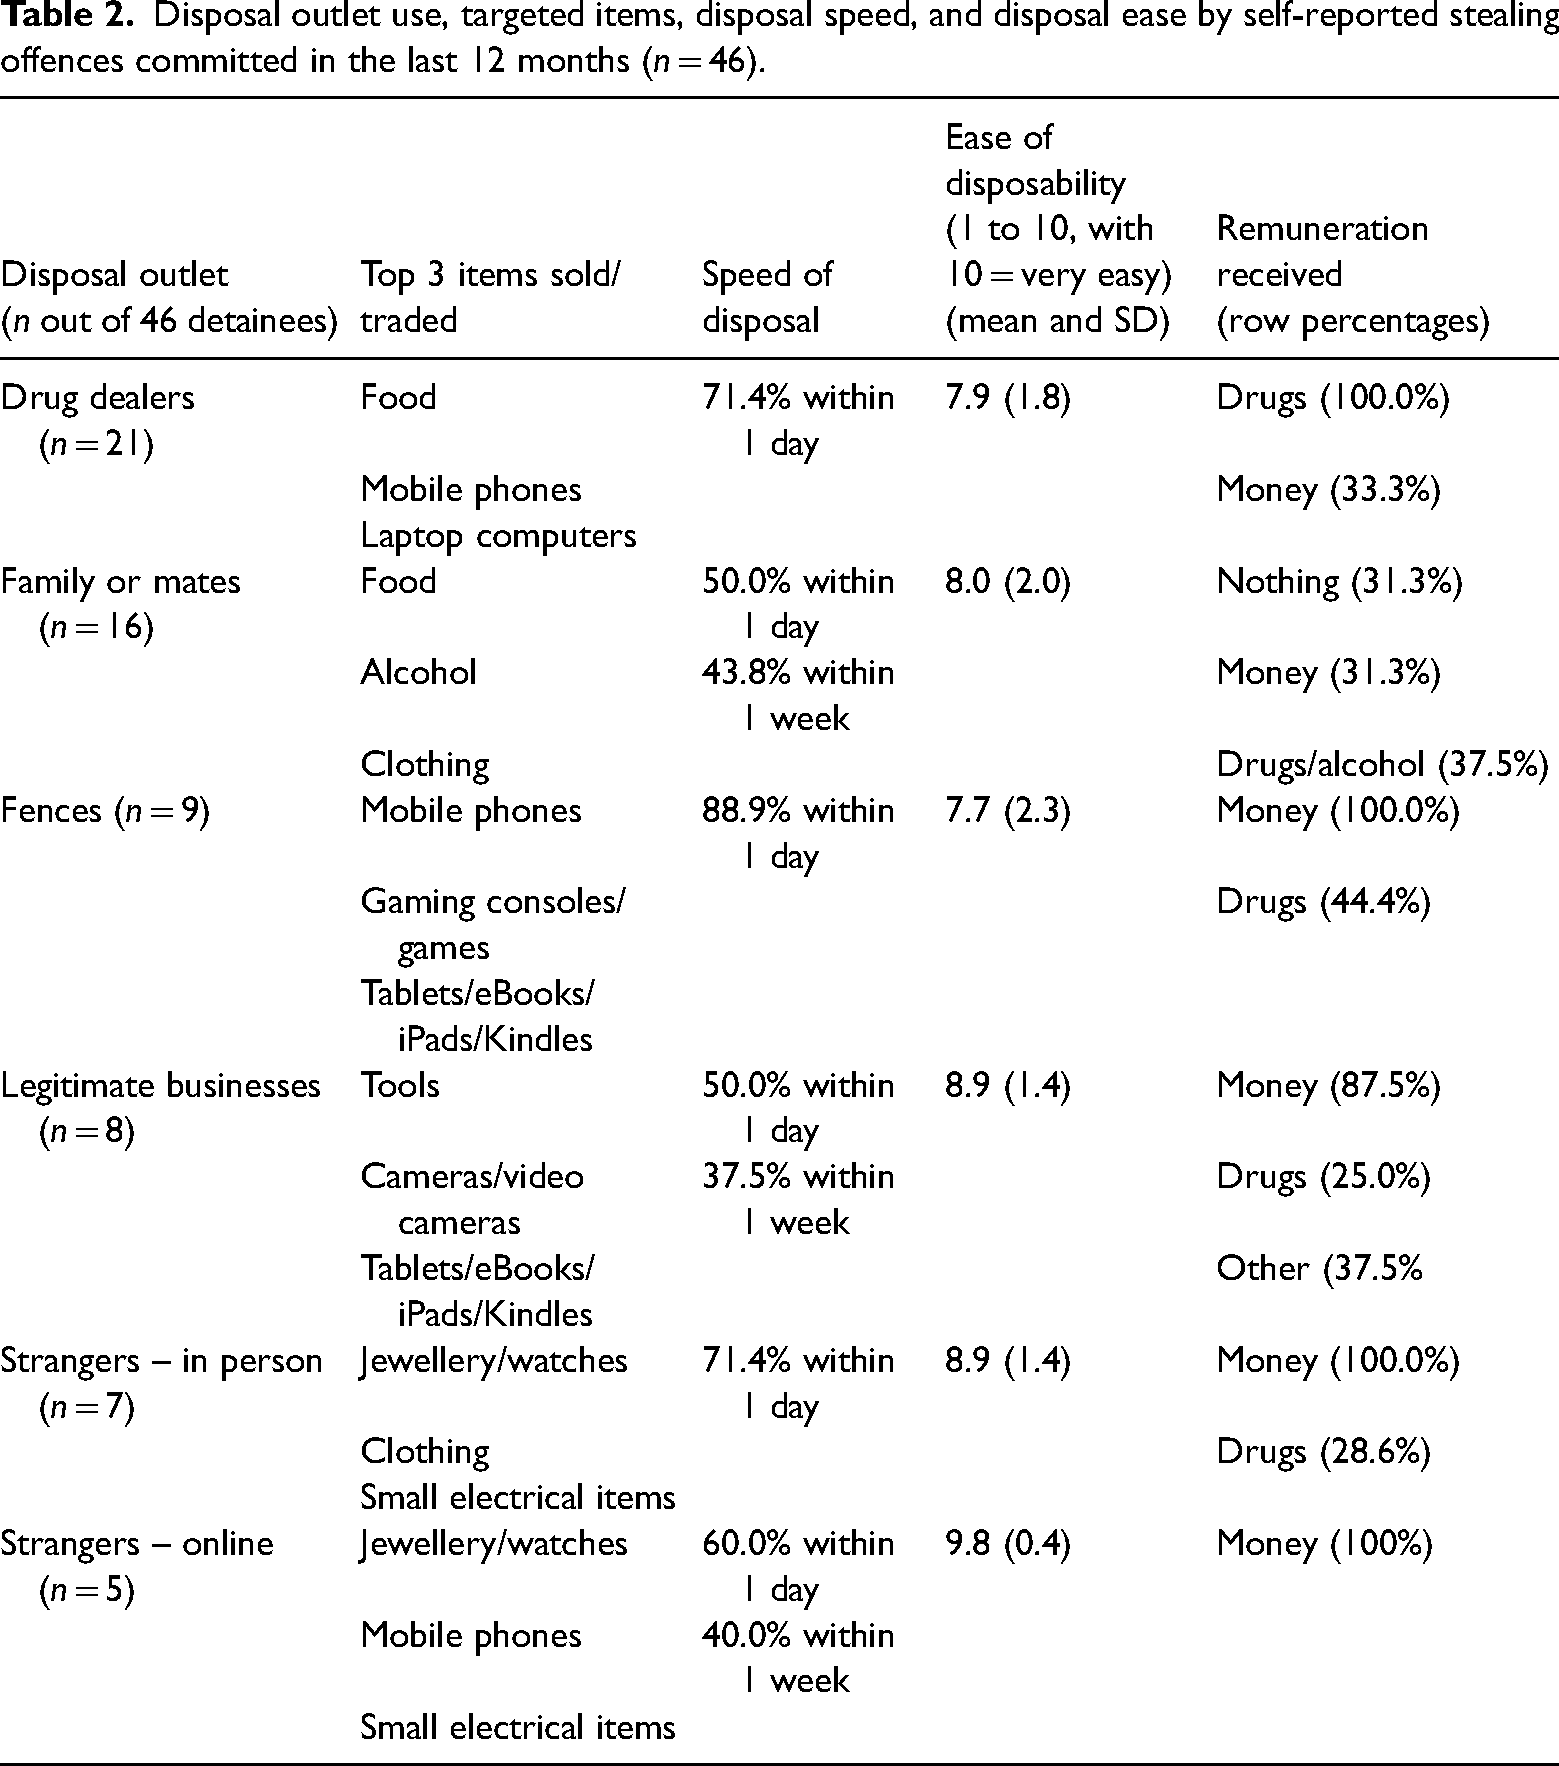
Table 2 also compares the speed of disposal across the various outlets. For each stolen goods market that detainees reported selling/trading in the last 12 months, they were asked roughly how long it took them to sell/trade goods via the market as well as rating the ease of disposing goods in the market. The fastest disposal methods appeared to be via fences, followed by drug dealers and strangers in person, then strangers online, followed by family/mates and legitimate businesses. Consistently, across these outlets, goods were being disposed of within a day of acquiring them.
Furthermore, detainees indicated it was relatively easy to dispose of products via all of the stolen goods markets listed (Table 2). Using a scale ranging from 1–10, where 1 was “very difficult” and 10 was “very easy” to dispose of stolen goods, disposability ratings were highest for online sales to strangers, with all other mean ratings at 7.7 or higher. Although the number of detainees disposing of goods via strangers online comprised the smallest number of detainees to dispose of goods via any of the stolen goods market options (n = 5), the unanimous confidence in disposing of stolen goods online among this small sample is striking. Four of the five detainees who disposed of stolen goods online reported that they did so on Facebook Marketplace, three used Gumtree, one used Facebook Buy and Sell pages, and one used eBay. Two of the detainees reported that they had had potential online buyers walk away due to suspicions the goods were stolen, while three reported they had not. When asked what strategies they use to reduce suspicion that the goods they sell online are stolen, there were mixed responses. Two detainees reported that they confidently spoke about the items as if they were legitimate, one stated that people do not generally ask if the goods are stolen, one stated that if people ask they tell them the goods are stolen, and one had a more sophisticated strategy: P72: If it's a phone, make sure it's unlocked and wiped of any information. Provide all information for clothing, sizes, where it's from, prices.
Curiously, while fences were identified as the fastest disposal outlet for detainees, they were rated lowest in ease of disposability when compared to detainees disposing of stolen goods via alternative markets. Legitimate businesses were rated curiously high in ease of stolen goods disposal. Through follow-up questions, it was ascertained that all of the six detainees who reported selling/trading stolen goods with pawn (second-hand) shops and scrap dealers reported that they had to show ID, 8 with only one detainee reporting using a fake ID. However, three of the six detainees who had to show an ID (50.0%) stated that they thought that all of the pawn shops they sold/traded to knew the goods were stolen (n = 2) or some did (n = 1), while two thought that none of the pawn shops they sold/traded to knew the goods were stolen. 9 This may explain the relatively high ease of disposability rating for legitimate businesses, despite legislation in place to disrupt disposability for this market type (Pawnbrokers and Second-hand Dealers Act 1994 (WA)).
The final dimension the disposability of stolen goods captured in Table 2 was the type of remuneration received. Consistent with findings discussed, above, those who sold/traded stolen goods to family or mates predominantly traded personal consumables in this market, and hints that many of these detainees were giving away these stolen goods to family or mates rather than selling/trading them. The most common payments received from this market were “nothing”
10
, money, and drugs/alcohol. Remuneration from legitimate businesses predominantly involved money, although drugs were also reportedly received in return for stolen goods. Payments received from all remaining stolen goods markets were exclusively money or drugs. This fits the focus on high-value traditional hot products stolen by the subsample of detainees who sold/traded goods in stolen goods markets, to maximise the amount of money and/or volume of drugs received. There was a suggestion by one detainee (recorded by the interviewer in additional comments) that selling stolen goods online was more lucrative than other stolen goods markets: P107: You normally get a third of the price for stolen items. I generally try and sell online to strangers, so I get that little bit extra.
Another way the survey allowed an investigation into how stolen goods markets differed with regard to types of goods traded was asking detainees in what markets they would sell/trade specific goods (a “$1,000 gold necklace”, a “newer smartphone (e.g., iPhone 13)”, and a “laptop computer”). The results are presented in Table 3. The breakdown of different stolen goods markets detainees would sell/trade a newer smartphone and a laptop computer to are remarkably consistent, perhaps reflecting the similar value and security properties of these goods. The varying options selected by detainees also reflect the different cohorts in our sample: those stealing for monetary and drug rewards, and those stealing to provide for themselves and family/mates. Indeed, while 18.7% of the sample indicated that they would sell/trade either electronic good to drug dealers and over 11.0% would sell/trade to strangers online, many of the respondents indicated that they would keep either good for themselves (17.8%) or explicitly stated via the “other (please specify)” option that they would not steal the good at all (over 13.0% for both goods). While many detainees did not elaborate on why they would not steal a newer smartphone or laptop computer, some of the reasons stated by detainees who did were that it “causes more problems than it is worth”, is “too much maintenance”, and that they would “leave it if it had a password”, among other similar reasons. This suggests that the security properties of the electronic goods deterred some of the detainees from stealing them. Reasons such as these for not stealing specific goods were absent from the $1000 gold necklace question, and the number of detainees not willing to steal this item appeared to be much lower than for the electronic goods based on the lower number of “other” responses and “no responses”. This was also reflected in the higher proportion of detainees who would sell/trade the necklace to drug dealers (29.0%).
Where detainees who stole something at any point in their life (N = 107) would sell or trade a specific stolen good.
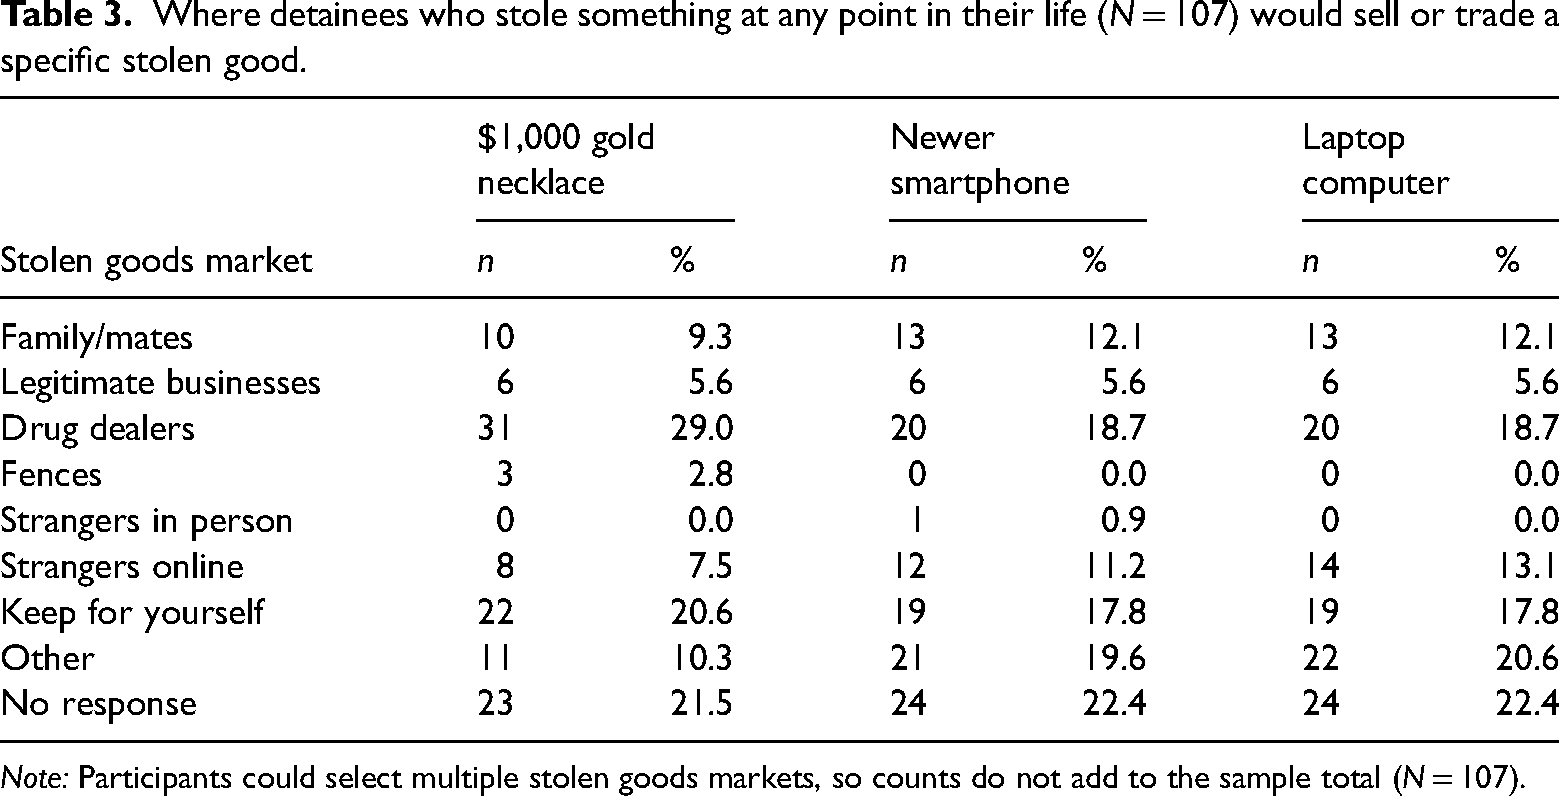
Note: Participants could select multiple stolen goods markets, so counts do not add to the sample total (N = 107).
Respondents were also asked what price they would estimate getting for the three hypothetical goods displayed in Table 3. The $1,000 gold necklace had an average estimated price of $427.20 (SD = 188.6, n = 49 estimates): 42.7% of the retail value presented in the example. The newer model smartphone had an average estimated value of $440.00 (SD = 279.0, n = 42 estimates): 35.8% of the retail price for an iPhone 13 in Australia at the time. In comparison, the average estimated price for the laptop computer was $168.75 (SD = 125.68 n = 40 estimates): 24.9% of the retail price. Remarkably, despite not providing detainees with the current retail value of the smartphone and laptop models, the average price estimates of all three goods were close to the “third of the retail price” stolen goods market value typically reported by offenders (Clare, 2011; Clare et al., 2022; Ferrante & Clare, 2006; Nelson et al., 2003; Sutton, 1998). Also interestingly, the gold necklace received the highest retail relative average price across all three goods, followed by the newer model iPhone, and then the laptop computer, perhaps reflective of the perceived second-hand/stolen demand differential between the different goods.
Comparing the targeting and disposal of stolen goods over time
The final research aim was to investigate how types of goods stolen and methods of stolen goods disposal have changed between 2005 and 2022. 11 The methodological similarity between the interview process in the present study and the DUMA Stolen Goods Survey Addenda allowed for comparison between the two studies. Firstly, the types of goods police detainees interviewed in 2005 (who self-reported stealing something in the last 12 months; n = 314) indicated that they usually stole, was compared with the types of goods police detainees interviewed in 2022 (who self-reported stealing something in the last 12 months; n = 46) generally preferred to steal (see Figure 2). There were some interesting differences between the types of goods usually stolen/preferred among the two police detainee samples separated by a 17-year period. Strikingly, the proportion of police detainees who stole in the 12-month period prior to their 2005 interview that usually stole cash (32.5%) was almost exactly the same proportion as the 2022 sample (32.6%). Another type of good that was stolen among 2005 police detainees at a similar rate to the preferences of the 2022 police detainees was tools (15.3% and 13.0%, respectively). All other goods exhibited marked decreases in the proportion of 2005 detainees that usually stole the goods and the proportion of 2022 detainees that preferred to steal them. The largest decrease in stolen goods preferences over time was for consumer electricals (15.9 percentage point decrease), although cars, computers, jewellery, and clothes all saw decreases of around 10 percentage points.
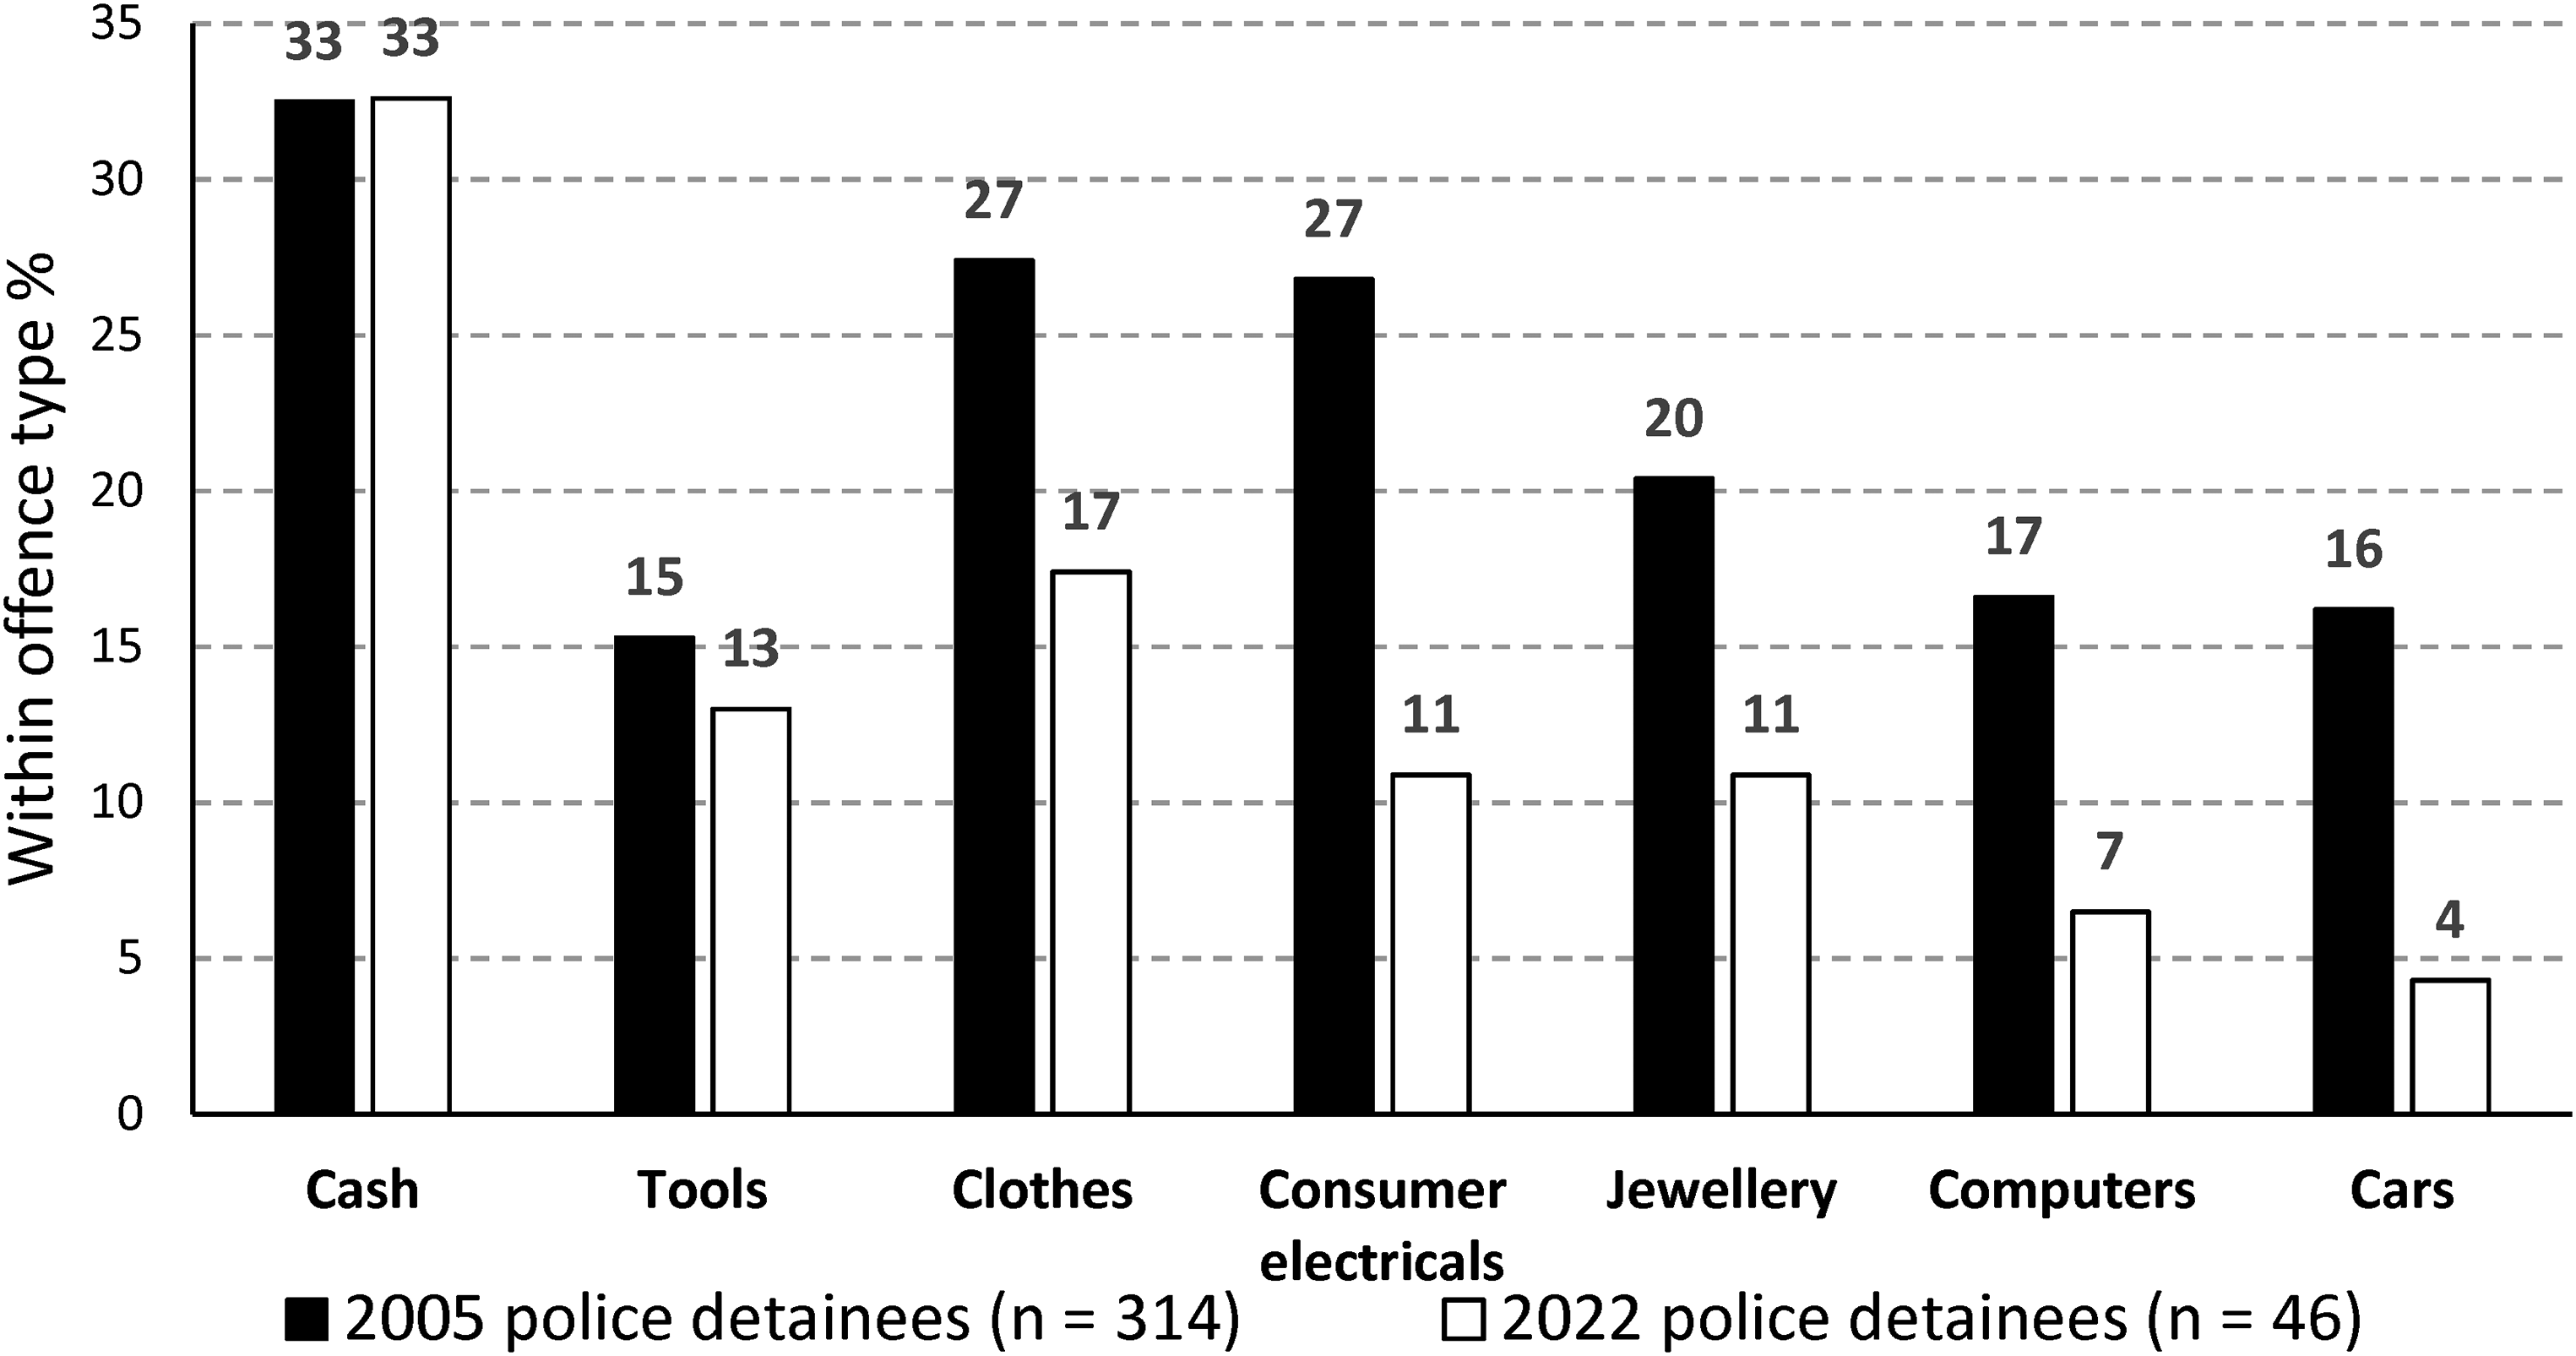
Comparing preferences for stealing targets between 2005 DUMA respondents and 2022 respondents to the current study.
Some of the additional comments made by police detainees at the end of interviews in the present study illuminate the apparent decreases in theft of consumer electronics evident here (and documented more rigorously elsewhere, for example see Quinn & Clare, 2021a, 2021b). These comments were around the reduced market for stolen consumer electronics due to improved security measures, for example: P48: No point stealing phones and laptops anymore really, they are all tracked. P54: In the past I would only steal what I knew would be easy to trade/sell. At the moment it's not worth it. I haven’t done any housebreaks since 2011. P89: It's easiest to sell gold jewellery like necklaces to pawnshops because you can sell it to them with the links taken out. This makes it untraceable back to you because you have dismantled the necklace. They also pay the most for it too. If I am trying to sell a phone or laptop, that is too dangerous because they are so traceable now. If I took one, I’d either smash it or sell it to some random online. P61: I would never use or sell a phone or laptop as I think they are useless.
The 2005 police detainee sample was also compared to the 2022 police detainee sample of the present study with respect to preferred stolen goods markets. There were non-trivial differences between the questions asked in the two studies that need to be acknowledged: in 2005 respondents were asked about outlets that they “usually sold” to, whereas in 2022 respondents were asked “did you use” each outlet. The wording means that, all other factors being equal, it would be expected that the 2005 wording would result in lower frequency estimations than the 2022 question. Regardless of question style, the top three disposal outlets for stolen goods were drug dealers, family/mates, and fences for both samples (Table 4). The ratio column provides insight into the relative changes in use of each disposal outlet over time. The largest relative increase was observed for online sales to strangers (with this comparison made to the 2012 DUMA addendum, as this was the earliest relevant data that was collected), showing the relative increase was 5.4 times the size of this disposal outlet in the earlier measurement.
Comparing preferences for disposing of stolen goods between 2005 DUMA respondents and 2022 respondents to the current study.
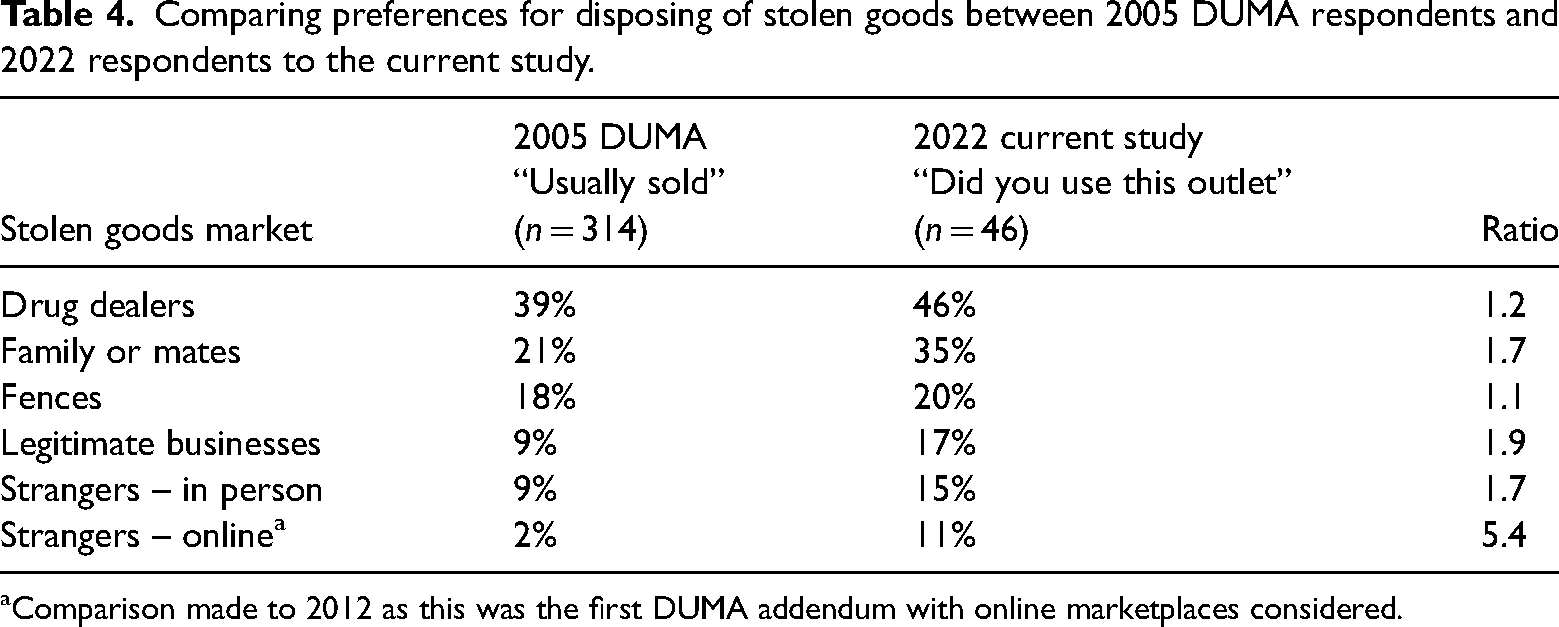
Comparison made to 2012 as this was the first DUMA addendum with online marketplaces considered.
Discussion
Overview of main findings
The representation of different stealing offence types among this police detainee sample was similar to the police detainee sample in the latest iteration (2017) of the DUMA stolen goods survey addenda (see Clare et al., 2022). Notably, this supports the contention by Clare et al. (2022) of a meaningful shift of police detainees (who report committing stealing offences) towards shoplifting and away from the other listed stealing offences. In addition to trends indicating stealing for personal consumption, stable craved items (Wellsmith & Burrell, 2005) such as gold and cash are still highly desired by those engaging in acquisitive crime, whereas small electronic items are no longer highly sought after by property offenders (discussed by Clare et al., 2022 in terms of consumer price index trends for these distinct categories of goods). Drug dealers and family/mates are still the preferred outlets when stolen goods are sold. Goods can still be disposed of quickly and easily through all the traditional outlets, with some indication that there is a growth in the use of online markets and selling to strangers when disposing of stolen goods (a shift that Quinn et al., 2023a described as a move towards “fishing” and away from “hunting” for a buyer). Finally, the relative value of about one-third of the original purchase price received for stolen goods seems to have remained stable across the period of interest. The remainder of this section discusses the potential implications of these results for theory and practice and then poses some limitations of this methodology that could be addressed with future research.
Theoretical and applied implications
From a theoretical perspective, these findings are supportive of the importance of opportunity (Felson & Clarke, 1998), the CRAVED framework (Clarke, 1999; Quinn et al., 2023b), and offending-specific expertise (Clare, 2011; Nee et al., 2017) in explaining current offending choices relating to offence type and target selection, as well as long-term changes in target selection and disposal methods. The detainees who reported stealing something in the 12-months prior to August 2022 were least likely to have done so through a residential burglary: trends consistent with the decline in cash usage (and, by extension, availability in households for stealing) and the dramatic reductions in the timespan of product lifecycles for small electronic items combining to reduce the likely return on this type of offence. As argued by Quinn and colleagues across a number of papers (Quinn & Clare, 2021a, 2021b; Quinn et al., 2022, 2023b), this general decline in reward from acquisitive crime is likely contributing to the reductions in the frequency that people commit burglaries, the move towards stealing for personal use, and the increase in the proportion of burglaries that have entry but no loss.
From an applied perspective, these findings have relevance to and are interpreted with respect to addressing the motivation for offending on the one-hand by targeting addiction-related acquisitive crime, while also working to reduce the opportunity for successfully completing property crime using crime scripts (e.g., Leclerc, 2017) and the market reduction approach (Sutton, 1998). Consistent with previous Australian research, this study demonstrated drug-dealers still play a pivotal role in the stolen goods disposal chain, with a large amount of these transactions processed directly for drugs. The relationship between economically motivated crime and the need to fund drug addictions has been clearly established for many years (e.g., Cromwell et al., 1991; Wright & Decker, 1996). Once again, as advocated by Clare et al. (2022), the patterns demonstrated here point to the importance of disrupting drug markets and implementing initiatives to support those with drug addictions as potential intervention points to reduce property crime.
Thinking through the before-, during-, and after-offending time periods (as per a crime script approach), these findings suggest several ways insight into what property offenders are doing can be useful to prevent crime. First, knowing that offenders are preferencing retail outlets and shoplifting for specific types of items provides a first step for collaborative initiatives between criminal justice entities and the private sector to make it harder to successfully steal highly CRAVED items. Second, these results provide contemporary support to the benefit of attempts to in-build mechanisms that will reduce the saleability of desirable products (e.g., kill switches in mobile phones). Third, thinking after the crime occurs and following the market reduction approach, it is advisable that efforts continue to seek to reduce the opportunity to sell stolen property. One way is to increase prosecutions of people found to have received stolen property (an offence that is infrequently charged relative to acquisitive offences in WA). In addition to this, and acknowledging the increasing use of online markets, more can be done to reduce the suitability of the main opportunities for this in Australia. In a context of dramatic increases in online purchases (Australian Bureau of Statistics, 2021), and findings that 4% of survey respondents would purchase items online through a legitimate second-hand goods site even if they believed the item to be stolen (Quinn et al., 2023a, plus a further 22% of respondents who indicated they were unsure if they would), it is important to consider ways that these sales environments can be made less suitable for the distribution of stolen goods. This could be done through a combination of reporting options for buyers to flag suspicious adverts, increased regulation of these spaces to require greater identification from sellers, and artificial-intelligence options that automatically scan and report suspicious adverts based on properties of the photographs, descriptions, and seller-profiles (Quinn et al., 2023a).
Limitations and future directions
Despite the consistency of the methodology involved with this work and the similarity of important findings produced by this study with earlier, related work, it is important to discuss how future work could improve and extend the current approach. This data was only collected from one police watchhouse during a short period of time. Further to this, the sample of self-reporting 12 property offenders were primarily involved with shoplifting and many were not detained on this instance with respect to acquisitive crime. When considering the representativeness of the sample and the potential influence of the study's location, it is important to emphasise a couple of points. First, this group was mainly shoplifting, with a divide between those who exclusively stole to keep things and those who sometimes sold/traded things. Those who did sell things were most likely to dispose of the goods they took via drug dealers and with their family/friends. As discussed, above, this matches patterns of disposal from previous, related work. Furthermore, watchhouses and prisons have been shown to produce equivalent results relating to stolen goods targets and disposal when compared to unidentified active burglars (Wright & Decker, 1996). In aggregate, therefore, it is reasonable to believe the current findings are generalisable. That said, however, future research into these specific sub-groups of offenders (steal to keep vs. sometimes sell) would be beneficial, particularly when considering opportunity-focused, prevention strategies and it would be beneficial to gain a greater geographic coverage of these trends across other Australian jurisdictions. It would also be valuable to examine the investigation of retail-specific offending through the lenses of offender expertise and the effectiveness of current prevention strategies to combat offending. Based on what is known about the non-randomness of crime across very specific geographic areas and the high prevalence of repeat victimisation (SooHyun et al., 2017), knowing more about issues like specific types/chains of retail outlets that are (not) being targeted and what does (not) work from an offender's perspective to deter stealing would be very useful from an applied crime prevention perspective.
Conclusions
These results demonstrate there is ongoing utility in asking offenders about their property crime decisions. Knowing more about crime preferences, target preferences, and disposal of stolen goods provides timely information and useful avenues to continue to reduce the opportunity for property crime into the future. The authors wish to conclude by advocating for an ongoing commitment to monitoring these trends with a partnership approach between criminal justice agencies and the private sector, to design out crime and implement targeted crime prevention in retail and in online markets to reduce the accessibility and disposibility of highly desired items. This approach can have a beneficial impact on reducing the overall volume of property crime without the corresponding need to increase arrests and prosecutions.
Footnotes
Acknowledgements
The authors would like to thank the Western Australian Office of Crime Statistics and Research for funding this project. Thanks also goes to the Western Australian Police Force for providing access to detainees and for additional data support. This research would not have been possible without the Western Australian Department of Justice (the Department). The findings presented within this paper cannot be considered as either endorsed by the Department or an expression of their policies or views. Any errors of omission or commission are not the responsibility of the Department.
Declaration of conflicting interests
The authors declared no potential conflicts of interest with respect to the research, authorship, and/or publication of this article.
Funding
The authors disclosed receipt of the following financial support for the research, authorship, and/or publication of this article: This work was supported by the Department of Justice WA/WACSAR Criminal Justice Research Grant Fund (grant number G1006106).