
Abstract
This paper offers a rare, but critical reflection on the importance of replication in the quantitative analyses of “best available” data that rely on iterative data matching algorithms – a warning that all crime data-analysts should heed. Using officially recorded police and courts data from the New South Wales (NSW) Bureau of Crime Statistics and Research, this paper traces the longitudinal criminal trajectories of two NSW birth cohorts (1984 and 1994). It updates earlier analysis conducted on the same two cohorts, providing a more comprehensive set of data for an additional 7 years of observation (to age 27). Importantly, the new data presented in this paper are derived from an improved data-matching process that now includes police warnings, cautions, and finalised court outcomes, and the results drastically alter previous conclusions about the between-cohort differences and their likely contribution to the NSW crime decline. Specifically, this new analysis shows that while fewer members of the 1994 cohort had contact with the police by age 27, they accumulated a greater volume of offences and were, in fact, more violent than their 1984-born peers. Much of the apparent differences reported earlier were a consequence of a considerable shift towards informal processing (i.e., warnings and cautioning) and, to a lesser extent, enhanced algorithms that inform data matching principles and strategies.
Introduction
In memoriam
In honour of the late Professor Anna Stewart, this paper begins by returning to February 2017, when a handful of Australian criminologists, including myself, made the all too familiar annual pilgrimage to the Applied Research in Crime and Justice Conference. The meeting that year was in Sydney, and it was the first time I would publicly present the findings of our (Payne et al., 2018) developmental and life course approach to the trajectories of two New South Wales (NSW) birth cohorts (1984 and 1994). Our focus at the time was on the adolescent years (age 10–18 years) and our hypothesis was that the Australian crime decline (Weatherburn & Holmes, 2013; Weatherburn & Rahman, 2021) was, at least in part, a consequence of a marked shift in adolescent-limited offending. We opined that our considerable coefficients of difference between the two cohorts, just 10 years apart, were likely a result of social and structural changes that have rapidly reshaped (and reduced) the criminal opportunities of our younger generations of would-be offenders.
The paper presentation titled, “Where have all the young offenders gone?” was well received by those in attendance, with one exception. Joining us in the audience was Professor Stewart, a titan of Australian criminology who is universally respected for her innovation in quantitative and longitudinal design. Herself an architect of Australia's only other criminology-based birth cohort study (located in Queensland), Professor Stewart queried the magnitude of the differences seen in our analysis of the NSW-born 1984 and 1994 cohorts. She noted that no general or widespread phenomenon could affect such a large decline in one jurisdiction without there being some evidence of the same in neighbouring jurisdictions. For the remainder of the conference, we talked on several occasions – debated even – but after some detailed cross checking of code and data, we agreed to disagree.
Eight years on, this current paper serves to commemorate Anna's indefatigable commitment to research rigour with evidence, finally, that she was right. We document how an incidental effort to update our earlier research has since uncovered major differences between two “best-available” data extractions for the same birth cohorts. We conclude that new data matching protocols, coupled with a foundational change in data compilation principles revealed that the decline in crime (specifically between cohorts at comparable ages) was not as large in magnitude as we had previously thought, nor was it necessarily a product of changes in youthful offending. We take this opportunity to revisit what really happened to young offenders in NSW now that a full complement of finalised court outcomes and police cautions and warnings data are available.
Literature review
Starting with the United States in the early 1990s (Zimring, 2006), crime rates in many Western countries have taken a remarkable turn, ending decades-long upward trends. In the United States, for example, serious violence (homicide in particular) fell by an estimated 50%, while property crime declined by 43% (Blumstein & Wallman, 2006). Similarly in Canada, the peak in crime ended in 1991, with recorded crime declining by over 40% through to the early 2010s (Brennan, 2012; Ouimet, 2002). Across the Atlantic, Western Europe also experienced notable declines (Aebi & Linde, 2010). In England and Wales, for example, property crime was down at least 60% by 2015 (Farrell et al., 2011; van Dijk et al., 2022) while in The Netherlands, Sweden, and Germany, crime rates were also retreating (by a magnitude of between 50% and 70%) from the historical highs of the 1980s (van Dijk et al., 2022). In Asia (specifically Japan and South Korea) and the Pacific region (Australia and Aotearoa New Zealand), the downward trend didn’t start until almost a decade after the United States, but still the declines were considerable (see for example, Mayhew, 2012). In Japan, for example, burglary rates fall by more than 70% between 2002 and 2016 (Farrell et al., 2014). 1
Australia has also experienced a substantial decline in aggregate crime rates since the year 2000 (Moffatt et al., 2005, Weatherburn et al., 2014). According to Weatherburn and Holmes (2013), and later Weatherburn and Rahman (2021), Australia's most populous state (NSW) saw a decline of up to 50% in the rate of theft offending, and a decline of 33% in the rate of robbery over a 12-year period. The downward trends in assault and other violent offending were lagged and not as large, but still there was a general decline across all major categories of recorded crime – the magnitude of which Clancey and Lulham (2014) later estimated had saved NSW some $5.15b. Importantly, NSW was not an outlier in the Australian context (see e.g., McCarthy, 2021). Many of our other jurisdictions also recorded considerable declines in overall crime rates, driven predominantly by falls in property and other acquisitive violent crimes. For example, in the same period (2000–2012) burglary was down by 22% in the Northern Territory, 40% in Western Australia, Victoria, and Queensland, 55% in South Australia, 63% in Tasmania, and 69% in the Australian Capital Territory (ABS, 2013).
What caused the crime decline remains somewhat of a mystery. As outlined by Farrell et al. (2010), there have been multiple efforts to explain the phenomenon, but only some have been tested (either in full or part). These include the potential influence of demographic changes (Blumstein, 2000), increases in immigration (Wadsworth, 2010), increased prevalence/ incidence of abortion (Donohue & Levitt, 2001), increases in the prison population (Baumer et al., 2018; Donohue & Siegelman, 1998; Marvell & Moody, 1994; Spelman, 1994, 2006) as well as the use of alternatives to imprisonment (Roman, 2022), changes to policing strategies (Zimring, 2011), increases in police numbers and resources (Eck & Maguire, 2000, Levitt, 2004), changes to gun laws (Duggan, 2001), changes to drug markets (Levitt, 2004), reductions in childhood exposure to airborne lead pollution (Reyes, 2007) and improvements in the quality and availability of psychiatric medications (Finkelhor & Johnson, 2017; Stephenson et al., 2013). More recently, scholars have pointed to a number of additional explanations, including changes to routine activities, reduced binge drinking, increased parental supervision, and reduced preferences for risk-taking (Baumer et al., 2021; Keyes et al., 2020; Näsi et al., 2024; Svensson & Oberwittler, 2021; van der Laan et al., 2021).
In Australia, the most comprehensive analysis was provided by Weatherburn and Rahman (2021) in their book, The Vanishing Criminal, where they explore the empirical validity of a constellation of hypotheses only to conclude that the crime decline was likely the result of several interconnected factors (but not the ones most often touted in the international literature). Specifically, Weatherburn and Rahman (2021) dismiss as “unlikely” or “implausible” the introduction of abortion laws, exposure to latent atmospheric lead, improvements in psychiatric medication quality and availability, increases in immigration, the introduction of gun laws, the use of capital punishment (which is not available in Australia) and a strengthening of social institutions. Instead, they argue that the Australian crime decline was likely the result of several interconnected factors – some with only limited effect. Specifically, Weatherburn and Rahman (2021) argue that, in Australia at least, there were six interrelated factors which coincided to precipitate the decline in crime. These were: a fall in the demand for stolen goods (a consequence of an improved economic outlook, a fall in unemployment, and a change in consumer preferences); an increase in the ratio of police to crime; an increase in police effectiveness; an increase in the risk of imprisonment (see Wan et al., 2012); a decline in the use of cash transactions; and an ageing population demographic. There was also some reference to the improved security of households and businesses, including the widespread use of new security tools such as car immobilisers, electronic locks, and CCTV (see Weatherburn et al., 2016), although this was described as being of “limited” contribution.
Efforts to adjudicate the various hypotheses presented in the international literature have regularly reflected on an important empirical finding that appears consistent across different international contexts. Specifically, that the crime decline appears to have been disproportionately large among younger populations and that explanations must account for this seemingly youthful phenomenon (Bateman 2014; Griffiths & Norris, 2020; Matthews & Minton, 2018; McCarthy, 2021; Polglase & Lambie 2024; Svensson & Oberwittler, 2021). In the United States, for example, Farrell et al. (2015) found the overall crime decline was largely a consequence of substantial declines in the offending of adolescent populations. To explain this, the authors introduced the “debut crime hypothesis”, arguing that the offence types most commonly committed by young, first-time offenders (such as status offences and less serious property crimes) had become harder to commit, meaning that fewer young people had contact with the police and a smaller proportion of the population overall would later become ensnared in prolific criminal trajectories.
In Australia, to explore the crime decline through a developmental and life-course lens, Payne et al. (2018) conducted the first longitudinal analysis of two NSW birth cohorts (1984 and 1994) to compare those whose adolescence’ straddled opposing ends of the crime decline in that state. The 1984 birth cohort included adolescents at a time when NSW crime rates were at their highest and increasing year on year (1996–1999), while the 1994 cohort included adolescents during a period when crime rates were substantially in decline (2006–2009). The objective was to identify any comparative differences between the two cohorts that might shed further light on the relative contribution of youth offending to the overall crime decline.
To execute the study, Payne et al. (2018) obtained records for the 1984 and 1994 cohorts from the NSW Registry of Birth, Deaths and Marriages. The names and dates of birth were then used by the NSW Bureau of Crime Statistics and Research (BOCSAR) to extract records from their reoffending database, also known as the Reoffending Database (RoD). At the time, efforts were made to replicate the work of Hua et al. (2006); scholars from BOCSAR who had earlier studied the criminal offending profile of the 1984 birth cohort also using the RoD. At the time of extraction, RoD was the single largest and most comprehensive database of unit records for individuals who’d had contact with the NSW criminal justice system and it remains one of Australia's most widely used sources for individual-level and longitudinal criminal career analysis. Importantly, to maintain consistency with Hua et al. (2006), the data extract from RoD was limited to only those members of each cohort who had at least one finalised court appearance for a proven offence. The analysis showed that between the 1984 and 1994 cohorts there had been: (a) a substantial decline in the cumulative prevalence of criminal justice system contact (see Figure 1(a)) up to and including age 20; (b) that the difference between the cohorts started at around the age of 13 or 14 (early adolescence); and (c) that the decline was greatest for property offences, though still substantially lower (by approximately 20%) for violent offences. The authors argued that several factors likely contributed to the decline. These were: (a) securitisation, which not only affected how many young people “debuted” into crime, but also how often young people offended; (b) broad social and cultural shifts among youth populations, from in-person and on-the-street “play” to online activities, with a commensurate increase in parental supervision; and (c) changes in the criminal justice system processing of young people.
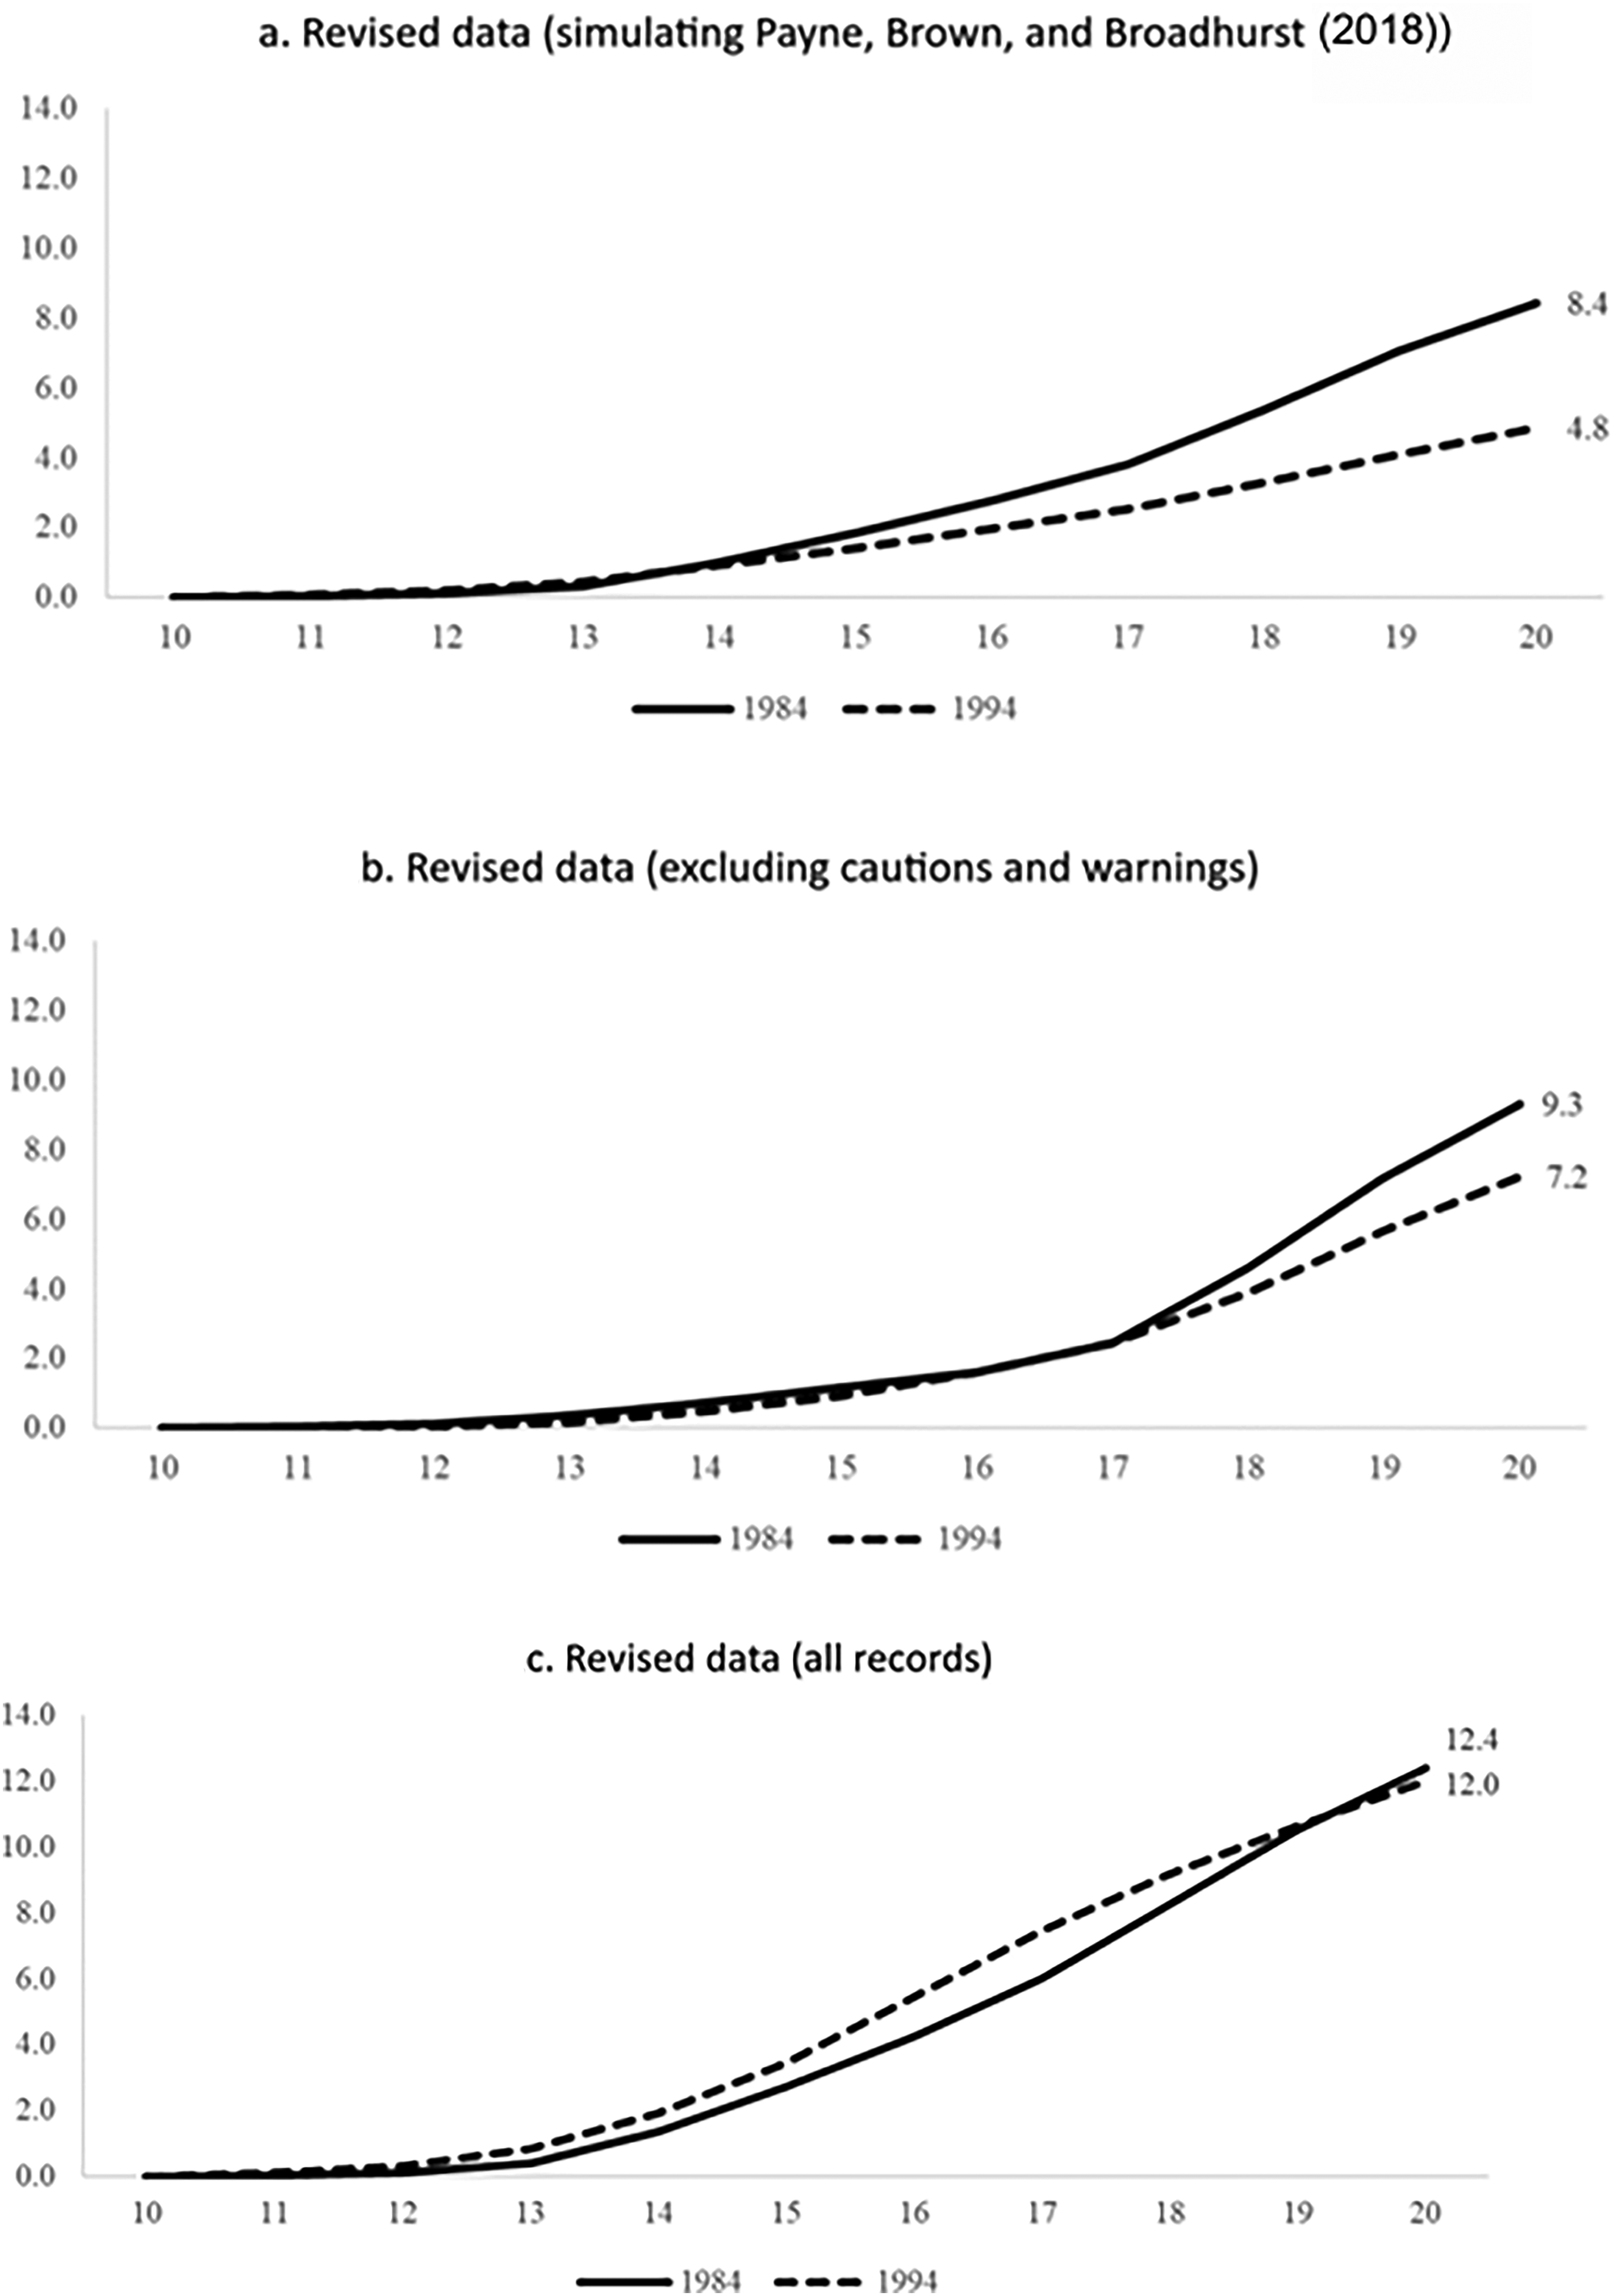
Cumulative Prevalence of Contact (%) to Age 20 (1984 and 1994 NSW Birth Cohorts).
Reflections on methodology and design
A key limitation of the study by Payne et al. (2018) was the decision to focus on court-finalisations as a threshold for identifying and classifying offenders. At the time, that decision was made in an effort to remain consistent (for replication purposes) with the earlier work of Hua et al. (2006) and follows a long-standing debate in criminology about what, in terms of administrative data, should be used to classify people as offenders and quantify their offending (Payne, 2007a). At the time, the authors opted for a conservative measure, because court finalisations are often used as a benchmark where a guilty verdict (whether by guilty plea or a finding of guilt in a contested matter) is the standard legal threshold for criminal conviction. Of course, while many people, for many reasons, come to the attention of the police for behaviour and actions that might constitute a criminal offence, there is a view that it would be unethical to count these people and their behaviour as “criminal” where there is no finding of guilt.
A consequence of this decision was that cautions and warnings (as defined under the Young Offenders Act (NSW) 1997) were excluded. To be sure, this made the data a reliable replication for the same cohort examined by Hua et al. (2006), but risked introducing a design effect that could have considerable bearing on the comparisons between the 1984 and 1994 cohorts. Cautions and warnings are a special case of non-court actions that required no finding of guilt. Typically, however, there is agreement to the facts of the alleged offence. These are options available to the police for processing young people outside of the court system and with the view to reducing the negative (and often cumulative) consequences of formal processing. They have the additional advantage of saving criminal justice system costs and reducing criminal trial delays in an already stretched court system (Payne, 2007b). Importantly, although cautions do not constitute a formal conviction, there is an expectation that the facts of the alleged offence are “agreed”. Technically, then, cautions and warnings are “proven” offences in so far as the allegation of criminal conduct is considered “substantiated”, and in the case of cautions, it is accepted by both the police and the accused.
It is possible that in their efforts to ensure replication, Payne et al. (2018) focused on between-cohort differences for those who had been convicted in court precisely at a time when cultural and procedural changes likely meant that fewer young offenders were being processed through the courts. Consequently, the same cohort (1984) may have inadvertently introduced an inconsistency affecting their ability to draw comparisons between cohorts separated by time and procedural changes in youth offender processing.
In addition to the above, BOCSAR (in personal communication) now also utilise a superior and improved data matching algorithm which, for any given match, yields a larger number of matched records. Specifically, in early iterations of the RoD data matching procedure, the algorithm placed considerable weight on the availability (or not) of middle names and would only yield a positive match where the status of the middle name (i.e., missing or not missing) was the same across all records. Further, multi-word or hyphenated surnames were split into separate words and passed through a separate search procedure for each unique combination of first name and surname. Finally, there was strict adherence to the ordering of each component of a person's name, meaning that there was no account for the possible transposition of first, middle and surnames. In more recent years, the RoD matching algorithm no longer requires an exact status-match on the presence/absence of middle names and the logic for multi-word surnames has been improved and incorporated into every matching condition. Finally, the new procedure incorporates rules which allow the re-ordering of first, middle and surnames, in an effort to resolve the common problem of data entry transposition.
Overall, we might expect this updated data linkage algorithm to have produced a larger volume of records – in addition to the cautions and warnings that were not previously included. The most likely reason is the improved flexibility that has now been afforded to the availability (or not) of a person's middle name. In birth registry data, for example, we expect all middle names to be recorded against every record where such a name is recorded at the time of registration. The same is not likely to be true with police and court records where middle names can often be omitted or missing. With greater flexibility to deal with the presence/absence of a middle name, coupled with rules that overcome data transposition error in the order of each name element, we expect there to be more “matched” individuals with a higher overall number of records.
Aims
The aim of the current study is to re-examine the differences between the 1984 and 1994 birth cohorts using a full complement of proven offence data now that the RoD data matching algorithms have been enhanced. In doing so, we also seek to update Payne et al. (2018) with data that follows both cohorts to age 27 (previously age 20) and examine how the two cohorts have tracked from their adolescence into early adulthood. To this end, three research questions guide this study: (a) to what extent does the availability of cautions and warning data, together with an improved record linkage, alter estimates of the 1984 and 1994 birth cohorts’ contact with the criminal justice system; (b) to what degree have the differences between the cohorts been sustained to age 27; and (c) do these longitudinal trends vary by crime type and gender?
We expect the inclusion of cautions and warnings, coupled with improvements to the matching algorithm in RoD, will increase the estimated prevalence and rate of offending in both cohorts. Specifically, we expect both cohorts to have a greater number of offenders and a greater number of offences than was previously reported and we expect the magnitude of the difference between cohorts to be smaller because the 1994 cohort were the primary beneficiaries of the formalisation of police cautions and warnings under the Young Offenders Act (1997). 2
Methodology
The methodological approach is the same as was reported in Payne et al. (2018). This study used birth cohort extracts from the NSW Registry of Births, Deaths and Marriages which include the full name, date, and place of birth for all registered births in NSW in the years 1984 and 1994. These data were then supplied to BOCSAR to perform an algorithmic search and extraction from the RoD database. The resulting data were supplied as offence-level unit records, with a non-identifiable unique person-level identification number.
To maintain consistency, we have selected only those offence records that are recorded as “proven”. This excludes “not guilty” offences but now includes non-court or diversion-based actions that require an admission of guilt or where the facts of the allegation were not disputed (i.e., youth justice conferences, cautions, warnings, and cannabis cautions). We also included all unique offence counts as separate offences and coded offence categories according to the Australian and New Zealand Standard Offence Classification (ANZSOC 2017). 3 Population percentages and rates per 100,000 are presented as standardised estimates using the population numbers supplied by the Registry of Births. These were 83,328 births in 1984 and 89,373 births in 1994.
To compare the differences between the data used in Payne et al. (2018) and the most recent extract from RoD, we construct three comparison datasets. The first simulates (to the best of our ability) the specific selection of individuals with at least one court-finalised offence. We remove any individual (and all associated records) who did not record a finalised court outcome before their 21st birthday. We also limit the data to only those records identified using the more stringent matching criteria that exclude flexibility in name swapping and the treatment of missing middle names 4 . We do not remove the cautions and warnings for those who were later finalised in court since, again, these records were in the original extraction. The second simulation is a reduced version of the new data, constructed from the revised data matching algorithm, but excluding cautions and warnings. The third is a set of the full data, using the revised data matching algorithm and including all cautions, warnings, and court finalised offences. This third dataset will be used as the foundation of our new analysis that includes data from age 20 to 27.
Results
Comparison of old and new data
As expected, the new BOCSAR RoD data substantially alters our estimates of the difference in criminal offending between the 1984 and 1994 cohorts. Now that we have visibility of all police cautions and warnings, coupled with a superior data matching methodology, it seems there was no difference between the 1984 and 1994 birth cohorts in terms of cumulative prevalence of contact with the criminal justice system to age 20. Figure 1(a), for example, represents our simulation of the original results of Payne et al. (2018) and shows a roughly equivalent overall difference in cumulative prevalence to age 20 (−43%) and the same timing of divergence (age 13). Compare this to Figure 1(c), which uses the full data from the new extract. Note that the two cohorts have approximately the same cumulative prevalence to age 20 (12.4% and 12.0%, respectively) and that there is no evidence of adolescent divergence in the trend.
It is critical to note that the “old” data and the “new” data are not comparable insofar as Payne et al. (2018) were tracking the trajectories of individuals who were finalised in court, while the new data includes non-court outcomes. To this end, these data suggest that the main driver of the decline observed in that earlier study was a shift away from formal court action against young people, to formal non-court actions such as cautions and warnings. This is confirmed in Figure 1(b) by excluding from the data those offences that were not finalised through a court action. It shows a 23% decline in the cumulative prevalence of criminal justice system contact (to age 20) between the 1984 and 1994 cohorts (9.3%, down to 7.2%).
With the benefit of new data, extracted from a more comprehensive database using improved data matching algorithms, we conclude that there was no decline between the 1984 and 1994 birth cohorts when all offence types and all finalisation types (court finalised or not) are included. This is not to say that Payne et al. (2018) were wrong. Instead, we conclude that a substantial portion of their original estimates were driven by the increased use of cautions and warnings (as an alternative to court actions). This resulted in fewer young people in the 1994 cohort ending up with a conviction in court, even if the overall proportion of young people having contact with the justice system was unchanged.
Table 1 provides a summary for each of the three alternative data formats, including additional information about the cumulative offences counts (to age 20), as well as separate estimates for four different offence types. The results suggest a need to reflect and recalibrate the conclusions drawn by Payne et al. (2018). First, the 1994 cohort is markedly more violent than the 1984 cohort when using the new data. For example, there was a 23% increase in the cumulative prevalence of violence (3.2%‒3.9%) and a 27% increase in the total number of violent offences committed (7162.7‒9080.9) to age 20. Even using the data that excludes cautions and warnings, violent offending was up by 10.3 and 12.9%, respectively, for the cumulative prevalence and cumulative offence count. The reverse was true for property crime, being lower for the 1994 cohort across all three data formats – and substantially lower in terms of both prevalence and volume when using the data that excludes cautions and warnings.
Summary data replication and comparisons to age 20 (1984 and 1994 birth cohorts).
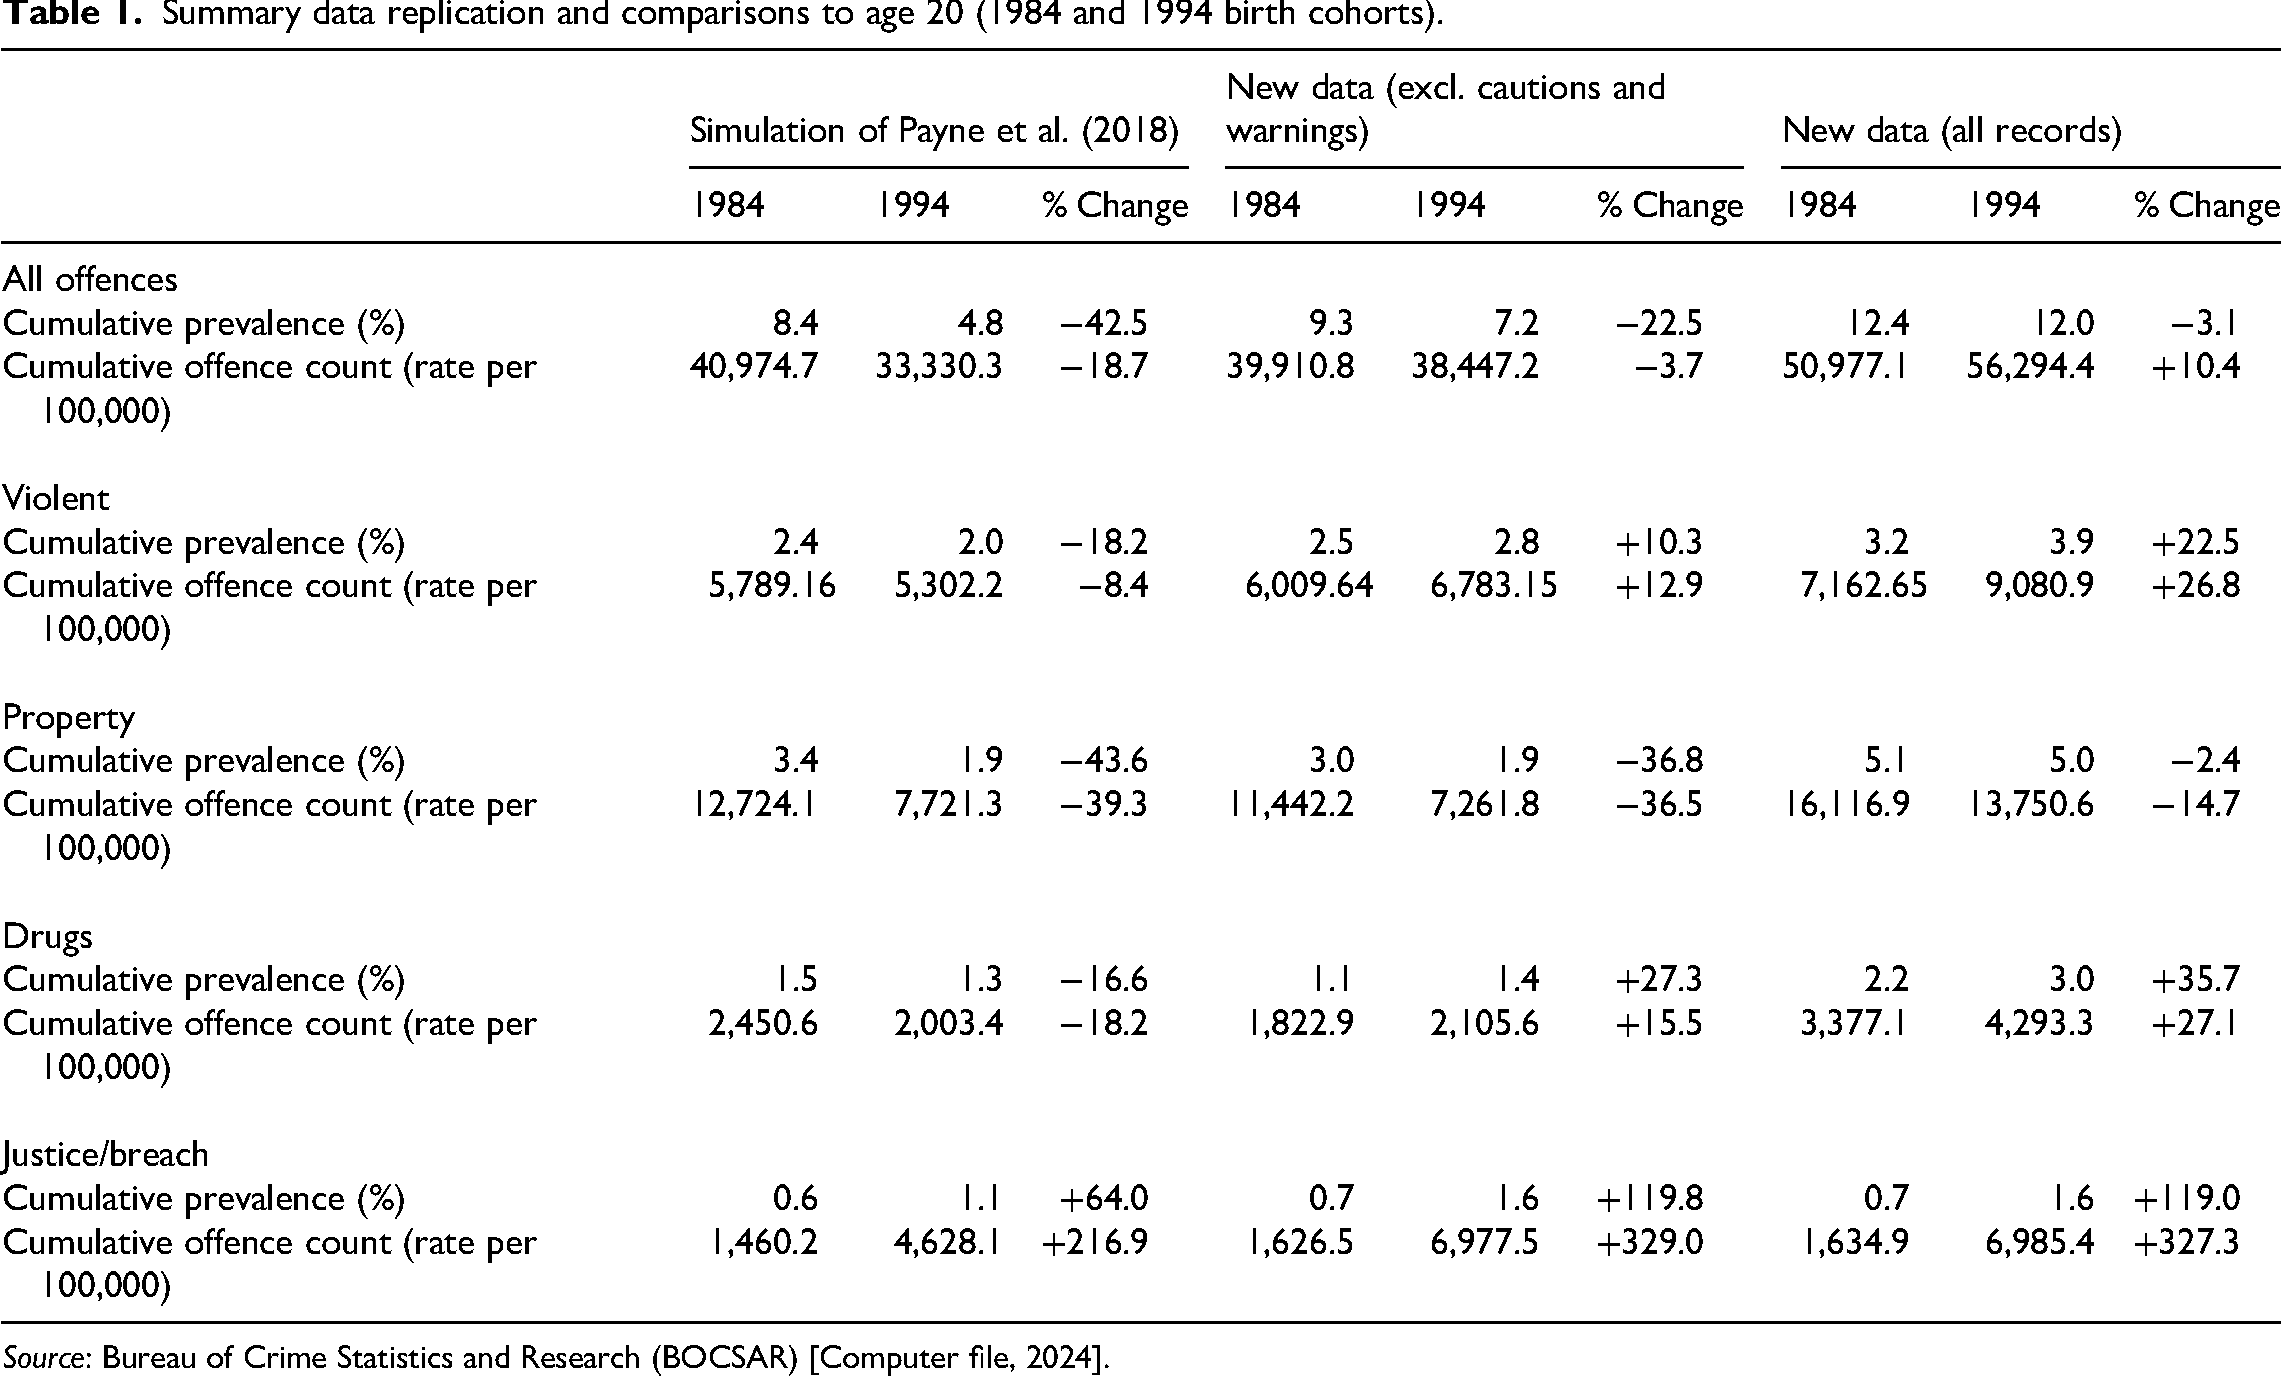
Source: Bureau of Crime Statistics and Research (BOCSAR) [Computer file, 2024].
In comparative terms, these new data should offer pause for thought about what really happened to young offenders in NSW. As it turns out, there was very little overall decline (down 3.1%) in the prevalence of offending and no decline in the volume of offending when tracked through to age 20. In fact, when we combine court and non-court finalisations (i.e., cautions and warnings), it seems the 1994 cohort had accumulated about 10% more offences than their 1984 peers. They were also more violent than previously estimated, more likely to be detected for drug offences, but less likely to be involved in property offending.
As for the observations presented in Payne et al. (2018), these new data confirm that much of the estimated “decline” in crime was a consequence of a shift towards a greater use of cautions and warnings, leading to fewer matters (overall) being finalised in court. Now that we have visibility of these non-court finalisations, we can confirm that the 1994 cohort was less likely to have had contact with the NSW court system, just not less likely to have contact with the criminal justice system as a whole. Finally, it is important not to forget that some of what was presented by Payne et al. (2018) was an artefact of a less flexible data matching algorithm that likely “missed” a large chunk of seemingly mis-matched records. The algorithm, long used for similar extracts from the RoD (Hua et al., 2006), was likely too rigid with the matching criteria for middle names and insufficiently flexible to accommodate transposition errors. It is only with the benefit of time that new methods and procedures have been developed to allow this recalibration.
Extending the trajectories to age 27
Our focus to this point has been on the trajectories of the 1984 and 1994 cohorts to age 20 because this was the maximum age available to Payne et al. (2018). Having now accepted the new data as offering a more comprehensive coverage of criminal justice system contact, we turn to examine how the cohorts differed from each other throughout the transition to early adulthood. Figure 2 extends the cumulative prevalence of the two trajectories to age 27. It also includes a graphical depiction of the hazard rate – defined here has the percentage of each cohort who at each age had their first contact with the criminal justice system – and the standardised offence rate (per 100,000). In all, it shows that a smaller overall percentage of the 1994 cohort (down by 11%) had contact with the NSW criminal justice system compared to their 1984-born peers (17.2% vs. 19.4%). The annualised hazard rate exhibits an earlier and less pronounced “peak” for the 1994 cohort (2.1% at age 17 vs. 2.4% at age 19), and a lower/flatter trajectory thereafter. The comparative offending rates (Figure 2c) indicate a higher overall volume of offending in the early adolescent years and a less pronounced decline in early adulthood.
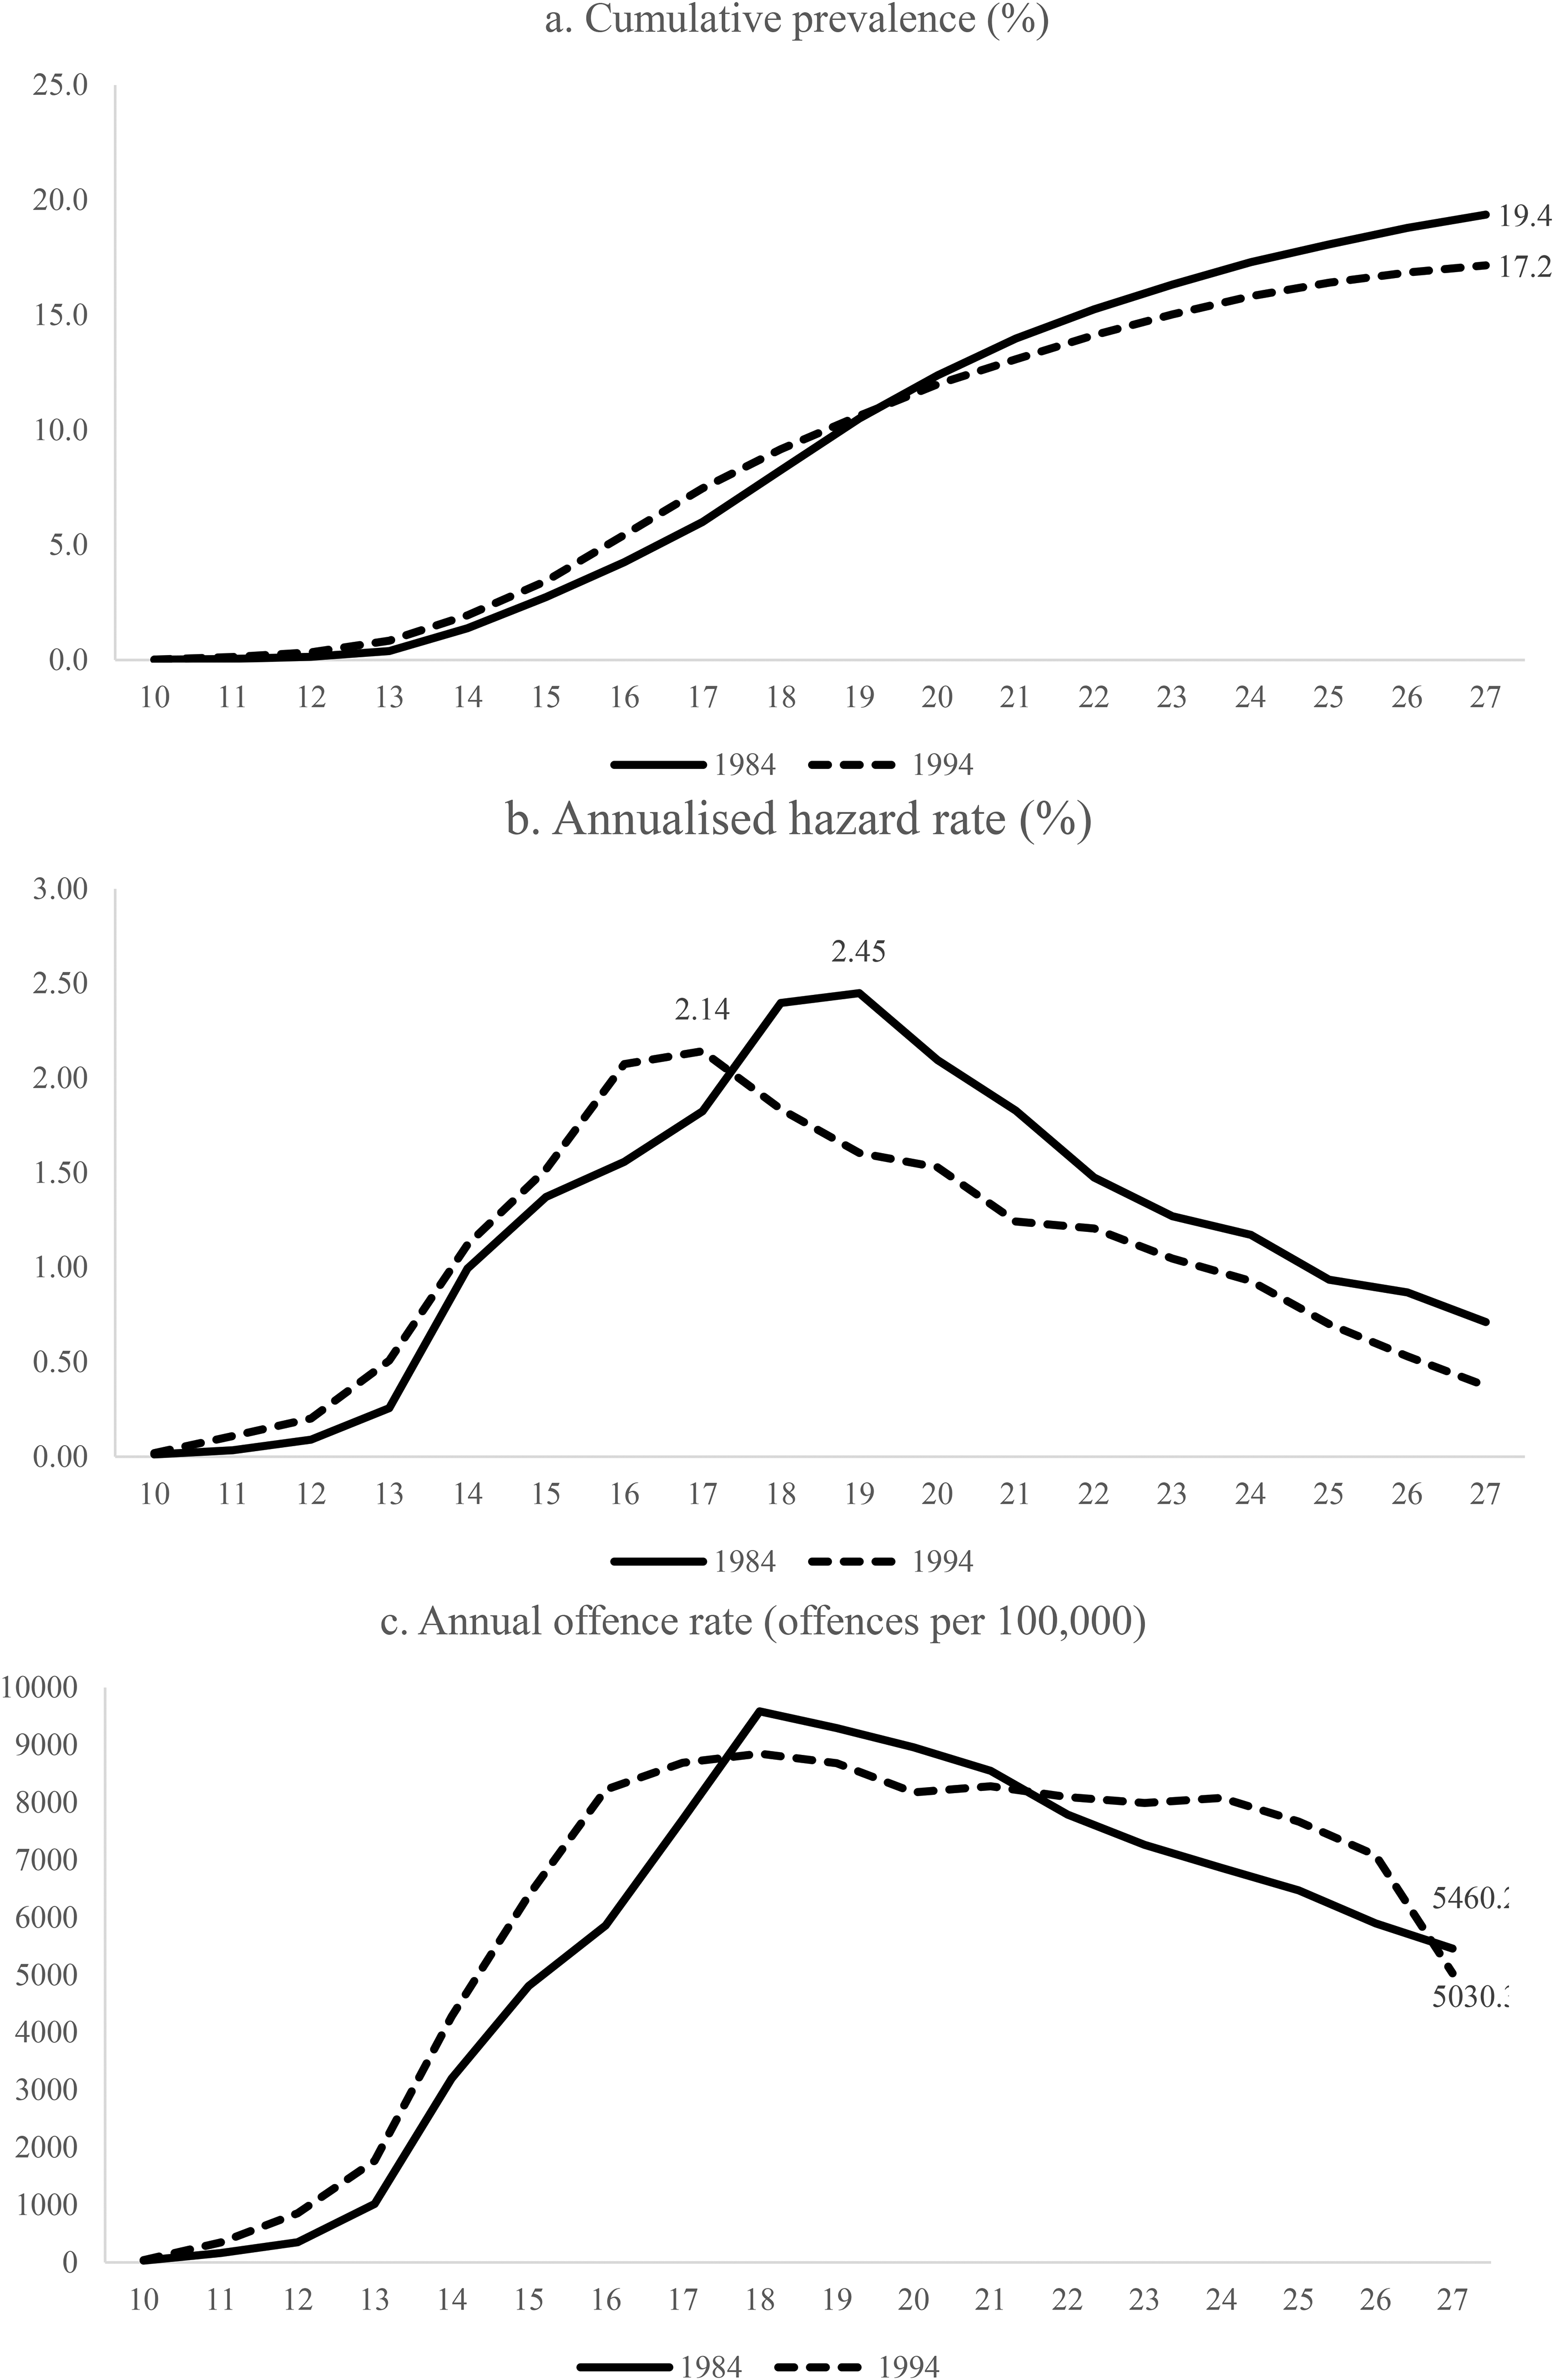
Cumulative prevalence of contact (%) to age 27 (1984 and 1994 birth cohorts.
Table 2 provides a summary of outcomes to age 27, disaggregated by offence type. From this we make a number of observations. First, while 11% fewer members of the 1994 cohort ever had contact with the criminal justice system by age 27, together they were responsible for a higher volume of overall offending. For example, by age 27 the 1994 cohort had recorded 108,523 proven offences, while the 1984 cohort had 99,266 proven offences. This represents a 9% increase in offending volume, despite an 11% decrease in the overall number of people who were classified as offenders. For property crime, there was both a decline (−7.1%) in the number of offenders and the total volume of property offending (−9.9%), while for violent offending the reverse was true – there being a 9.1% increase in the number of violent offenders to age 27, and a 21% increase in the total volume of offending. In all cases, excluding cautions and warnings from the data reduces the total number of offenders and offences in each cohort.
Summary of criminal system contact to age 27 (1984 and 1994 birth cohorts).
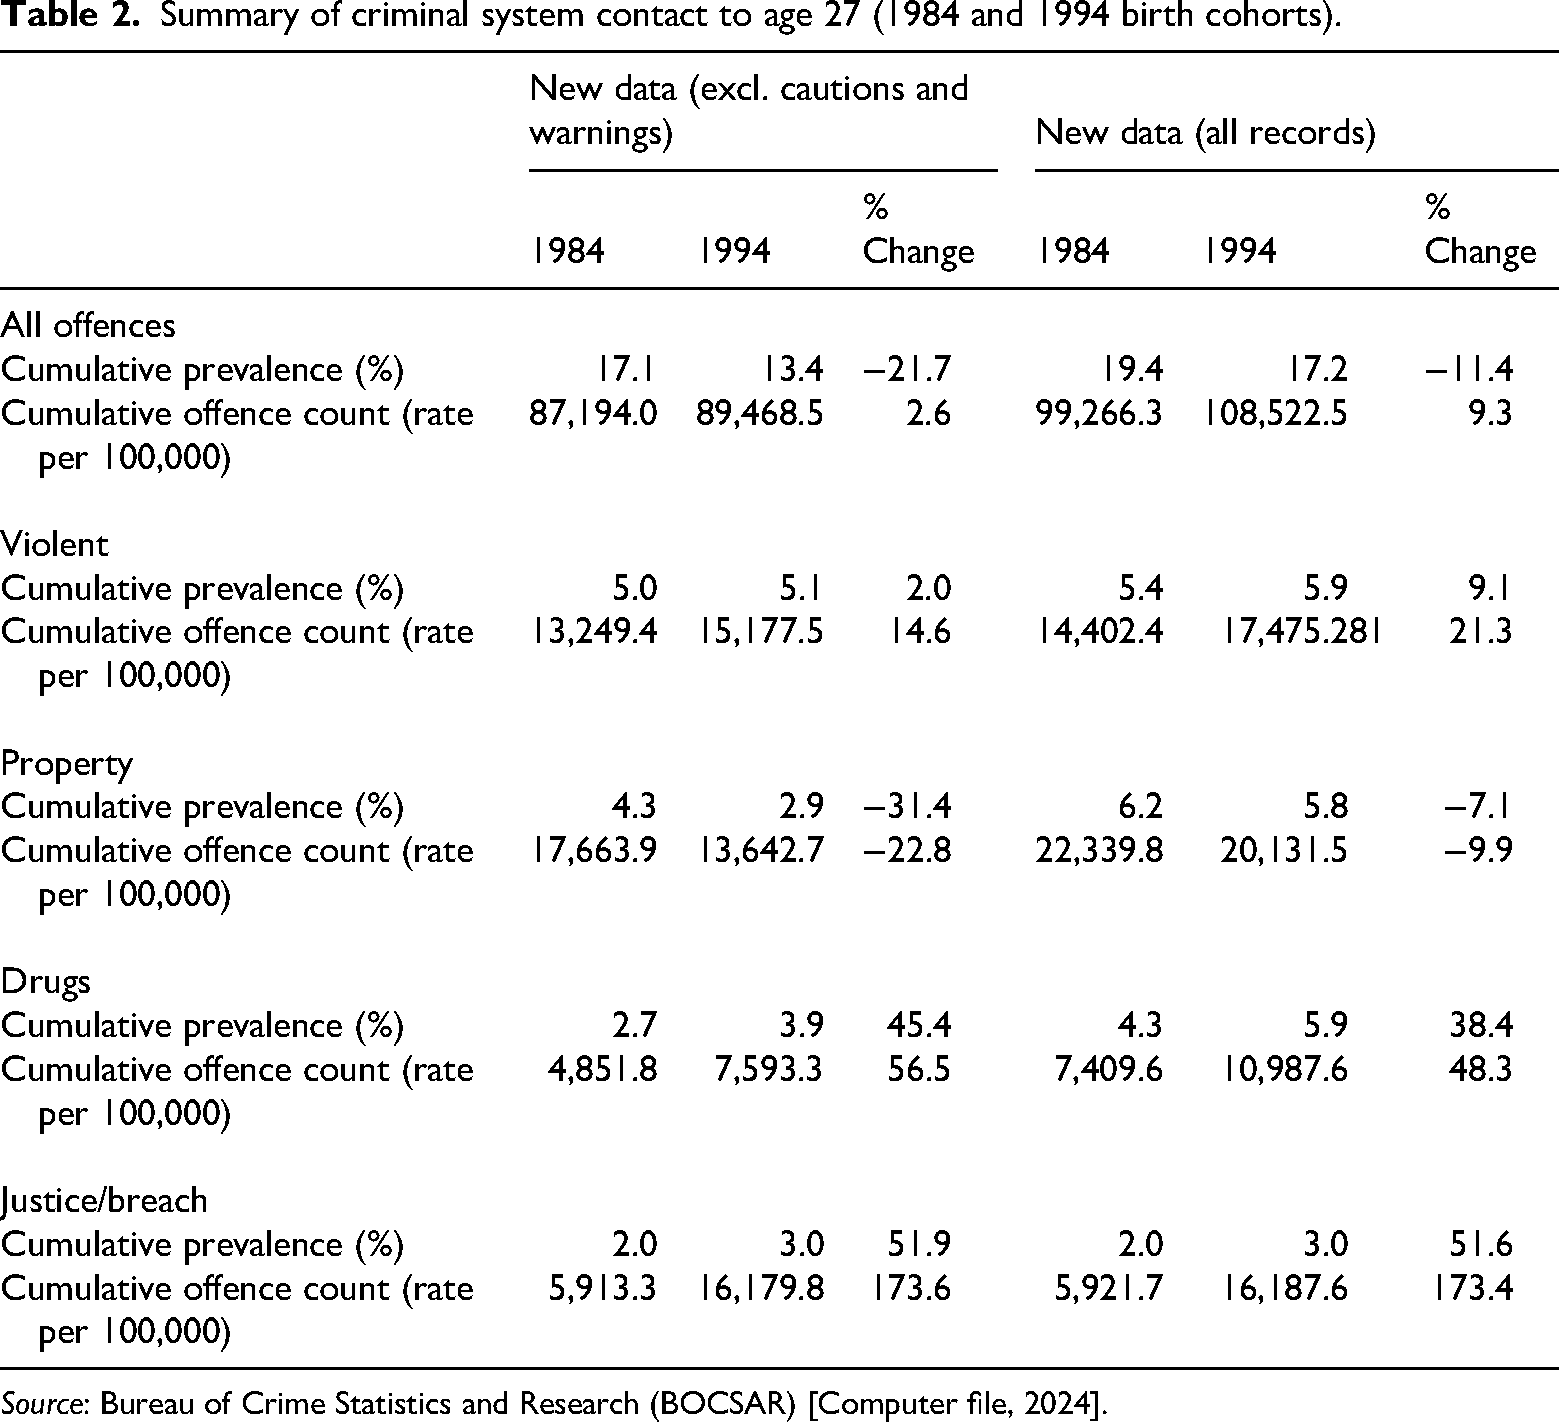
Source: Bureau of Crime Statistics and Research (BOCSAR) [Computer file, 2024].
A distinct advantage of having the trajectories of two birth cohorts is our ability to see how differences unfold for the same groups over time. Figure 3, for example, tracks the age-specific differences in crime rates for property, violent, drug, and justice/breach offences. The differential is calculated by simply subtracting the 1994 rate (per 100,000) at each age from the 1984 equivalent. When the value is higher than zero, the rate of offending for the 1994 cohort was higher than their 1984 peers at the same age. A value lower than zero indicates a lower rate of offending. What is striking about Figure 3 is the very large and temporally specific nature of the decline in property crime, spanning 16–21 years of age. At other ages, before and after this period, the 1994 cohort committed property crime at a higher rate. For violent offending, the 1994 and 1984 cohorts were on par between the age of 10 and 13 years, and then again between 18 and 22 years, while at other ages (14–17 years and 23–27 years), the 1994 cohort were responsible for more violent offending. In terms of drug offending, the cohorts were the same until age 18, after which the 1994 cohort began recording a higher volume of drug offending (per 100,000) at each age, while for justice and breach offending the 1994 cohort had committed a consistently higher number of offences after age 13. 5
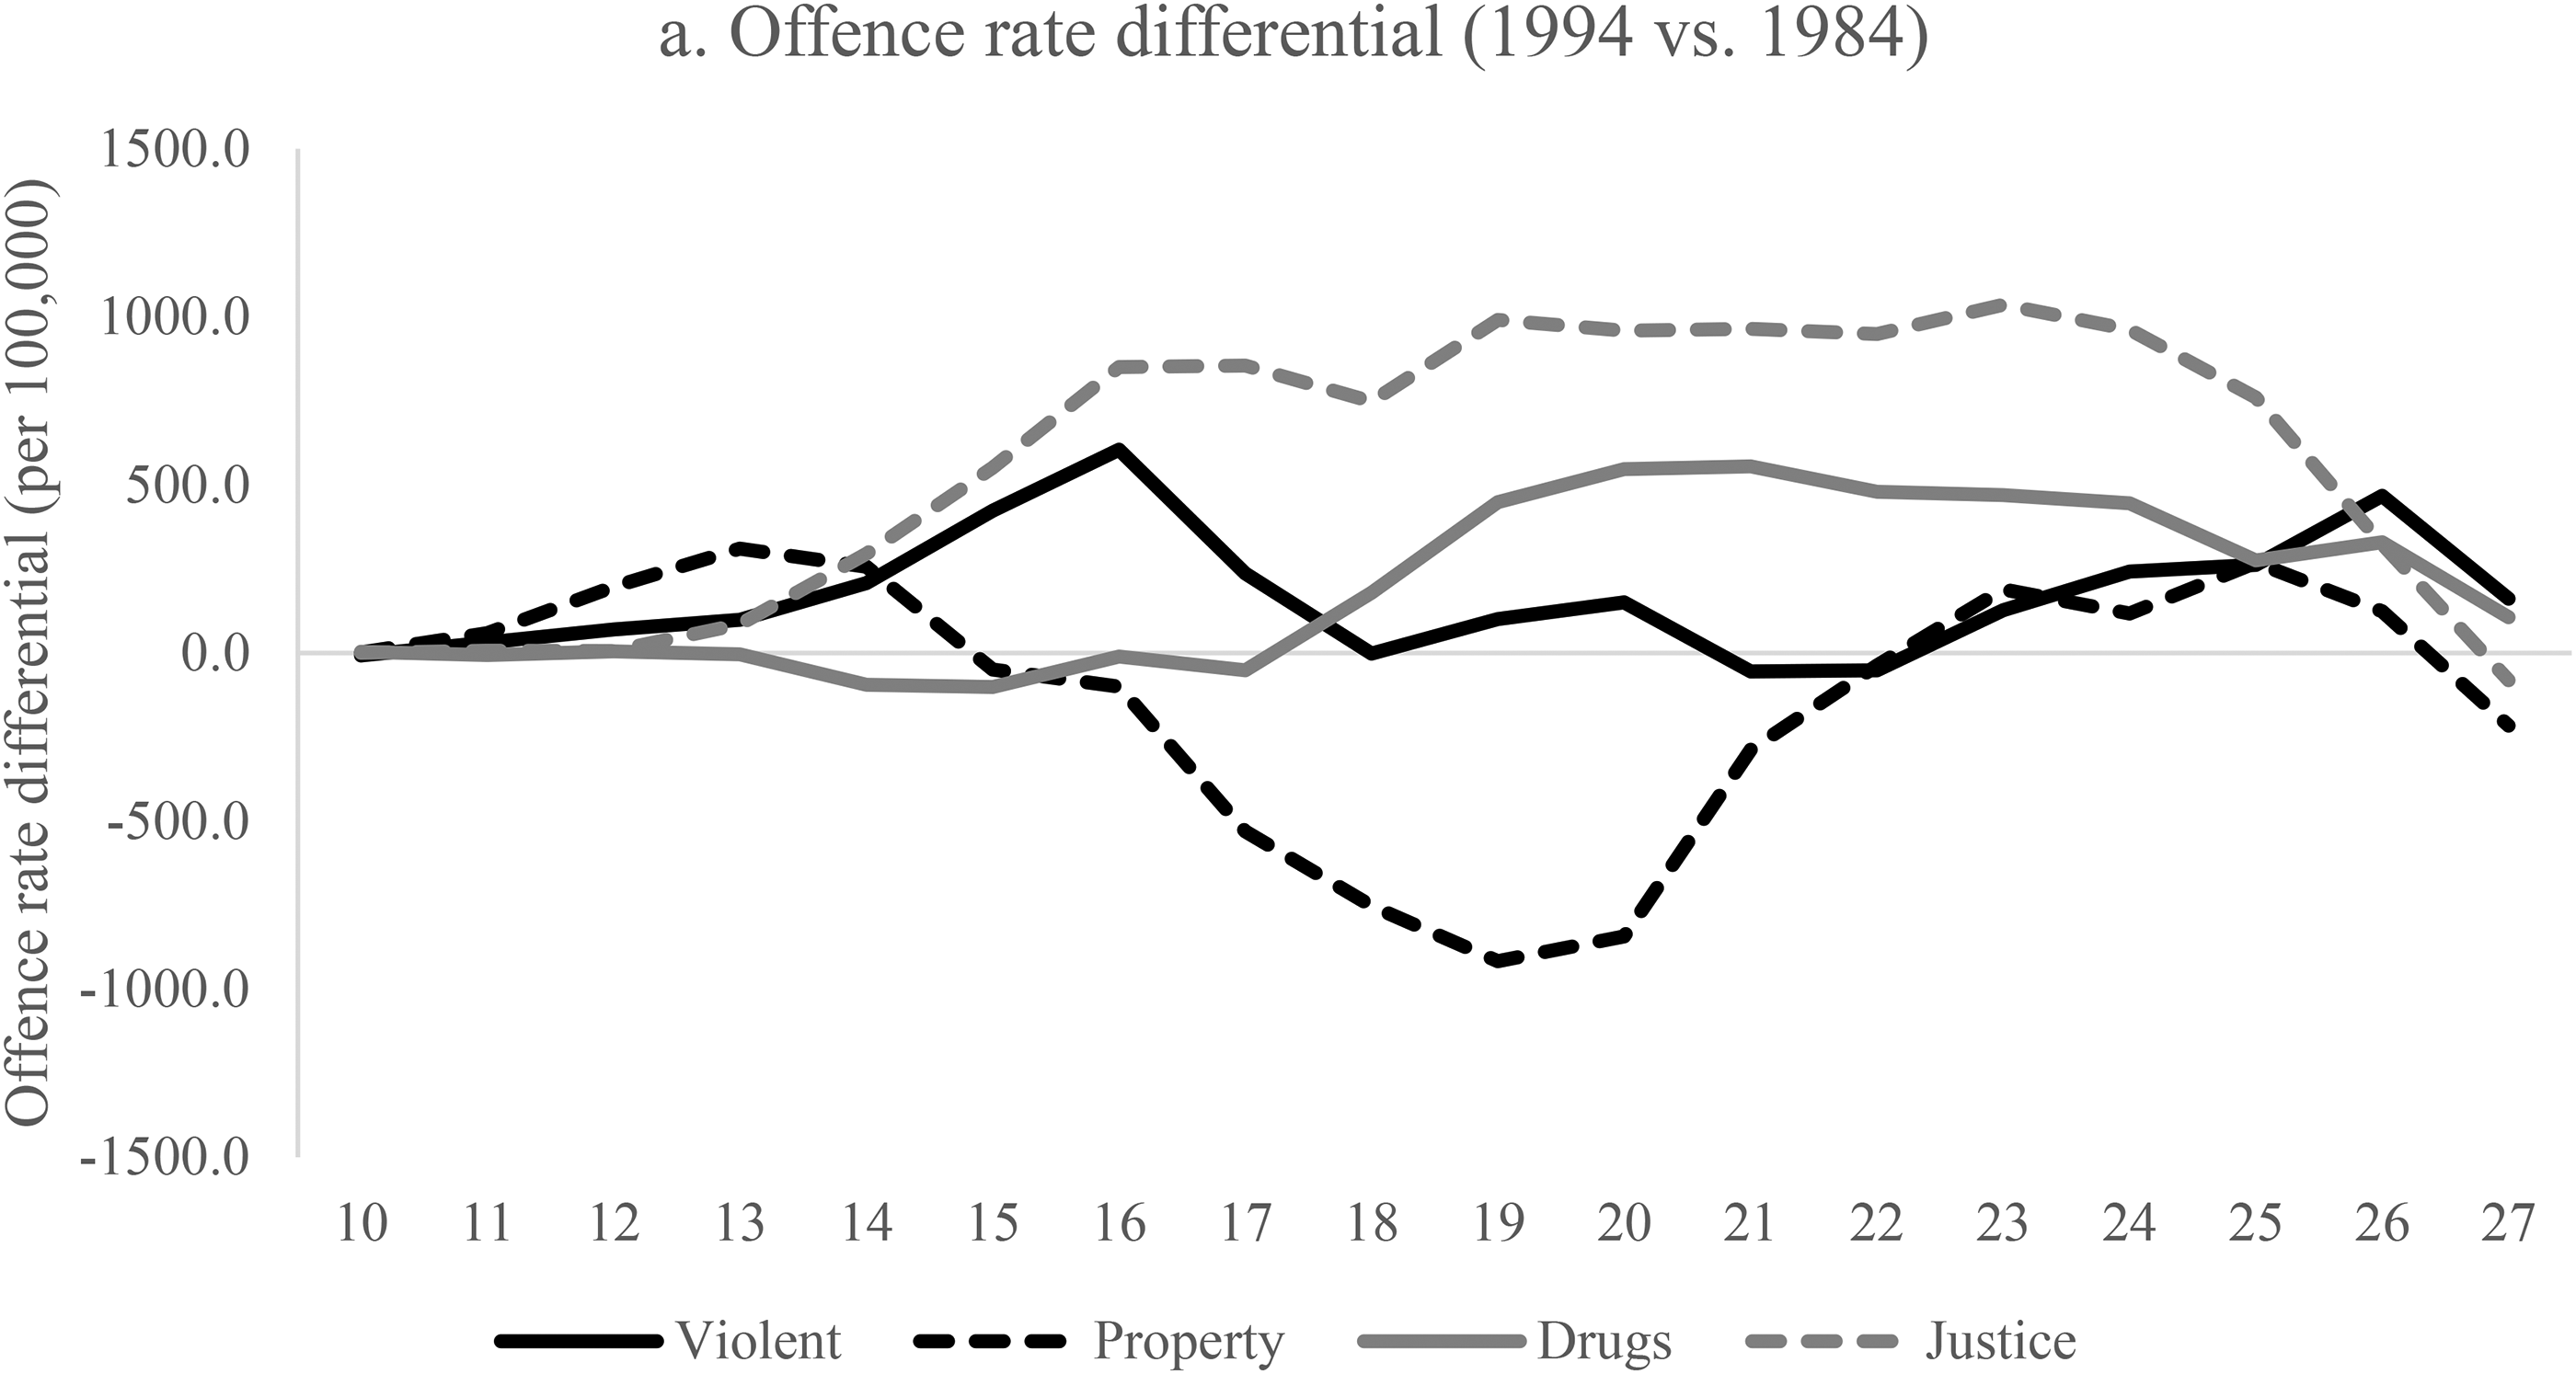
Offence rate differential by age and offence type, to age 27 (1984 and 1994 birth cohorts).
Gender differences
Finally, Figure 4 examines the trajectories for males and females separately. It illustrates that for males, the 1984 and 1994 cohort trends to age 27 mirror those of the combined data. As illustrated by the hazard rates (Figure 4(c)), the 1994 cohort is more likely to have contact with the criminal justice system before turning 18, then less likely in early adulthood. By age 27, a smaller proportion (10%) of males born in 1994 (26.8% vs. 29.7%) had been in contact with the criminal justice system, despite higher rates of contact in their adolescent years. For females, the data suggest a different experience. Young women born in 1994 were 11% more likely to have had contact with the criminal justice system by age 27 (10% vs. 9%). This difference emerges because females born in 1994 had a disproportionately higher rate of criminal justice system contact up to and including age 16 (Figure 4(b)).
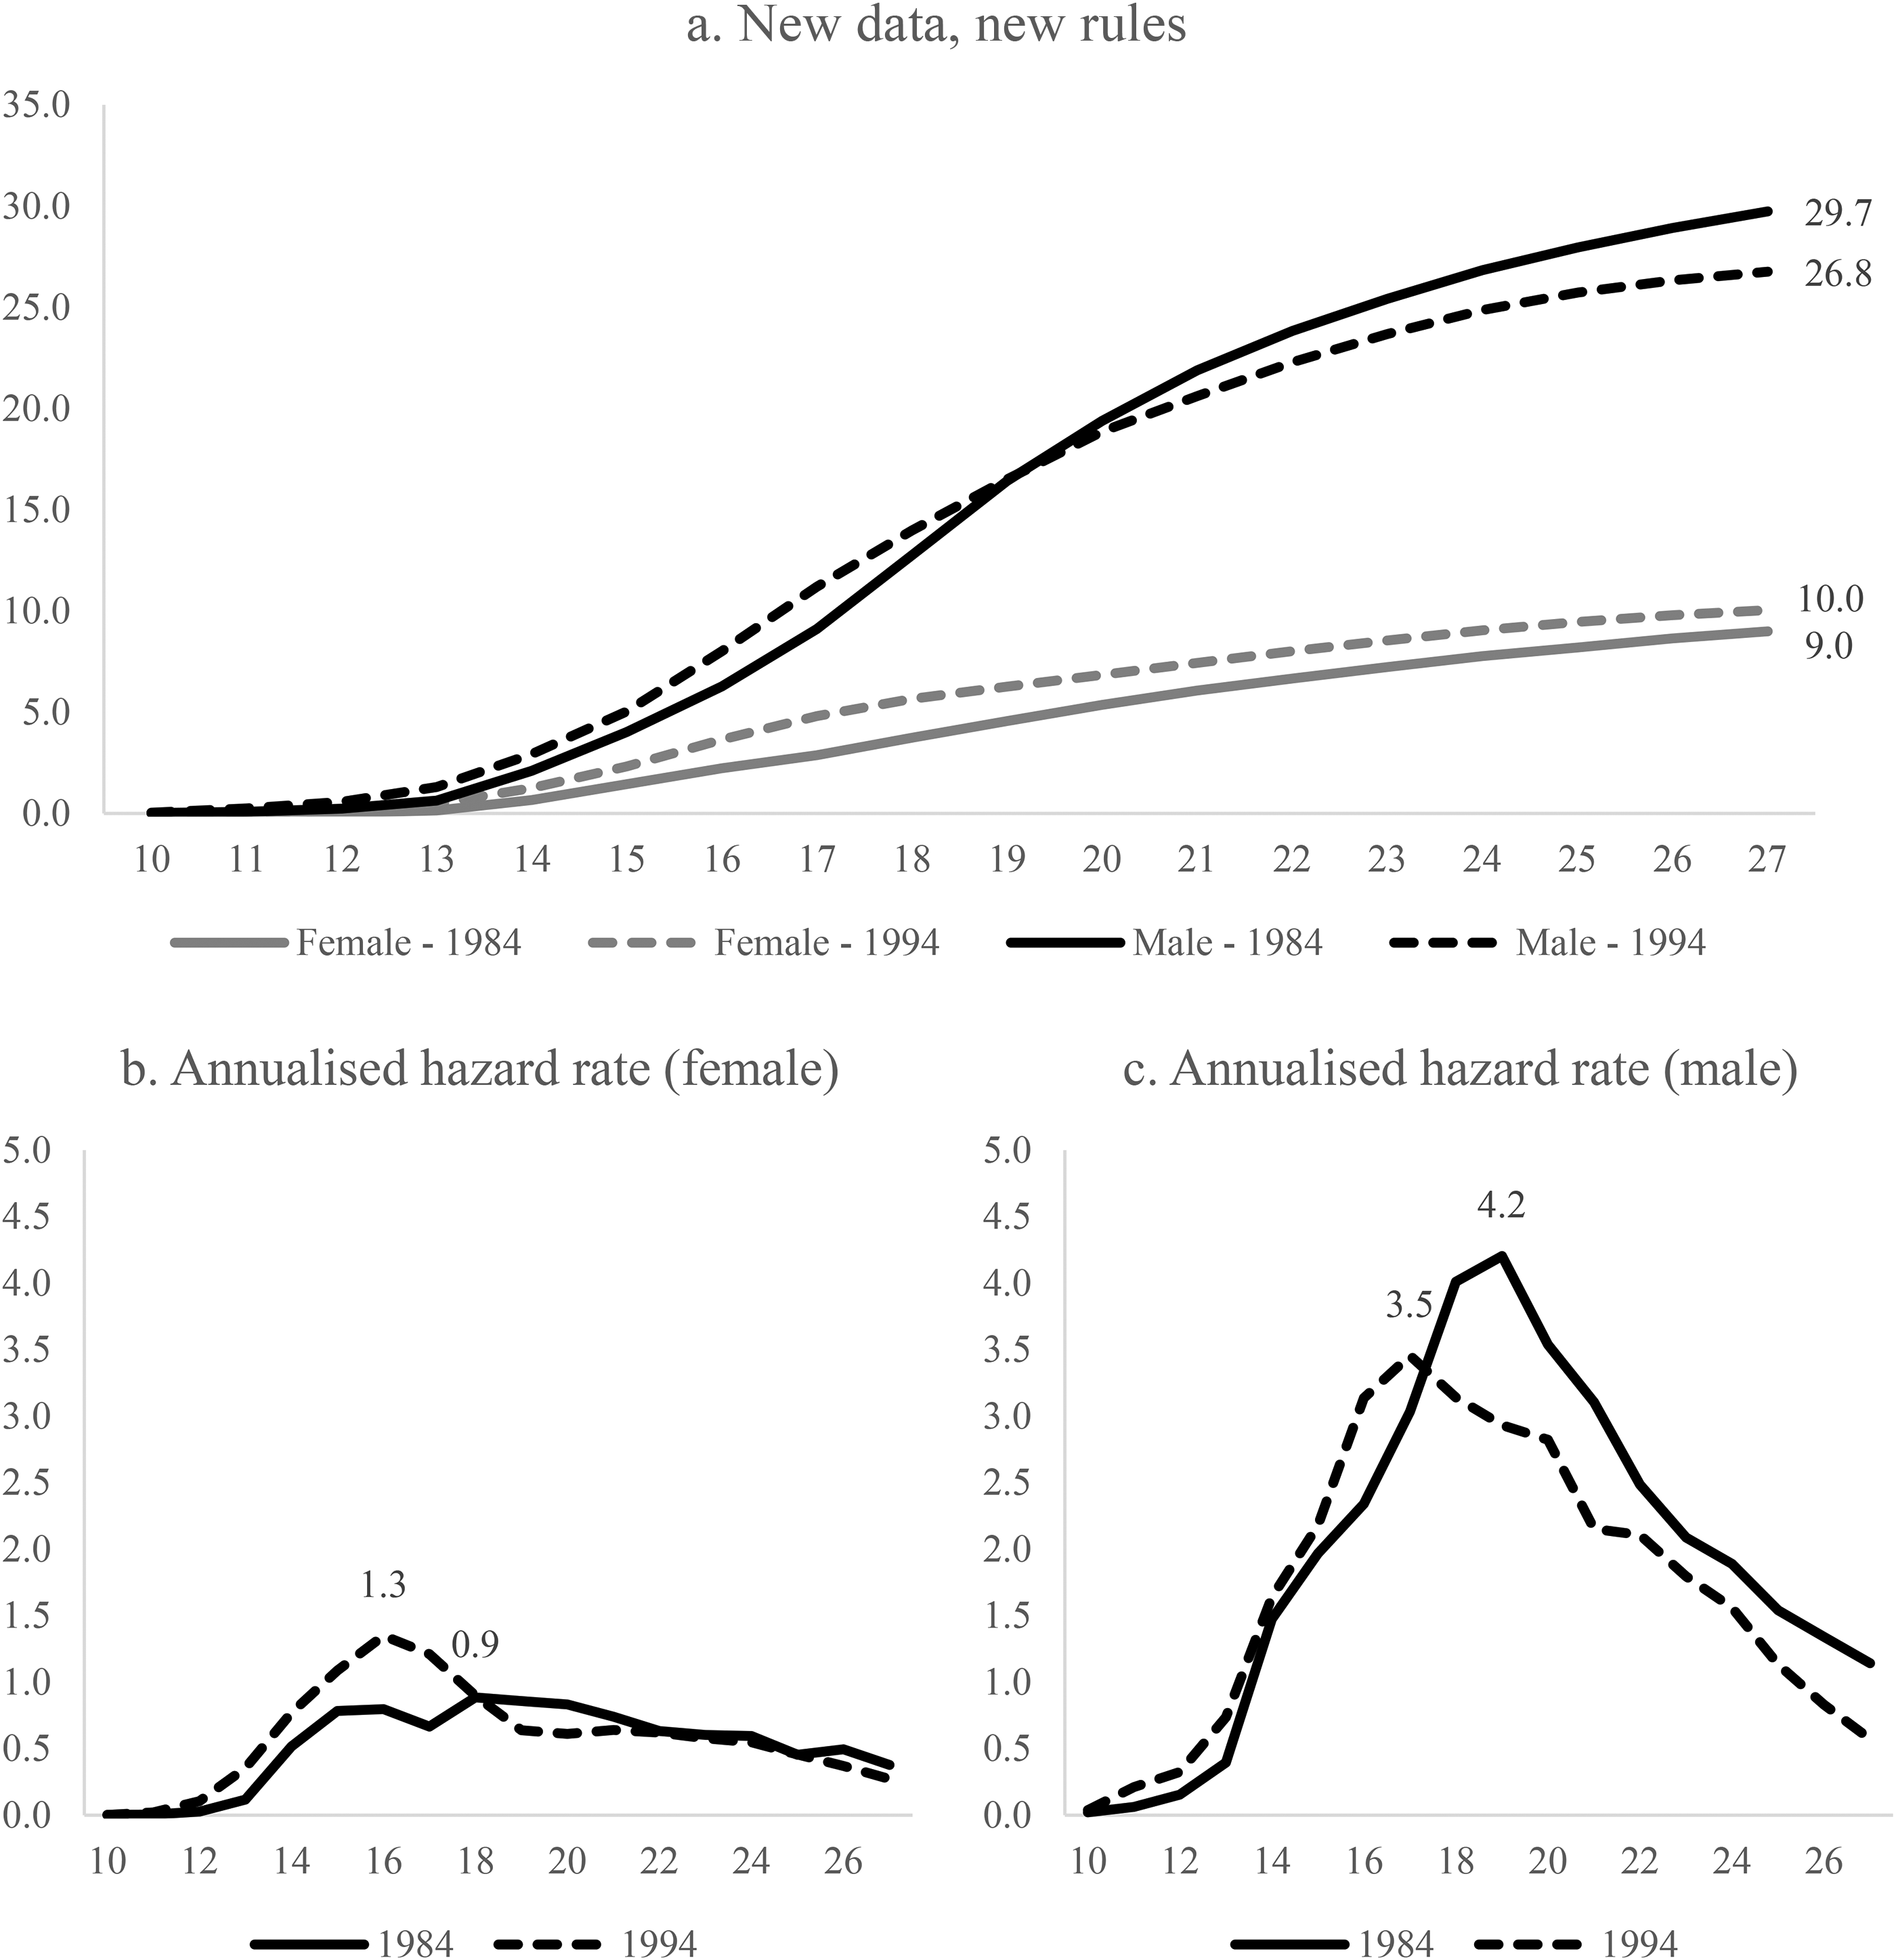
Cumulative prevalence of contact (%) to age 27 (1984 and 1994 birth cohorts).
It is important to note that the annualised hazard rate for males and females (Figure 4(b) and (c)) are presented on an equal scale. Any comparison of the two would suggest a result that consistent is with the generally universal conclusion that young males are more likely to have contact with the criminal justice system at all ages. However, having equalised the scale makes it difficult to assess the relative degree to which the male and female cohorts have changed between 1984 and 1994. An alternative is the estimate of the ratio of the rates from Figure 4(b) and (c) – to show on a common scale the degree to which males and females of the 1994 cohort were different from their 1984-born peers at each age (see Figure 5). Being a rate-ratio, equality is indicated when the ratio of the 1984 and 1994 cohorts is equal to 1 (dotted line). Anything that exceeds one suggested that the 1994 cohort was disproportionately more likely to have contact with the criminal justice system at the relevant age; below one, the 1994 cohort was less likely.
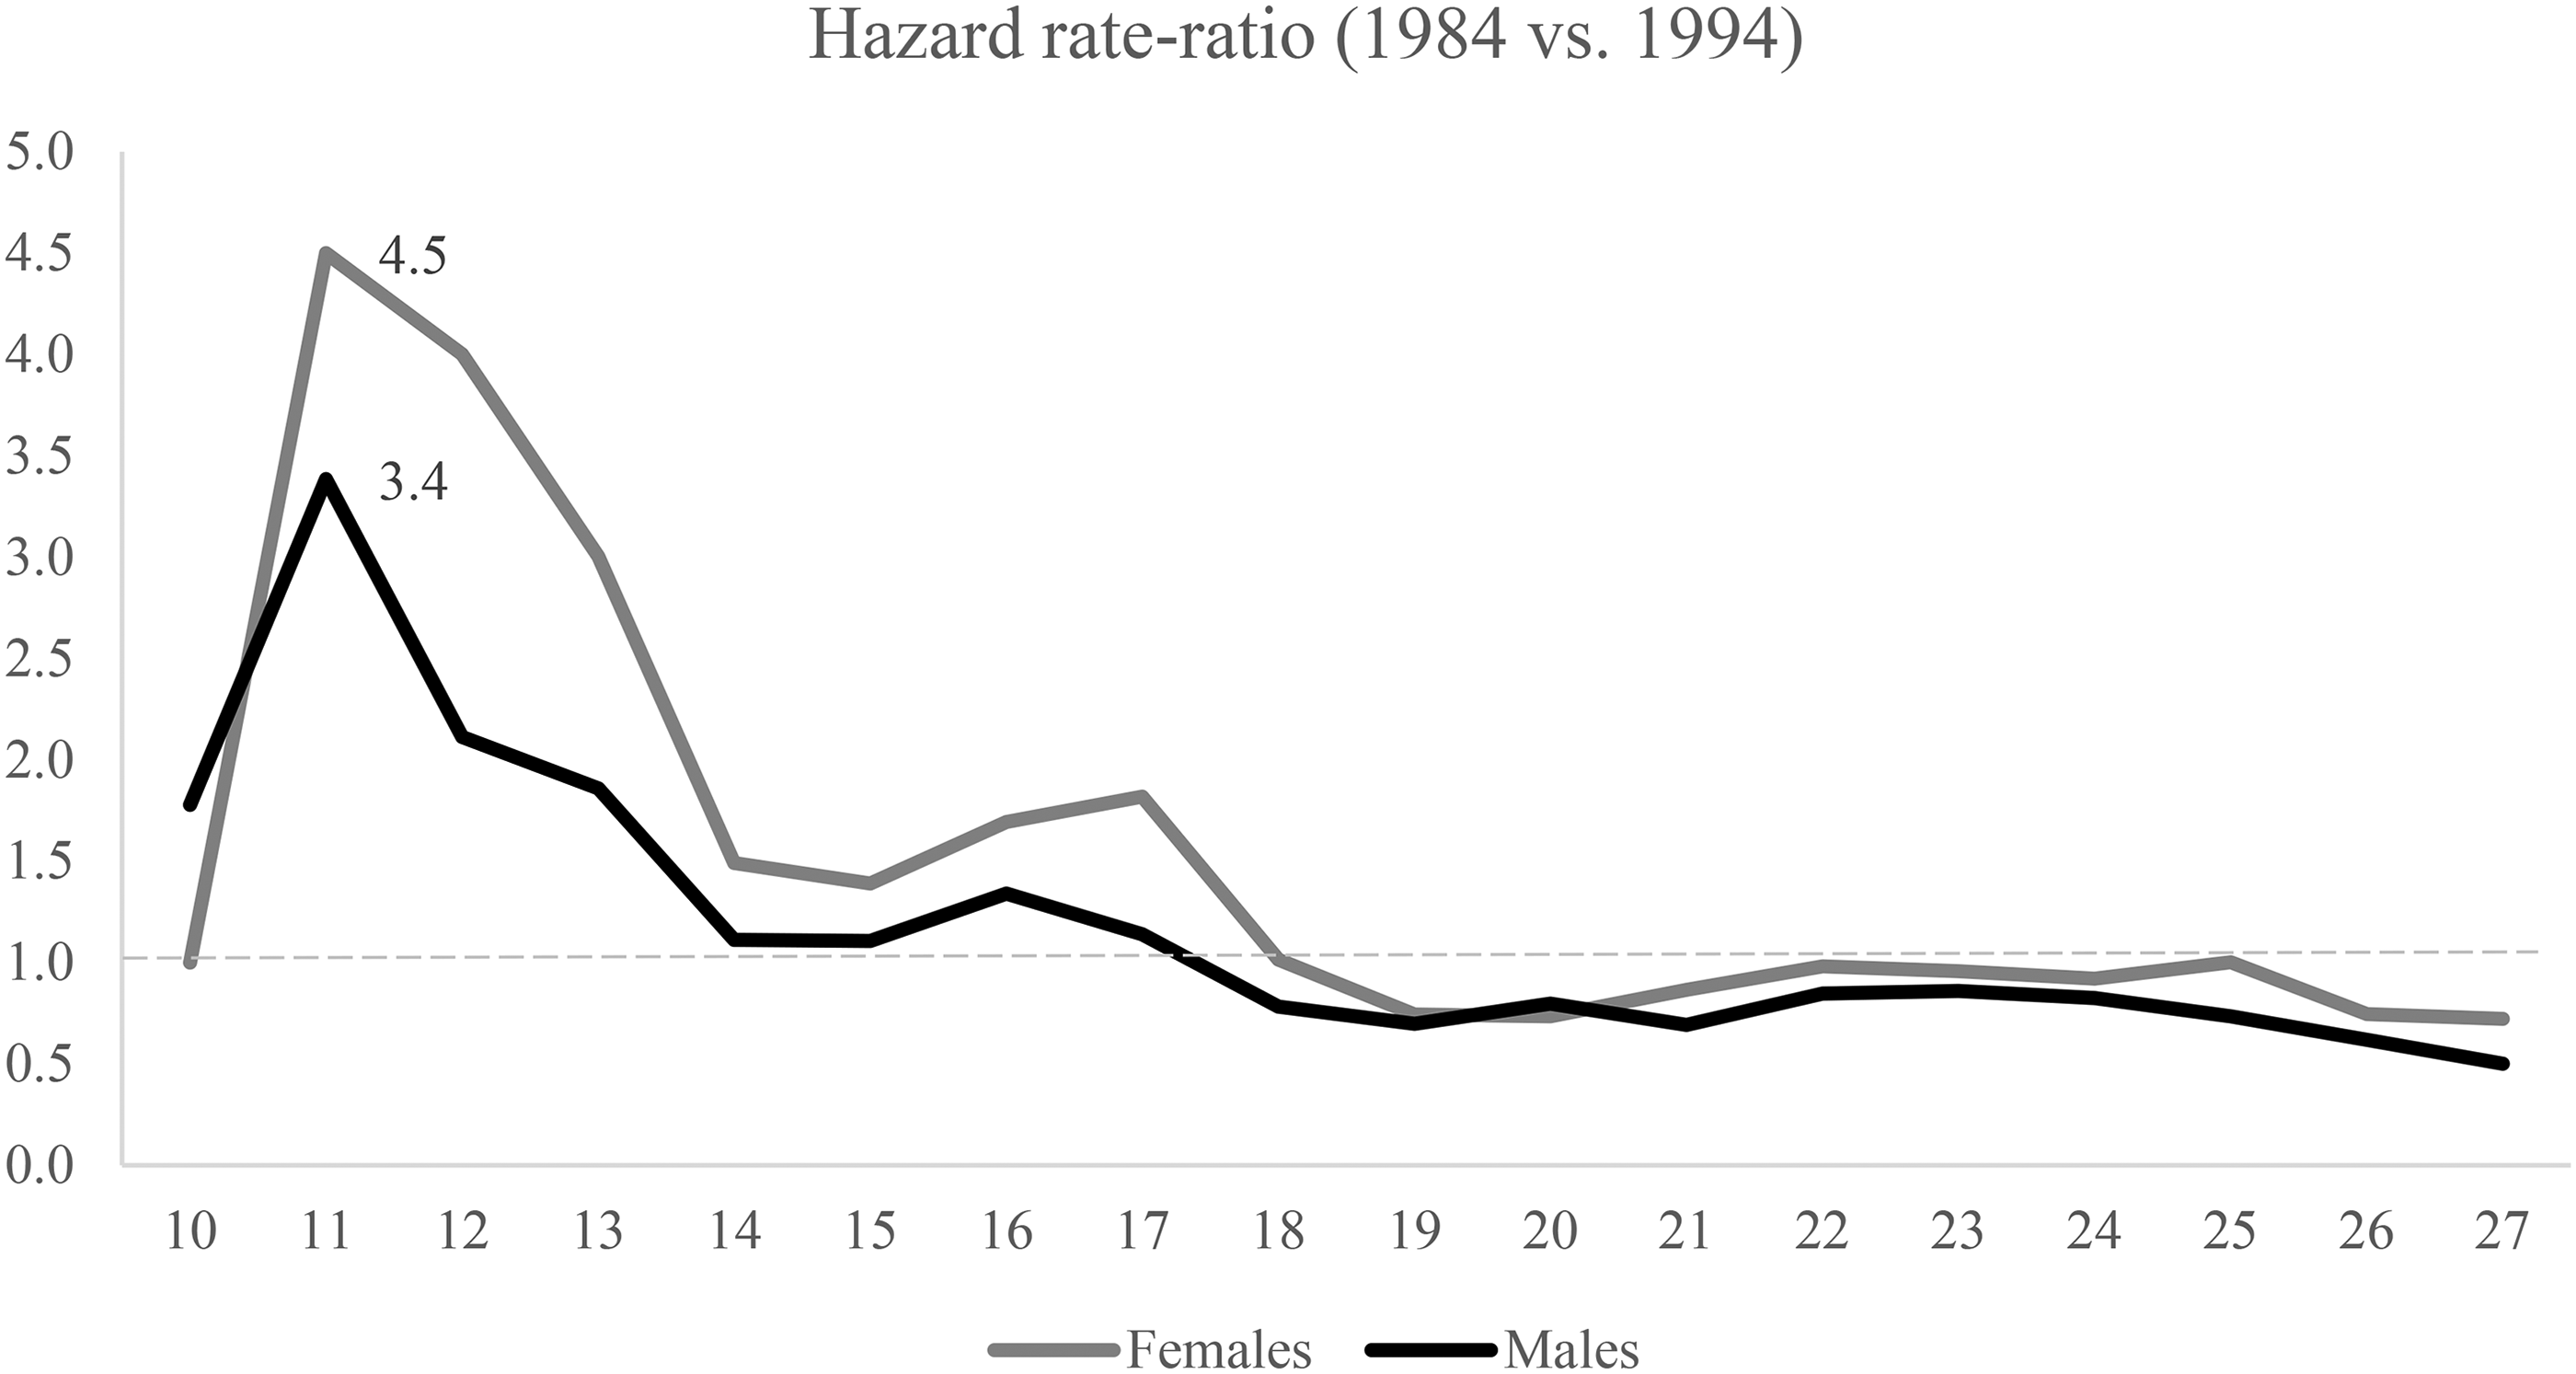
Hazard rate-ratio to age 27 (1984 and 1994 birth cohorts), by gender. Source: BOCSAR [Computer File, 2024]. NSW: New South Wales; BOCSAR: Bureau of Crime Statistics and Research.
Overall, both males and females born in 1994 were more likely than their 1984 counterparts to have contact with the police up to and including age 17. What is notable here is that the rate-ratio for young women is higher than for young males, suggesting that the increase in criminal justice system contact has occurred at a (relatively) faster pace. The consequence is that by age 27, the “gender gap” appears to have narrowed by four percentage points. In other words, for the 1984 cohort there were three female offenders for every 10 male offenders by age 27, while in the 1994 cohort this had increased to 4 female offenders for every 10 males.
Discussion
Inspired by the late Anna Stewart, this paper charts a difficult course of replication and recalibration. It reminds us that the science of Criminology is never entirely settled because measuring crime is complex, and replication is critical when new data and techniques become available. In this present study, we revisit Australia's first comparative longitudinal birth-cohort study of the NSW crime decline (Payne, Brown & Broadhurst, 2018). This time, we are armed with data on all “proven” criminal offences (including cautions and warnings) and a revised dataset that capitalises on a new (more flexible) data matching process. With this we make a number of important reflections and draw a number of new conclusions.
Reflections
First, while the estimates of the prevalence and the rate of offending for both cohorts are now higher than those reported by Payne et al. (2018), the earlier-reported differences between the two cohorts were undoubtedly overestimated. What is clear from these new data is that crime did not decline (between the cohorts) anywhere near as much as first thought. In fact, on a number of measures (to age 20) the 1994 cohort was more likely to be involved in crime at nearly all ages and had committed more offences than their 1984 counterparts. There is very little evidence of a dramatic age-graded change in criminal justice system contact.
Second, there was a considerable shift between the 1984 and 1994 cohorts in the police use of cautions and warnings as the disposition of choice for young people who are apprehended for their offending. This shift is the single greatest contributor to the differences presented in Payne et al. (2018), making their estimates of the apparent crime decline an artefact of the change in police practice, rather than a change in youth offending itself. We can confidently conclude that the 1994 birth cohort had considerably less contact with the NSW court system but not because they were committing less crime.
Third, criminal justice system data is “dirty” and there is no single, perfect, algorithm for matching data within and between datasets. Each process has its weaknesses, rendering different rates of false positive and false negative matches, and different rules might be preferred for different types of projects and research objectives. For Payne et al. (2018) and their focus on court finalised outcomes, a more rigid matching algorithm was likely sufficient and efficient. This is because person-level records tend to improve in quality as criminal matters make their way from police to the courts. However, for a larger study like the present one – intended to investigate a wider set of non-court dispositions – we require a more flexible algorithm to manage the preponderance of data entry, missing data, and transposition errors that are (likely) more prevalent in cautions and warnings data where an offender's name and date of birth are captured at the time of apprehension and need not be verified at the watch house, nor corrected for processing by police prosecution. Having checked and rechecked over several months and many iterations with BOCSAR, we are confident that the matching algorithm used in this updated analysis is the most robust option available. However, we have this confidence only because BOCSAR have been open and transparent about everything that they have done at each step of the data matching process. This level of visibility is rare and researchers using big data rarely get to see inside the “black box” of code that derives their data. If nothing else, this study should offer pause for thought about what that means for replication and reliability.
Fourth, even with the revised data there was a marked decline in the volume of property crime committed by the 1994 cohort (up to age 20). Although the difference is not as large as estimated by Payne et al. (2018), it remains even when cautions and warnings are included. This is a key result that adds further weight to the securitisation hypothesis that much of the overall crime decline was a consequence of the increased security and technological advances that have improved target hardening, reduced the appeal of consumer electronics, reduced the availability of cash, and increased the probability of detection (see Weatherburn & Rahman, 2021).
Outcomes to age 27
With these new data we now have an additional seven years of observation. This extends our tracking of the 1984 and 1994 cohorts to age 27, encompassing a more complete understanding of their adolescence, emerging and early adulthood. From this, we conclude that up to and including age 27, the 1994 cohort were less likely (overall) to have had contact with the criminal justice system (down by 11%), but accumulated a greater number of offences (up by 9%). Underlying this aggregate result is an important longitudinal story that was not consistent at all ages or for all offences types. Specifically, the 1994 cohort were disproportionately more likely to have been apprehended for a crime (and for a greater number of crimes) up to the age of 18, but after that time the cohort trajectories cross over and the trend switches. Almost the entirety of this “switch” was a consequence of a disproportionally large decline in property offending between the age of 17 and 21 because for all other crime types the offending rates of the 1994 cohort were either the same or worse than recorded for their 1984-born peers. Therefore, to the extent that we can conclude that there was a “crime decline” between these two cohorts, it was only the result of a dramatic shift in a temporally specific period of property offending.
It merits mentioning here that the 1994 cohort were more violent (both in terms of prevalence and frequency) in adolescence and early adulthood, but not in the period of transition between age 18 and 22. In terms of drug offending, they were no more or less likely to be apprehended before the age of 18, but more likely and at a greater frequency in emerging and early adulthood. For justice-related and breach offending, the 1994 cohort were consistently more likely to be in contact with the criminal justice system for many more offences than their 1984 counterparts. The inconsistency of these results over time and between offence types suggests that whatever was driving the state-wide crime decline, did not substantially reduce the offending of youth offenders, and only meaningfully affected participation in and the frequency of property offending within a specific age range (17–21 years of age).
The analysis by gender suggests that the aforementioned (aggregate) findings generally hold for both males and females, except that the difference between the 1994 and 1984 cohorts was proportionally greater for women. Of course, young women were less likely to be apprehended and committed fewer crimes than their male counterparts in both cohorts, however, the change between the cohorts was more substantial for young women. The net result is that in the 10 years between the two cohorts, the “gender gap” in criminal justice system contact narrowed by 10% – mostly because of a larger fall in male offending to age 21 along some increases in female offending.
Implications for understanding the crime decline
There is little dispute that Australia has experienced a large decline in crime since early in the year 2000, with crime rates today continuing to track at levels much lower than their historical peak. For this study, the 1984 and 1994 cohorts were chosen because each was traversing their adolescence in two very different windows of time. The 1984 cohort lived the challenges of their early adolescence when crime rates in NSW were at their highest, while the 1994 cohort “grew up” at a time when crime trends were already in significant retreat. Following these two cohorts, we expected to demonstrate major differences in their criminal justice system contact, especially in adolescence, and we imagined that this “benefit” would multiply into early adulthood. For the most part, this was not what really happened to young offenders in NSW because, with the exception of some relative decline in property offending between the age of 16 and 21, the 1994 cohort were disproportionally more likely to have contact with the criminal justice system as adolescents and at an earlier age (on average) than their 1984-born peers. They were more violent overall, more likely to be apprehended for the breach of a justice order, and equally likely to be apprehended for drug offences before the age of 18. Whatever was the cause of the crime decline in the early 2000s seemed to have little impact on young people. If there was an impact, it was to push down property crime during late adolescence, but not early adolescence, and not in early adulthood.
Ironically, we believe this specific result lends further support to Payne et al's (2018) original commentary about adolescent limited offenders (Moffitt, 1993) being at the heart of the crime decline. In their reflection on what seemed to be large declines in all categories of offending, they suggested that some wider social and structural forces were at play, reshaping the social conditions that propelled young people into crime such that young people were now “rejecting” opportunities for crime or avoiding them altogether. What we see now, in these new data that offer full visibility of cautions and warnings, is a temporal shift in property offending during the ages that adolescent limited offenders are most likely to socialise with chronic offenders and “experiment” with petty crimes such as theft and property damage. We would argue that it was not the disappearance of adolescent limited offenders that drove the crime decline in NSW, but that whatever drove the crime decline was the reason why adolescent limited offenders committed less property crime (and likely some displacement to violent and other crimes).
Of course, these findings seem somewhat at odds with the broader narrative of the crime-decline (in Australia and elsewhere) being a predominantly youth-based phenomenon. Indeed, aggregate data from NSW and other Australian jurisdictions (McCarthy, 2021; Sutherland & Milsteed, 2016) show that population prevalence of youth offending is largely in retreat and this begs an important question: why was the 1994 cohort seemingly more prolific and serious than their 1984 peers at a time when aggregate data point to a youth-based crime decline? Our best guess is that the initial crime decline in NSW was not a youth-based phenomenon – and that the 1994 cohort was not, as it turns out, a good comparator in the search for a developmental and life-course explanation. Supporting this is a series of more recent data from BOCSAR on aggregate youth justice trends which show that the legal proceedings against young people actually increased between 2000 and 2008 (declining thereafter), while crime rates were more generally in decline from the year 2000 onwards. Elsewhere (see McCarthy, 2021), the downward shift in youth crime across Australia has been examined from 2008 onwards, including in Australia's second largest jurisdiction, Victoria (Milsteed & Sutherland, 2016). The important point here is that the first 4 years of our 1994 cohort's emergence into adolescence coincided with the state-wide decline in crime, but not the youth-specific decline in crime (which didn’t start in NSW until 2008). It is not all that remarkable then that early adolescent offending of the 1994 cohort was less favourable in comparison to the 1984 born peers. We return to this point later because it has implications for the limitations of this study.
Finally, it is important to the return to issue of cautions and warnings, given their contribution to the recalibration of the conclusions drawn by Payne et al. (2018). What is clear is that the 1994 cohort were the beneficiaries of the incremental increase in the police use of non-court options for finalisation. To be sure, the Young Offenders Act (NSW) was introduced in 1997, so it started when the 1984 cohort was 13 years of age. Technically then, both cohorts were subject to the new provisions of the Act, but like all major policy and procedural changes it takes time to achieve the full intended effect. For this reason, we aren't surprised that the 1994 cohort were much more likely to be cautioned and warned, meaning also that they were less likely to be formally processed in court. This is a positive outcome and helps to explain why Payne et al. (2018) identified declines across all categories of offending when examining matters that were finalised in court.
The corollary of this is that the Young Offenders Act (NSW) 1997 may also be a reason why, overall, the 1994 cohort was more likely to have contact with the criminal justice system, contact at earlier ages on average, and contact for a greater number of offences despite the aggregate decline in state-wide crime trends from the year 2000 onwards. Specifically, the formalisation of non-court cautions and warnings has increased the number and range of options available to the police for the formal processing of young offenders. This has resulted in a dramatic fall in the processing of young people to court (as evidenced in this paper), to be sure, but not an overall decline in their apprehension and processing when formal non-court options are accounted for. It remains to be seen whether the availability of new formal police-based processing options is the reason why youth offending did not decline from as early as the year 2000. In other words, the Young Offenders Act (1997) may have generated a net-widening effect that provided a countervailing influence against those other socio-cultural forces that triggered the crime decline among adults from the year 2000 onwards. This is an empirical question that deserved examination.
Limitations
Although the availability of cautions and warnings data responds to the principal limitation of Payne et al. (2018), many of the other limitations remain the same. For example, these are administrative data, meaning that we cannot estimate the true prevalence of criminal offending that includes all crimes committed irrespective of whether there was police contact or other criminal justice system involvement. Generally, comparative studies of self-reported and officially recorded crime show that while administrative data under-count the total volume of crime, the relative differences between individuals are robust (Payne & Piquero, 2016). Equally, self-reported data are themselves subject to a range of limitations, such as dishonest reporting and telescoping.
Notwithstanding this, perhaps the most important and notable limitation of this study is the selection of the 1994 birth cohort as a comparator in the search for a developmental and life-course explanation of the NSW crime decline. As it turns out (from data not originally available at the time this methodology was proposed), aggregate youth justice statistics did not evidence a youth-crime decline as early as the year 2000 despite wider crime rates trending down. To this end, we can confidently conclude that the early phase of the NSW crime decline was not the consequence of a sudden and dramatic disappearance of youth offenders and that the impact of the decline on young people was not likely measurable using the 1994 cohort. This is an important finding because it shows that the original aetiology of the decline must be found in those factors which mostly affected older/adult offenders, and which later (though not measurable with the 1994 cohort) began to impact youth (either directly or indirectly). Equally, it is worth noting that the 1994 cohort, and indeed cohort studies more generally, provide a limited window into some of the more contemporary socio-cultural changes (technology, routine activities, youth supervision, etc.) which have been posited as the underlying causes of the youth-crime decline. Only younger cohorts will be able to speak to these phenomena – an empirical question that we hope to answer in a future study with our access to equivalent data for the 2004-born NSW birth cohort.
Furthermore, we do not have internal or external migration data, nor do we have mortality data, meaning that we do not know if and when a member of either cohort should no longer be counted. This is likely to impact our results in two ways. First, the population denominators against which rates and percentages have been calculated are fixed for both cohorts and at all ages. This likely results in a modest downside bias because the population denominator for a birth cohort should decline with age. Second, we cannot be sure a person has stopped offending just because there are no longer any offence records in the database. It's possible that desistance (not measured in this study, but relevant to offence rate calculations) resulted from death or a move interstate.
Finally, as this study has reminded us, there is always the possibility that new improvements to search and data matching strategies will further improve the data quality for these two 1984 and 1994 cohorts. While we have made every effort to verify these data in multiple quality assurance strategies, they are still just the “best available” at the time of writing.
Footnotes
Acknowledgements
Data extraction was undertaken by the New South Wales (NSW) Registry of Births, Deaths and Marriages and the NSW Bureau of Crime Statistics and Research.
Funding
The author disclosed receipt of the following financial support for the research, authorship, and/or publication of this article: the Australian Institute of Criminology.
Declaration of conflicting interests
The author declared no potential conflicts of interest with respect to the research, authorship, and/or publication of this article.