
Abstract
Background
Multimorbidity research has focused on the prevalence and consequences of multimorbidity in older populations. Less is known about the accumulation of chronic conditions earlier in the life course.
Methods
We identified patterns of longitudinal multimorbidity accumulation using 30 years of data from in-person exams, annual follow-ups, and adjudicated end-points among 4,945 participants of the Coronary Artery Risk Development in Young Adults (CARDIA) study. Chronic conditions included arthritis, asthma, atrial fibrillation, cancer, end stage renal disease, chronic obstructive pulmonary disease, coronary heart disease, diabetes, heart failure, hyperlipidemia, hypertension, and stroke. Trajectory patterns were identified using latent class growth curve models.
Results
Mean age (SD) at baseline (1985-6) was 24.9 (3.6), 55% were female, and 51% were Black. The median follow-up was 30 years (interquartile range 25-30). We identified six trajectory classes characterized by when conditions began to accumulate and the rapidity of accumulation: (1) early-fifties, slow, (2) mid-forties, fast, (3) mid-thirties, fast, (4) late-twenties, slow, (5) mid-twenties, slow, and (6) mid-twenties, fast. Compared with participants in the early-fifties, slow trajectory class, participants in mid-twenties, fast were more likely to be female, Black, and currently smoking and had a higher baseline mean waist circumference (83.6 vs. 75.6 cm) and BMI (27.0 vs. 23.4 kg/m2) and lower baseline physical activity (414.1 vs. 442.4 exercise units).
Conclusions
A life course approach that recognizes the heterogeneity in patterns of accumulation of chronic conditions from early adulthood into middle age could be helpful for identifying high risk subgroups and developing approaches to delay multimorbidity progression.
Introduction
Multimorbidity, defined as the co-occurrence of two or more chronic conditions, is common and associated with mortality and healthcare utilization.1,2 Because the prevalence of most chronic conditions increases with older age,3-5 multimorbidity research has primarily focused on identifying and addressing the consequences of multimorbidity in older populations.6,7 Less is known about the accumulation of chronic conditions earlier in the life course.
A life course approach to multimorbidity could be helpful for identifying high risk subgroups and developing approaches to slow the progression of multimorbidity before older age. In addition to research among older adults, prior studies have shown that by middle age multimorbidity is already common. For example, among U.S. adults 50 to 64 years old the prevalence of 2-3 and 4 or more chronic conditions was 41% and 31%, respectively. 1 Prior studies have shown that, on average, chronic conditions continue to accumulate through middle age.8,9 Multimorbidity has also been an important area of research earlier in the life course during childhood and adolescence.10,11 As childhood conditions often differ in etiology compared to adults’ chronic conditions and as multimorbidity is already prevalent by middle age, early adulthood may be an important starting point to characterize accumulation of chronic conditions. 12 Furthermore, early adulthood is a time when many people begin living independently from their parents, enter the workforce, and make their own lifestyle choices. Therefore, social determinants of health are likely to influence health during this life stage. 13 However, few studies have included a diverse population of participants in early adulthood or have longitudinal data necessary to identify patterns of chronic condition accumulation from early adulthood into middle age.
The purpose of this analysis was to characterize the accumulation of chronic conditions from early adulthood through middle age by identifying distinct multimorbidity trajectories. We used data on chronic conditions collected as part of the Coronary Artery Risk Development in Young Adults (CARDIA) study, a prospective cohort study with over thirty years of follow-up. After identifying multimorbidity trajectories, we characterized the demographic and behavioral characteristics associated with the different trajectory classes. Identifying specific patterns of accumulation of chronic conditions and demographic and behavioral characteristics associated with different trajectories could inform the development and timing of chronic disease prevention programs.
Methods
Study design and population
CARDIA is a prospective cohort study designed to examine the determinants of cardiovascular disease (CVD). Enrollment took place at four field centers (Birmingham, Alabama; Oakland, California; Minneapolis, Minnesota; and Chicago, Illinois) beginning in 1985 to 1986. CARDIA included 5,115 Black and White women and men 18-30 years old. 14 The overall recruitment goal was to create a cohort that was representative of the population of the four field center locations, stratified to achieve nearly equal numbers of Black and White participants, females and males, persons <25 and ≥25 years old, and those with a high school education or less versus more than a high school education. Participants had to be permanent residents of the field center locations and free of long-term disease or disability that would interfere with the examination including walking on a treadmill. Women who were pregnant or ≤3 months postpartum were also excluded. Additional descriptions of the study design and data collected have been previously published.14-16 Pertinent to the current analysis, data collection included in-person exams (years 0, 2, 5, 7, 10, 15, 20, 25, and 30), annual follow-up contacts to determine health and hospitalization status, and adjudication of pre-specified endpoints. As the number of chronic conditions is known to increase with age, and because age at study entry ranged from 18 to 30 years old, we chose to use age as the metric for follow-up time rather than exam year. To do this, we re-scaled the data from follow-up time to age. Because few participants developed chronic conditions before the age of 25, we restricted our analytic cohort to 4,945 participants who were alive at age 25 years (excluded n=11) and had data on chronic conditions from at least one time-point at or after 25 years of age (excluded n=159). All participants provided informed consent. This analysis was approved by the Duke University Institutional Review Board (Pro00103278) and the final manuscript was approved by the CARDIA Publication and Presentations Subcommittee.
Multimorbidity accumulation
Accumulation of chronic conditions was defined by the presence of 12 chronic conditions: arthritis, asthma, atrial fibrillation, cancer, end stage renal disease (ESRD), chronic obstructive pulmonary disease (COPD), coronary heart disease (CHD), diabetes mellitus, heart failure (HF), hyperlipidemia, hypertension, and stroke. The selection of conditions was informed by the Centers for Disease Control and Prevention (CDC) recommendations for defining and measuring multiple chronic conditions and were chosen for this analysis because these conditions can develop during early adulthood and middle age and often require ongoing chronic disease management (e.g., lifestyle changes, medications, and/or disease monitoring).17,18
Each condition was defined using the most detailed, valid, and time-sensitive data available in CARDIA for that specific chronic condition which included a combination of data from the in-person exam medical history and measurements, hospitalization records, and annual contact data (Supplemental Table 1).
Hypertension was defined as a SBP ≥140 mmHg or DBP ≥90 mmHg or use of an antihypertension medication from the medical history obtained at the in-person exam. Hyperlipidemia was defined as a total cholesterol ≥240 mg/dL. Diabetes mellitus was defined as a fasting glucose ≥126 mg/dL or use of an antidiabetic medication. Asthma and COPD were defined as self-report of a doctor or nurse diagnosis or as an adjudicated primary reason for hospitalization. Arthritis and cancer were defined as self-report of a doctor or nurse diagnosis. Adjudicated CVD endpoints data were used to define HF, stroke, CHD, atrial fibrillation, and ESRD.
For each condition, we then determined the first age at which a participant was identified as having this condition. For hypertension and diabetes mellitus, we identified the earliest age from the in-person exam or adjudicated hospitalization at which the participant met the above definition. Data from annual contacts were then used to identify a more precise age for those who self-reported the condition for the first time between exams. Similar for hyperlipidemia, we used the age from the first in-person exam at which the participant met the definition for hyperlipidemia and data from annual contacts were used to identify a more precise age if hyperlipidemia was first reported between exams. For COPD and asthma, the earliest age from either the exam or the primary reason for hospitalization was used. For cancer and arthritis, self-reported age that the participant was first told they had the condition was used from the medical history obtained during the in-person exam. For atrial fibrillation, CHD, ESRD, HF, and stroke, dates from adjudicated endpoints data were used to determine onset age.
After an age for each condition was identified, we then calculated the number of conditions a participant had by every year of age during CARDIA follow-up. Number of conditions has been used in prior studies of multimorbidity as a measure of overall chronic disease burden. 15 Consistent with prior multimorbidity research, we allowed for conditions to monotonically accumulate (e.g., progressing from 2 to 3 conditions), but assumed that chronic conditions did not resolve. 17
Other participant characteristics
Data on additional demographic and behavioral characteristics were obtained from standardized questionnaires administered during the in-person exams and included sex, race, education, marital status, family income, smoking status and physical activity. 19 Height, weight, and waist circumference were measured during in-person exams and body mass index (BMI) was calculated. Depressive symptoms were measured using the Center for Epidemiological Studies Depression (CESD) scale. For this analysis, we used data on characteristics obtained at Year 0 except for family income and CESD which were not assessed until the Year 5 exam. Additionally, we used data on participants’ characteristics at the last available follow-up defined as the last CARDIA exam the participant completed after baseline.
Statistical analysis
We first calculated characteristics of participants as means (standard deviation [SD]) and number (percentage) at baseline and last available follow-up. To identify distinct patterns of longitudinal multimorbidity accumulation among subsets of CARDIA participants we used latent class growth models (LCGMs). Preliminary analyses were conducted to better understand typical patterns and heterogeneity among multimorbidity accumulation trajectories for individuals and guide decisions for treating the count of chronic conditions as normal versus a Poisson outcome. Following these preliminary analyses, we then fit LCGMs to identify trajectories of accumulation defined by the number of chronic conditions and their rates of accrual. The LCGM approach attempts to define homogenous subgroups of participants with comparable longitudinal patterns and synthesize them into a small number of prototypic trajectory classes.20-22 It also identifies probabilities that each participant belongs to each trajectory class (i.e., posterior probabilities of assignment). LCGM uses all available data on accumulation of chronic conditions as they were identified, including data from participants who died, were lost to follow-up, or had intermittent missing data. We used the participants’ age as the metric of time expressed as a low-order polynomial to capture potential nonlinearities in multimorbidity accumulation. The optimal number of latent trajectory classes was decided by considering information statistics (Akaike Information Criterion [AIC], Bayesian Information Criterion [BIC], Consistent Akaike Information Criterion [CAIC], and Sample Size adjusted Bayesian Information Criterion [ssBIC]), classification statistics (scaled entropy, average posterior probability of assignment [APPA], and odds of correct classification [OCC]), as well as solution interpretability. 23 Information statistics reflect model fit, while classification statistics describe ambiguity in the assignment of individuals to membership in trajectory classes. Analyses were conducted using SAS® Proc TRAJ software. 24 After selecting the solution with the optimal number of classes, we then calculated participant characteristics at baseline and last available follow-up by trajectory class and calculated p-values for differences by trajectory class using Kruskal-Wallis and Chi-square methods as appropriate. For each trajectory class, we also calculated the percentage of participants with each of the twelve chronic conditions. Participants were determined to have the condition if it was present at baseline or any time during follow-up (includes both prevalent and incident conditions).
Results
Participant characteristics
Characteristics of CARDIA participants at baseline (Year 0; 1985-6) and last available follow-up.

SD = standard deviation, CESD = Center for Epidemiological Studies Depression
*Last available follow-up was defined as the last CARDIA Exam completed after baseline (Year 0). Sample size for last available follow-up restricted to participants who had available data from at least one in-person exam after baseline (Year 0). Median (interquartile range) and mean (SD) between baseline and last available follow-up = 30 (25, 30) years and 25.5 (8.1), respectively.
**Poor < 100 units, Intermediate 100-299 units, Ideal ≥ 300 units
*** high depressive symptoms = CESD ≥16
Note: family income and CESD were not added to the CARDIA exam until Year 5.
Multimorbidity trajectories
Preliminary modeling efforts suggested that normal models fit worse than Poisson models. Moreover, once participant (polynomial) age was included in the models, over-dispersion and zero inflation were controlled. Although random effects for intercept, linear and quadratic slopes were needed in multilevel generalized linear models, corresponding group-based trajectory models required none, suggesting that latent trajectory class groups adequately controlled for individual differences in intercepts and linear and quadratic slope parameters.
LCGA models were fit starting with a one-cluster longitudinal Poisson regression model, assuming that all subjects can be characterized with a single trajectory model, then successively increasing the number of trajectory classes until most of the heterogeneity in the data was explained. We considered quadratic and cubic models and chose the cubic model because the model curves more closely approximated extant data patterns, as confirmed by likelihood ratio tests (eg. LR χ2(6)=1246.26; p ≤ 0.0001 for 6-class model).
Guided by model information fit statistics, classification statistics, and solution interpretability, we chose a 6 trajectory class model. The 6-class model had the lowest AIC, BIC, cAIC, and ssBIC suggesting that this model fit the data best (Supplemental Table 2). When increasing the number of trajectory classes to 7, a result could not be estimated suggesting that the data could not accommodate more than 6 trajectory classes. Classification statistics were used to quantify the certainty that participants were assigned to only one trajectory class (Supplemental Table 3). For the 6-class model the overall scaled entropy and APPA classes of assignment for each of the 6 trajectory classes were >0.80 and the OCC was >5, suggesting a high probability of being assigned to only one trajectory class. Thus, for subsequent analyses, participants were assigned to the trajectory class with the maximum posterior probability of assignment (maximum posterior probability assignment rule) and treated as only belonging that class.
The 6 latent class trajectories for accumulation of chronic conditions were plotted as the predicted number of conditions by age in years (Figure 1). Trajectory class names were then chosen based on (1) the age at which chronic conditions were first identified and (2) the rate of accumulation resulting in the following: early-fifties, slow (E50S), mid-forties, fast (M40F), mid-thirties, fast (M30F), late-twenties, slow (L20S), mid-twenties, slow (M20S), and mid-twenties, fast (M20F). Among the 4,945 participants, 38.3% were assigned to E50S, 13.4% to M40F, 11.4% to M30F, 7.6% to L20F, 20.2% to M20S, and 9.2% to M20F. Years of available follow-up and reasons for attrition by trajectory class are shown in Supplemental Table 4. Latent class trajectories for accumulation of chronic conditions among CARDIA participants between 25 and 55 years old. Trajectory class names based on age at which chronic conditions were identified in CARDIA and rate of accumulation. Lines = predicted trajectory, Open circles = observed marginal means. Among the 4,945 participants, 38.3% were assigned to E50S, 13.4% to M40F, 11.4% to M30F, 7.6% to L20F, 20.2% to M20S, and 9.2% to M20F.
Participant characteristics and chronic condition profiles by trajectory class
Participant characteristics by trajectory class for accumulation of chronic conditions – baseline (Year 0; 1985-6).
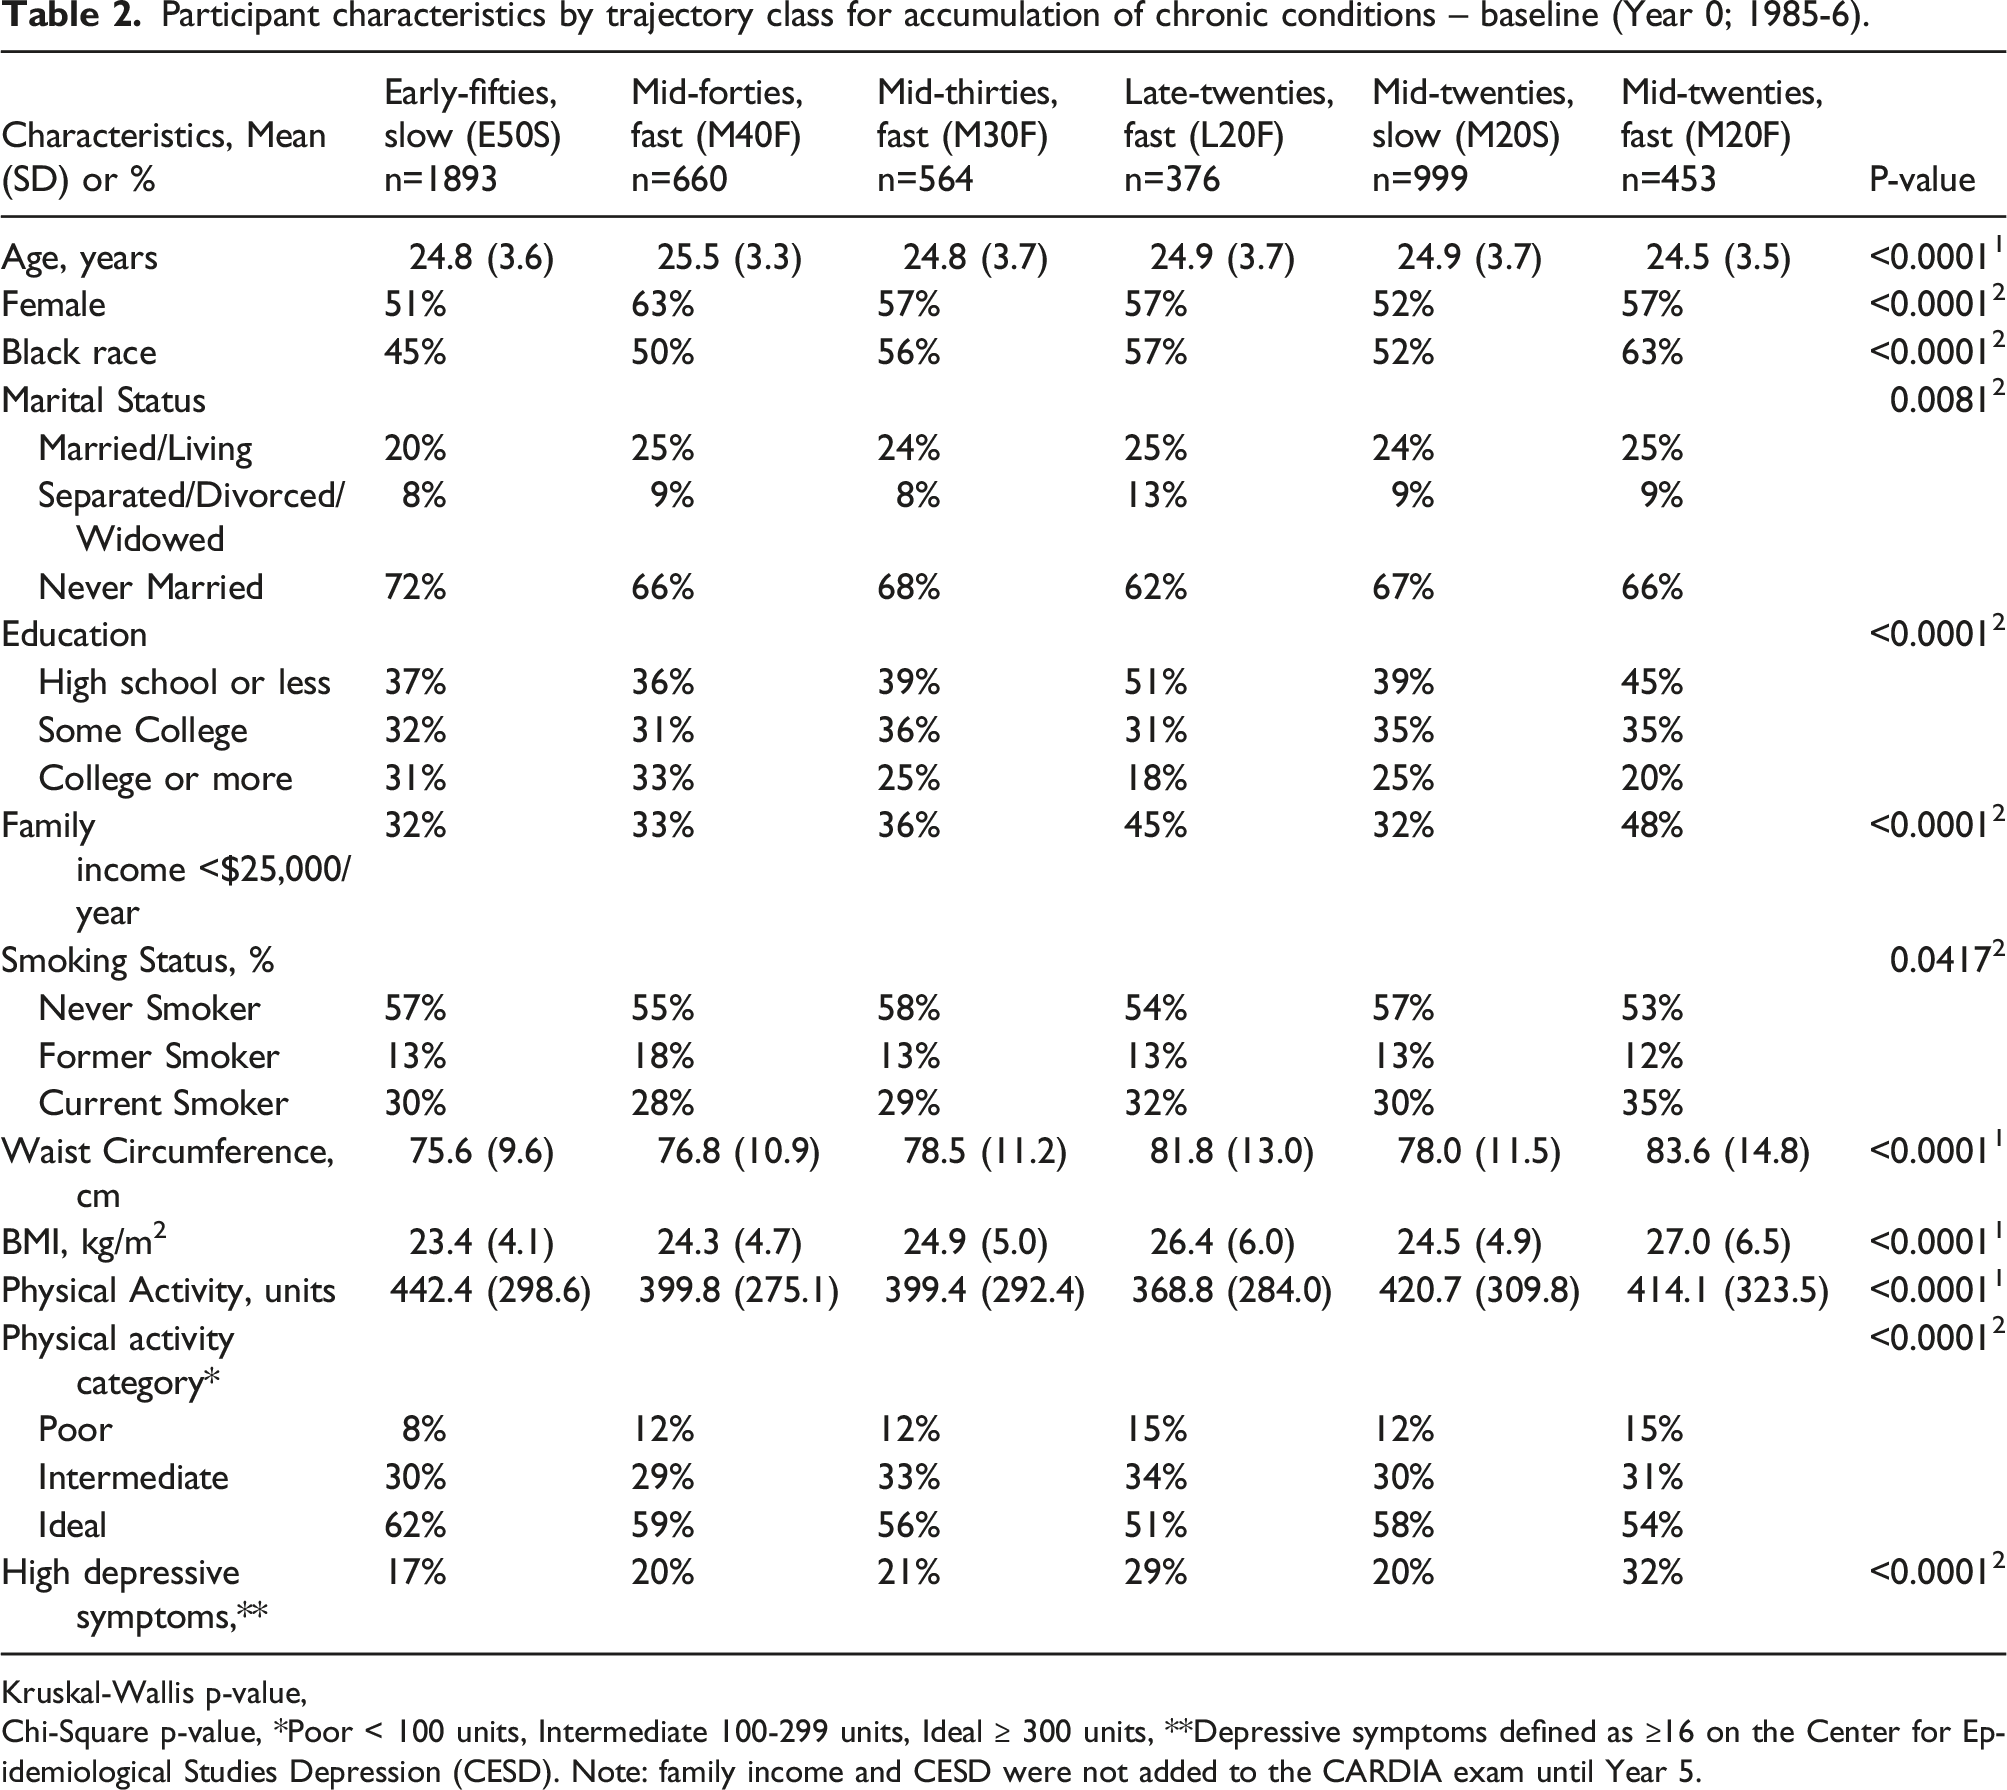
Kruskal-Wallis p-value,
Chi-Square p-value, *Poor < 100 units, Intermediate 100-299 units, Ideal ≥ 300 units, **Depressive symptoms defined as ≥16 on the Center for Epidemiological Studies Depression (CESD). Note: family income and CESD were not added to the CARDIA exam until Year 5.
Participant characteristics by trajectory class for accumulation of chronic conditions - last available follow-up*.

*Last available follow-up was defined as the last CARDIA Exam completed after baseline (Year 0, 1985-6). 1Kruskal-Wallis p-value, 2Chi-Square p-value, **Poor < 100 units, Intermediate 100-299 units, Ideal ≥ 300 units. **Depressive symptoms defined as ≥16 on the Center for Epidemiological Studies Depression (CESD).
The percentage of participants with each of the 12 chronic conditions by trajectory class is displayed in Figure 2 and Supplemental Table 5. Hypertension was the most common chronic condition present in all of the trajectory classes except for the M20S class in which asthma was most common. For all of the trajectory classes, CHD, stroke, HF, atrial fibrillation, and ESRD were less common than other chronic conditions. However, statistically significant differences in the percentage of participants between trajectory class were found for all twelve conditions, including the less common conditions. Chronic condition profile plot for each of the six trajectory classes. The profile plot shows the percentage of participants with each of the twelve chronic conditions within the trajectory classes. Connected lines are used to support visual comparison across trajectory classes. COPD = chronic obstructive pulmonary disease, CHD = coronary heart disease, ESRD = end stage renal disease. Participants were determined to have the condition if it was present at baseline or any time during follow-up (includes both prevalent and incident conditions).
Discussion
Among U.S. adults participating in a long-term prospective cohort study, we identified six distinct trajectories of chronic condition accumulation. These trajectories were characterized by different ages at which chronic conditions developed and rates at which chronic conditions accumulated. Participant characteristics differed by trajectory class at baseline and last available follow-up, including higher prevalence of CVD risk factors such as current smoking, higher waist circumference and BMI, and lower physical activity among participants who accumulated conditions at younger ages and at faster rates. These findings suggest that early adulthood may be an important time period for characterizing the onset and development of multimorbidity.
The burden and outcomes of multimorbidity among older adults is well known and there is growing evidence of the importance of multimorbidity in middle age.1,3,8,25Adding to existing literature on multimorbidity, the current study identified distinct trajectories of multimorbidity from early adulthood into middle age. One example that highlights how the current analysis adds to the existing literature is in comparison to the LCGM analyses used by Strauss et al. 26 In a population of adults 50 years and older with three years of follow-up in general practice settings in the United Kingdom, investigators identified five multimorbidity trajectories that differed, primarily, by the timing of chronic condition onset (i.e., intercept). In addition to extending findings to a younger, non-clinical population that included Black and White men and women, our findings suggest that not only is the onset of chronic conditions important, but the rate of accumulation may be important. For example, we identified trajectory classes with similar onsets in the mid-twenties (M20S and M20F), that follow different trajectories during follow-up, as well as trajectory classes with different onsets (L20F and M20F, and separately M40F, M30F and L20F), but with a similar number of chronic conditions by 55 years old.
Identifying and addressing multimorbidity is a core component of geriatrics research and clinical care, but is not a routine part of population health and medical care for younger populations. Our findings show that for many CARDIA participants, chronic conditions develop and accumulate early in the life course. Although the most common trajectory (E50S) included participants who had not started developing chronic conditions until they reached their mid-fifties, nearly a third of participants were assigned to classes characterized by having chronic conditions in their twenties (L20F, M20S, and M20F) and another third of participants were assigned to classes who developed chronic conditions in their thirties and forties (M40F and M30F). Development of chronic conditions in early adulthood put participants on a trajectory to develop multimorbidity, defined as two or more chronic conditions, at an earlier age than those who delay the onset of conditions. Those in the M20F trajectory class developed multimorbidity at approximately 35 years old, nearly two-decades before the E50S group had developed their first chronic condition. Those in the L20F trajectory class were developing multimorbidity by approximately 45 years old. These findings suggest that waiting until older age to identify and address multimorbidity means that a subset of adults will have lived with the physiologic stress and the financial burden of having co-occurring conditions for 10 to 20 years more than their peers.
We also found that these trajectory groups identified were associated with differences in participant characteristics at baseline and last-available follow-up. These findings suggest that approaches to change the trajectory of accumulation of chronic conditions may need to be tailored to different trajectory groups or address different contributing factors. Findings that a greater percentage of Black CARDIA participants were in the mid-twenties fast (M20F) relative to other trajectories groups is consistent with prior studies showing that Black adults develop multimorbidity at an earlier age than White adults. 27 Understanding and addressing Black-White inequities in multimorbidity accumulation may be informed by the World Health Organization (WHO) framework of structural determinants of health which offers useful insights into how “upstream” structural racism affects mid- and downstream determinants of health (e.g., education, income, wealth, marriage, stressors) and health care access and quality.28,29 The WHO framework also points to promising interventions to address the structural causes of health inequalities. Future work may also focus on identifying the association between trajectories found here and outcomes that are important with aging including later-life physical function, cognition and quality of life.
The current analysis has several strengths including the long-time course over which participants had repeated in-person exams assessing chronic conditions, annual phone calls to identify interval development of conditions, and adjudicated event assessment for conditions that required hospitalization or a procedure. There are also limitations that must be considered. Our analytic approach did not take into account the order in which chronic conditions accumulated or the etiological relationship between conditions (e.g., hypertension and hyperlipidemia are both risk factors for stroke). Assessment methods for chronic conditions differed by condition. For example, we defined hypertension based on BP measurement or medication use while cancer and arthritis were defined by self-report alone. While this was due to underlying differences in clinical assessments for different chronic conditions, as well as the early focus of CARDIA on identifying determinants of CVD risk, possible misclassification of self-reported conditions is a limitation. Furthermore, using the self-reported age at diagnosis may result in measurement bias if participants reported an age at which they experienced a preclinical condition (e.g., high risk colon polyp) or injury (e.g., acute knee pain) that occurred years before a diagnosis of cancer or arthritis was made. Although we used a comprehensive list of chronic conditions, conditions such as hypertension and hyperlipidemia were much more common than more disabling conditions such as stroke and heart failure. This was due in part to the age of CARDIA participants at enrollment. Another limitation is the potential misclassification of participants who were lost to follow-up and did not have data on accumulation of chronic conditions. For example, a larger percentage of participants who were lost to follow-up before the Year 30 exam were assigned to E50S. Therefore, E50S is likely to be a combination of participants who did not develop chronic conditions until their early fifties along with participants for whom number of chronic conditions after a certain age was not known. Despite this likely misclassification, participants assigned to E50S had, on average, more than 23 years of follow-up and at baseline were less likely to smoke, had lower waist circumference and BMI, and had higher physical activity scores.
Among CARDIA participants, subsets of participants were identified who experienced different chronic condition trajectories during 30 years of follow-up. These trajectories were characterized by different ages at which chronic conditions developed, different rates at which chronic conditions accumulated, and were associated with different participant characteristics. A life course approach that recognizes the development and accumulation of chronic conditions from early adulthood into middle age could be used to identify high risk subgroups and develop new interventions to slow the progression of multimorbidity before older age.
Supplemental Material
Supplemental Material - Multimorbidity trajectories in early adulthood and middle age: Findings from the CARDIA prospective cohort study
Supplemental Material for Multimorbidity trajectories in early adulthood and middle age: Findings from the CARDIA prospective cohort study by C Barrett Bowling, Richard A Faldowski, Richard Sloane, Carl Pieper, Tyson Brown, Erin E Dooley, Brett Burrows, Norrina B Allen, Kelley Pettee Gabriel, and Cora E Lewis in Journal of Multimorbidity and Comorbidity
Footnotes
Declaration of conflicting interests
The author(s) declared no potential conflicts of interest with respect to the research, authorship, and/or publication of this article.
Funding
The author(s) disclosed receipt of the following financial support for the research, authorship, and/or publication of this article: This work was supported by the C.B.B. had full access to all the data in the study and takes responsibility for the integrity of the data and the accuracy of the data analysis. Support was provided through the National Institute on Aging (R01AG062502) to C.B.B and further supported by the Duke Pepper Older Americans Independence Center (P30AG028716). The Coronary Artery Risk Development in Young Adults Study (CARDIA) is conducted and supported by the National Heart, Lung, and Blood Institute (NHLBI) in collaboration with the University of Alabama at Birmingham (HHSN268201800005I & HHSN268201800007I), Northwestern University (HHSN268201800003I), University of Minnesota (HHSN268201800006I), and Kaiser Foundation Research Institute (HHSN268201800004I). This manuscript has been reviewed by CARDIA for scientific content.
Disclaimer
The views expressed here/in this manuscript are those of the authors and do not necessarily represent the views of the National Heart, Lung, and Blood Institute; the National Institutes of Health; or the Department of Health and Human Services or Department of Veterans Affairs.
Supplemental Material
Supplemental material for this article is available online.
References
Supplementary Material
Please find the following supplemental material available below.
For Open Access articles published under a Creative Commons License, all supplemental material carries the same license as the article it is associated with.
For non-Open Access articles published, all supplemental material carries a non-exclusive license, and permission requests for re-use of supplemental material or any part of supplemental material shall be sent directly to the copyright owner as specified in the copyright notice associated with the article.