
Abstract
Background
Multimorbidity (two or more concurrent chronic conditions) is associated with poorer health outcomes and increased healthcare utilisation in primary care and general populations. Less is known about the prevalence of multimorbidity in emergency department attenders, or its association with poor outcomes in this population.
Aim
This study sought to explore the relationship between multimorbidity, mortality and health-care utilisation in a large urban cohort of persons attending emergency departments.
Methods
Validated algorithms for the identification of 28 chronic conditions from ICD-10 codes were deployed on a cross-sectional sample of patients attending emergency departments in Glasgow, Scotland between April 2019 and March 2020. Analysis was conducted on complete cases (n=63,328) and compared with results from data with imputed missing values (n=75,723). Models adjusted for age, sex, deprivation and ethnicity were fitted to test for the association between (i) multimorbidity, (ii) complex multimorbidity, (iii) disease count and the following outcomes: admission to hospital, reattendance at 30 and 90 days, and death during admission.
Results
Multimorbidity, complex multimorbidity and disease count were significantly associated with hospital admission and emergency department reattendance. Those with 1-3 conditions were at increased risk of inpatient mortality.
Conclusion
This study further evidences the impact of multimorbidity and disease burden on health-care use, and mortality to a lesser extent. Deployed algorithms were sufficiently sensitive to detect associations, despite limited access (21 months) to secondary-care data. This should allow for the construction of more robust models to prospectively identify persons at risk of poor outcomes in similar populations.
Keywords
Background
Multimorbidity is the term used to define the co-occurrence of two or more chronic conditions in the same individual, where no particular focus is placed on a specific index condition 1 . It is strongly associated with advanced age and socioeconomic deprivation, and has been shown to predict poor outcomes including mortality, decreased quality of life, and increased healthcare utilisation, predominantly in the general population and primary care 2 .
Measuring the prevalence of multimorbidity is a key area of research worldwide, although variability in the tools and methods of measurement limit the transferability of much of this research. Moreover, both the prevalence and characteristics of multimorbid populations may vary dependant on whether data was sourced from community dwelling persons, primary care or other service users, or hospital inpatients. Evidence from systematic reviews of prevalence studies indicate that primary care and the general population are the most frequent areas in which multimorbidity is measured by researchers3-8. Much less is known about the prevalence and patterns of multimorbidity in emergency department attenders, apart from smaller subgroups such as homeless persons 9 , nursing home residents 10 , and those attending with suspected acute coronary syndromes 11 .
A 2017 systematic review provides some recommendations for better transferability in this field of research 12 , including that between 25 and 75 conditions is the optimal amount for epidemiological studies. Through a targeted search of the international literature, Tonelli and colleagues developed and validated a series of logic-based algorithms which can be used to detect 30 chronic conditions with moderate to high reliability using routinely-collected patient data 13 . This was developed from an earlier list of 40 chronic conditions which were deemed important to multimorbidity research in primary care 14 .
A significant benefit of these algorithms is that they have been validated using the two most recent iterations of the International Classification of Diseases (ICD-9 and ICD-10) and are therefore suitable for deployment in the health systems of any country which uses this system for reimbursement or general coding of diseases and risk factors. International variations in coding practices do exist. For example, in Scotland codes are mostly derived from hospital discharge letters, and there may be less incentive for comprehensive coding when compared with a reimbursement-based healthcare system. Nonetheless, the use of standardised algorithms still
Being able to reliably identify conditions from ICD codes also provides researchers with the ability to translate this raw data into diagnoses which are clinically-observable, and therefore recognisable to clinical practitioners. While many interventions designed to improve outcomes for people with multimorbidity use varied forms of analytics and predictive modelling to identify ‘high-risk’ healthcare users prospectively15-19, it is also helpful if clinicians can stratify risk through recognition of key thresholds based on examination and history.
Given the value of identifying diseases and multimorbidity in this manner, we sought to explore the effectiveness of using an adapted version 20 of these algorithms to detect multimorbidity in emergency department (ED) attenders over a 12-month period, and to test hypotheses related to poorer outcomes in those with multimorbidity and increasing disease burden.
Aims
The overall aim of this study is to examine whether multimorbidity (the presence of two or more chronic conditions) is significantly associated with admission, mortality and reattendance in emergency department attenders, and if the odds of experiencing these outcomes increases with the number of conditions a person has. The following hypotheses were agreed a priori: 1. There will be a positive association between multimorbidity and admission to hospital, 30- and 90-day reattendance at the emergency department, and mortality during admission. 2. The risk of admission to hospital, 30- and 90-day reattendance at the emergency department, and mortality during admission will increase with the number of chronic conditions a person has.
We were additionally asked during peer-review to explore the significance of complex multimorbidity (three or more conditions affecting three of more body-systems) in relation to the above outcomes.
Methods
Study design
A cross-sectional study design was employed, with unique patient attendances at emergency departments during a 12-month period (April 2019 – March 2020) constituting the sample. For those who attended more than once, the first attendance within the study period was treated as the index attendance.
This study has been reported in adherence with the RECORD guidelines for cross-sectional studies using routinely collected data 21 .
Setting
NHS Greater Glasgow and Clyde (NHSGGC) is the largest regional health board in Scotland, caring for a diverse population of 1.2 million people. NHSGGC serves a variety of rural and urban areas in and around Scotland’s most populous city. In this study we examine data for the predominantly urban population of the Glasgow City area. Cohorts and de-identified linked data were prepared by the West of Scotland Safe Haven at NHS Greater Glasgow and Clyde.
Participants
Any resident of the Greater Glasgow area aged 16 or older attending an emergency department within NHSGGC during the study period were included. We also considered all acute assessment units as emergency departments, the only exception being a small number of nurse-led minor injuries units which do not see medically unstable patients and cannot admit patients. In the event that someone attends such a unit with an illness or injury requiring emergency treatment rather than a minor injury, they would be redirected to an emergency department and would therefore be included in the sample.
Variables
Outcome variables
All outcomes were coded as binary categorical variables and are considered co-primary. Admission to hospital is a mandatory coding item in emergency department data. Cases were coded for 30- and 90- day reattendance if a new emergency department attendance was recorded within these time periods of the index (first) attendance. Mortality and inpatient records were linked to emergency records by pseudonymised identifiers, and mortality at the various timepoints was calculated accordingly. Inpatient mortality was identified by linking inpatient and emergency department records to establish continuous inpatient ‘episodes’ from attendance to discharge, and cross-referencing date-of-death with these admission periods. Sufficient data were available to ensure that those attending at the end of the study period could be followed up for mortality (>12 months) and reattendance (>90 days).
Exposure variables
Tonelli and colleagues validated algorithms which allowed for identification of 30 chronic conditions from routinely-collected patient data 13 . Stokes and colleagues amended these algorithms to a list of 28, condensing three cancer diagnoses into one condition 20 . The algorithms utilise ICD-10 codes to detect conditions, and a small number have surgical exclusions. One condition (chronic kidney disease) also makes use of laboratory results. We deployed these algorithms to detect the 28 chronic conditions utilised by Stokes and colleagues 20 , however, we were only able to identify chronic kidney disease using ICD-10 codes due to differences in the way laboratory results were reported. Each disease was coded as a binary categorical variable dependant on whether it could be said to be present at the time of the index attendance.
When assigning conditions to body systems (in order to identify complex multimorbidity) we used ICD-10 chapters as outlined by Harrison and colleagues 22 . Some conditions were coded across multiple chapters; therefore we have sought to categorise these under the most clinically-appropriate system/chapter. Full details are available in file S1.
Binary variables for multimorbidity/complex multimorbidity and a 7-level categorical variable for disease-count were also created, based on the above 28 conditions. In order to avoid those attending at the end of the study period being more likely to be classified as having multimorbidity (due to a longer ‘look-back’ period of historical data), we limited the available historical data to approximately 21 months before the index attendance. This is equal to the data available for someone attending on day 1 of the study period.
Confounder variables
Age, sex, ethnicity and deprivation data were available, and these were included in adjusted models in order to mitigate bias. Ethnicity is coded in Scottish health records using a standardised taxonomy. We adopted the six top-level categories as specified; however, we disaggregated the Arabic/Other ethnicity variable into two variables using granular data which was available. In analyses of inpatient mortality, ethnicity categories had to be collapsed to three variables (White/Asian/all other) in order to resolve issues with collinearity. The Scottish Index of Multiple Deprivation (SIMD) is a postcode-based measure of deprivation, in which deprivation is assessed across seven domains: income, employment, education, health, access to services, crime and housing 23 . SIMD is commonly analysed as a categorical variable, stratified into deciles based on level of deprivation, ranging from the lowest 10% (most deprived) to the highest 10% (least deprived).
Statistical methods
Descriptive statistics are presented for the whole sample and stratified based on the presence of multimorbidity and complex multimorbidity. Frequency counts, percentages and median/interquartile range (for non-parametrically distributed variables) are presented for exposures and outcomes.
Binomial logistic regression models were fitted for each outcome, and both crude (unadjusted) and adjusted models were calculated. We adjusted for age, sex, ethnicity and deprivation. Adjusted odds-ratios (ORs) and 95% Confidence Intervals (CIs) are reported here, full models are described in the supplemental files for both the complete-case analysis (file S2) and the post-imputation analysis (file S3).
All statistical analyses were conducted using R version 4.0.5.
Data linkage and cleaning
In Scotland, the Community Health Index (CHI) number is a unique identifier for each patient used in routinely collected health record databases, which enables patient records to be linked across different health datasets. Once linked using the CHI number, personal identifiers were removed (including CHI number) to ensure patient confidentiality, and access to the pseudonymised linked dataset was then provided via the Safe Haven. Data from five databases were linked; health-board wide emergency department data, mortality data, demographic data, ethnicity data and inpatient and day case records (SMR01).
A summary of data cleaning is as follows:
Emergency department data was extracted for the study period (1st April 2019 – 31st March 2020) and the first attendance for each patient was marked as the index attendance. Persons attending nurse-led minor injury units were excluded, as was the first attendance for those attending two departments in the same day; these represented transfers or redirected attendances at inappropriate sites, the inclusion of which would have artificially inflated reattendance figures. Binary variables were created which specified whether the patient was admitted, or reattended within 30 or 90 days. A numeric variable of the total ED attendances was also created. Attendances which did not have a patent identification number (required for linkage) and therefore could not be linked with any other data were also removed.
Inpatient records were included from 1st July 2017 (the earliest date available in the dataset) to the end of the study period. Inpatient records are generated for each change of ward, department or specialty, therefore each patient admission to hospital may comprise of several inpatient records. Through the use of admission, discharge and transfer codes and dates, these were collapsed into single records for each continuous inpatient admission. ICD-10 and intervention/procedure (OPCS-4) codes were also collapsed. Variables were created summarising all codes entered during each admission and the primary (first ICD-10 code) diagnosis. The date of admission was used as the index date for these codes.
All databases were then merged with the inpatient record, and those records which did not relate to a patient with an index emergency department attendance were discarded. Mortality data was used to create the binary mortality outcome variables using the index attendance dates, admission-discharge dates, and date of death.
The logic-based algorithms for detection of chronic conditions were then deployed (see file S1). ICD-10 codes and relevant exclusions were used to generate counts for whether a disease was detected from inpatient admissions; these were then referenced against the index dates to establish if the disease could be considered present at the time of the attendance. For conditions which required more than one hospitalisation, counts were assessed to check for presence of the disease. Finally, admission records were grouped by patient identifier and collapsed into a single record for each emergency attendance, detailing the conditions detected up to the point of presentation at the emergency department.
Missing data
Where a patient had no inpatient records (indicating no admission between 1st July 2017 and 31st March 2020), they were assumed to not have any chronic diseases for the purpose of this analysis. No strategy to impute diseases was employed.
Ethnicity data were missing in 15.9% of cases, and the distribution of known cases was extremely imbalanced. Deprivation data was missing in 0.06% of cases and was also imbalanced. We conducted a complete-case analysis, removing any cases which were found to lack ethnicity or deprivation data after linkage was completed. We also conducted analyses after imputing missing values to assess whether it impacted on findings. Missing ethnicity data were multiply imputed using a random forest classification algorithm 24 , which has been shown to be effective in handling complex non-parametric data 25 . Due to the small number of cases missing deprivation data, median imputation was used. Accuracy of the Random Forest Model was assessed using the out-of-bag error rate. Further details available in file S4.
Ethical approval
Delegated research ethics approval was granted for linkage to National Health Service (NHS) patient data by the Local Privacy and Advisory Committee at NHS Greater Glasgow and Clyde. Approval for this study was granted on 3rd September 2021.
Results
Description of study sample
63,328 patients were included in the complete case analysis, and 75,723 in the imputed analysis. Figure 1 details how this sample size was arrived at, Table 1 describes the overall sample for complete case analysis and stratifies by multimorbidity and complex multimorbidity. We report the complete case analysis in the main body of this article, with additional data in the supplemental files for the post-imputation sample (file S5) and analysis (file S3). Sample selection flow diagram. †Nurse-led minor injury units can not admit patients directly, ‡In order to avoid inflation of reattendances when individuals were transferred between facilities, §Data-linkage can only be conducted on patients with a clinical identification number, ¶First attendance used as index to calculate reattendance, statistical assumptions prevent repeated inclusion of the same case. Sample description. N = 12,395 cases were excluded from complete-case analysis for missing ethnicity (15.9%) and SIMD (0.6%) data. Low-count values (<5) and those which risk secondary identification are marked with an ‘X’. Represents whether any reattendances occurred within 30 days of index attendance. Percentage calculation excludes those who had died without reattending or were still admitted. Represents whether any reattendances occurred within 90 days of index attendance. Includes reattendances within 30 days. Percentage calculation excludes those who had died without reattending or were still admitted. Percentage calculation based on admitted patients. Inpatient and outpatient mortality, inclusive of mortality at earlier timepoints where applicable.
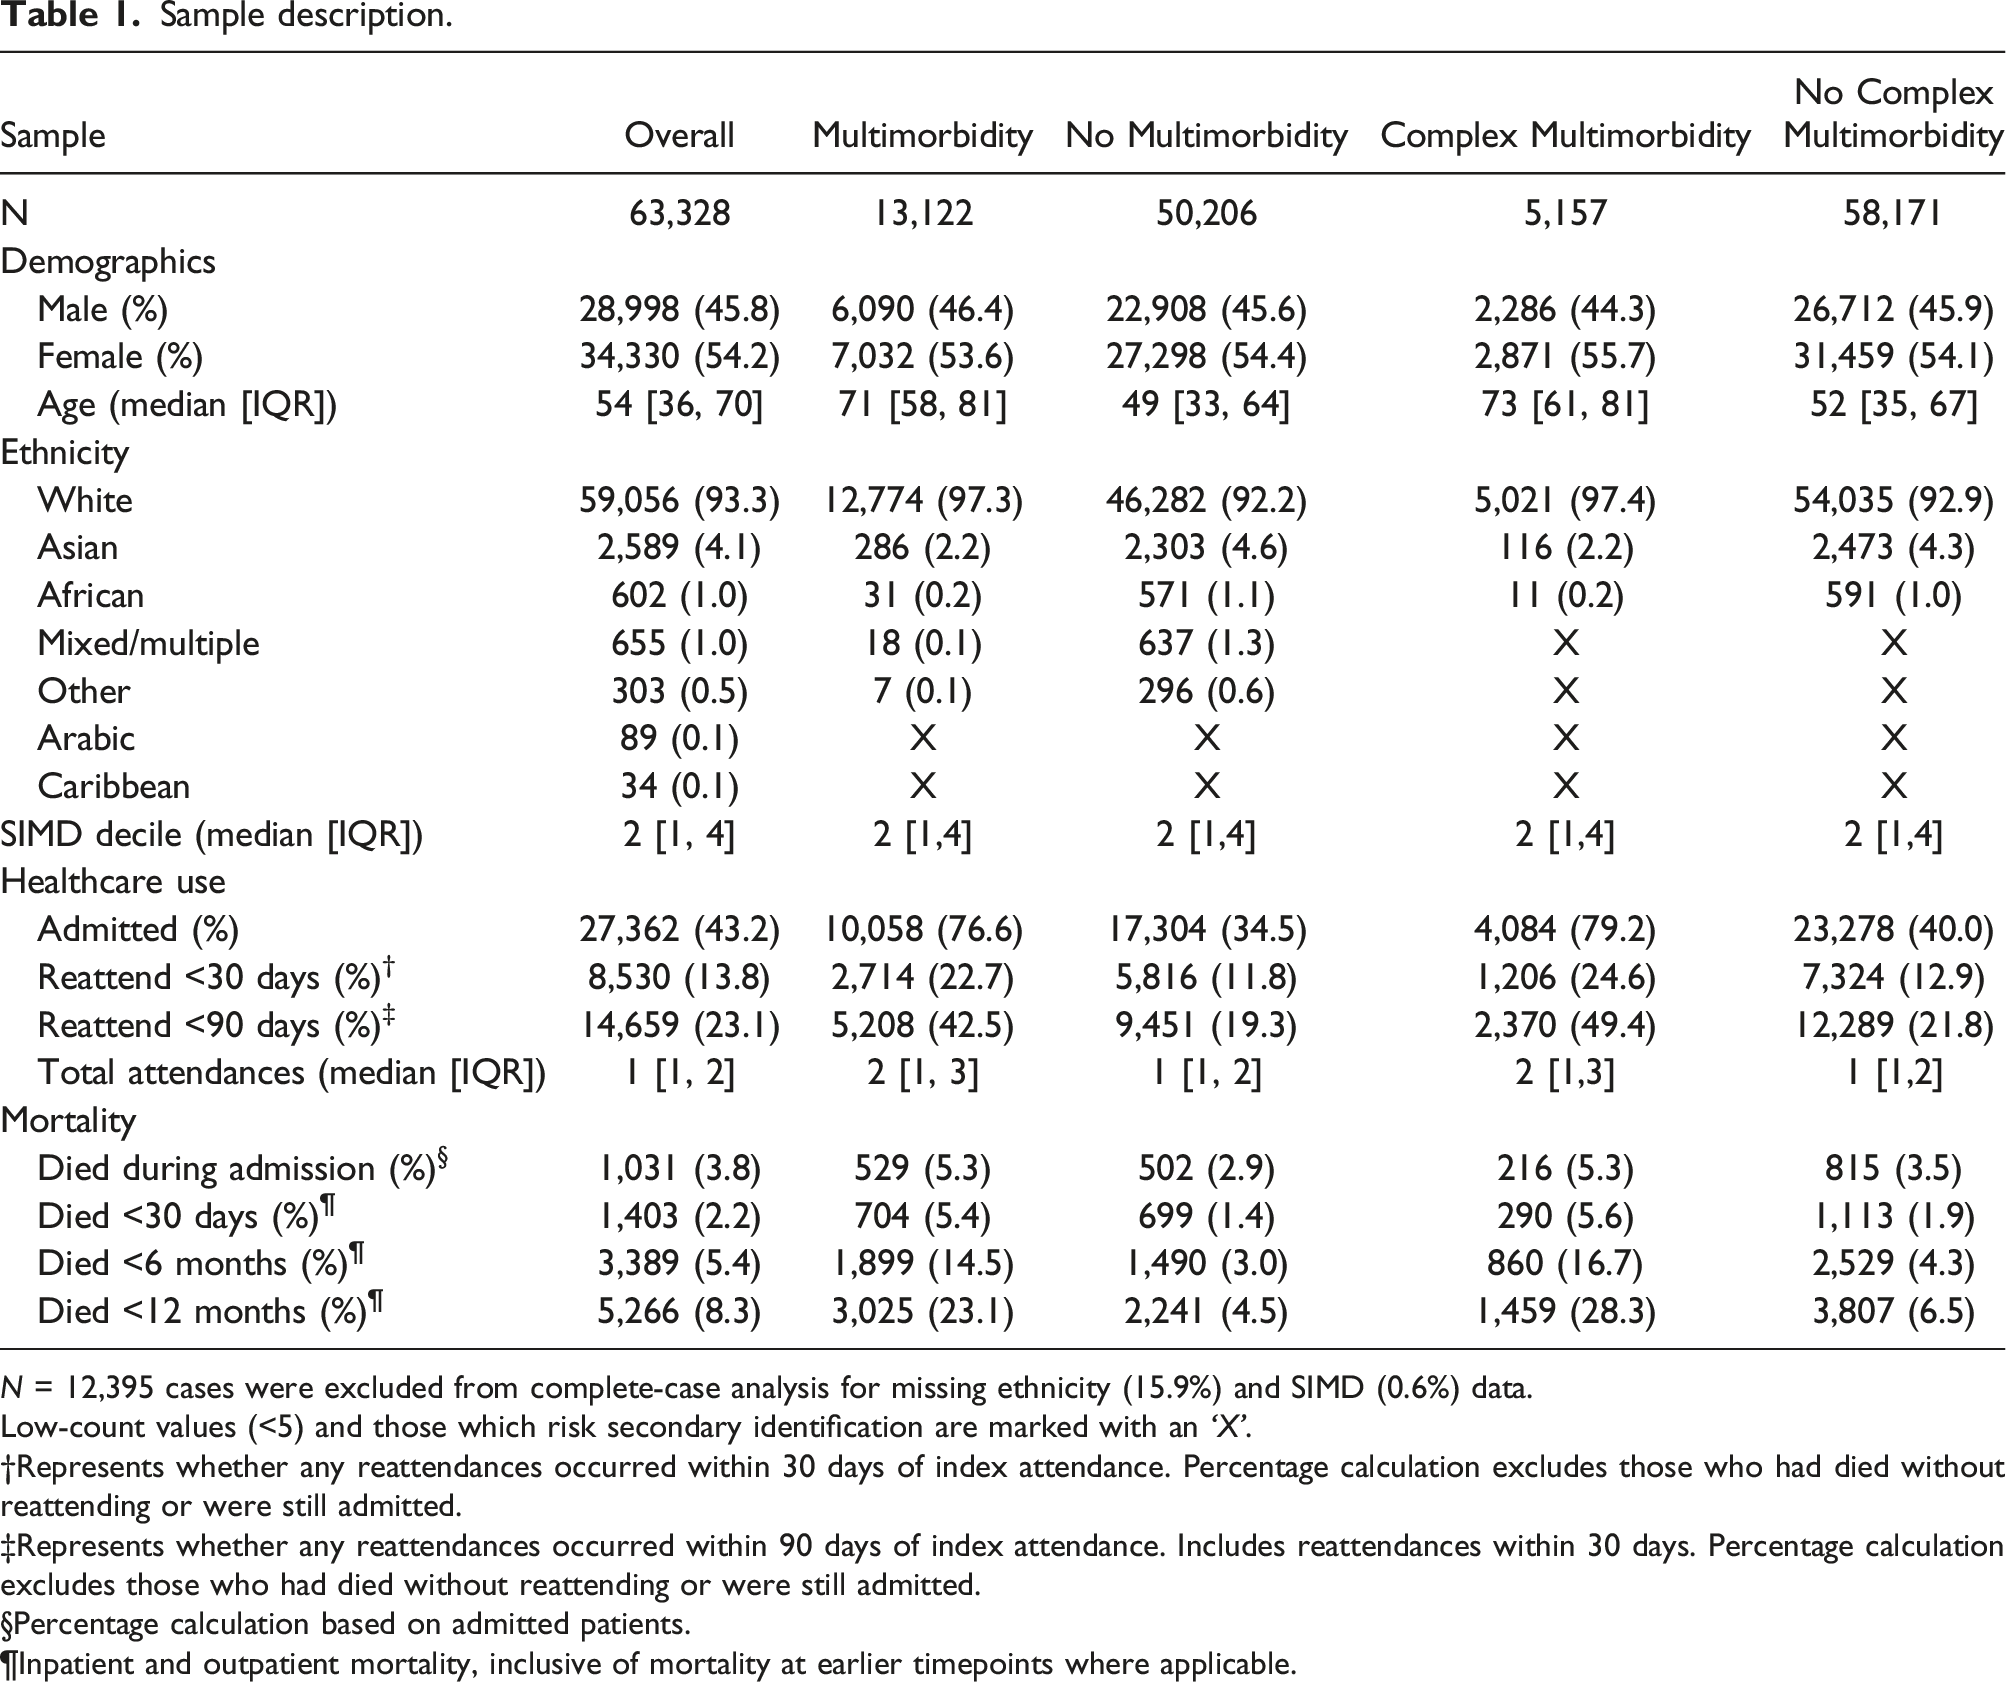
Most (n=34,330, 54.2%) participants were female, a significant majority were white (n=59,056, 93.3%) and the median age was 54 (interquartile range (IQR): 36-70). Socioeconomic deprivation was also common (Figure 2). Scottish Index of Multiple Deprivation (SIMD) by decile (n=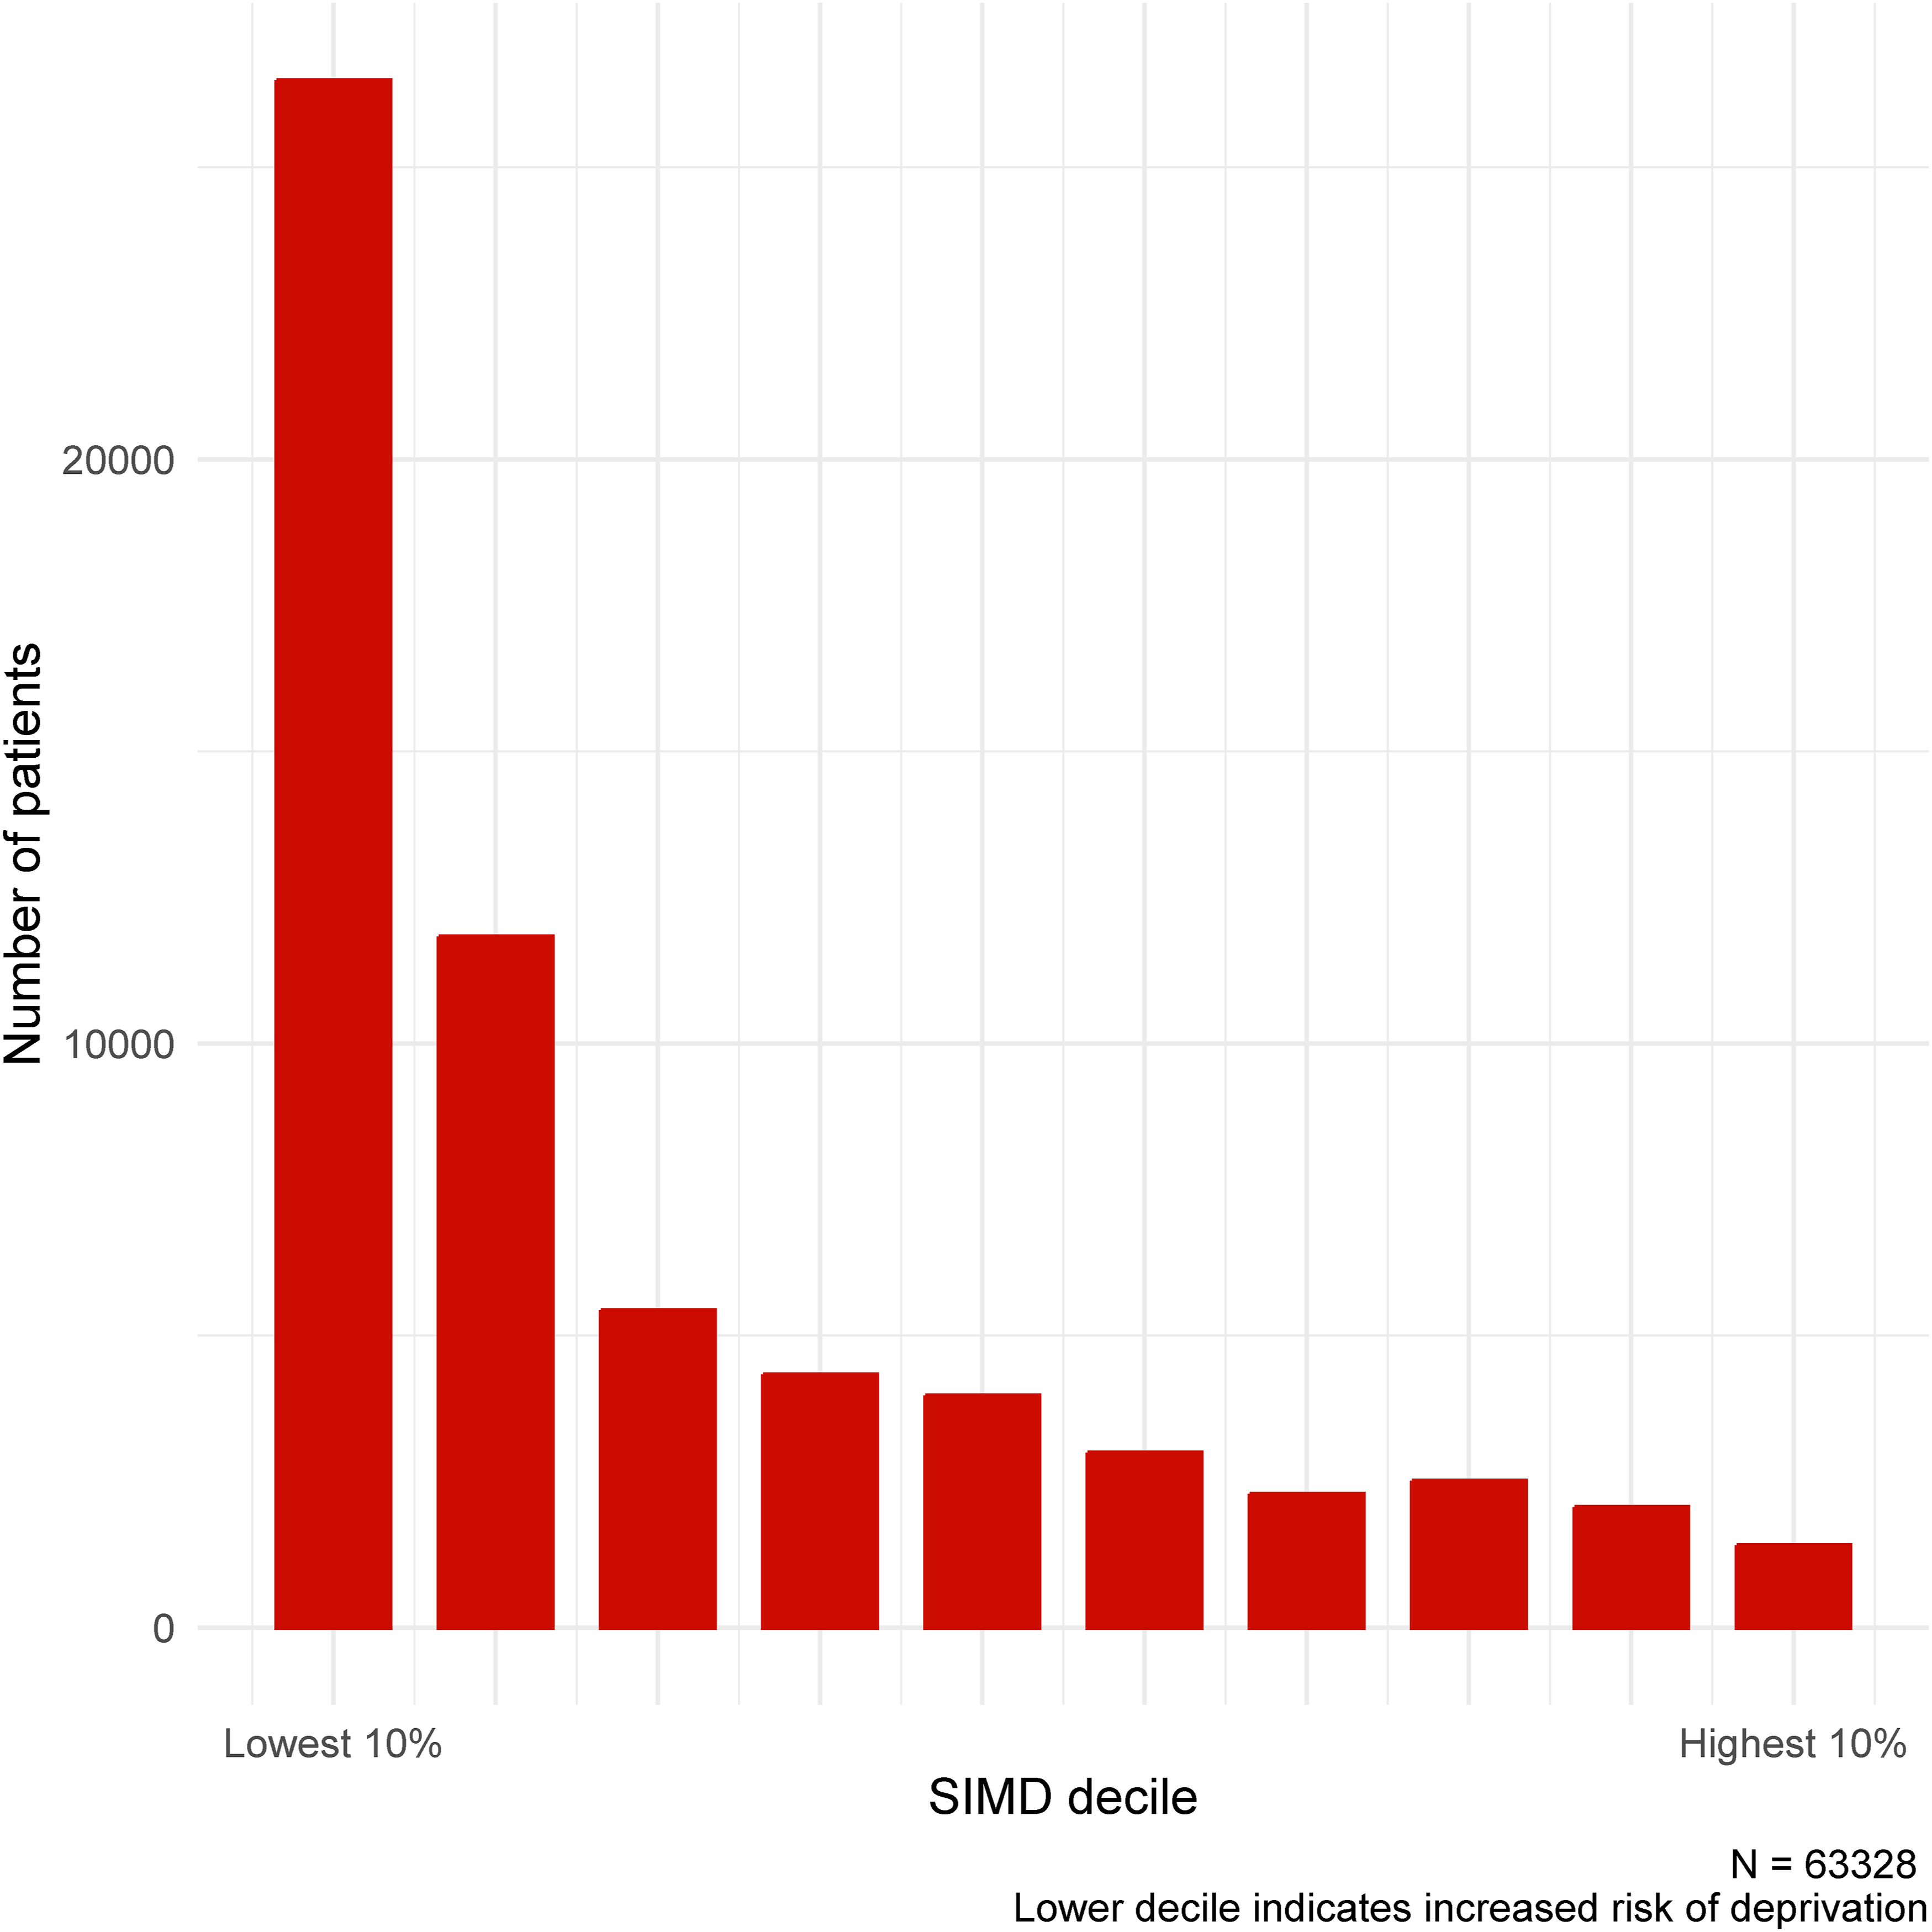
Disease count and frequency in total sample.


Disease frequency count in complete case analysis (n=63,328).
Emergency admission
Having multimorbidity (OR: 4.15, 95% CI: 3.96-4.35), or complex multimorbidity (OR: 3.41, 95% CI: 3.17-3.66) was significantly associated with admission to hospital. The risk was also significant for any level of disease burden, and highest for those with six or more chronic conditions (OR: 14.31, 95% CI: 9.76-20.91). Figure 4 provides a summary of effects. The association between multimorbidity, complex multimorbidity, disease-count and admission: complete case analysis (n=63,328).
30-day reattendance
As with admission, having multimorbidity (OR: 2.21, 95% CI: 2.09-2.34), or complex multimorbidity (OR: 2.20, 95% CI: 2.04-2.37) was significantly associated with 30-day reattendance at the emergency department. The risk was also significant for any level of disease burden, and highest for those with six or more chronic conditions (OR: 4.76, 95% CI: 3.54-6.34). Figure 5 provides a summary of effects. Those who had died before 30 days (without reattending) and those who were still admitted at 30 days were excluded from the analysis (n=1,553). The association between multimorbidity, complex multimorbidity, disease-count and 30-day reattendance: complete case analysis (n=61,775).
90-day reattendance
Again, the same association between multimorbidity (OR: 3.11, 95% CI: 2.96-3.26), complex multimorbidity (OR: 3.21, 95% CI: 3.01-3.41) and 90-day reattendance was detected. Disease count was significant at all levels and highest for those with six or more chronic conditions (OR: 10.79, 95% CI: 8.18-14.12). Figure 6 provides a summary of effects. Those who had died before 90 days (without reattending) and those who were still admitted at 90 days were excluded from the analysis (n=2,087). The association between multimorbidity, complex multimorbidity, disease-count and 90-day reattendance: complete case analysis (n=61,241).
Inpatient mortality
Unlike previous models, the relationship between exposures and inpatient mortality was neither significant nor linear in terms of increasing disease burden. Multimorbidity (OR: 1.13, 95% CI: 1.00-1.29) and complex multimorbidity (OR: 0.99, 95% CI: 0.85-1.16) were not significantly associated with death during admission. People with 1,2 or 3 chronic conditions were significantly more likely to die during admission, although this association was not present for those with more conditions. We hypothesise this is likely due to the low number of individuals with 4, 5, 6 or more conditions in this analytical cohort. Only those who were admitted to hospital were included in this analysis (n=27,362) (Figure 7). The association between multimorbidity, complex multimorbidity, disease-count and inpatient mortality: complete case analysis (n=27,362).
Comparison with imputed data
Summary of effect sizes.

Non-significant findings are italicised.
All models adjusted for age, sex, deprivation and ethnicity.
All p < 0.001 except where specified.
No differences were noted in direction of association between complete case and imputed analyses for any combination of exposure and outcome.
Discussion
This study found that multimorbidity, complex multimorbidity and disease burden are associated with significantly increased odds of hospital admission in people attending the emergency department, as well as increased odds of reattendance within 30 or 90 days. The relationship between these and inpatient mortality is not significant, except for those with 1, 2 or 3 chronic conditions. We found that around one in five people attending the emergency department had multimorbidity, fewer than one in ten had complex multimorbidity, and that common conditions in this population included chronic kidney disease, hypertension, chronic pulmonary disease, diabetes and alcohol misuse.
We sought a 12-month dataset in order to capture seasonal variations in attendances, in particular the impact of winter flu and other viruses. However, the COVID-19 pandemic will also have contributed towards the end of the study period, although most likely in reducing the number of attendances rather than through an influx of infections. From the first reported case in NHSGGC in early March till the end of our study period on 31st March 2020, a total of 679 cases and zero hospitalisations had been recorded in the health board 26 . However, in the first 3 months of 2019 there were 92,129 ED attendances, compared to 81,904 for the same period in 2020- a reduction of approximately 11% 27 .
A further point of interest is the comparatively low level of many conditions detected in this population when compared to a larger study conducted in England 20 , which looked at hospital inpatients on a national level. We detected lower levels of hypertension (9.2% vs 26.5%), diabetes (7.2% vs 11.6%), asthma (3.8% vs 9.5%), depression (2.5% vs 6.7%), hypothyroidism (1.3% vs 4.9%), chronic pain (1.0% vs 8.1%), rheumatoid arthritis (0.9% vs 2.4%), epilepsy (0.7% vs 1.9%), severe constipation (0.5% vs 2.9%), inflammatory bowel disease (0.5% vs 1.7%) and irritable bowel syndrome (0.3% vs 1.2%). While many of the other levels were comparable, a small number were more prevalent in our population, notably alcohol misuse (7.2% vs 3.0%). The absolute numbers of people with a history of myocardial infarction, stroke/TIA and cirrhosis were low in both populations, however our cohort had approximately double the proportion for all three (2.0% vs 1.2%, 2.4% vs 1.4%, and 1.8% vs 0.8% respectively).
We would suggest that these differences are more readily attributable to emergency department attending populations than to geographical differences alone, although there may also be differences when comparing this predominantly urban sample with other rural or mixed samples, or indeed when comparing secondary with primary care data. A large epidemiological study of multimorbidity conducted in Scotland by Barnett and colleagues using primary care data 14 detected higher levels of several diseases compared to the emergency department sample, including depression (2.5% vs 8.2%), hypertension (9.2% vs 13.4%), asthma (3.8% vs 6.0%), rheumatoid arthritis (0.9% vs 3.4%) and irritable bowel syndrome (0.3% vs 3.0%). Conversely, others were more prevalent in the emergency department sample, including alcohol misuse (7.2% vs 2.4%), chronic kidney disease (10.9% vs 1.9%), chronic pulmonary disease (8.8% vs 3.2%) and dementia (3.0% vs 0.7%). It is likely that some of this variation can be explained by differences in source data – conditions which drive hospital attendance are more likely to be present in SMR01 data, while primary care data often provides a more reliable record of morbidities – but some differences may still be attributable to population. While primary care services are effective in managing chronic conditions and multimorbidity in the long term, some of the prevalent conditions in this sample (such as alcohol misuse or chronic pulmonary disease) exacerbate rapidly and often unpredictably, and there is a clear need to better understand how multimorbidity presents in the emergency department and the extent to which it is a significant factor in driving healthcare use.
What this reinforces is that multimorbidity patterns and prevalence vary between settings. Interventions to reduce healthcare utilisation or improve quality of care for people with multimorbidity should take this into account and should be localised accordingly. The process of building and training the predictive models which often accompany such interventions should also be undertaken with this in mind. Multimorbidity, complex multimorbidity and disease count are significant factors in risk stratification for this group.
Implications for clinical practice and research
Understanding prospective risk in persons with multimorbidity at the point of presentation to an emergency department may serve clinicians by allowing for the development of risk-stratification tools. Our findings are based on algorithms tested against gold-standard methods of disease identification, and it would be a reasonable assumption that history of these conditions would be elicited by the assessing clinician in the emergency department. Further research is required to validate their use in this population, however. The recent development of the ISARIC 4C score for predicting mortality in hospitalised patients with COVID-19 28 demonstrated the utility of using information available to clinicians at the front-door of the hospital to aid in anticipatory decision-making, and a simple disease-count or binary identification of multimorbidity are easily attainable during assessment. This should be another factor to weigh when making admission and discharge decisions in a time-pressured environment.
The main implication at this point, however, is in developing better predictive models to identify people with multimorbidity who are at risk of these outcomes. Whether these are translated to easy-to-use tools for clinical use in the emergency department, or form the basis of machine-learning solutions to model risk across populations, the use of clinically meaningful data (i.e. diagnoses) will improve the interpretability of such models by clinicians, patients and researchers. The detected associations with negative outcomes in this study suggest that these algorithms can be deployed on relatively short-term data with reasonable sensitivity. Further validation of these algorithms on such short-term data would hopefully support this hypothesis.
Disease-clusters are increasingly the focus of multimorbidity research, although using data to derive latent clusters does not necessarily mean these will be linked to poorer outcomes 20 . The relationship between disease clusters and the outcomes explored here should be investigated further. We also recommend that confounding variables should be expanded to include other variables associated with poor outcomes such as polypharmacy and specific chronic conditions.
Strengths and limitations
This study provides further data on the epidemiology of multimorbidity and 28 important chronic conditions. It has made use of validated algorithms which detect the presence of these conditions with moderate to high accuracy in routinely collected patient data. Rigorous deployment of these algorithms means that comparisons can be made between this and other studies which use these algorithms.
However, this lack of validation on short-term data is the first of some related limitations. The inpatient records available for the purpose of this study dated from 1st July 2017, and to ensure parity between those attending at the start of the year and those attending at the end, we limited the look-back period for the detection of conditions to 21 months. There is a possibility that conditions which were considered permanent or lasted 2-5 years may have been under-detected in this data, were they not coded during any recent admissions. Testing models with more historical admission data would be a possible avenue for further research, as would the incorporation of primary care data. This study has found that multimorbidity and disease-count are significant factors in the prediction of a range of negative outcomes based on relatively short-term historical inpatient data, yet we suspect the true prevalence of chronic illness and multimorbidity in this population may be higher.
Secondly, the algorithm for chronic kidney disease detection was validated also using estimated glomerular filtration rate and urine albumin. Laboratory data were available but local reporting practices meant that the units of measurement were incompatible with the algorithm, and we therefore had to rely on ICD-10 codes only. This again may have led to under-detection, although the rates of chronic kidney disease detected in this study are comparable to those detected using both laboratory and ICD-10 data in a larger study from England 20 . Other minor adjustments to the algorithms were required to ensure compatibility with NHS Scotland data, although we believe the effect of these necessary modifications was negligible.
Some limitations are common to all studies using routinely-collected data as opposed to that which is collected explicitly for the purpose of research. In this case, misclassification bias may be introduced if ICD-10 coding is not comprehensive enough, or when coding is limited by a maximum number of entries. We sought to avert this by using algorithms validated with moderate-to-high accuracy, but this potential risk supports the need to for further validation on data from our population. Additionally, while we sought to control for bias resulting from missing data (through complete case analysis and comparison with imputed data), random forest classification and other types of multiple imputation assume data is missing at random, and this may not have been the case here.
Finally - to satisfy the assumption of independence for logistic regression - we used the first attendance for any individual as the index attendance from which reattendance would be calculated and disregarded any further attendances by the same individual during the 12-month period. This required the removal of 50,435 repeat attendances. In this population as in others, a small minority account for a large proportion of service use 29 , and any future predictive modelling would need to factor in the effect of these frequent attenders.
Conclusion
In people attending emergency departments, those with multimorbidity are at an increased risk of admission, reattendance and inpatient mortality compared to those with fewer than two conditions. Multimorbidity, complex multimorbidity and the number of chronic conditions a person has are significantly associated with future healthcare use in this population, therefore clinicians can and should consider the cumulative burden of disease when encountering such patients, not just the conditions which contribute to the immediate presentation. Clinically-observable patterns of multimorbidity can be used to target interventions to improve outcomes. People with multimorbidity are by definition a heterogenous group, so ensuring risk stratification takes place based on observable findings may improve recognition of those at risk of poorer outcomes.
Supplemental Material
Supplemental Material - Multimorbidity, disease count, mortality and emergency care use in persons attending the emergency department: a cross-sectional data-linkage study. S1: Summary of ICD-10 codes.
Supplemental Material for Multimorbidity, disease count, mortality and emergency care use in persons attending the emergency department: a cross-sectional data-linkage study by Chris McParland, Mark A Cooper, David J Lowe, Bethany Stanley, Bridget Johnston in Journal of Multimorbidity and Comorbidity
Supplemental Material
Supplemental Material - Multimorbidity, disease count, mortality and emergency care use in persons attending the emergency department: a cross-sectional data-linkage study. S2: Complete case models.
Supplemental Material for Multimorbidity, disease count, mortality and emergency care use in persons attending the emergency department: a cross-sectional data-linkage study by Chris McParland, Mark A Cooper, David J Lowe, Bethany Stanley, Bridget Johnston in Journal of Multimorbidity and Comorbidity
Supplemental Material
Supplemental Material - Multimorbidity, disease count, mortality and emergency care use in persons attending the emergency department: a cross-sectional data-linkage study S3: Imputed models.
Supplemental Material for Multimorbidity, disease count, mortality and emergency care use in persons attending the emergency department: a cross-sectional data-linkage study by Chris McParland, Mark A Cooper, David J Lowe, Bethany Stanley, Bridget Johnston in Journal of Multimorbidity and Comorbidity
Supplemental Material
Supplemental Material - Multimorbidity, disease count, mortality and emergency care use in persons attending the emergency department: a cross-sectional data-linkage study. S4: Imputation strategy.
Supplemental Material for Multimorbidity, disease count, mortality and emergency care use in persons attending the emergency department: a cross-sectional data-linkage study by Chris McParland, Mark A Cooper, David J Lowe, Bethany Stanley, Bridget Johnston in Journal of Multimorbidity and Comorbidity
Supplemental Material
Supplemental Material - Multimorbidity, disease count, mortality and emergency care use in persons attending the emergency department: a cross-sectional data-linkage study. S5: Post-imputation sample.
Supplemental Material for Multimorbidity, disease count, mortality and emergency care use in persons attending the emergency department: a cross-sectional data-linkage study by Chris McParland, Mark A Cooper, David J Lowe, Bethany Stanley, Bridget Johnston in Journal of Multimorbidity and Comorbidity
Supplemental Material
Supplemental Material - Multimorbidity, disease count, mortality and emergency care use in persons attending the emergency department: a cross-sectional data-linkage study. RECORD checklist.
Supplemental Material for Multimorbidity, disease count, mortality and emergency care use in persons attending the emergency department: a cross-sectional data-linkage study by Chris McParland, Mark A Cooper, David J Lowe, Bethany Stanley, Bridget Johnston in Journal of Multimorbidity and Comorbidity
Footnotes
Declaration of conflicting interests
The author(s) declared no potential conflicts of interest with respect to the research, authorship, and/or publication of this article.
Funding
This study was funded by NHS Greater Glasgow and Clyde as part of the first author’s clinical academic PhD fellowship.
Data availability
Cohorts and de-identified linked data were prepared by the West of Scotland Safe Haven at NHS Greater Glasgow and Clyde, access to these cohorts and datasets can be obtained via the West of Scotland Safe Haven through their standard governance, ethics and procedures.
Supplemental Material
Supplemental material for this article is available online.
References
Supplementary Material
Please find the following supplemental material available below.
For Open Access articles published under a Creative Commons License, all supplemental material carries the same license as the article it is associated with.
For non-Open Access articles published, all supplemental material carries a non-exclusive license, and permission requests for re-use of supplemental material or any part of supplemental material shall be sent directly to the copyright owner as specified in the copyright notice associated with the article.