
Abstract
Background:
Polycystic ovary syndrome (PCOS) is a common endocrine disorder among women of childbearing age, affecting 8%–13% globally, associated with hyperandrogenism, anovulation, insulin resistance, cardiovascular diseases, and psychological issues, contributing to infertility and long-term health risks.
Objective:
To estimate the prevalence of PCOS and its association with infertility, hormonal disturbances, metabolic comorbidities, and lifestyle factors among reproductive-aged women in the Barak Valley region of Assam, Northeast India—an ethnically diverse and underserved area where genetic, lifestyle, and healthcare disparities may influence the prevalence and clinical presentation of PCOS.
Design:
Case-control study.
Methods:
A pre-validated questionnaire-based screening and multi-stage stratified random sampling method was applied among women aged 18–40 years based on Rotterdam criteria (2003) and NHMRC guidelines (2018). Clinical and biochemical hyperandrogenism, anthropometric, metabolic, hormonal, and ultrasonographic parameters were assessed.
Results:
The prevalence of PCOS was 9.18% (n = 53), with higher occurrence among native Bengali women. Phenotypes A, B, C, and D were identified at 39.62%, 20.75%, 7.54%, and 32.07%, respectively. Clinical hyperandrogenism manifested as acne (49.05%), hirsutism (43.39%), and alopecia (28.3%), while biochemical hyperandrogenism was observed in 92.45% based on elevated free testosterone levels. Menstrual issues involved oligomenorrhea (45.28%), amenorrhea (30.18%), and dysmenorrhea (33.96%). Metabolic abnormalities such as type II diabetes (52.83%), overweight (30.18%), obesity (9.43%), and obstructive sleep apnea (37.73%) were frequent. Elevated BMI, waist–hip ratio, luteinizing hormone (LH), anti-Müllerian hormone, and LH/FSH (follicle-stimulating hormone) ratio were observed. Free testosterone correlated strongly with clinical symptoms. Urban women reported poorer dietary habits (61.36%). Family history of PCOS and anxiety were commonly associated factors.
Conclusion:
PCOS in Barak Valley shows strong hormonal and metabolic abnormalities that may be influenced by lifestyle factors and underlying genetic predisposition. Early detection, targeted lifestyle changes, and regional awareness strategies are essential for improving reproductive and metabolic outcomes.
Plain language summary
The study reports prevalence of PCOS at 9.18% (n = 53), with higher occurrence among native Bengali women in the Barak Valley of northeast India. Phenotypes A, B, C, and D have been identified at 39.62%, 20.75%, 7.54%, and 32.07%, respectively. Clinical hyperandrogenism manifested as acne (49.05%), hirsutism (43.39%), and alopecia (28.3%), while biochemical hyperandrogenism was observed in 92.45% based on elevated free testosterone levels. Menstrual issues involved oligomenorrhea (45.28%), amenorrhea (30.18%), and dysmenorrhea (33.96%). Metabolic abnormalities such as type II diabetes (52.83%), overweight (30.18%), obesity (9.43%), and obstructive sleep apnea (37.73%) were frequent. Elevated BMI, waist-hip ratio, LH, AMH, and LH/FSH ratio were observed. Free testosterone correlated strongly with clinical symptoms. Urban women reported poorer dietary habits (61.36%). Family history of PCOS and anxiety were commonly associated factors in the present case-control study.
Introduction
Polycystic ovary syndrome (PCOS) is a common endocrine disorder affecting women of reproductive age, with a global prevalence of 8%–13%.1–5 The disorder was first described by Stein and Leventhal in 1935, based on seven cases of women presenting hirsutism, amenorrhea, and distinctive ovarian morphology observed in histological specimens obtained from ovarian wedge resections.6–9 PCOS is predominantly characterized by hyperandrogenism (HA), chronic anovulation, and irregular menstrual cycles (IMC), including oligomenorrhea or amenorrhea. 7 Women suffering from the disorder may exhibit a range of symptoms, including hirsutism, alopecia, acne, 4 insulin resistance (IR), 10 infertility, 2 reduced libido, 11 fatigue, 12 ovarian cysts, 5 weight fluctuations, 13 dyslipidemia, 14 cardiovascular diseases (CVDs), 14 hypertension, 15 endometrial hyperplasia, 5 ovarian or breast cancer, 16 and Hashimoto’s disease, 17 among others. These symptoms are associated with hormonal imbalances such as luteinizing hormone (LH), follicle-stimulating hormone (FSH), androgens, anti-Müllerian hormone (AMH), estradiol (E2), prolactin (PRL), and progesterone.10,15,18–20 Although the exact pathophysiology or etiology of the disorder remains indistinct, its clinical manifestations are influenced by factors such as genetics, 21 age, endocrine and metabolic abnormalities, 8 family history, 22 anxiety, 15 environmental exposure, lifestyle, ethnicity, and geographical location.23–25 The diagnosis of PCOS is typically based on widely accepted clinical criteria, such as the National Institutes of Health (NIH, 1990) and the Rotterdam (2003) criteria. The NIH criteria necessitate the presence of both HA and ovulatory dysfunction (OD) for diagnosis.1,26 In contrast, the Rotterdam criteria include an additional requirement of polycystic ovarian morphology (PCOM) on ultrasound imaging, and the diagnosis requires the presence of at least two out of the three following parameters: HA, OD, and PCOM. This classification allows for four distinct phenotypic subgroups: phenotype A [HA + OD + PCOM], phenotype B [HA + OD], phenotype C [HA + PCOM], and phenotype D [OD + PCOM]. 27 This criterion is also endorsed by the international evidence-based guideline for the assessment and management of PCOS (NHMRC, 2018) for diagnostic purposes.1,2 Recent studies show a rising global burden of PCOS. In 2021, over 65 million women were affected, nearly double the earlier estimate, reflecting an ~89% increase over three decades. 28 India carries a considerable share, with a pooled prevalence of ~10% based on Rotterdam criteria. 29 However, the reported prevalence within India varies widely depending on the population and diagnostic criteria used, ranging from around 3.7% up to 22% in different studies. 30 Certain sub-populations have shown even higher rates—for example, some localized surveys have observed PCOS affecting over 30% of women in specific. 30 These disparities highlight the influence of genetics, lifestyle, and environment, underscoring the need for region- and ethnicity-specific screening and management. Despite the high overall burden of PCOS in India, there remain gaps in epidemiological data from various regions. Notably, Bharali et al. observed that most available studies were concentrated in the southern parts of India, with a paucity of data from the eastern part of the country. 29 The Barak Valley of southern Assam, characterized by ethnic diversity, distinct genetics, and unique cultural and environmental factors, has not been systematically studied. To address this gap, the present study assesses the prevalence and clinical–biochemical features of PCOS in this population, aiming to provide region-specific data for targeted screening and prevention. The findings aim to shed light on the regional heterogeneity of PCOS and contribute valuable data to inform targeted screening, management, and prevention strategies for diverse populations across India.1,31
To address the lack of region-specific evidence, this study was conducted to estimate the prevalence of PCOS in the Barak Valley region of Northeast India and to describe its clinical, biochemical, metabolic, hormonal, and ultrasonographic features. Particular emphasis was placed on hyperandrogenic manifestations and associated risk factors such as anthropometric and lifestyle indicators. By documenting these characteristics in an ethnically diverse and previously understudied population, the study aims to provide data that can improve diagnostic accuracy, highlight regional variations, and inform culturally appropriate strategies for screening and management of PCOS.
Material and methods
Study population
The sample size for the cross-sectional comparative study was calculated using the Power and Sample Size Calculation software (version 2.1.31), 32 with the null hypothesis assessed via a continuity-corrected chi-squared statistic. The calculation was manually verified using statistical formulas specific to case-control studies.33,34 An independent case-to-control ratio of 1:1 was applied. The probability of exposure among controls was set at 0.3. 35 The true odds ratio (OR) was estimated at 2 for the disorder in exposed women relative to unexposed women, determined using a two-by-two frequency table. 36 Type I error probability (alpha) was set at 0.05, with a 95% confidence interval (CI), and the study was powered at 80%, corresponding to a Z value of 1.96. 35 The study was carried out in four stages and three phases: initial screening with a pre-validated questionnaire, followed by assessment of clinical and biochemical signs of HA, hormonal parameters, metabolic risk factors, and ultrasonographic features to evaluate PCOS phenotypes and associated abnormalities. Subsequent sections describe each assessment in detail. The reporting of this study conforms to the Strengthening the Reporting of Observational Studies in Epidemiology (STROBE) guidelines for case and control studies (Supplemental Material). 37
Inclusion and exclusion criteria
The study included women aged 18–40 years, diagnosed with IMC, where oligomenorrhea was assessed as menstrual cycles occurring <21 days (⩽8 cycles/year) or >35 days (>8 cycles/year with a high degree of irregularity), while amenorrhea referred to the total absence of menstruation (⩾6 months) according to the Rotterdam criteria (2003). 27 Married women who voluntarily provided informed consent and agreed to participate were recruited from the Outpatient Department of Silchar Medical College and Hospital, Silchar, India. Women were excluded if they had other endocrine disorders (hyperprolactinemia, congenital adrenal hyperplasia, hyperthyroidism, Cushing’s syndrome, or androgen-secreting tumors), incomplete hospital records, or if they were postpartum, lactating, had premature ovarian failure, or had a history of ovarian surgery.
Questionnaire
All participants were interviewed face-to-face using a structured questionnaire based on the study’s objectives and the general practice tools recommended by the NHMRC (2018).1,2 The questionnaire covered personal history, awareness of PCOS, family history, menarche, menstrual cycle patterns, marital status, dietary habits, physical activity, consanguinity, mental health (anxiety), and any history of miscarriage or PCOS. 1 Dietary habits were recorded using a structured questionnaire adapted from the NHMRC guidelines (2018). Participants were asked about meal frequency, timing, and food type. Responses were categorized into healthy/regular diet versus unhealthy/irregular diet based on frequency of heavy/unhealthy food intake and irregular eating patterns. Lifestyle data, including smoking, alcohol, betel nut, tobacco, and caffeine use, were also collected. Exercise frequency and duration were recorded as part of the structured interview. Participants reported the average number of days per week and minutes per session of physical activity. Based on responses, activity was classified as no activity, low activity (⩽30 min, 1–2 days/week), or moderate activity (⩾30 min, ⩾3 days/week). In our cohort, only 20.75% of women with PCOS and 13.20% of controls reported engaging in any regular exercise. Incidence of primary and secondary infertility was recorded from participants’ self-reported reproductive history during structured interviews. We used standard WHO definitions—primary infertility was defined as failure to conceive after ⩾12 months of regular unprotected intercourse in women with no prior pregnancies. Secondary infertility was defined as failure to conceive after ⩾12 months of regular unprotected intercourse in women who had at least one previous conception, regardless of outcome. Prior informed consent was obtained from all participants prior to data collection, and ethical approval for the study was granted by the institutional ethics committee.
Clinical hyperandrogenism assessment
HA, a key diagnostic feature of PCOS, affects 60%–100% of women with PCOS and manifests as both clinical (hirsutism, alopecia, acne) and biochemical symptoms. 38 Assessment is challenging due to variations in methods, ethnic differences, and confounding factors like weight and age. Hirsutism was assessed using the modified Ferriman–Gallwey score, with a score of ⩾8 indicating its presence. 39 Alopecia was assessed using the Ludwig visual scale, 40 while acne severity was evaluated using the Global Acne Grading System, which estimated comedonal acne on the face, neck, upper back, chest, or arms. Moderate to severe comedonal acne was classified as having 10–30 or more lesions on the face.41,42
Biochemical hyperandrogenism and hormonal assessment
Androgen measurements are essential for detecting biochemical hyperandrogenism (BHA) in suspected PCOS cases, particularly in women with minimal or no clinical signs of HA, such as hirsutism. Free testosterone (free T) alone has been reported to detect approximately 50%–60% of women with PCOS for BHA detection.19,38 When free T levels were not elevated, additional androgens, including androstenedione and dehydroepiandrosterone sulfate, were assessed for supplementary diagnostic information.19,38 Serum testosterone levels >82 ng/dL were considered elevated. Venous blood samples (5 mL) were collected from all participants after at least 8 h of fasting, between the second and fourth days of the menstrual cycle (follicular phase).1,8,41 In women with regular menstrual cycles, hormonal assessment was performed during the early follicular phase (days 2–5 of the cycle). For participants with PCOS who had irregular or absent cycles, the follicular phase was approximated by inducing withdrawal bleeding with a short course of oral progesterone. Blood samples were then collected within 3–5 days of withdrawal bleeding to standardize the timing of hormonal measurements. This approach ensured that all participants, regardless of cycle irregularity, were evaluated in a comparable follicular phase window.
Hormonal profiling included LH, FSH, estradiol (E2), progesterone, prolactin, free testosterone, and AMH, all of which were analyzed on the VITROS 3600 Immunodiagnostic System (Ortho Clinical Diagnostics, Raritan, NJ, USA) based on enhanced chemiluminescence immunoassay technology. 43 Specific VITROS Immunodiagnostic Product reagent kits provided by Ortho Clinical Diagnostics were used for each hormone assay. The analytical sensitivity for LH and FSH was approximately 0.2–0.3 IU/L, with reported clinical sensitivity and specificity exceeding 95% for both. 43 Estradiol assays demonstrated an analytical sensitivity of approximately 20 pg/mL with clinical sensitivity and specificity around 90%–95%, while progesterone assays had a detection limit of about 0.2 ng/mL and comparable diagnostic accuracy. 43 Prolactin was measured with a lower detection limit of about 0.1 ng/mL and >95% sensitivity and specificity. 43 Free testosterone was measured using the VITROS testosterone assay, which has an analytical sensitivity of about 5–10 ng/dL and clinical sensitivity and specificity reported between 85% and 95%. 43 AMH levels were determined using the VITROS AMH assay with an analytical sensitivity of 0.1 ng/mL and diagnostic sensitivity and specificity exceeding 95%, in line with the manufacturer’s specifications and previous validation studies. 43 All assays were performed following the manufacturer’s protocols with appropriate internal quality control measures, and results were interpreted against standard reference ranges. Hormonal results were interpreted according to the reference ranges established and validated by the clinical laboratory at which assays were performed. These laboratory-specific ranges may vary slightly from manufacturer-provided ranges due to differences in calibration, assay population, and validation standards. 43
Short-term and long-term risk factor profiling
Anthropometric analysis
Anthropometric assessments included measurements of body height (cm), body weight (kg), hip circumference (HC, cm), and waist circumference (WC, cm). Body mass index (BMI) was evaluated using the Quetelet formula (weight in kg divided by height in m2) following the WHO guidelines. 44 Participants were classified as underweight (>18.05), normal weight (18.05–24.9), overweight (25.0–29.9), and obese (30.0–39.9). Additionally, women with a waist–hip ratio (WHR) between 0.80 and 0.84 were categorized as overweight, while those with a WHR greater than 0.85 were classified as obese. 44
Metabolic risk assessment
For the metabolic assessment associated with PCOS, venous blood samples were collected after at least 8 h of fasting. Random blood sugar (RBS) and lipid profile parameters, including total cholesterol, high-density lipoprotein cholesterol (HDL-C), low-density lipoprotein cholesterol (LDL-C), and triglycerides, were analyzed using the standard protocol. The analytical sensitivity of glucose assays on the EM 200 (Transasia Bio-Medicals Limited, Mumbai, India) has been reported at approximately 2–5 mg/dL, with clinical sensitivity and specificity exceeding 95% for diagnosing hyperglycemia. 45 Lipid assays demonstrated analytical sensitivity of 1–3 mg/dL for cholesterol and triglycerides, with clinical sensitivity and specificity >90% compared to reference methods. 45 Hematological parameters, including hemoglobin (Hb) and hematocrit (packed cell volume, PCV), were measured using the Transasia Erba 5-Part Fully Automated Hematology Analyzer (Transasia Bio-Medicals Ltd., Mumbai, India). 46 The instrument employs impedance and optical fluorescence flow cytometry, with reported analytical sensitivity of approximately 0.1 g/dL for hemoglobin and coefficient of variation <2% across all CBC parameters, corresponding to a clinical sensitivity and specificity >95%. 46 Hypertension was evaluated using a sphygmomanometer based on the WHO guidelines, stated as systolic blood pressure of ⩾140 mmHg and diastolic blood pressure of ⩾90 mmHg. 47
Measurement of anxiety
Anxiety levels were assessed using the Generalized Anxiety Disorder 7-item (GAD-7) scale, a validated self-report questionnaire widely applied in clinical and epidemiological studies. The tool assesses the frequency of core anxiety symptoms over the preceding 2 weeks, with each of the seven items scored from 0 (“not at all”) to 3 (“nearly every day”), giving a total score between 0 and 21. Established cut-offs were used to classify severity as minimal, mild, moderate, or severe. This standardized instrument ensured consistent and reproducible evaluation of anxiety symptoms across participants. 48
Ultrasound assessment
According to Australia’s National Health and Medical Research Council (NHMRC) and Rotterdam guidelines, transvaginal ultrasound is the favored method for the detection of PCOS, phenotype identification, and determination of cyst size. PCOM is confirmed by 12 or more follicles in each ovary, about 2–9 mm in diameter, and/or an increased ovarian volume of ⩾10 cm3. To assess the potential risk of endometrial cancer in PCOS, transvaginal ultrasound or endometrial biopsy is recommended for persistently thickened endometrium or in the presence of risk factors such as prolonged amenorrhea, abnormal vaginal bleeding, or obesity.1,27
Statistical analysis
A descriptive statistical study was conducted using SPSS software (version 27.0, IBM Corporation, New York, NY, USA) to determine the statistical significance, interrelationships, and association of PCOS with infertility. Case and control characteristics were assessed, and percentages were calculated. PCOS was the dependent variable, while various anthropometric, biochemical, and hormonal parameters were analyzed as independent variables to identify the potential risk factors. Categorical variables and OR were evaluated using the chi-square test (χ²). Continuous variables were presented as mean ± standard deviation (SD), and significant differences between the PCOS and control groups were evaluated using the student’s t test. Pearson correlation coefficient was conducted to reveal the relationships between free T levels and various parameters such as BMI, WHR, hirsutism, acne, alopecia, anxiety, free T3/T4, thyroid-stimulating hormone (TSH), RBS, lipid profile, LH, FSH, AMH, estradiol, progesterone, etc. Multivariate analysis was used to determine the relative risk associated with factors potentially contributing to PCOS. Results with p value <0.05 with a 95% CI were considered statistically significant.
Results
Prevalence of PCOS
The prevalence study was conducted in a four-stage, three-phase process with Stage 1 involving initial PCOS screening, wherein a total of 882 women were randomly selected. Of the women approached for the study, 41.9% declined participation, while 58.1% were excluded based on the Rotterdam and NHMRC guidelines. The remaining 577 women consented to participate, completed PCOS screening, and underwent face-to-face interviews. In Stage 2, selected women proceeded to phase-I clinical hyperandrogenism (CHA) assessment, where they were categorized as: women exhibiting no PCOS features (n = 385), women displaying one feature (n = 127), and women showing two PCOS features (n = 65). Stage 3 involved the collection of blood samples for phase-II BHA and hormonal profiling, which identified 74 women with probable and 11 with definitive PCOS. In Stage 4, phase-III ultrasonography was conducted to evaluate the phenotypic ovarian morphology and status among probable PCOS cases. This evaluation confirmed 42 additional PCOS cases. In total, 53 women were diagnosed with PCOS, resulting in a prevalence rate of 9.18% (Figure 1).
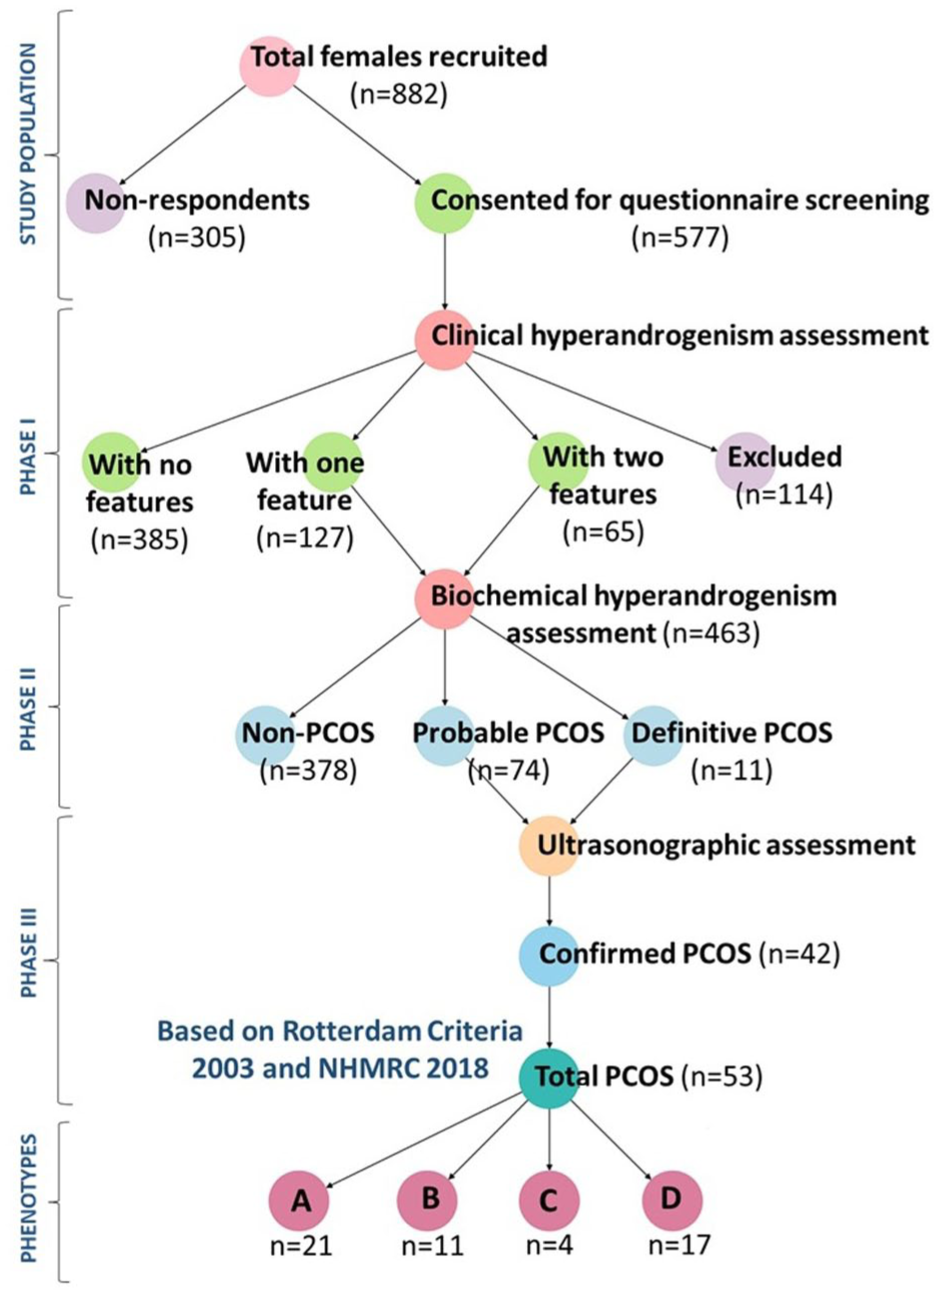
The figure depicts the four-stage, three-phase screening strategy used to identify and evaluate PCOS in the study population. Phase I: Initial screening with self-reported questionnaires assessed symptoms like menstrual irregularities, CHA, and lifestyle factors, categorizing participants by symptom severity. Phase II: BHA, anthropometric measurements, and comprehensive hormonal assays identified probable PCOS cases. Phase III: Confirmatory diagnosis utilized ultrasonography based on Rotterdam (2003) and NHMRC criteria (2018), categorizing participants into PCOS and non-PCOS groups. The outcomes at each phase, including the proportion progressing through the screening process, PCOS prevalence estimates, and subgroup analyses by ethnicity, age, genetic, environmental, and lifestyle factors.
HA assessment
In the PCOS group, the prevalence of CHA symptoms was predominated by acne (49.05%) followed by hirsutism (43.39%), and alopecia (28.3%; Table 1) with corresponding mean ± SD values of 7.18 ± 7.76, 0.43 ± 0.77, and 12.33 ± 13.18, respectively. In the control group, the prevalence rates for these symptoms were 22.64%, 7.54%, and 9.43% for acne, hirsutism, and alopecia, respectively, with respective mean ± SD values of 0.20 ± 0.76, 0.09 ± 8.59, and 4.43 ± 8.59 (Table 2). Additionally, BHA, as measured by free T levels, was significantly raised in the PCOS group with mean ± SD values of 101.99 ± 17.49 compared to the control group (62.33 ± 15.60; Table 2).
Frequency distribution of CHA in PCOS patients.
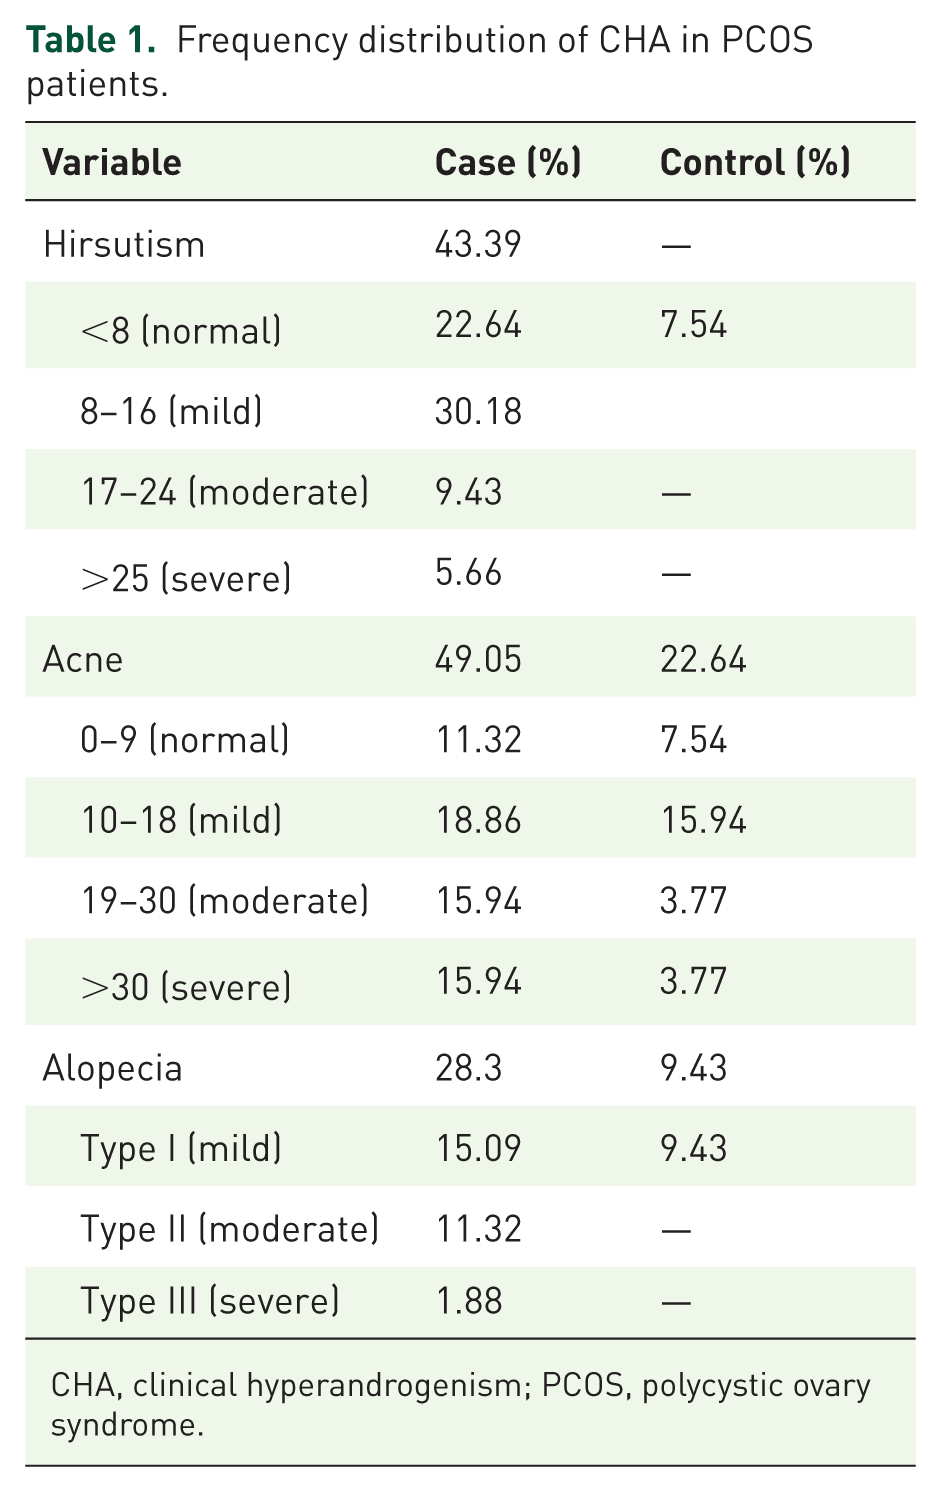
CHA, clinical hyperandrogenism; PCOS, polycystic ovary syndrome.
Descriptive analysis of clinical characteristics among PCOS and control subjects.

Interpreted values with their respective mean ± standard deviation and Student’s t values.
AMH, anti-Müllerian hormone; BMI, body mass index; CI, confidence level at 95%; DBP, diastolic blood pressure; FSH, follicle-stimulating hormone; Hb, hemoglobin; HDL, high-density lipid; LDL, low-density lipid; LH, luteinizing hormone; OSA, obstructive sleep apnea; PCOS, polycystic ovary syndrome; PCV, packed volume cell; RBS, random blood sugar; SBP, systolic blood pressure; T3/T4, thyroxine; TSH, thyroid-stimulating hormone; p value, significance level at 0.05; t, Student’s t test value.
Ovarian dysfunction and hormonal profiling
The prevalence of menstrual irregularities among women with PCOS was determined as follows: oligomenorrhea (45.28%), amenorrhea (30.18%), and dysmenorrhea (33.96%), compared to 18.86% for dysmenorrhea in the control group. The age-wise distribution of IMC in the case group showed the highest prevalence of oligomenorrhea (13.2%) in the 26–30 age group and least prevalent (9.43%) in the 36–40 age group, the prevalence of amenorrhea was highest (11.32%) in the 20–25 age group and lowest (1.88%) in the 36–40 age group and dysmenorrhea was highest (15.08%) in the 20–25 age group and lowest (1.88%) in the 36–40 age group. Among women with oligomenorrhea, 13.2% had menstrual intervals shorter than 21 days, 22.64% experienced intervals of more than 35 days to 6 months, and 9.43% reported intervals exceeding 6 months (Table 3). The mean ± SD values for various hormonal parameters in the PCOS group were LH (24.73 ± 8.17), FSH (15.62 ± 7.39), AMH (19.17 ±7.41), estradiol (40.67 ± 8.19), progesterone (0.24 ± 0.22), prolactin (15.98 ± 5.80), and LH/FSH ratio (1.90 ± 0.99), while the corresponding values in the control group were LH (7.19 ± 1.78), FSH (11.57 ± 4.54), AMH (4.53 ± 2.03), estradiol (27.50 ± 6.64), progesterone (0.22 ± 0.24), prolactin (14.82 ± 4.92), and LH/FSH ratio (1.61 ± 0.55; Table 2).
Distribution of IMC among PCOS patients and controls, along with an age-wise breakdown of clinical ovarian dysfunction.

It categorizes menstrual irregularities into oligomenorrhea (infrequent cycles), amenorrhea (absence of cycles), and dysmenorrhea (painful menstruation), displaying their prevalence in PCOS and control groups. Oligomenorrhea is most prevalent among PCOS patients (45%), particularly in the 20–25 age group (15.08%), while amenorrhea peaks in the 31–35 age group (11.32%). Dysmenorrhea is observed in both groups but is more common in PCOS patients (35%) than controls (15%). The data highlights the significant impact of PCOS on menstrual dysfunction, with no cases of oligomenorrhea or amenorrhea in the control group.
IMC, irregular menstrual cycles; PCOS, polycystic ovary syndrome.
Primary and secondary infertility
The frequency of primary and secondary infertility in the PCOS group was recorded as 56.60% and 43.39%, respectively (Table 2).
Anthropometric and other risk factors assessment
The demographic, anthropometric, and short-/long-term risk parameters assessed between cases and controls are descriptively summarized in Table 2. The BMI distribution in the case group was as follows: overweight (30.18%), obese (9.43%), and normal (60.37%), compared to 30.18%, 5.66%, and 64.15% in the control group (Figure 2). Additionally, the prevalence of WHR > 0.85 was 86.67% in the PCOS group and 54.71% in the control group. The mean ± SD values for BMI and WHR were 24.91 ± 4.03 and 0.92 ± 0.55 in the PCOS group, compared to 23.89 ± 3.18 and 0.86 ± 0.06 in the control group. Furthermore, hypertension and obstructive sleep apnea (OSA) were observed in 54.71% and 37.73% of PCOS women, compared to 30.18% and 18.86% in the control group. The mean values for age, anxiety scores, Hb, RBS, PCV, total cholesterol, HDL, LDL, and triglycerides in the PCOS group were 29.96, 8.26, 11.70 g/dL, 109.93 mg/dL, 39.39%, 210.22 mg/dL, 37.39 mg/dL, 106.10 mg/dL, and 151.37 mg/dL, respectively. Corresponding values in the control group were 29.96, 8.26, 11.70 g/dL, 109.93 mg/dL, 39.39%, 210.22 mg/dL, 37.39 mg/dL, 106.10 mg/dL, and 151.37 mg/dL, respectively.
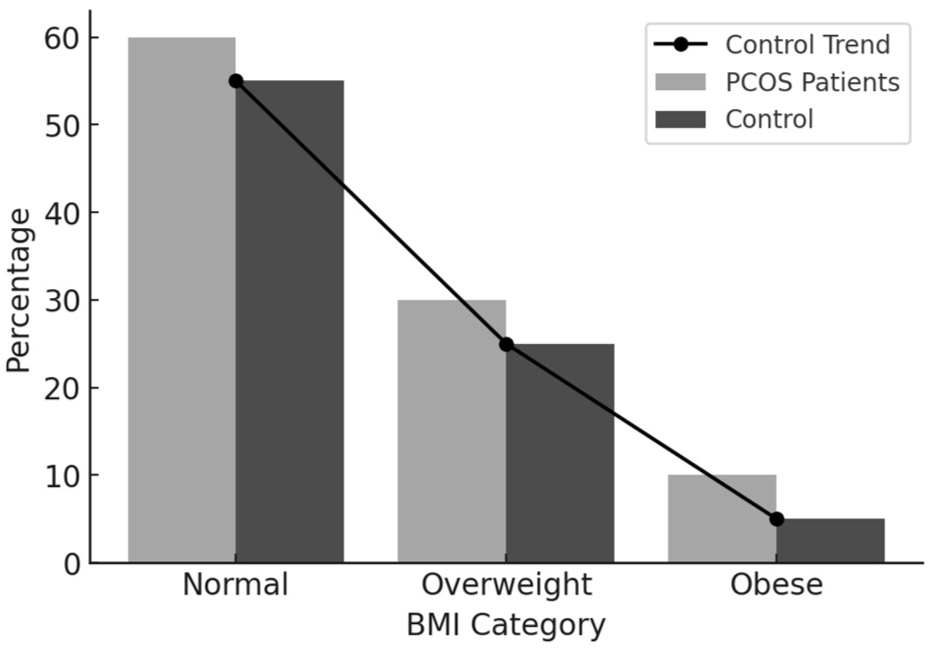
Demographic graph showing BMI distribution in PCOS patients for normal, overweight, and obese groups. BMI was calculated according to WHO guidelines based on the Quetelet formula (weight in kg divided by height in m2) classified as underweight (>18.05), normal weight (18.05–24.9), overweight (25.0–29.9), and obese (30.0–39.9).
Ultrasonographic analysis
The PCOS group exhibited higher rates of follicle count, cyst size, endometrial thickness, and ovarian volume (right and left), with prevalence rates of 75.47%, 67.92%, 20.75%, 22.64%, and 16.78% and the mean values for these parameters were 12.35, 12.11, 9.05, 8.22, and 7.08 in the PCOS group, compared to 7.33, 5.62, 6.77, 5.72, and 6.05 in the control group (Table 2). The prevalence of phenotypes determined based on ovarian morphology and associated symptoms was as follows: phenotype A (39.62%), phenotype B (20.75%), phenotype C (7.54%), and phenotype D (32.07%; Figure 1).
Factors influencing PCOS
In this study, only 20.75% of women with PCOS and 13.20% of women in the control group reported engaging in some form of physical exercise. Multivariate analysis determined BMI (p < 0.001), family history (p < 0.001), and anxiety (p < 0.001) as the strongest associated factors (Table 4). Physical activity, WHR, hypertension, diabetes, and diet also showed associations with PCOS. Correlations between free testosterone levels and various parameters were significant including hirsutism (p < 0.001), acne (p < 0.001), alopecia (p < 0.005), anxiety (p < 0.001), BMI (p < 0.001), total cholesterol (p < 0.001), HDL (p < 0.009), LDL (p < 0.002), triglycerides (p < 0.010), LH (p < 0.001), FSH (p < 0.009), AMH (p < 0.001), estradiol (p < 0.001), follicle count (p < 0.001), cyst size (p < 0.001), endometrial thickness (p < 0.001), oligomenorrhea (p < 0.001), amenorrhea (p < 0.001), primary infertility (p < 0.001), and secondary infertility (p < 0.001), respectively (Table 5).
Multivariate analysis of factors triggering PCOS.
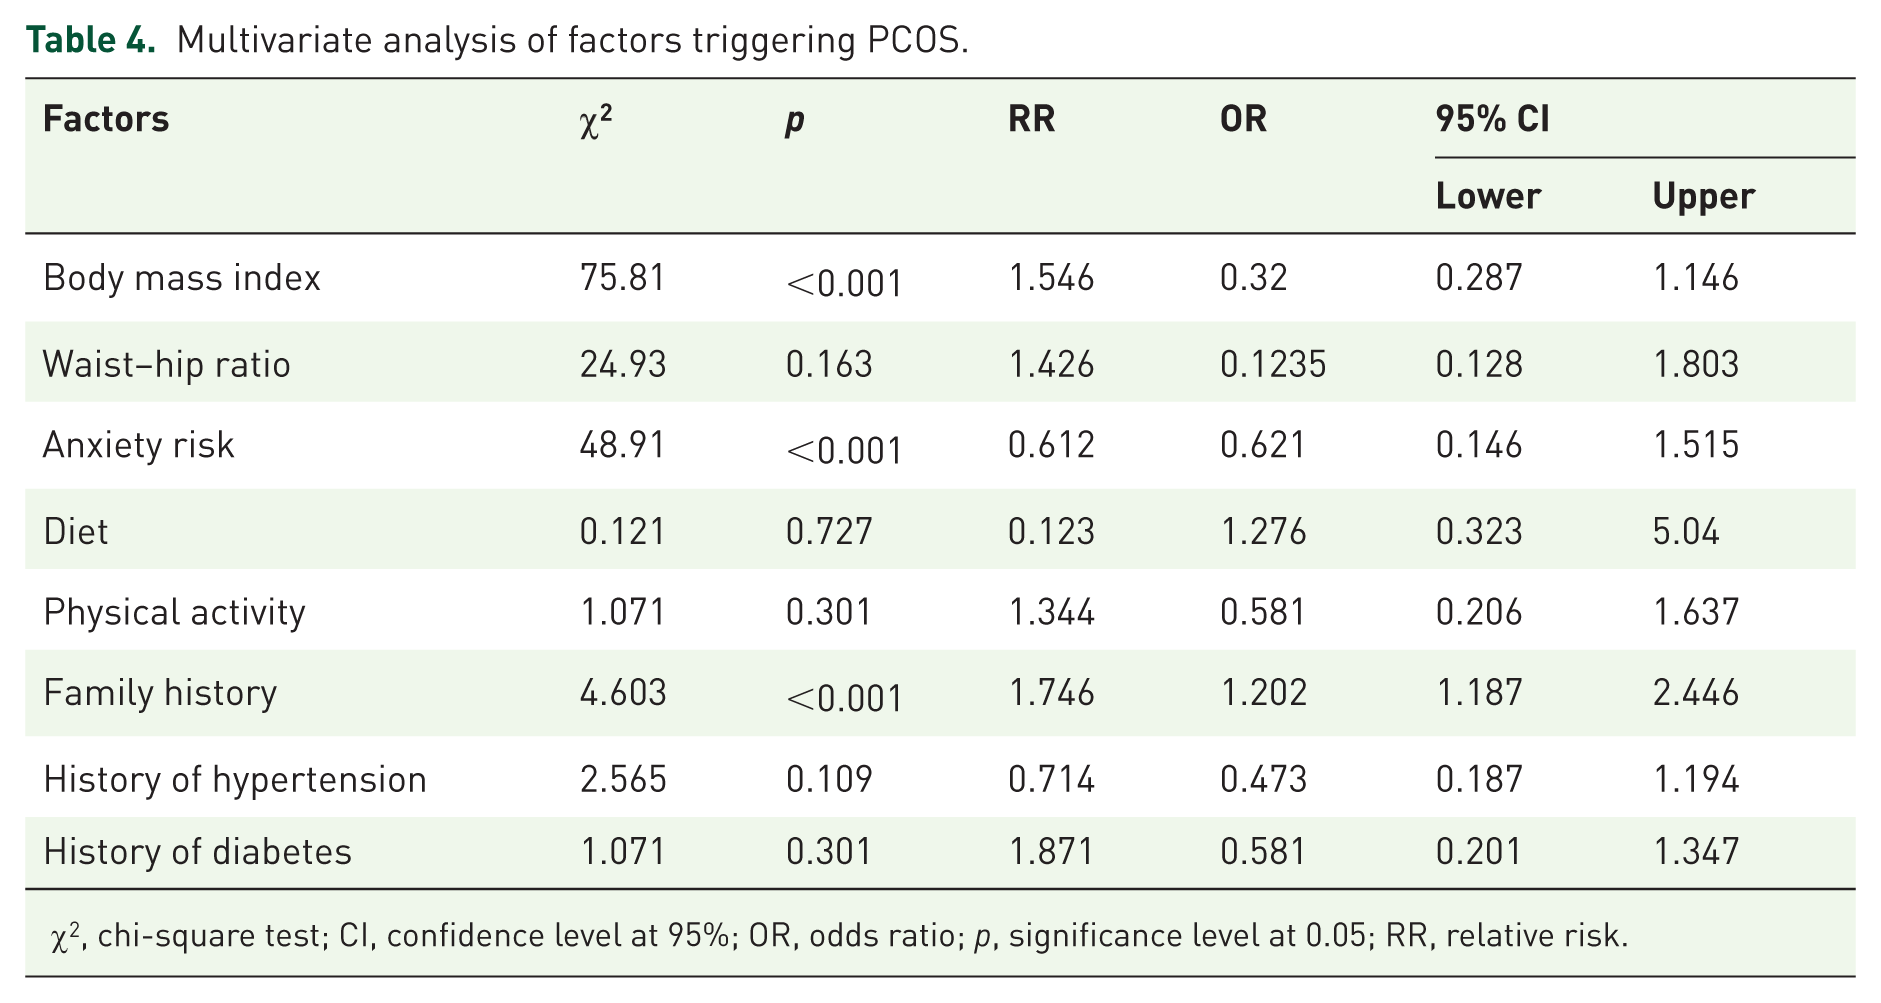
χ2, chi-square test; CI, confidence level at 95%; OR, odds ratio; p, significance level at 0.05; RR, relative risk.
Illustration of the Pearson correlation between testosterone and other baseline parameters.

AMH, anti-Müllerian hormone; FSH, follicle-stimulating hormone; LH, luteinizing hormone; p, significance level at 0.05; r, Pearson correlation coefficient; RBS, random blood sugar; T3/T4, thyroxine; TSH, thyroid-stimulating hormone.
Discussion
PCOS prevalence varies widely due to genetics, diagnostic criteria, environment, and lifestyle, 2 with underdiagnosis remaining a concern. 18 In the Barak Valley region, India, the present study estimated the PCOS prevalence rate of 9.18%, based on the Rotterdam and NHMRC guidelines.1,27 The highest prevalence was reported among native Bengali women (77.35%), while other ethnic groups/indigenous tribes, such as Manipuri, Bishnupriya-Manipuri, Khasi, Naga, and Bodo, accounted for 22.64%, often presenting with lower hirsutism cut-off scores. Globally, lower rates of PCOS are seen in East and Southeast Asians,49–51 while South Asians show higher prevalence linked to genetic and lifestyle factors. 52 Awareness in this region remains low, and many women endure the condition silently due to stigma. This regional prevalence aligns with global estimates of ~9%, reported by Salari et al. 53 at 9.2% (5.5% by NIH, 11.5% by Rotterdam), and by Neven et al. 54 at 9.8% by Rotterdam and 6.3% by NHMRC. Indian studies also show variability, with 4.2% in Haryana (Deswal et al. 55 ) and 6% in South India (Bharati et al. 56 ), with higher prevalence in urban women.
In line with these prevalence patterns, the present study further documented menstrual irregularities, with oligomenorrhea and amenorrhea observed in 75.47% of women with PCOS. The age-wise distribution of IMC in the case group reported the highest prevalence of oligomenorrhea (13.2%) among women aged 26–30, while the lowest prevalence of amenorrhea (1.88%) was observed in the 36–40 age group.
CHA, including hirsutism, acne, and alopecia, exhibited a significant difference between the case and control groups. Acne emerged as a prevalent form of HA in this region, observed in both groups, along with excess facial/body hair and scalp hair thinning. However, hirsutism and hair thinning were observed less in certain tribes, while acne was more frequent, possibly due to racial and ethnic factors specific to this geographical area. Northeast India, bordered by China, Bangladesh, and Myanmar, representing East Asian, South Asian, and Southeast Asian populations, demonstrates ethnic diversity that influences clinical presentations. Particularly, East Asian women generally tend to have lower hirsutism scores compared to Caucasians, 57 Hispanic, 58 Indigenous Australian,59,60 and South Asian women. 52
The study identifies a significant diversity in clinical manifestations of HA across ethnicities, emphasizing the need to account for these differences in diagnosing PCOS. Furthermore, BHA analysis revealed elevated free T levels in 92.45% of the case group (p < 0.001), compared to lower levels in the control group. Elevated free T levels may be a consequence of raised LH, as studies reported a direct correlation between serum LH and circulating testosterone levels 61 and the secretion of ovarian androgen is regulated by raised pituitary LH levels that stimulate the CYP17A gene crucial in the androgen synthesis pathway, contributing to PCOS etiology.62,63 Additionally, IR, in synergy with raised LH, further amplifies androgen production by stimulating ovarian androgen synthesis 64 and inhibiting the hepatic output of sex hormone-binding globulin (SHBG), leading to higher levels of free or bioavailable testosterone. The reduced SHBG levels allow more unbound androgens, particularly testosterone, to circulate, increasing clinical manifestations such as hirsutism, acne, and other signs of androgen excess.65,66
Furthermore, this study assessed the correlation of free T levels and various baseline PCOS features, finding moderate to strong positive associations with acne, hirsutism, alopecia, depression, total cholesterol, HDL, LDL, triglycerides, LH, FSH, AMH, estradiol, follicle count, cyst size, endometrial thickness, oligomenorrhea, amenorrhea, primary, and secondary infertility. The hormonal assay revealed a significant increase in LH (p < 0.001), AMH (p < 0.001), LH-to-FSH ratio (⩾1), and estradiol (p < 0.001) in the PCOS group compared to the control group, with their increased mean values observed. Contrarily, levels of free T3, free T4, TSH, and prolactin showed no specific variations between the groups and remained within normal to moderate ranges. In women with PCOS, increased levels of LH stimulate the ovaries to secrete excess androgens, while FSH can enhance the conversion of these androgens into estradiol. In certain women with PCOS, the surplus LH levels induce raised androgen production from theca cells of the ovary and increase estradiol synthesis from other ovarian cells. 63 Whereas, in other cases, additional androgens are peripherally converted to estradiol outside the ovaries. 66 This study observed that raised LH levels directly stimulated certain ovarian cells to produce additional estradiol. Additionally, amplified testosterone levels in many PCOS cases indicated peripheral conversion of androgens to estradiol. Furthermore, FSH (p < 0.001) values showed to be within a low to moderate range in the PCOS group compared to the control group. In some cases of PCOS, higher FSH levels were inversely proportional to AMH levels, while LH levels were consistently higher than FSH levels. Additionally, it was noted that increased LH levels were found to stimulate AMH ranges, which could provide valuable insights into the pathogenesis and phenotypes of PCOS. Studies reported that the elevated AMH levels in PCOS are the result of the increased number of small ovarian follicles 67 and that LH enhances AMH output by the granulosa cells in PCOS women. 68 Progesterone levels were significantly reduced in all PCOS cases, reflecting chronic oligo-ovulation or anovulation. Elevated LH further suppressed progesterone, while increased LH, testosterone, estradiol, and AMH, along with altered LH:FSH ratios, contributed to anovulation and may serve as useful diagnostic markers. Anthropometric differences between cases and controls showed noteworthy variations in BMI (p < 0.001) and WHR (p < 0.001). Overweight and obesity were reported in 39.96% of the case group and 35.84% of the control group. Obesity has an adverse impact on ovulation and reduces the success of ovulation induction in PCOS. 69 Remarkably, no underweight cases were reported. Obesity was frequently linked to irregular eating patterns, which may contribute to glucose fluctuations, hormonal imbalance, and increased PCOS risk.70,71 Among women with PCOS, 83.01% reported irregular meal timings, 16.98% maintained healthy diets, and 15.09% had eating disorders. Urban women (61.36%) showed poorer dietary practices compared to rural women (38.63%). Physical activity was low in both groups, with only 20.75% of PCOS cases and 13.20% of controls engaging in regular exercise. Lack of exercise was associated with difficulty maintaining a healthy BMI (relative risk [RR] = 1.344). 72 High BMI, family history of PCOS, and anxiety were significant risk factors (RR = 1.43, 0.41, and 1.22, respectively). A study by Boldis et al. 73 reported a threefold higher prevalence among daughters of women with PCOS. In our cohort, 56.60% of PCOS cases had a family history of reproductive or fertility issues. Anxiety was highly prevalent among women with PCOS (84.90% vs 24.52% in controls), highlighting the psychological burden of the condition.
Contributing factors may include HA-related appearance issues, infertility, and socio-economic pressures. OSA was also more frequent in women with PCOS, particularly those with obesity, and may be linked to HA and metabolic dysfunction. 74 Irregular sleep patterns were common in both groups, further suggesting the need for lifestyle-focused interventions. In the PCOS group, 3.77% reported occasional smoking or alcohol use, while none were observed in controls. Betel nut use (71.61%) and tobacco use (49.05%) were also higher than in controls (54.71% and 33.96%, respectively). Such habits are linked to adverse health outcomes and may aggravate PCOS-related problems and fertility issues. Although animal studies consistently show negative effects of smoking and alcohol on female reproduction, human data remain inconsistent, with smoking linked to reduced fertility and alcohol showing mixed associations.75,76 Caffeine consumption was reported in 79.24% of women with PCOS, compared to 73.58% in the control group. The connection between caffeine consumption and PCOS remains unclear, with studies potentially emphasizing both pros and cons. High caffeine intake may cause anxiety, palpitations, and insomnia, worsening PCOS symptoms. It can also surge cortisol levels, trigger sugar cravings, and temporarily elevate blood glucose levels. Furthermore, a history of anemia was reported in 7.54% of the case group, with no cases observed in the control group. A study reported a strong association between anemia and SHBG levels in individuals with PCOS. 71 Vitamin D deficiency was also determined separately, revealing a prevalence of 22.64% in the case population. The literature review highlighted limited evidence relating PCOS to vitamin D deficiency as a risk factor. However, some studies suggest a potential physiological link to reproduction, including its connection to luteinization and ovarian follicular development. This may be mediated by changes in FSH sensitivity, AMH signaling, and progesterone production in human granulosa cells.68,77 Significant differences in lipid profiles were also observed, including total cholesterol (p < 0.001), LDL (p < 0.001), and HDL (p = 0.001). In contrast, age, Hb, and PCV showed no significant differences between the case and control groups. Metabolic syndrome and CVD risk factors were particularly higher in women with PCOS, underlining the importance of prioritizing cardiovascular health in their management.1,16 Additionally, type II diabetes was prevalent in 52.83% of the case group, irrespective of obesity or lipid profiles, compared to 45.28% in the control group. Research studies highlight the role of PCOS as a substantial contributor to dysglycemia, with a higher rate of impaired glucose tolerance and type II diabetes mellitus. These findings emphasize the influence of ethnicity and obesity while emphasizing the importance of accurate diagnostic procedures for diabetes. 74 Ultrasonographic findings in women with PCOS typically revealed elevated ovarian volume (right: p < 0.001), increased follicle count (p < 0.001), larger cysts (p < 0.001), altered endometrial thickness (p < 0.001), and a PCOM pattern. Among the phenotypic subgroups, determined based on ovarian morphology, phenotype A was the most prevalent (39.62%), whereas phenotype C was the least common (7.54%). It is hypothesized that the in utero fetal pathway could play a significant role in the development of the PCOS phenotype in post-adolescent years. The characteristic metabolic and menstrual disturbances, along with the ultimate expression of the PCOS phenotype, are believed to stem from the interplay between genetic and environmental factors. 78 The Rotterdam criteria, presented in 2003, included PCOM as a key diagnostic measure of PCOS, relating it to the condition’s clinical and endocrine traits. 27 This revision expanded the recognition of milder PCOS phenotypes, though data on their natural progression remain limited, highlighting the need for further research. While PCOM is common in women with PCOS, it may also be present in healthy women, particularly younger women, demonstrating variability in its clinical significance. The association between PCOM and hormonal and metabolic markers like elevated AMH, IR, and dyslipidemia emphasizes its role in PCOS pathophysiology. 1 Advanced imaging methods, including 3D ultrasound and Doppler studies, enhance diagnostic accuracy and offer an understanding of ovarian vascularization and stromal volume. 79 Moreover, the raised occurrence of primary infertility indicates that PCOS significantly affects the chances of conceiving in women attempting to conceive for the first time. Conversely, the substantial rate of secondary infertility conveys that even women who formerly conceived may struggle with succeeding pregnancies, likely due to the advanced features of PCOS and its linked complications like deteriorating ovarian dysfunction. These facts highlight the need for targeted fertility interventions in women with PCOS, emphasizing prior diagnosis and tailored treatment approaches to enhance reproductive outcomes. Studies have suggested an association between PCOS and infertility, mainly due to anovulation. 27 The prevalence of polycystic ovaries (PCO) among ovulatory women with infertility was noted to be amplified than in the general female population, indicating that PCO might, possibly through the effects of hyperandrogenemia, contribute to subfertility even in women with regular menstrual cycles. 80 This study determined a significant correlation between testosterone levels and various baseline parameters in women with PCOS, counting BMI, hirsutism, acne, alopecia, depression, lipid profiles (total cholesterol, HDL, LDL), LH, FSH, AMH, estradiol, follicle count, cyst size, endometrial thickness, oligomenorrhea, amenorrhea, and infertility (primary and secondary). Azziz et al. 81 suggested a strong association between raised testosterone levels and increased IR and BMI in women with PCOS, emphasizing the connection between androgen excess and metabolic dysfunction. Testosterone has also been correlated with ovarian volume, follicle count, and PCOM, underlining its role in PCOS etiology. 81 However, the complex association between testosterone and these parameters requires further investigation. Although the sample size was calculated to detect overall differences between PCOS and control groups, the small number of patients in certain phenotypic subgroups, particularly Group C, limits definitive conclusions about these subgroups. Being a single-center study from the Barak Valley, findings may not be generalizable to wider populations. Limited representation of some ethnic subgroups, reliance on self-reported data, and lack of longitudinal follow-up are additional limitations. Future research should focus on larger, multi-center studies with diverse populations to validate these findings and address the heterogeneity observed among PCOS phenotypes, particularly those with low representation, such as Group C. Longitudinal studies are warranted to assess the long-term metabolic, reproductive, and psychological outcomes of PCOS across different ethnicities and lifestyles. Additionally, investigating the genetic and environmental factors underlying ethnic differences in clinical and biochemical presentations could provide deeper insights into personalized management strategies for PCOS. Furthermore, while this study applied internationally established and clinically accepted diagnostic cut-offs for all hormonal, biochemical, and ultrasonographic parameters based on the Rotterdam and NHMRC guidelines, it did not independently validate these thresholds for the Barak Valley population. Given the known ethnic and regional variations in these markers, future studies should aim to establish population-specific diagnostic cut-offs to improve the accuracy and relevance of PCOS diagnosis in this setting.
Conclusion
This study aimed to estimate the prevalence of PCOS and describe its clinical, biochemical, metabolic, and ultrasonographic features in women of the Barak Valley in Northeast India. It highlights the significant impact of ethnicity and regional diversity on the prevalence, clinical presentation, and risk factors of PCOS. In the Barak Valley, native Bengali women exhibited a notably higher prevalence compared to other ethnic groups, which may reflect underlying genetic predisposition, environmental exposures, and lifestyle habits, though these factors were not directly evaluated in this study. Central obesity, sedentary behavior, poor dietary patterns, and anxiety emerged as prominent associated factors, with observed links to metabolic syndrome, cardiovascular risk, and type II diabetes. Persistently low awareness levels continue to delay diagnosis, underscoring the urgent need for early detection strategies, public education, and comprehensive, multidisciplinary care. While the findings provide valuable insights into a geographically specific population, their generalizability remains limited, highlighting the need for broader studies across diverse settings. Future research should validate these findings in larger, multi-center cohorts and explore genetic and environmental factors influencing PCOS in this region. Addressing these knowledge gaps through future research will ultimately enhance early diagnosis, effective management, and quality of life for women living with this complex and multifaceted disorder.
Supplemental Material
sj-docx-1-reh-10.1177_26334941251384195 – Supplemental material for Prevalence of polycystic ovary syndrome (PCOS) and its associated hormonal and comorbid risk factors in Northeast India: a cross-sectional comparative study
Supplemental material, sj-docx-1-reh-10.1177_26334941251384195 for Prevalence of polycystic ovary syndrome (PCOS) and its associated hormonal and comorbid risk factors in Northeast India: a cross-sectional comparative study by Afrin Yasmin, Shubhadeep Roychoudhury, Pallav Sengupta, Abul Barkat Fuzayel Ahmed, Nithar Ranjan Madhu, Arun Paul Choudhury, Adriana Kolesarova, Sulagna Dutta and Israel Maldonado Rosas in Therapeutic Advances in Reproductive Health
Supplemental Material
sj-pdf-2-reh-10.1177_26334941251384195 – Supplemental material for Prevalence of polycystic ovary syndrome (PCOS) and its associated hormonal and comorbid risk factors in Northeast India: a cross-sectional comparative study
Supplemental material, sj-pdf-2-reh-10.1177_26334941251384195 for Prevalence of polycystic ovary syndrome (PCOS) and its associated hormonal and comorbid risk factors in Northeast India: a cross-sectional comparative study by Afrin Yasmin, Shubhadeep Roychoudhury, Pallav Sengupta, Abul Barkat Fuzayel Ahmed, Nithar Ranjan Madhu, Arun Paul Choudhury, Adriana Kolesarova, Sulagna Dutta and Israel Maldonado Rosas in Therapeutic Advances in Reproductive Health
Footnotes
Acknowledgements
The authors thank Prof. Anirudha Giri, Prof. Meenakshi Bawari, Pradip Chandra Paul, and Prof. Humadri Sekhar Das of Assam University, Silchar for reserach advice during the study. The authors acknowledge the support of Dr. Vivek Verma, Assistant Professor, Department of Statistics, Assam University, Silchar, too, for extending help in determining the sample size. We are also grateful to the volunteers and patients who participated in this research and made this work possible.
Declarations
Supplemental material
Supplemental material for this article is available online.
References
Supplementary Material
Please find the following supplemental material available below.
For Open Access articles published under a Creative Commons License, all supplemental material carries the same license as the article it is associated with.
For non-Open Access articles published, all supplemental material carries a non-exclusive license, and permission requests for re-use of supplemental material or any part of supplemental material shall be sent directly to the copyright owner as specified in the copyright notice associated with the article.