
Abstract
Methods:
This is a cohort study, conducted at a university-based reproductive medicine center and private reproductive medicine center that aimed to evaluate granulosa cumulus cell gene expression in the insulin signaling pathway in Polycystic Ovary Syndrome (PCOS) patients undergoing in vitro fertilization (IVF) treatment and to compare the cumulus gene expression between normal weight and obese women without clinical insulin resistance. Fifteen PCOS patients, nine normal weight patients and six obese patients presenting normal HOMA IR (Homeostasis Model Assessment–Insulin Resistance), participated. Patients underwent oocyte retrieval for IVF and after the procedure, granulosa cumulus cells were removed from the oocytes for RNA extraction. Quantitative polymerase chain reaction (PCR) array analysis of 84 genes from insulin signaling pathway was conducted. The results were expressed as fold up- or fold down-expression in obese patients compared with normal weight patients. Any fold change ⩾3 or ⩽3 and any p ⩽ 0.05 were considered statistically significant.
Results:
There were 10 genes that were overexpressed in obese compared with normal weight women, BCL2L1, BRAF, CBL, DOK1, FBP1, FRS2, MTOR, PCK2, RPS6KA1, and SORBS1, that had a fold change ⩾3 and p ⩽ 0.05.
Discussion:
In the obese group, the overexpressed genes are mainly responsible for the proliferation and differentiation of cumulus cells during oocyte maturation, insulin resistance, apoptosis regulation, and glucose metabolism during early embryogenesis, suggesting that in the follicular environment, insulin resistance is present even in the absence of clinical signs.
Conclusion:
Together, our findings and the related literature suggest that those alterations may be associated with the worse prognosis of follicular development and oocyte maturation observed in PCOS obese women.
Introduction
Polycystic Ovary Syndrome (PCOS) is the most common endocrine disorder during the reproductive age,1,2 affecting 5% to 10% of women, 3 and is one of the main causes of infertility.4,5 According to the Rotterdam criteria, PCOS is characterized by two of the following three features: (1) clinical and/or biochemical hyperandrogenism, (2) oligo- and/or anovulation, and (3) polycystic ovaries, excluding other endocrinopathies such as con-genital adrenal hyperplasia, androgen-secreting tumors, and Cushing’s syndrome. 6
Approximately 50% of women with PCOS are obese 7 and often present with severe metabolic disturbances, and the most severe phenotypes are linked to insulin resistance. 8 Those patients who undergo in vitro fertilization (IVF) show a large number of immature oocytes, poor embryo quality, miscarriages, and a higher inci-dence of Ovarian Hyperstimulation Syndrome (OHSS) when compared with non-PCOS patients of the same age.9,10 Adverse perinatal outcomes and lower pregnancy rates are observed in obese compared with non-obese PCOS patients.11,12
Although the etiology of PCOS remains unclear,13,14 the concept of a multifactorial disorder with candidate genes involved in steroidogenic and metabolic pathways has been explored to elucidate the genetic predisposition profile. 15 Multiple genes, environmental factor interactions, and most recently hormones, such as Anti-Müllerian Hormone, may contribute to the complexity of this syndrome.13,16 However, at present, there is no consensus on genetic susceptibility markers for PCOS. 17
Insulin is well known to play a central role in PCOS, mainly in obese women, and cross-reacts with the insulin-like growth factor 1 (IGF-1) receptor to enhance ovarian and adrenal steroidogenesis, activating tyrosine kinase phosphorylation and several intracellular signaling cascades. 18 The precise mechanism of insulin action on cumulus cells (CCs) and the consequences for oocyte maturation have not been completely elucidated in obese or non-obese PCOS patients.
Because the CCs, a subset of granulosa cells that maintain an intimate connection with the oocyte, are responsible for providing several trophic and metabolic factors to the pre-ovulatory oocyte, 19 we hypothesized that assessing insulin pathway gene expression in these cells could provide another perspective on the pathophysiology and possible treatment for infertile PCOS obese women submitted to IVF who did not exhibit clinical insulin resistance. The aim of this study was to investigate the insulin pathway gene expression profile of human CCs from obese versus normal weight women with PCOS without clinical insulin resistance undergoing IVF treatment.
Methods
This prospective cohort study was carried out at the Human Reproduction Section of Federal University of São Paulo and Huntington Reproductive Medicine from January 2013 to October 2014. This study was approved by the Institutional Review Board of the Federal University of São Paulo (protocol number 1420/09, São Paulo, Brazil), and written informed consent was obtained from all participants.
Study population and CC sample collection
The study population included 15 infertile PCOS women undergoing IVF treatment, including 9 women with normal body mass index (BMI; between 18.5 and 25.0 kg/m2) in the PCOS-Normal weight group (PCOS-NORM Group) and 6 obese women with BMI ⩾ 30.0 kg/m2 in the PCOS-Obese group (PCOS-OB Group). The sample size was based on a previous study. 20 PCOS was diagnosed according to the Rotterdam criteria. 6 We excluded PCOS women with Homeostasis Model Assessment–Insulin Resistance (HOMA IR) >3.6 for normal BMI women (BMI = 18.5–25 kg/m2) and >4.7 for obese women,20,21 as well as women who were underweight (BMI < 18.5 kg/m2), overweight (BMI = 25.1–29.9 kg/m2), had other endocrine diseases (such as diabetes or thyroid dysfunctions), received hormonal treatment before IVF, had repeated miscarriages, used insulin sensitizers, or were diagnosed with endometriosis. Both PCOS-NORM and PCOS-OB patients underwent controlled ovarian stimulation using a GnRH antagonist combined with recombinant follicle stimulating hormone (FSH) (r-FSH) and intracytoplasmic sperm injection (ICSI).
Briefly, women started ovarian stimulation with 225 IU of r-FSH (Gonal; Serono) beginning on day 3 of the menstrual cycle. The GnRH antagonist (Cetrorelix, 0.25 mg) was initiated when follicular size was 14 mm in diameter or on day 7 of ovarian stimulation. The final oocyte maturation trigger was 250 mcg human Chorionic Gonadotropin (hCG, Ovidrel; Serono. Darmstadt, Germany) once at least one follicle reached 20 mm. Estradiol levels were below 3500 pg/ml and there was no OHSS. Cumulus oocyte complexes were retrieved by vaginal puncture and guided by transvaginal ultrasound 35 h after hCG administration.
Pooled cumulus oocyte complexes from each patient were collected in G-MOPS medium (3-N-morpholino) propanesulfonic acid buffered medium, Vitrolife, Gothenburg, Sweden), and CCs, which also include corona radiata cells, were mechanically stripped from oocytes under magnifying glass using two disposable needles and two 1-ml plastic disposable syringes without hyaluronidase. The number of CCs collected was similar between groups. The mature oocytes were used for the ICSI procedure, and pooled CCs from each patient were immediately frozen at −80°C in RNA for later analysis.
RNA isolation and gene expression analysis
Total RNA was isolated from CCs using the Trizol method (Trizol™ reagent, Thermo Fisher Scientific, Grand Island, NY, USA) according to the manufacturer’s instructions. The RNA concentration and quality (260/280 ratio) were assessed using a spectrophotometer (NanoDrop 2000 instrument, Thermo Scientific, Whaltham, MA, USA). Then, 100 ng of total RNA was used for reverse transcription to generate double-stranded complementary DNA (cDNA) using an RT 2 First Strand Kit (Qiagen, Germantown, MD, USA) according to the manufacturer’s instructions.
Real-time quantitative polymerase chain reaction (RT-qPCR) assays were performed to evaluate 84 genes related to the insulin signaling pathway (RT 2 Profiler™ PCR Array Human Insulin Signaling Pathway—PAHS-030ZC, Qiagen), and pre-designed assays were used to carry out quantitative PCR (7500 Real-Time PCR System, Applied Biosystems, Foster City, CA, USA). The specific pathway function for each gene is described in Supplemental Data 1. The 96-well PCR array plates contain five housekeeping genes (actin beta—ACTB, beta-2-microglobulin—B2M, glyceraldehyde-3-phosphate dehydrogenase—GAPDH, hypoxanthine phosphoribosyltransferase-1—HPRT1, ribosomal protein large P0—RPLP0) and a panel of patented controls to monitor genomic DNA contamination, strand cDNA synthesis, and real-time PCR efficiency. The PCR array plates were assayed using a Step One Plus Real-Time PCR System (Applied Biosystems). We obtained cycle threshold (Ct) values for the genes under investigation, and the ΔΔCt method was used for gene expression analysis using the PCR Array Data Analysis Web Portal (https://dataanalysis.sabiosciences.com/pcr/arrayanalysis.php).
Statistical analysis
All statistical analyses were performed considering n = 6 for obese group and n = 9 for normal weight group. Differences in gene expression were calculated by the delta Ct method by using the RT2 Profiler PCR Data Analysis (https://www.qiagen.com/us/shop/genes-and-pathways/data-analysis-center-overview-page/). The significance of the expression differences in the two groups was calculated using Mann-Whitney U test. The results were expressed as fold up- or fold down-expression in PCOS-OB compared with that in PCOS-NORM. Genes that had expression levels with a fold change (FC) of at least ⩾3 or ⩽3 and p ⩽ 0.05 were considered differentially expressed (DE). The DE genes were analyzed using Advaita Bio’s iPathwayGuide (http://www.advaitabio.com/ipathwayguide), and the significantly impacted pathways, biological processes, and molecular functions were analyzed. To detect the Gene Ontology (GO) categories that were over- or under-represented in the condition under study, we used Advaita Bio’s iPathwayGuide, which uses an impact analysis method that relies on classical statistics and also considers other key factors such as the magnitude of the expression change for each gene, their type and position on the given pathways, and their interactions. The Elim pruning method, which iteratively removes the genes mapped to a significant GO term from more general (higher level) GO terms, was used to overcome the limitation of errors introduced by considering genes multiple times. The settings used were as follows: log-FC = 0.6 and adjusted p value = 0.05.
Results
Patient characteristics
The patients’ demographic and clinical profiles are described in Table 1. Except for BMI, the demographic and clinical characteristics of the groups were similar. Patients were young, had good ovarian reserve demonstrated by basal FSH levels, and, after ovarian stimulation, had a high number of oocytes collected, as expected for PCOS patients. In PCOS-NORM group, five patients presented two Rotterdam criteria and four patients presented all three criteria. In PCOS-OB group, four patients presented two Rotterdam criteria and two patients presented all three criteria (Supplemental Table 1). No OHSS occurred.
Demographic and clinical characteristics of patients in the control and obese groups.

BMI, body mass index; HOMA IR, Homeostasis Model Assessment–Insulin Resistance; FSH, follicle stimulating hormone; LH, luteinizing hormone; PCOS-NORM, Polycystic Ovary Syndrome–Normal weight group; PCOS-OB, Polycystic Ovary Syndrome–Obese group.
Mann-Whitney U test.
Gene expression profiles of CC samples isolated from PCOS-NORM and PCOS-OB patients
Three housekeeping genes—B2M, GAPDH, and HPRT1—were selected to normalize data based on transcription stability. All samples were tested for human genomic DNA contamination, reverse transcription control, and positive PCR control (data not shown). Three technical replicates were performed.
The general analysis of DE genes in PCOS-OB compared with those in PCOS-NORM women in the human insulin signaling pathway is presented in Figure 1. Interestingly, there were no genes downregulated in PCOS-OB patients compared with that in PCOS-NORM patients among the 11 significant DE genes. Table 2 shows the DE genes and respective log-FC and p values.

Volcano plot for human insulin signaling pathway DE gene expression distribution between the PCOS-OB and PCOS-NORM groups. The p value is plotted on the y-axis as the negative log of the p value. The x-axis shows the FC of each gene. The red circles represent the genes presenting log-FC ⩾ 0.6 and adjusted p value = 0.05. FC, fold change; PCOS-NORM, Polycystic Ovary Syndrome–Normal weight group; PCOS-OB, Polycystic Ovary Syndrome–Obese group.
Genes upregulated in the CC of the PCOS-OB group compared with those in the PCOS-NORM group.
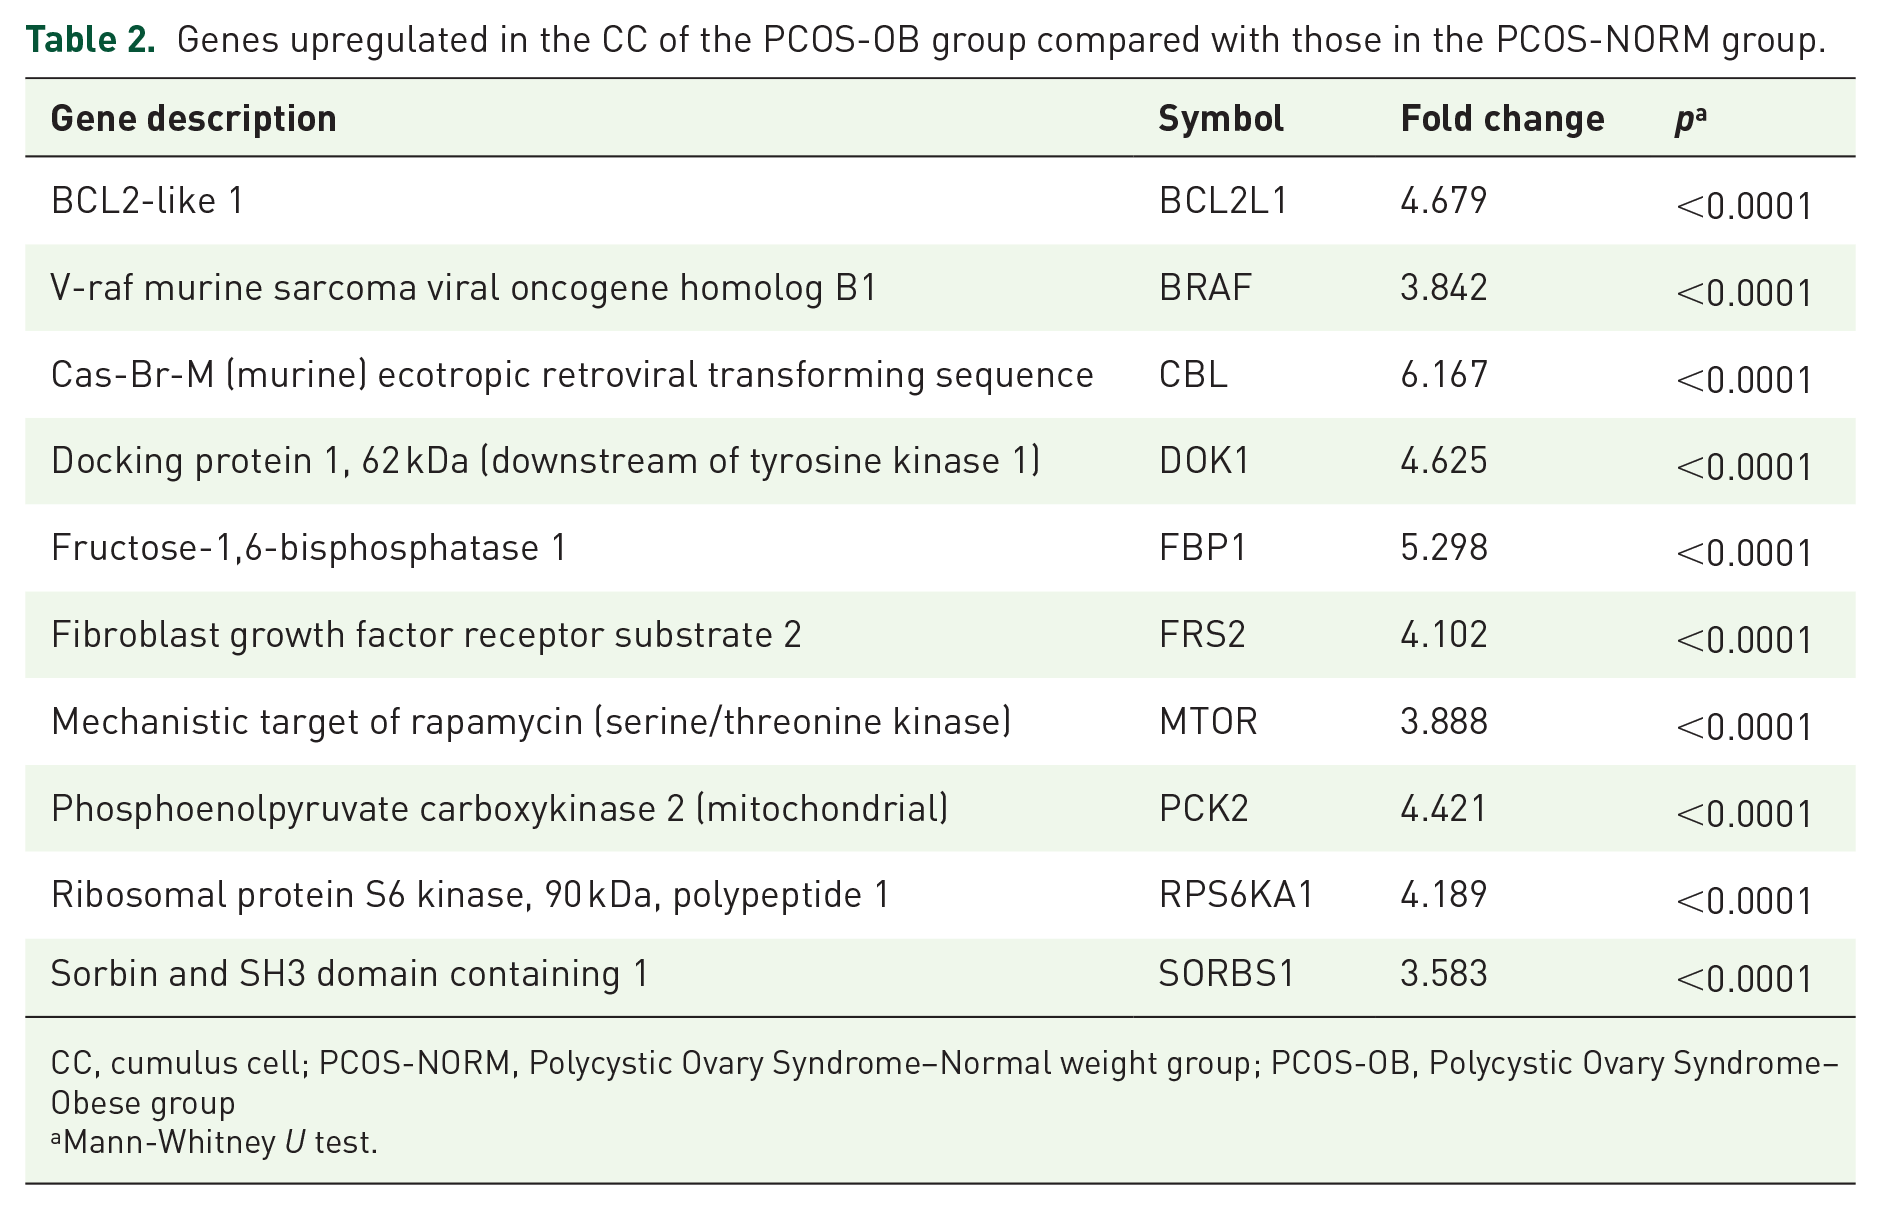
CC, cumulus cell; PCOS-NORM, Polycystic Ovary Syndrome–Normal weight group; PCOS-OB, Polycystic Ovary Syndrome–Obese group
Mann-Whitney U test.
The analysis using Advaita Bio’s iPathwayGuide combined enrichment (over-representation of DE genes) and pathway topology (structure and dynamics of the entire pathway) to calculate a perturbation value for each gene. In our study, six DE genes caused perturbation of the insulin signaling pathway (Table 2). The perturbation in the pathway is highlighted in Figure 2, where we note that enrichment of those genes is involved in glucose uptake, glycolysis, protein synthesis, and cell proliferation/differentiation. Moreover, after eliminating pruning, we evaluated the biological processes related to DE genes in the PCOS-OB over PCOS-NORM groups. The overexpression of CBL and BRAF genes was associated with the activation of calcium ion binding.

Insulin signaling pathway. The DE genes with FC higher than 3 are highlighted as perturbations in the pathway (FC is ⩾3 and p ⩽ 0.05). DE, differentially expressed; FC, fold change.
Discussion
The PCOS is a complex multifactorial disorder with heterogeneous clinical features.22,23 The characterization of molecular markers in past years has identified genes involved in insulin resistance, steroidogenesis, and follicle development as the primary dysfunctional factors in this syndrome. 24 Obesity is clearly a clinical condition associated with PCOS incidence, 7 usually related to hyperandrogenism.22,25 Here, we mapped the insulin signaling pathway in CCs from obese PCOS patients without clinical insulin resistance, as evaluated by HOMA IR, and non-obese PCOS patients. Our results suggest that in the follicular environment, insulin resistance is transcriptionally present even in the absence of clinical signs in obese PCOS patients.
In vivo and in vitro studies show that insulin enhances growth and differentiation of theca and granulosa cells in the ovary. 26 The CCs are a subtype of granulosa cells essential to oocyte maturation, which respond to the luteinizing hormone (LH) trigger prompting an increase in calcium, which diffuses through gap junctions in a few minutes and into the oocyte, where a local amplification system spreads the signal all over the cell. 27 In addition, CCs are essential to cytoplasm maturation by promoting energetic metabolism and converting glucose into pyruvate, which can be metabolized to allow the oocyte to be fertilized, as well as early embryonic development.28,29
The present study analyzed 84 pre-established genes related to the insulin signaling pathway in CCs of PCOS-OB and PCOS-NORM patients. Among these genes, 11 were significantly upregulated in the PCOS-OB patients in relation to the gene expression in the PCOS-NORM patients. The bioinformatics approach showed that six genes caused a perturbation in the insulin pathway (FBP1, SORBS1, CBL, BRAF, MTOR, and PCK2), and three of these genes that had higher log-FC (FBP1, CBL, and PCK2) are involved in glucose homeostasis. Calcium ion binding was the molecular function that was highlighted in the analysis. Calcium ion binding is also influenced by BRAF and CBL genes and presented higher FC in PCOS-OB patients over PCOS-NORM patients.
Our findings highlighted the perturbation of glucose homeostasis in CCs in obese PCOS patients compared with that in normal weight PCOS patients. The main gene associated with this function that was DE across groups was CBL. The function of CBL is related to insulin resistance induced by adipocytes in obese patients through inflammatory mechanisms.30,31 In a study evaluating the protein profile of visceral adipose tissue, CBL was shown to be responsible for signaling and regulation of insulin secretion, which was associated with the pathogenesis of diabetes mellitus type II. 32 Considering the increased visceral adiposity in obese PCOS women and the relationship with the pathogenesis and phenotype of PCOS, 33 overexpression of the CBL gene in CCs observed in obese women in our study suggests that obesity can also affect the follicular environment and more specifically the insulin pathway. We suggest that insulin resistance can be present in the follicular environment, even in patients who do not have clinical insulin resistance indicated by HOMA IR.
The BRAF gene is an oncogene responsible for the protein kinase serine-threonine, which is involved in the delivery of intracellular signals directly related to cell proliferation in the MAPK (mitogen-activated protein kinase) pathway. 34 The CBL and BRAF genes were upregulated and associated with calcium ion binding in obese PCOS patients. Calcium oscillations are known to mediate a large number of physiological cell functions, including oocyte activation35–37 and mitotic cleavage.38,39
The association of obesity and IVF outcomes is still controversial in the literature. Some authors believe that obesity is related to a worse prognosis, 40 and others have not shown clinical differences despite less favorable cycle characteristics. 41 Obese patients may have a more activated calcium ion binding process to compensate for impairments in the micro-environment.
The oocyte uses pyruvate for cytoplasmic maturation,29,42 which is also the substrate for embryo metabolism during the initial development after fertilization.43,44 The gene PCK2 codes for a mitochondrial enzyme that catalyzes oxalacetate in phosphoenolpyruvate in the metabolic pathway of gluconeogenesis, exacerbating the production of glucose through pyruvate. Animal studies have shown that PCK2 overexpression predisposes the animal to obesity, and its knockout leads to hypoglycemia through Krebs cycle dysfunction. 45 Those data are in agreement with our findings as obese PCOS women have upregulated PCK2 such as FBP1, which codes for the fructose 1,6 diphosphatase enzyme and is responsible for gluconeogenesis. 46 Both genes are involved in glucose homeostasis perturbation.
Polymorphisms in SORBS1 (CBL associated protein – CAP) gene have been associated with obesity and insulin resistance.47,48 In a study with the Korean population, SORBS1 polymorphism was also related with PCOS. 49 Moreover, in a comprehensive proteomic analysis, SORBS1 is upregulated in visceral adipose tissue from type 2 diabetes patients. 32 In the insulin signaling pathway, SORBS1 acts as CBL-adaptor protein. When insulin binds to its receptor (IR), CBL is recruited by interaction with SORBS1 and, upon phosphorylation, dissociates from IR and migrates to plasma membrane. This complex is involved in GLUT4 translocation to cell membrane, which may interfere on glucose uptake. 32 The interaction of CBL and SORBS1 (CAP) with GLUT4 is illustrated in Figure 2. In our study, CBL and SORBS1 are increased in obese patients, which may reflect in glucose uptake in granulosa cells, leading to important cellular metabolism dysfunction.
It could be speculated whether these deregulated genes and the consequent perturbation of glucose homeostasis in the CCs may be associated with the oocyte maturation deficiency observed in obese PCOS patients, 50 because the biochemical characteristics of the micro-environment of oocyte development (follicular fluid, CCs, and oocytes) play a critical role in determining oocyte quality and the subsequent potential to achieve fertilization and embryo development. 51 Thus, the alterations observed in our study may not only reflect the metabolism status of CCs but are supposedly associated with the damage to oocyte development observed in PCOS obese patients.
The mammalian target of rapamycin (mTOR), a conserved serine/threonine protein kinase, promotes cell proliferation and inhibits apoptosis by the phosphatidylinositol 3-kinase (PI3K)/AKT/mTOR signaling pathway. 52 The insulin-mediated activation of PI3K/AKT/mTOR signaling induces p70S6K expression and increases S6BP and 4EBP1 phosphorylation, which promotes protein synthesis (Figure 2). The unbalance of this pathway is associated with impairment of follicular development and ovulation abnormalities, such as reduction of follicular growth and granulosa cell proliferation. 52 Furthermore, the overexpression of the mTOR pathway can lead to insulin resistance, which is an important pathophysiological basis of PCOS.
The limitations of the study include low number of patients and the absence of follow-up, which could be helpful to understand whether the follicular state modification is a prodrome to clinical manifestation of insulin resistance. The characteristic of this study limits the translation of our results to change the current medical practice, but highlights the need of attention on obese PCOS patients without clinical insulin resistance on how possible changes in follicular environment could affect clinical outcomes. Another point to be emphasized is that our study does not exclude the possibility that the same insulin signaling pathway alterations could not affect obese women without PCOS, due to the lack of an obese-control group without PCOS in our study. The aim of this study was not to compare the reproductive outcomes between the groups, because there is no statistical power for such analysis with our sample size, neither an adequate inclusion nor exclusion criterion to suggest that only the obesity factor, in association or not with PCOS, could be a determining factor.
In conclusion, a number of genes in the insulin signaling pathway that are involved in glucose homeostasis and calcium binding processes in the follicular environment are upregulated in PCOS obese women who do not have clinical insulin resistance. Together, our findings and the related literature suggest that those alterations may be associated with the worse prognosis of follicular development and oocyte maturation observed in PCOS obese women.
Supplemental Material
Supplemental_data_Chehin_et_al_xyz25601c3001872 – Supplemental material for The insulin signaling pathway is dysregulated in cumulus cells from obese, infertile women with polycystic ovarian syndrome with an absence of clinical insulin resistance
Supplemental material, Supplemental_data_Chehin_et_al_xyz25601c3001872 for The insulin signaling pathway is dysregulated in cumulus cells from obese, infertile women with polycystic ovarian syndrome with an absence of clinical insulin resistance by Mauricio B. Chehin, Renato Fraietta, Aline R. Lorenzon, Tatiana C.S. Bonetti and Eduardo L.A. Motta in Therapeutic Advances in Reproductive Health
Supplemental Material
Supplemental_Table_1_xyz300951e870644 – Supplemental material for The insulin signaling pathway is dysregulated in cumulus cells from obese, infertile women with polycystic ovarian syndrome with an absence of clinical insulin resistance
Supplemental material, Supplemental_Table_1_xyz300951e870644 for The insulin signaling pathway is dysregulated in cumulus cells from obese, infertile women with polycystic ovarian syndrome with an absence of clinical insulin resistance by Mauricio B. Chehin, Renato Fraietta, Aline R. Lorenzon, Tatiana C.S. Bonetti and Eduardo L.A. Motta in Therapeutic Advances in Reproductive Health
Footnotes
Acknowledgements
The authors would like to thank all collaborators from Setor Integrado de Reprodução Humana—Universidade Federal de São Paulo (UNIFESP).
Author contributions
M.B.C. contributed to the study conception and design, acquisition, analysis and interpretation of data, and manuscript drafting; R.F. and T.C.S.B. contributed to study design, acquisition, and analysis of data; A.R.L. contributed to manuscript drafting and revision; and E.L.A.M. contributed to study conception and design, manuscript drafting, and revision.
Funding
The authors disclosed receipt of the following financial support for the research, authorship, and/or publication of this article: This research was funded by Huntington Medicina Reprodutiva.
Conflict of interest statement
The authors declared no potential conflicts of interest with respect to the research, authorship, and/or publication of this article.
Supplemental material
Supplemental material for this article is available online.
References
Supplementary Material
Please find the following supplemental material available below.
For Open Access articles published under a Creative Commons License, all supplemental material carries the same license as the article it is associated with.
For non-Open Access articles published, all supplemental material carries a non-exclusive license, and permission requests for re-use of supplemental material or any part of supplemental material shall be sent directly to the copyright owner as specified in the copyright notice associated with the article.