
Abstract
Background
The best approach to provide comprehensive care for individuals with co-occurring disorders (CODs) related to substance use and mental health is to address both disorders through an integrated treatment approach. However, only 25% of behavioral health agencies offer integrated care and <7% of individuals who need integrated treatment receive it. A project used a cluster-randomized waitlist control group design to evaluate the effectiveness of network for the improvement of addiction treatment (NIATx) implementation strategies to improve access to addiction and psychotropic medications.
Methods
This study represents a secondary analysis of data from the NIATx project. Forty-nine agencies were randomized to Cohort1 (active implementation group, receiving the NIATx strategy [n = 25]) or Cohort2 (waitlist control group [n = 24]). Data were collected at three time points (Baseline, Year1, and Year2). A two-level (patient within an agency) multinomial logistic regression model investigated the effects of implementation strategy condition on one of four medication outcomes: both medication types, only psychotropic medication, only addiction medication, or neither medication type. A per-protocol analysis included time, NIATx fidelity, and agency focus as predictors.
Results
The intent-to-treat analysis found a statistically significant change in access to addiction versus neither medication, but Cohort1 compared to Cohort2 at Year 1 showed no differences. Changes were associated with the experimental intervention and occurred in the transition from Year1 to Year2, where greater increases were seen for agencies in Cohort2 versus Cohort1. The per-protocol analysis showed increased access to both medications and addiction medications from pre- to post-intervention for agencies in both cohorts; however, differences in change between high- and low-implementation agencies were not significant.
Conclusions
Access to integrated services for people with CODs is a long-standing problem. NIATx implementation strategies had limited effectiveness in improving medication access for individuals with CODs. Implementation strategy adherence is associated with increased medication access.
Plain language summary
Individuals with co-occurring substance use and psychiatric disorders face significant challenges in receiving care. With only 25% of behavioral health organizations offering integrated substance use and mental health services, it is not surprising that only 7% of individuals with a co-occurring disorder (COD) receive integrated care. The use of implementation strategies including feedback reports, external coaching, and in-person learning can provide staff with the necessary skills to implement changes in their organization. In this study, staff in addiction treatment agencies provided comprehensive assessments and treatment plans that targeted patients’ CODs, using proven implementation strategies. Results found that the application of these strategies increased patient access to addiction medications and their access to both addiction and psychotropic medications for their CODs. Higher implementation strategy adherence appears to be associated with improved access to addiction medications or both addiction and psychotropic medications but not psychotropic medications exclusively. Implementation researchers and addiction treatment agencies have evidence that implementation strategies can be utilized to improve access to medications as part of integrated treatment for individuals with CODs. However, additional research is needed to understand how adherence and fidelity to the implementation strategies are associated with more significant improvements. In addition, the results from this study raise questions as to whether efforts to improve access to psychotropic medications or addiction and psychotropic medications take longer to implement in addiction treatment agencies that do not typically provide integrated treatment for individuals with CODs.
Keywords
Individuals with co-occurring disorders (CODs) face unique challenges when seeking evidence-based treatment compared with individuals with a mental illness or a substance use disorder (SUD). Typically, individuals with CODs receive separate and independent treatment services (medications and clinician encounters) for their SUD and mental illnesses (Substance Abuse and Mental Health Services, 2020). The result is a fragmented and siloed system of care that does not provide evidence-based integrated treatment that is optimal for individuals with CODs (Kampman & Jarvis, 2015). For the estimated 9.2 million adults in the United States with CODs (Substance Abuse & Mental Health Services Administration, 2019), the failure to identify and evaluate each disorder concurrently poses a major public health concern (Schulte & Hser, 2013). Treatment for co-occurring psychiatric and a comorbid SUD is complex, as it is often difficult to disentangle overlapping symptoms when developing an integrated treatment plan (Ponce Martinez, 2020).
The evidence clearly indicates that an integrated treatment is the best approach to providing comprehensive care for individuals with CODs (Baigent, 2012; Baker et al., 2010; Karapareddy, 2019; Kelly & Daley, 2013; Ponce Martinez, 2020; Volkow et al., 2019). Developing an integrated care delivery system often requires organizational-level change. In this context, integrated treatment refers to providing access to treatment, including substance abuse and mental health services, based on a comprehensive assessment for individuals with CODs (Kelly & Daley, 2013). Evidence suggests that patient-level clinical interventions (e.g., a cognitive behavioral therapy program, modified therapeutic community, or an integrated dual diagnosis treatment model) are associated with improving care for individuals with CODs (McGovern et al., 2011; McGovern et al., 2015; Meier et al., 2015).
Despite the importance of integrated treatment approaches for individuals with CODs, significant gaps exist including access to medications as part of integrated treatment for individuals with CODs (Substance Abuse and Mental Health Services, 2020). It is estimated that only 25% of behavioral health programs offer integrated care (Lambert-Harris et al., 2013; Mauro et al., 2016; McGovern et al., 2014). Access to integrated care was cited by 24% to 32% of individuals with a CODs as a barrier to care (Novak et al., 2019). As a result, only 7% of individuals with CODs report receiving integrated services (Substance Abuse & Mental Health Services, 2019). Access to medications for individuals with CODs is also highly variable. In private section addiction treatment agencies, 70% of individuals with CODs received a psychotropic medication; however, access to medications for individuals with an alcohol use disorder or SUD was 24% and 34%, respectively (Knudsen et al., 2011). Similarly, only 40% of medical health (MH) organizations could provide patients with CODs access to addiction medications upon discharge (McGovern et al., 2010; Sacks et al., 2013). While Medicaid expansion increased access to psychotropic medications (Shover et al., 2019), data suggest that only a fraction of individuals with CODs receive both an addiction and psychotropic medication.
Treatment barriers among individuals with COD have been classified as personal (e.g., personal beliefs) and structural (e.g., gaps in staff training) characteristics (Novak et al., 2019; Priester et al., 2016; Sterling et al., 2011; Watkins et al., 2021). While it is reasonable to assume that these barriers may also relate to medication access, studies of medication barriers are lacking. The lack of medication access in integrated care suggests the opportunity for a new approach grounded in implementation science to improve the co-occurring capacity of substance use agencies.
Role of implementation science to improve integrated treatment capacity
Implementation science offers systematic approaches to addressing barriers that occur at multiple levels of care (system, organizational, and individual) within a behavioral health agency that obstructs the delivery of integrated care (Damschroder et al., 2009; Lewis et al., 2018; Powell et al., 2017). For example, barriers might include access to a behavioral health provider, the ability to bill for COD services, or staff ability to conduct a comprehensive co-occurring clinical assessment or develop an integrated treatment plan that includes access to clinical counseling services and medications, as appropriate. A recent implementation study utilized a cluster-randomized waitlist control group design to evaluate the effectiveness of network for the improvement of addiction treatment (NIATx) strategies to implement integrated services for persons with CODs (Ford et al., 2018).
NIATx model
The NIATx model is a multi-component implementation strategy that consists of in-person learning sessions, group coaching or “interest circle” calls, and external coaching. The NIATx model was developed to teach staff in substance abuse agencies how to use process improvement techniques (e.g., consumer-centered walk-through and Plan-Do-Study-Act rapid change cycles) to build the necessary skills to improve organizational processes of care (Capoccia et al., 2007; Hoffman et al., 2012). Five key principles associated with successful organizational change form the basis of the NIATx approach: (1) understand and involve the customer/user of the process an organization is trying to improve; (2) choose improvement processes that meet an organization's overarching goal(s); (3) engage powerful and respected change agents in the change process; (4) seek ideas and encouragement from outside the field; and (5) quickly but thoroughly test solutions before full-scale implementation (Gustafson & Hundt, 1995). The first principle, identified as the most important in organizations that successfully implement change, encourages staff to conduct a walk-through of administrative processes (e.g., paperwork, calling to schedule an appointment) or utilize tools such as the Nominal Group Process to identify why patients are leaving treatment early (Ford et al., 2007; Van de Ven and Delbecq, 1974). The NIATx model shares attributes found in Six Sigma or continuous quality improvement utilized primarily in acute care settings (Hill et al., 2020; Niñerola et al., 2020) and recently in behavioral health (Dzidowska et al., 2020; Lucas et al., 2015; Moran et al., 2020).
The NIATx model has been successfully utilized to improve and sustain access to care across multiple healthcare settings (Belenko et al., 2017; Gustafson et al., 2013; Hoffman et al., 2008; Hoffman et al., 2011; McCarty et al., 2007; Pankow et al., 2018; Quanbeck et al., 2011). However, little is known about the effectiveness of NIATx implementation strategies to drive organizational change efforts to improve access to addiction medications, psychotropic medications, or both medications for individuals with CODs.
The findings from a randomized control trial (RCT), using the multi-component implementation strategies of NIATx to incorporate integrated services into routine care in addiction treatment agencies, showed significant and sustained improvements in agency level provision of integrated addiction and psychiatric services for individuals with CODs (Assefa et al., 2019). Aim 2 of the RCT sought to evaluate the effectiveness of the NIATx strategies to improve implementation outcomes. The hypothesized effects were that, relative to the waitlist, exposure to NIATx implementation strategies would result in improved access to addiction, psychotropic, or both medications (Hypothesis 1). In addition, agencies with higher fidelity to the NIATx implementation strategies were expected to see greater improvements in access to medication (Hypothesis 2). The current manuscript presents the results of our analysis on medication access outcomes for patients who received care in these agencies.
Methods
Design and setting
The study is a secondary analysis of de-identified data collected through a cluster-randomized waitlist control group design to evaluate the effectiveness of the multi-component implementation strategies of NIATx to improve access to integrated services including medications for individuals with co-occurring substance use and MH disorders.
Participants
Study participants were programs within community addiction treatment agencies across the state of Washington. Eligibility criteria included: outpatient and/or intensive outpatient services; tax-exempt status; government status or at least 50% publicly funded (e.g., block grants, Medicare, Medicaid); and no prior enrollment in NIATx research studies. Recruitment letters were sent to all eligible addiction treatment agencies (n = 468). Fifty (10.7%) agencies agreed to participate in the study. The agencies were randomized to Cohort1 (active implementation group: receive the NIATx strategy [n = 25]) or Cohort2 (waitlist control [n = 25]) study arm. After randomization, four agencies (1 in Cohort1 and 3 in Cohort2) declined to participate, citing lack of time and dropped out before (n = 1) or after (n = 3) the dual diagnosis capability in addiction treatment (DDCAT) assessment was scheduled. Our team recruited and randomized three additional agencies to the study (one to Cohort1 and two agencies to Cohort2) replacing the dropped-out agencies. The final sample included 49 agencies: Cohort1 (n = 25) and Cohort2 (n = 24). At the end of Year 1, agencies in Cohort2 began using NIATx strategies while Cohort1 agencies transitioned to a sustainment period. Additional details on the study are published elsewhere (Ford et al., 2018).
Intervention
DDCAT index and feedback reports
In addition to the intervention assignment (Cohort1, Cohort2), each agency was assessed using the DDCAT Index version 4.0 (Substance Abuse & Mental Health Services Administration, 2011) to quantitatively determine an addiction treatment program's capacity for integrated services for people with CODs (Gotham et al., 2010; Lambert-Harris et al., 2013; McGovern et al., 2007, 2010; Sacks et al., 2013). The DDCAT index is comprised of 35 items across seven domains. Four domains focus on the administrative infrastructure to support integrated treatment, and three domains address the clinical aspects of integrated treatment. Appendix 1 provides a more comprehensive overview including example items.
The approach utilized to train DDCAT evaluators (Washington State employees) and the DDCAT index data collection methods are described elsewhere (Assefa et al, 2019). After completing each DDCAT assessment, a brief two-page summary report, including a written synopsis from the assessor evaluation and a graph of DDCAT domain scores, was provided as feedback to the participating programs. The purpose of this report was to encourage an agency's independent interest in identifying opportunities for change and to help guide change efforts to improve their co-occurring capacity.
Multi-component implementation strategies of NIATx
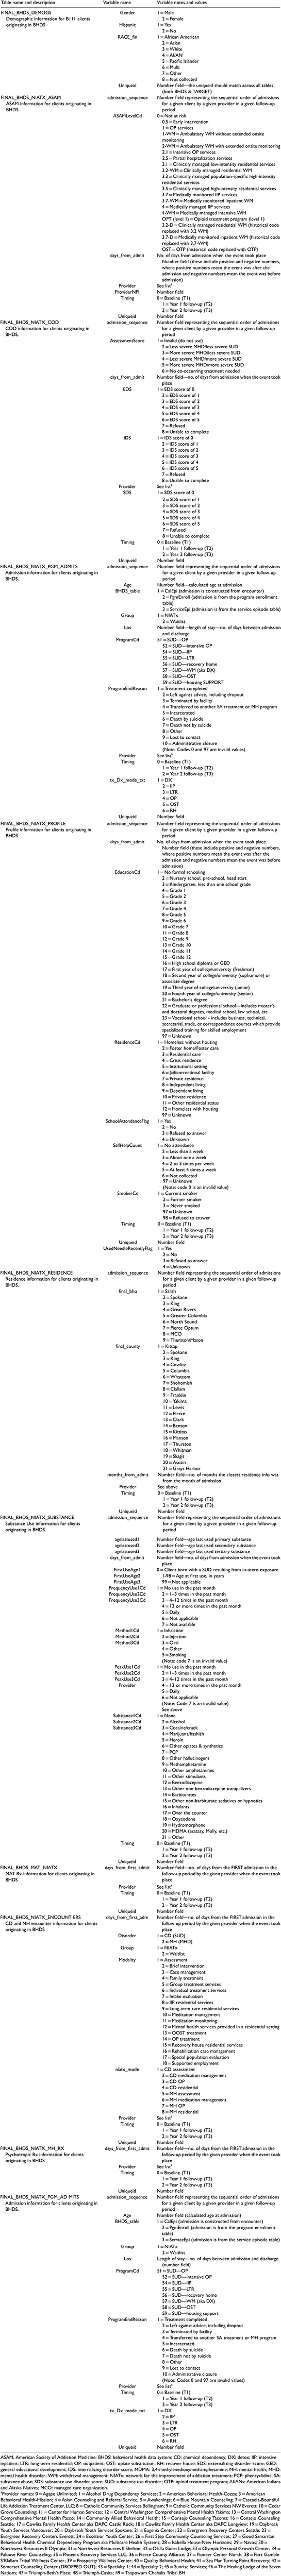
Over a 12-month period, agencies assigned to the intervention group utilized NIATx strategies to implement changes to improve the capacity of the agency to address co-occurring SUD and MH needs, such as access to addiction and psychotropic medications for their patients. NIATx multi-component implementation strategies included a one-day coach-led site visit, individual monthly phone conferences (10 h total), two cohort-wide group coaching calls, and two one-day cohort-wide coach-led learning sessions. In addition, the coach supports such as one-day training, standardized materials, and monthly calls were provided to ensure implementation fidelity. Table 1 provides a detailed description of NIATx multi-component implementation strategies (referred to as NIATx going forward), categorized using the Expert Recommendations for Implementing Change implementation strategies (Powell et al., 2015; Waltz et al., 2015).
Description of the NIATx implementation strategies included within the NIATx strategy.
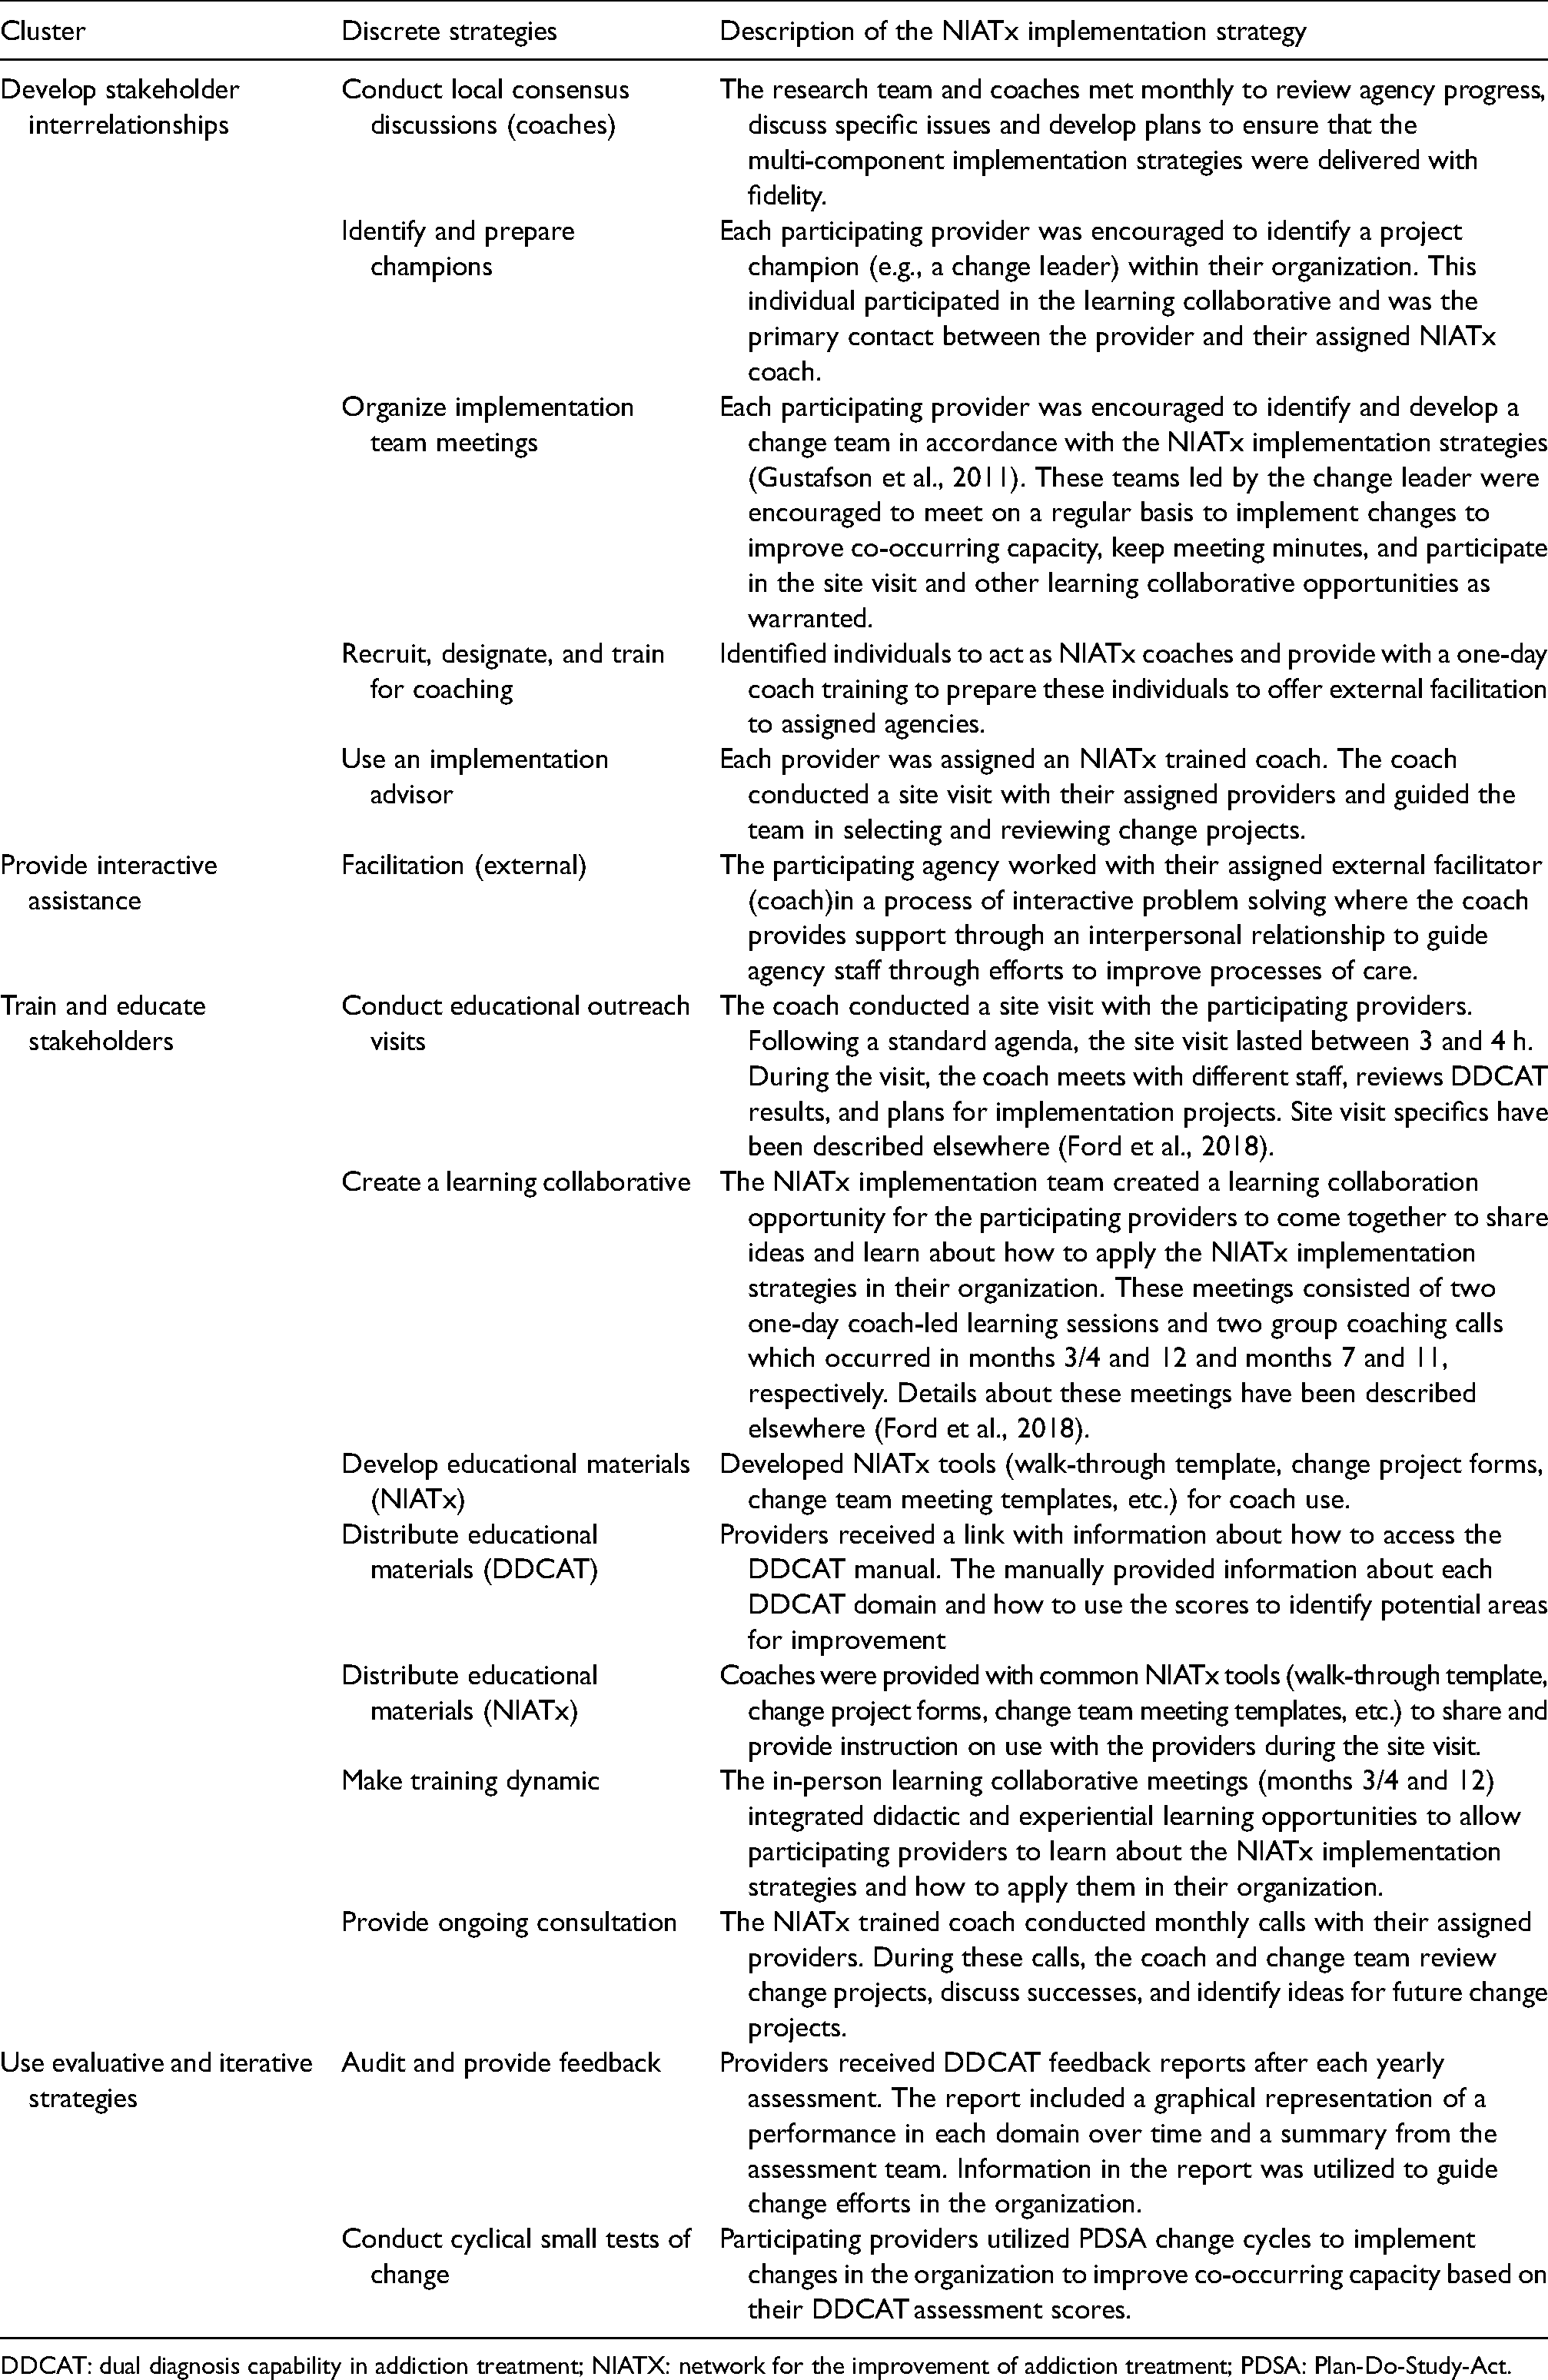
DDCAT: dual diagnosis capability in addiction treatment; NIATX: network for the improvement of addiction treatment; PDSA: Plan-Do-Study-Act.
Data collection
State agencies utilized the behavioral health data system (BHDS) and the Washington State Health Care Authority Provider One (P1) systems, designed to ensure standardized data collection, to report information about patient services received. The Gain Short Screen (Appendix 2) determined co-occurring capacity (Dennis et al., 2006). BHDS and P1 data were extracted using the national provider identifier (NPI) to designate the specific agency. All patient admissions 45 days prior to and after the DDCAT assessment date were pulled from BHDS and P1. For each admission, all addiction or psychotropic medication encounters 90-days post-admission were extracted from the pharmacy claims in P1 using the assigned patient unique identifier (Appendix 2). A medication encounter comprised any treatment event associated with the prescribing, dispensing, or administering of an addiction or psychotropic medication or an encounter where the patient received both medications. Associated patient-level characteristics (e.g., gender and race) were extracted from BHDS and P1. Medication encounter data and patient-level data were matched across datasets—using NPI, patient unique identifier, and timing—to create the medication encounter and patient master datasets for analysis (Appendix 3), resulting in a 100% match across the datasets.
Two independent variables were included in the initial per-protocol analysis: time and adherence, as measured by the NIATx stages of implementation completion (NIATx-SIC). An exploratory per-protocol analysis included agency specialty and patient gender, race, and ethnicity as additional variables (see Appendix 4). A description of each independent variable follows.
Figure 1 shows the study's three data extraction points (Baseline, Year1, and Year2). Since the NIATx intervention was introduced at Baseline for Cohort1 and at Year1 for Cohort2, it was necessary to accommodate for this time differential in the analysis. The Time variable corresponds to when agencies in each cohort were exposed to the NIATx implementation strategy. The pre-intervention start time was represented by Baseline for Cohort1 and Year1 for Cohort2, while the Intervention End Time was represented by Year1 for Cohort1 and Year2 for Cohort2.
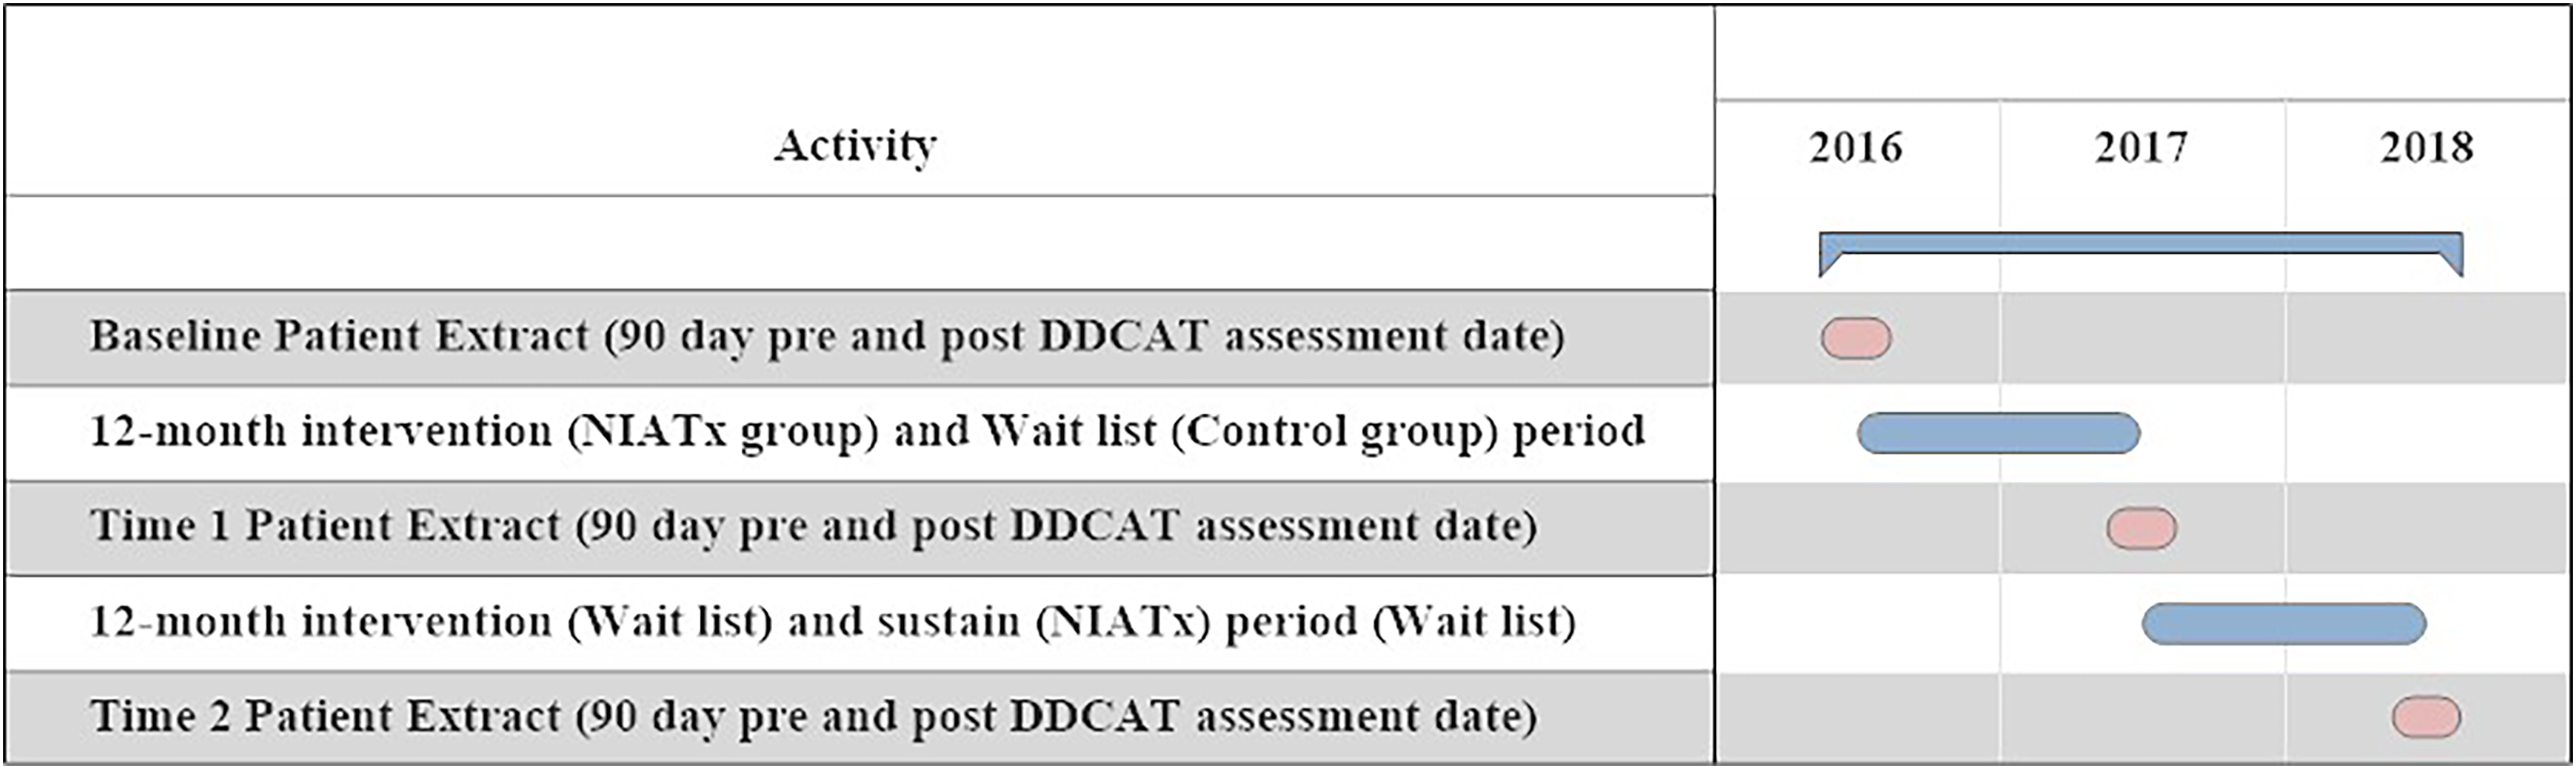
Data extraction timeframe.
The SIC tracks intervention implementation activities through three phases (pre-implementation, implementation, and sustainment) and eight stages of implementation (Chamberlain et al., 2011; Saldana, 2014). The SIC measures the time agencies spend conducting implementation activities (duration), number of recommended implementation activities completed (proportion), and progress toward implementation goals until reaching the sustainment phase (Chamberlain et al., 2011, 2012; Saldana, 2014; Saldana & Chamberlain, 2012). For this study, we adapted the SIC to track agency participation in and adherence to NIATx implementation strategies. The NIATx-SIC utilized an online reporting system to track pre-implementation (time to the initial coach engagement call) and implementation (coach calls completed and change projects initiated) activities. Three NIATx SIC measures: (1) proportion of completed NIATx activities, (2) duration of NIATx activities, and (3) total time from initial to last NIATx activity were utilized to determine the level of adherence to NIATx implementation strategies for the per-protocol analysis. Agencies were assigned to a high-adherence group (i.e., values equal to or above the median across all three SIC categories) or a low-adherence group (i.e., values below the median across all three SIC categories).
In the state of Washington, agencies were licensed to provide only addiction treatment services or both substance use and MH services. Agency focus (0 = addiction only or 1 = addiction and MH) was classified using data collected from the Baseline DDCAT assessment. Patient demographics were gender (0 = female, 1 = male), race (0 = Caucasian, 1 = non-Caucasian, and 2 = Other), and ethnicity (0 = non-Hispanic, 1 = Hispanic).
Data analysis
Intent-to-treat analysis
A two-level (patient within an agency) multinomial logistic regression model determined the effects of the implementation strategy condition on agency outcomes (Hypothesis 1). At each measurement time point, a patient was allocated to one of four mutually exclusive and exhaustive categories—receiving (1) both medication types, (2) only psychotropic medication, (3) only addiction medication, or (4) neither medication type. We associated with each patient their time point of measurement within each agency (Baseline, Year1, or Year2), allowing analysis of the degree that the percentages in each category varied by the agency across years. Due to the waitlist control design, our analysis focuses on comparing agencies at two time points: (1) Cohort1 agencies versus Cohort2 agencies at Year1 versus Baseline, where the Cohort1 agencies were exposed to the intervention (Baseline to Year1) but Cohort2 agencies not; and (2) Cohort2 agencies versus Cohort1 agencies at Year2 versus Year 1, where Cohort2 agencies transitioned to intervention (Year1 to Year2), while Cohort1 agencies no longer remained in the intervention after Year1. We also considered both intent-to-treat analyses in which all randomly assigned agencies are included and a per-protocol analysis in which only implementing agencies are included. The resulting multilevel model was fit using the HLM 7 software (Raudenbush et al., 2011). The patient-level model (Level 1) can be written as shown in Table 2, where ϕ1ij, ϕ2ij, ϕ3ij, and ϕ4ij denote the probabilities that patients i in agency j achieve an outcome in each of categories 1, 2, 3, and 4, respectively, Year1 and Year2 are dummy-coded variables indicating whether the patient was recorded in years 1 or 2 (with the Baseline year as the referent), and thus β1j(k) and β2j(k) denote the relative changes in years 1 and 2, respectively, of the likelihood of scoring in category k = 1, 2, 3 versus category 4 in comparison with the baseline year for agency j.
Client: patient and agency level models for the intent-to-treat and per-protocol analysis.
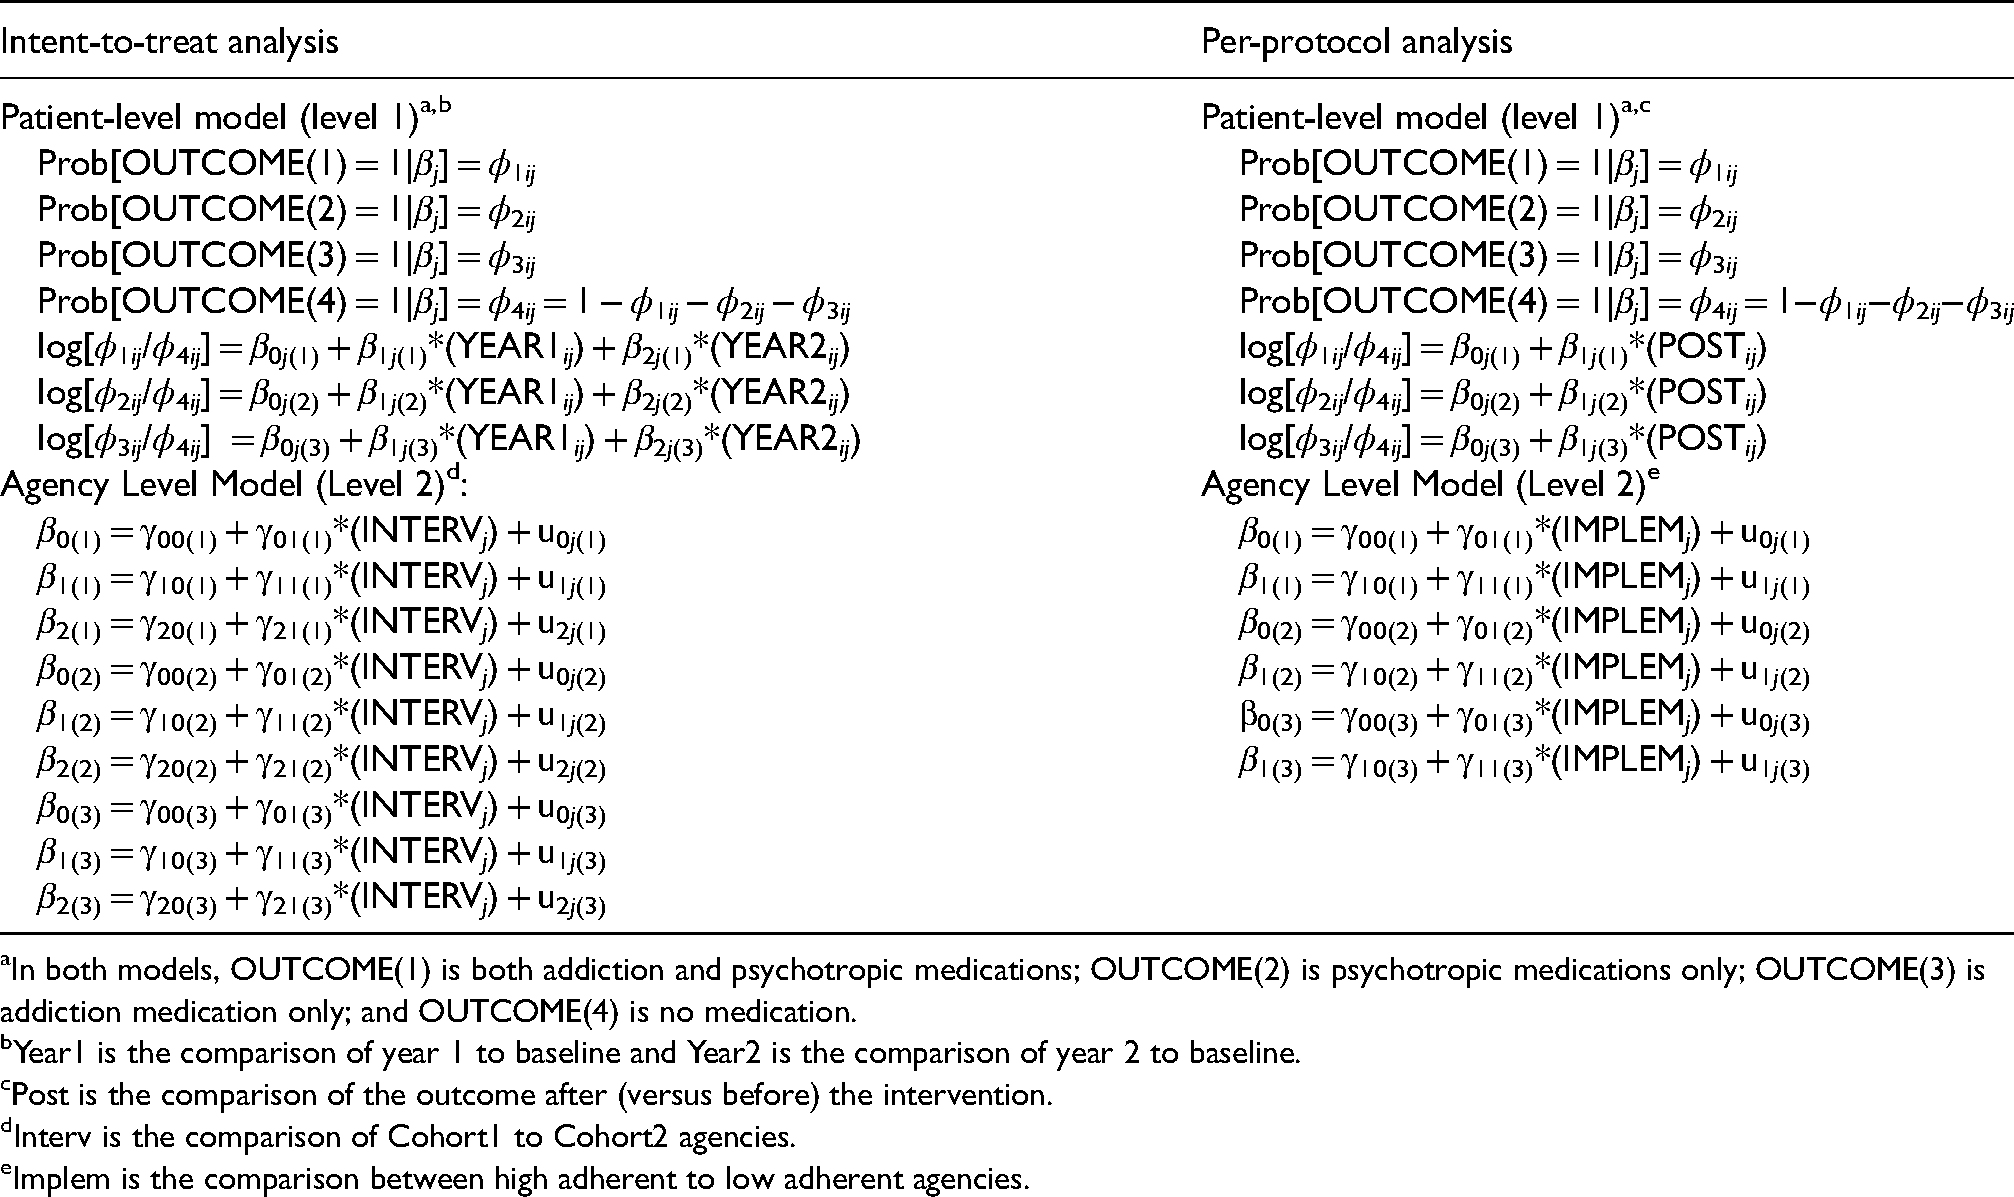
In both models, OUTCOME(1) is both addiction and psychotropic medications; OUTCOME(2) is psychotropic medications only; OUTCOME(3) is addiction medication only; and OUTCOME(4) is no medication.
Year1 is the comparison of year 1 to baseline and Year2 is the comparison of year 2 to baseline.
Post is the comparison of the outcome after (versus before) the intervention.
Interv is the comparison of Cohort1 to Cohort2 agencies.
Implem is the comparison between high adherent to low adherent agencies.
At the agency level, the model is expressed as shown in Figure 1 whereby each of the agency level effects is modeled in relation to the assigned cohort (Cohort1 agency = 1, and Cohort2 agency = 0). Consequently, the γ*0(k) coefficients define estimates for the Cohort2 agencies while the γ*1(k) coefficients define how the coefficients differ for the Cohort1 agencies versus the Cohort2 agencies. All effects were allowed to vary by agency, as reflected by the agency -level residuals, u*j(k). Due to the presence of the four outcome categories, and the evaluations of each of the first three against the fourth as separate outcomes, we have three quantities to compare at each of the time points when evaluating experimental effects. Specifically, we evaluate increases for each comparison category from Baseline to Year1, anticipating greater increases for Cohort1 agencies compared to Cohort2 agencies, and from Year1 to Year2, anticipating greater increases for Cohort2 agencies compared to Cohort1 agencies. Effects related to Year1 cohort differences can be evaluated from significance tests applied to individual fixed-effect coefficients in the model; effects related to Year2 differences across cohorts are evaluated from contrasts of relevant γ coefficients.
Per-protocol analysis
The per-protocol analysis focuses only on the time intervals over which the respective agencies transitioned into the intervention (Baseline to Year1 for Cohort1 agencies; Year1 to Year2 for Cohort2 agencies) and in each case distinguishes low- versus high-adherence agencies for that intervention year (Hypothesis 2). Each agency is thus associated with a dummy-coded adherence variable (high-adherence agency = 1, low-adherence agency = 0), and each patient with a time point of measurement (post-intervention = 1, pre-intervention = 0). The resulting analytic model again consists of two levels (patient within an agency) as shown in Table 2. Within this analytical model, the γ11(*) coefficients define the difference in intervention effects seen for high-adherence compared to low-adherence agencies, while the γ10(*) coefficients define the change from pre to post for the low adherent agencies, in each of the three comparison categories (again using the “no medication” category as a reference category). Similar to the intent-to-treat analysis, we have three quantities to compare in evaluating differences between agencies of low- versus high-adherence levels. Each of these effects is also allowed to vary by agency, as reflected by the agency level residuals, u1j(*).
The study was exempt from Institutional Review Board review as the data do not contain patient identifiers. Since this study involved secondary analysis of existing data, the burden of obtaining informed consent from de-identified patients would not be feasible. Therefore, no informed consent was obtained from patients seen in the agencies.
Results
Extended CONSORT diagram
Figure 2 shows the extended CONSORT diagram (Campbell et al., 2012) including the number of agencies and medication encounter records at each time point (Baseline, Year1, and Year2) by cohort.
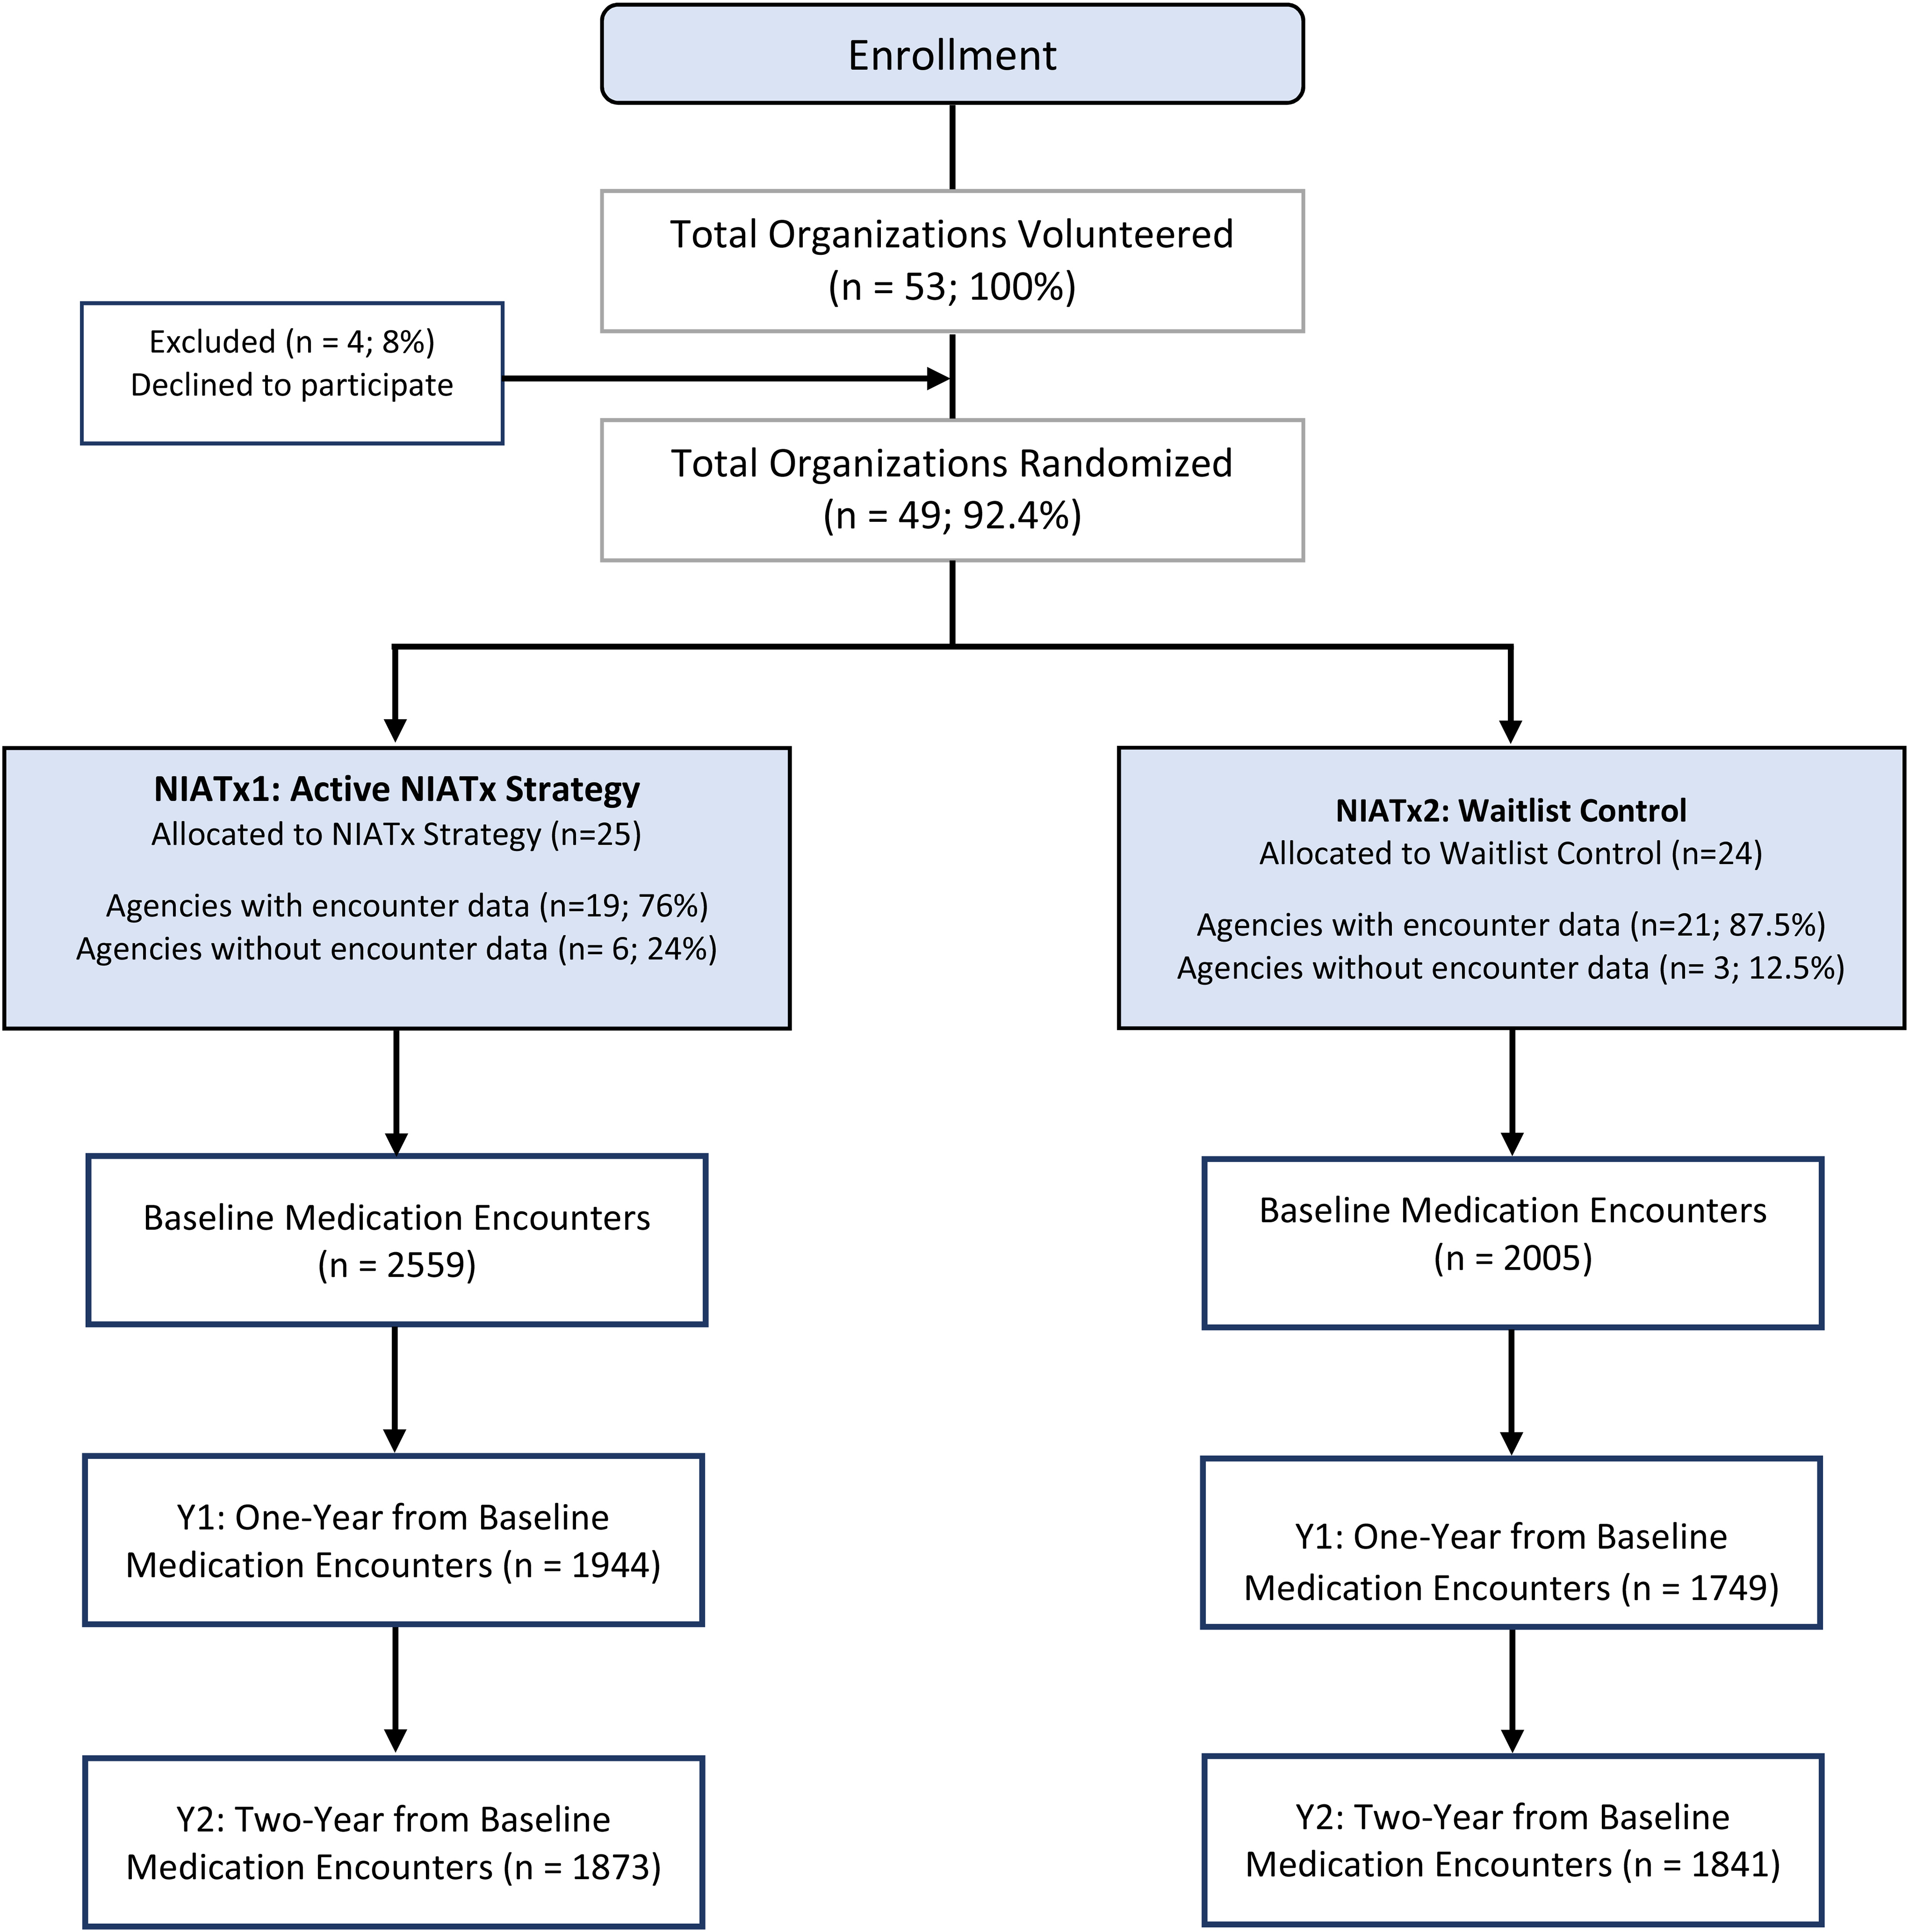
Extended consort diagram.
The per-protocol analysis excluded 1136 records from one agency in Cohort1 (Baseline = 477, Year1 = 364, and Year2 = 295 records) and 680 records from two agencies in Cohort2 (Baseline = 250, Year1 = 227, and Year2 = 203 records). The final per-protocol sample for Cohort1 was 2082 (Baseline), 1580 (Year1), and 1578 (Year2) and for Cohort2 it was 1755 (Baseline), 1522 (Year1), and 1638 (Year2).
Table 3 shows patient-level characteristics. The typical agency patient with a medication encounter was a non-Hispanic male Caucasian smoker who is either unemployed (40%) or not in the workforce (17.2%) with a high-school education or less (80.2%). Participating agency characteristics did not differ by cohort (Appendix 5).
Demographic characteristics of the patients receiving treatment.
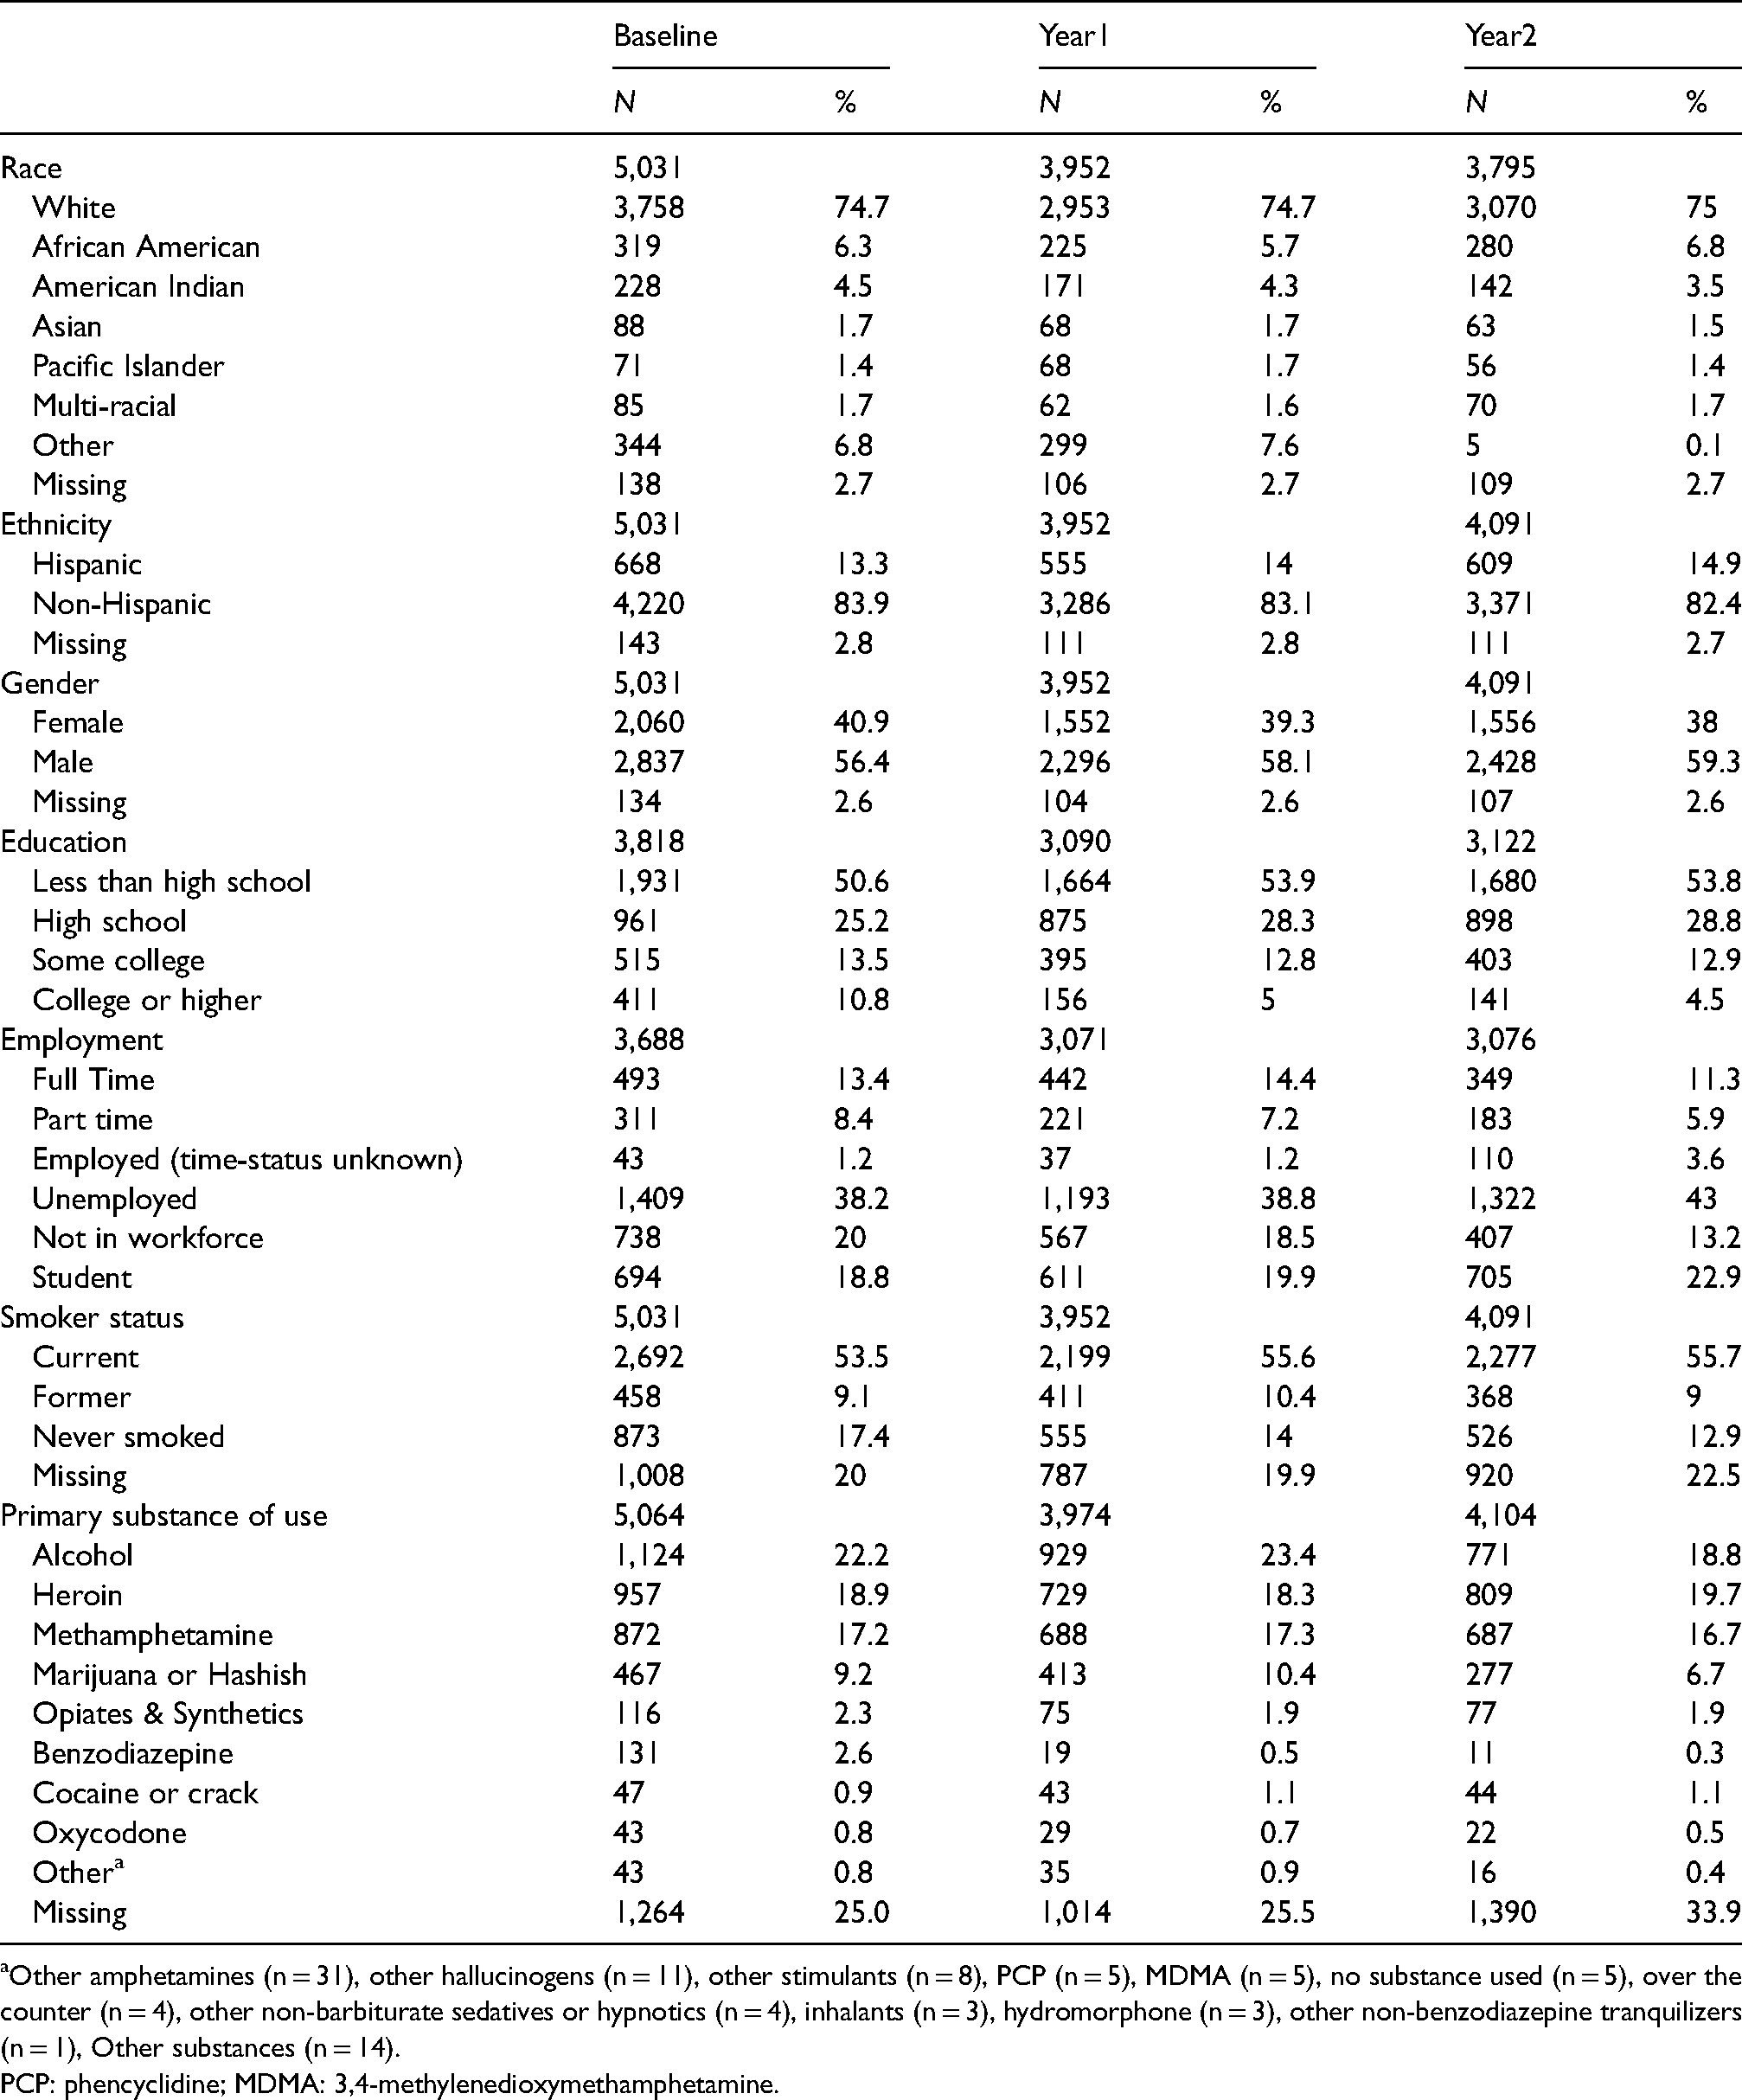
Other amphetamines (n = 31), other hallucinogens (n = 11), other stimulants (n = 8), PCP (n = 5), MDMA (n = 5), no substance used (n = 5), over the counter (n = 4), other non-barbiturate sedatives or hypnotics (n = 4), inhalants (n = 3), hydromorphone (n = 3), other non-benzodiazepine tranquilizers (n = 1), Other substances (n = 14).
PCP: phencyclidine; MDMA: 3,4-methylenedioxymethamphetamine.
Intent-to-treat analyses
Fixed-effect and variance component estimates for the intent-to-treat analysis (Hypothesis 1) are in Tables 4 and 5. Table 4 shows that significant changes occurred from Baseline to Year1 and from Baseline to Year2 for medication categories 1 and 3. These findings suggest increased medication access for patients in Cohort2 agencies, both in the relative likelihood of addiction versus no medication and in the likelihood of both medications versus no medication compared to Cohort1 agencies. Specifically, category 1 (both medications) had an increase in the log-odds from Year1 versus Baseline (
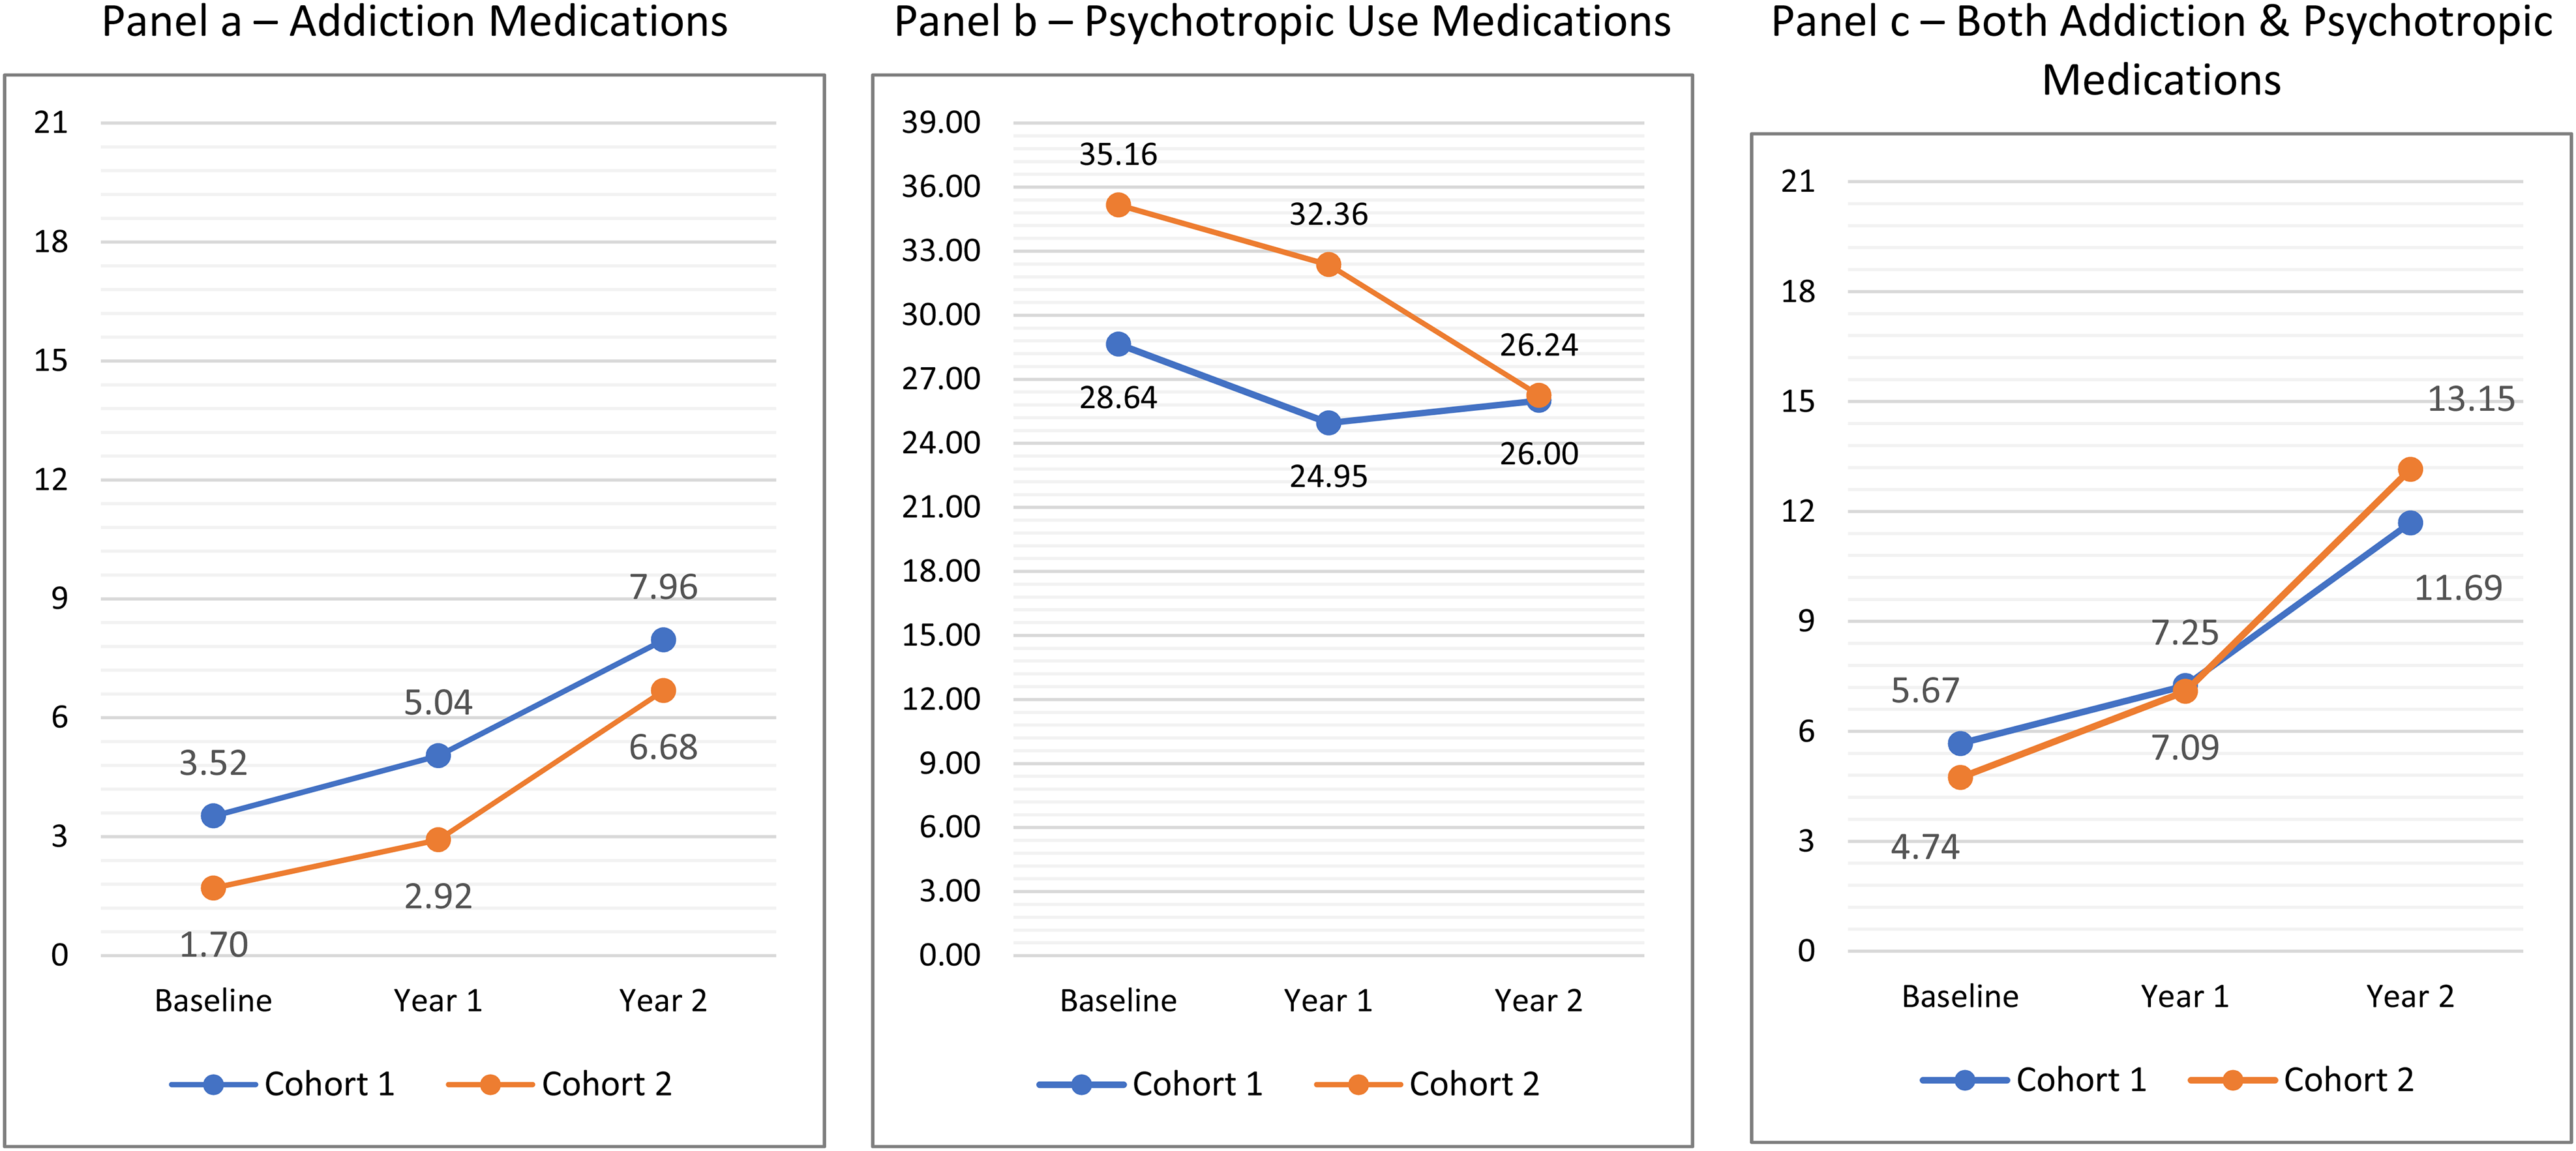
Percent of patients involved in (a) addiction, (b) psychotropic, and (c) both medication encounters.
Fixed effect estimates, two-level (patient within an agency) multinomial logistic regression model, intent-to-treat analysis. a

The model results compare patient access to each medication category: addiction and psychotropic (1), psychotropic only (2), and addiction (3) as compared to no medications.
Variance component estimates, two-level (patient within an agency) multinomial logistic regression model, intent-to-treat analysis. a

The random effect reflects an agency level effect in each year for each medication category: addiction and psychotropic (1), psychotropic only (2), and addiction (3) in comparison to no medications.
As noted, other experimental effects concerning greater gains in Year 2 for Cohort2 agencies versus Cohort1 agencies were evaluated by testing coefficient contrasts. Specifically, for each of the three medication categories we tested whether greater comparative gains are seen from Year1 to Year2 in the Cohort2 agencies, with a separate contrast tested for each of the three comparison categories. Only one contrast attained significance, showing a greater relative likelihood of addiction medication versus no medication in Cohort2 agencies versus Cohort1 agencies from Year1 to Year2 (
We observed significant agency variability, particularly at Baseline, regarding the relative likelihood of the comparison medication categories against no medication (Table 5). However, there was also frequently significant residual agency variability in the change in relative category likelihoods at years 1 and 2, suggesting some additional variability (besides the effects of the studied intervention) in how the agencies were changing over time. In general, while it appears that there were overall increases in the relative likelihood of accessing either both medications or addiction medications across years, the only place these changes were systematically associated with the experimental intervention occurred in the transition from Year1 to Year2, where greater increases were seen for the Cohort2 agencies versus Cohort1 agencies in the assignment of addiction medications.
Per-protocol analyses
Of the 37 agencies included in the per-protocol analysis, 32.4% (n = 12) had low adherence to NIATx and 67.6% (n = 25) exhibited high NIATx adherence. Six of the low-adherence agencies had been randomized to Cohort1 (NIATx) and six agencies to Cohort2 (waitlist). For high-adherence agencies, the distribution was 12 agencies to Cohort1 and 13 agencies to Cohort2.
Fixed-effect and variance component estimates for the per-protocol analysis (Hypothesis 2) are in Tables 6 and 7. Table 6 shows several effects that were consistent with the observations from Figure 4. Regarding differences between agencies of varied implementation levels, a significant effect for

Per-protocol analysis of percent of patients involved in (a) addiction, (b) psychotropic, and (c) both medication encounters.
Fixed effect estimates, two-level (patient within an agency) multinomial logistic regression model, per-protocol analysis. a

The per-protocol results compare patient access for each medication category: addiction and psychotropic (1), psychotropic only (2), and addiction (3) as compared to no medications.
Variance component estimates, two-level (patient within an agency) multinomial logistic regression model, per-protocol analysis. a

The random effect reflects an agency level effect in each year for each medication category: addiction and psychotropic (1), psychotropic only (2), and addiction (3) in comparison to no medications. Post is the comparison of the outcome after (versus before) the intervention.
The exploratory per-protocol analysis (Appendix 6) indicated that addiction and MH agencies showed less of an increase in patients accessing addiction and both addiction and psychotropic medications. The inclusion of patient demographics found that males and non-White patients were less likely to have access to addiction, psychotropic, or both medications, as compared to female or Caucasian patients. Hispanic patients also were less likely to have access to both addiction and psychotropic medications and addiction medications only.
Discussion
Study results provide additional evidence about the effectiveness of NIATx use (Belenko et al., 2017; Gustafson et al., 2013; Hoffman et al., 2008, 2011; McCarty et al., 2007; Pankow et al., 2018; Quanbeck et al., 2011). Unlike prior NIATx implementation studies, this research focused on efforts to improve access to medications for individuals with CODs. Our results support a clear pattern of agency level increases in the assignment of addiction medications, as well as a combination of addiction and psychotropic medications, across agencies in comparison to the no medication condition.
Overall, agencies assigned to both cohorts increased the percentage of patients receiving an addiction medication (Cohort1: 3.5%–5%, Cohort2: 2.9%–6.7%) during their assigned active NIATx intervention period (Cohort1: Baseline to Year1, Cohort2: Year1 to Year2). In the intent-to-treat analysis, we observed a significantly greater increase in access to addiction medications for the Cohort2 agencies versus Cohort1 agencies from Year1 to Year2. While Cohort2 agencies saw medication access increase in their active NIATx intervention period, no other effects occurred related to the randomly assigned intervention condition. As such, Hypothesis 1 for addiction medications was not supported.
Addiction medication access in Cohort1 agencies increased from 3.52% (Baseline) to 7.96% (Year2) suggesting a potential delayed influence of exposure to NIATx implementation strategies. The introduction of behavioral health organizations (BHOs), which started at the same time as the active intervention period for Cohort1 agencies, may have contributed to this delayed effect. Our study findings provide some additional evidence about the potential effectiveness of NIATx to increase addiction medication access (Ford et al., 2017; Molfenter et al., 2019).
This study is the first to explore how NIATx implementation strategies improved access to both addiction and psychotropic medications for individuals with CODs. Although 7% of individuals with CODs receive integrated care (Substance Abuse and Mental Health Services, 2019), it is unclear how many individuals accessed medications for their CODs. Our study addressed this gap to some extent. On average across both cohorts, ∼5.2% of patients at Baseline received both an addiction and psychotropic medication for their CODs, which increased to 12.4% in two years. Although medication access improved during exposure to NIATx for Cohort2 agencies, improvements were delayed in Cohort1 agencies. While Hypothesis 1 for both medications was not supported, the results provide some evidence about the potential effectiveness of NIATx implementation strategies to improve access to addiction and psychotropic medications as access increased by 6% across both cohorts by the end of Year 2. However, substantial agency level variability suggests that other internal (e.g., staff turnover) or environmental (e.g., regulatory changes promoting integrated treatment) factors, which naturally contribute to the noise associated with efforts to study the experimental effects, may explain why exposure to the NIATx implementation strategies might have improved access to both medications in either cohort.
Agencies’ adherence to NIATx implementation strategies suggests a different story. High-adherence agencies increased patients receiving both medications by 56.92% (6.5%–10.2%) versus 48.33% (6.0%–8.9%) for low-adherence agencies. The rate of change was similar for low-adherence (2.7%–4.5%, 66.67% increase) versus high-adherence (3.8%–6.5%, 71.05% increase) agencies. However, high-adherence agencies showed a significant decrease in access to psychotropic medications compared to low-adherence agencies (−23.4% vs. −2.5%, respectively). Although the likelihood of access to both medications and addiction medications across implementation levels was significant, the residual variability in the changes across agencies was non-significant. The findings partially support Hypothesis 2 and revealed that higher fidelity to the NIATx implementation strategies may improve access for some medications (addiction or both addiction and psychotropic medications) but not for other medications (psychotropic). While this study was the first to explore adherence to NIATx, further research is needed to understand the role of adherence in implementation research.
The exploratory per-protocol analysis results that patients from addiction and MH agencies had less access to medications was unanticipated because these agencies should be more likely to have systems in place to address CODs. However, patient demographics predicting access to addiction or psychotropic medications was consistent with prior research (Cook et al., 2017; Lapham et al., 2020; Ober et al., 2018; Watkins et al., 2018). The fact that similar patient demographics were associated with access to both medications was not unexpected given these trends.
Findings may be due to differing uptake barriers among medication types. Barriers to addiction medications are usually related to lack of provider knowledge or expertise, feasibility, and cost of provision (Hassamal et al., 2017; Knudsen et al., 2011). Organizational barriers (e.g., timely appointments) also impact access to addiction medication (Malowney et al., 2015; Roy et al., 2020, 2021). Barriers to psychotropic medications may differ, especially when considering injectables (Getzen et al., 2014), wait time to psychiatric appointments to access medications, or illnesses that cause cognitive deficits (Garcia et al., 2016). In addition, fewer Food and Drug Agency-approved medications exist for SUDs than psychiatric disorders (Solmi et al., 2020; Volkow, 2020). Thus, additional research is needed to understand the barriers influencing medication access for individuals with CODs.
Limitations
There are some notable study limitations. First, at the time of the study, the statewide reporting of claims data in the State of Washington was transitioning from a previously established system to the BHDS and P1 systems, which resulted in agencies reporting data through their BHOs rather than reporting data to the state as was done historically. Associated data reporting challenges (i.e., incomplete data or reporting lags) can lead to the under-reporting of agency records. Missing agency data reduce the outcome denominator and could change the numerator, resulting in under- or over-reporting of patient medication access. Second, patients in the BHDS and P1 systems were assigned a unique identifier that allowed treatment episodes to be linked over time and across agencies. Although often considered a strength of the data reporting system, this approach could introduce a limitation for this study because records were extracted only for patients who received medications from the participating agencies. It is possible that patients receiving both medications may not have been identified when the patient received either an addiction or psychotropic medication from a study agency but received the other medication from a non-participating agency. Finally, findings may not be generalizable, as only 11.3% of the eligible agencies participated in the study and improvements may not be seen in other agencies.
Future directions
Implementation research continues to evolve and address more complex organizational change efforts. This practical implementation research describes outcomes from a systematic organizational change to improve access to addiction and/or psychotropic medications in publicly funded addiction treatment agencies for individuals with CODs. A unique study contribution was the use of the NIATx-SIC to examine agency adherence to the NIATx implementation strategies. Details about how NIATx was utilized in this RCT, as well as adherence to NIATx, provide a roadmap for future efforts to improve access to medications.
Cohort2 agencies appeared to utilize the feedback report on DDCAT performance to implement changes for improving access to addiction medications and both addiction and psychotropic medications. Once exposed to NIATx, these agencies showed continued improvements. Results suggest that some agencies may only need access to a feedback report, but other agencies need follow-up support through multi-component implementation strategies (i.e., NIATx) to improve medication access. The integration and impact of feedback reports with NIATx should be explored.
Although access to psychotropic medications declined (−7.1%), the combined increase in access to both medications (3.7%) and addiction medications (2.6%) largely offset that reduction. As a result, approximately the same number of patients received access to any medication (40.8% at pre-intervention vs. 40% at post-intervention). These findings suggest that high-adherence agencies may have implemented changes focused on the elements of the DDCAT items associated with increased access to psychotropic medications (medication policy, medication plans, medication provider, and staff medication training) that resulted in increased access to both addiction and psychiatric medications. Data from the DDCAT appear to provide confirmation, as the aggregate changes in these four items are significantly higher in high-adherence (Δ = 0.69) versus low-adherence agencies (Δ = 0.45). Additional research is necessary to understand this apparent relationship.
More importantly, the results indicated that adherence to the implementation strategies both in terms of the percent of activities completed (e.g., coaching calls and change projects implemented) and the duration (i.e., length of time spent on implementation activities) may predict successful organizational change. Although higher participation with NIATx is associated with greater staff perception that changes will be sustained (Ford and Gilson, 2021) and evidence suggests that 26% to 40% of agencies sustained NIATx improvements (Ford et al., 2018), the mixed results associated with NIATx adherence requires further investigation. As such, it will be important to determine the optimal level of adherence that drives successful organizational change and understand how adherence levels differ depending on the study outcomes. Adherence in our study did not include a measure of fidelity to NIATx. In other words, did an agency implement NIATx as intended and follow the five principles (Hoffman et al., 2012)? Therefore, it is possible that fidelity, and not adherence, or a combination of both fidelity and adherence, may be associated with greater outcome improvements. Current research is underway to investigate this question for different substance abuse treatment interventions (R01 DA044745-01; Saldana). Finally, evidence shows that clinical outcomes (e.g., abstinence or reduction in heavy drinking) improve for individuals who receive medications for their CODs (Coles et al., 2019; Pettinati et al., 2010; Saunders et al., 2015). Future research should explore the effect of improved medication access on proximal or distal treatment effects.
Conclusions
Access to integrated treatment for individuals with co-occurring substance use and MH disorders represents a long-standing problem in the field of behavioral health. Most addiction agencies simply do not have the capacity to provide treatment, including access to medications, for individuals with CODs. Likewise, most MH organizations do not address substance use. Implementation science provides the framework to address such critical and complex organizational changes that can contribute to the provision of new or modified patient services. This study contributes to the ongoing science by providing evidence about the effectiveness of a multi-component implementation strategy (NIATx) in improving access to both addiction and psychotropic medications for individuals with CODs. It also addresses another important issue related to the understudied topic of adherence and fidelity to the implementation strategy as it is designed and intended to be deployed. Here, agency adherence to NIATx improved medication access. Together, these results provide further support for the importance of elucidating the components of implementation strategies that result in desired implementation outcomes.
Footnotes
Acknowledgements
The statements made here are those of the authors. The authors express their gratitude to all partners on this project: Washington State Department of Social and Health Services, Michael Langer, Thomas Fuchs, Leslie Carey, and the leadership, staff, and patients from all participating community addiction treatment programs. We are also grateful for the work of Mehret Assefa, Theresa Sharin, Amy McIlvaine, Eric Osborne, Ahney King, and Kevin Campbell.
Declaration of conflicting interests
The authors declared no potential conflicts of interest with respect to the research, authorship, and/or publication of this article.
Funding
The authors disclosed receipt of the following financial support for the research, authorship, and/or publication of this article: This study was funded by grant R01DA037222 from the National Institute on Drug Abuse (NIDA) (Drs. McGovern and Ford, principal investigators) and by grant R01 DA044745 from NIDA (Dr. Saldana, principal investigator). ClinicalTrials.gov, NCT03007940. Registered January 2, 2017.
Appendix 1. Overview of the DDCAT measure. a

| Dimension | Number of items | Content of items |
|---|---|---|
| I. Program structure | 4 | Program mission, structure, and financing, format for delivery of mental health or addiction services. Example item: Organizational certification and licensure |
| II. Program milieu | 2 | Physical, social, and cultural environment for persons with psychiatric or substance use problems. Example item: welcoming to treatment for both disorders |
| III. Clinical process: assessment | 7 | Processes for access and entry into services, screening, assessment & diagnosis. Example Item: routine screening for MH symptoms |
| IV. Clinical process: treatment b | 10 | Processes for treatment including pharmacological and psychosocial evidence-based formats. Example Item: treatment plans addressing both disorders |
| V. Continuity of care c | 5 | Discharge and continuity for both substance use and psychiatric services, peer recovery supports. Example Item: Co-occurring disorders addressed at discharge. |
| VI. Staffing d | 5 | Presence, role, and integration of staff with mental health and/or addiction expertise, supervision process Example Item: access to MH clinical supervision or consultation |
| VII. Training | 2 | Proportion of staff trained and program's training strategy for co-occurring disorder issues. Example Item: clinical staff have advanced training in integrated treatment. |
DDCAT: dual diagnosis capability in addiction treatment; MH: mental health.
Each of the 35 items are rated using a five-point scale where the anchors at 1, 3, and 5 are addiction only services, dual diagnosis capable, or dual diagnosis enhanced, respectively. Scores are averaged across each dimension and the overall DDCAT score represents the average across the seven dimensions.
Item IV-E focuses on the Policies and procedures for medication evaluation, management, monitoring, and compliance.
Item V-E focus addresses if sufficient supply and compliance plan for medications is documented.
Item VI-A examines staffing to determine the presence or absence of a psychiatrist or other physician or prescriber of psychotropic medications.
Appendix 2. Behavioral health data system and the Washington state health care authority provider one encounter: description of datasets including key variables.
Appendix 3. Data dictionary.
| Table name and description | Variable name | Variable notes and values |
|---|---|---|
| FINAL_BHDS_DEMOGS Demographic information for B111 clients originating in BHDS |
Gender | 1 = Male 2 = Female |
| Hispanic | 1 = Yes 2 = No |
|
| RACE_fin | 1 = African American 2 = Asian 3 = White 4 = AI/AN 5 = Pacific Islander 6 = Multi 7 = Other 8 = Not collected |
|
| Uniqueid | Number field—the uniqueid should match across all tables (both BHDS & TARGET) | |
| FINAL_BHDS_NIATX_ASAM ASAM information for clients originating in BHDS. |
admission_sequence | Number field representing the sequential order of admissions for a given client by a given provider in a given follow-up period |
| ASAMLevelCd | 0 = Not at risk 0.5 = Early intervention 1 = OP services 1-WM = Ambulatory WM without extended onsite monitoring 2-WM = Ambulatory WM with extended onsite monitoring 2.1 = Intensive OP services 2.5 = Partial hospitalization services 3.1 = Clinically managed low-intensity residential services 3.2-WM = Clinically managed residential WM 3.3 = Clinically managed population-specific high-intensity residential services 3.5 = Clinically managed high-intensity residential services 3.7 = Medically monitored IIP services 3.7-WM = Medically monitored inpatient WM 4 = Medically managed IIP services 4-WM = Medically managed intensive WM OPT (level 1) = Opioid treatment program (level 1) 3.2-D = Clinically managed residential WM (historical code replaced with 3.2 WM) 3.7-D = Medically monitored inpatient WM (historical code replaced with 3.7-WM) OST = OTP (historical code replaced with OTP) |
|
| days_from_admit | No. of days from admission when the event took place Number field (these include positive and negative numbers, where positive numbers mean the event was after the admission and negative numbers mean the event was before admission) |
|
| Provider | See list a | |
| ProviderNPI | Number field | |
| Timing | 0 = Baseline (T1) 1 = Year 1 follow-up (T2) 2 = Year 2 follow-up (T3) |
|
| Uniqueid | Number field | |
| FINAL_BHDS_NIATX_COD COD information for clients originating in BHDS. |
admission_sequence | Number field representing the sequential order of admissions for a given client by a given provider in a given follow-up period |
| AssessmentScore | 1 = Invalid (do not use) 2 = Less severe MHD/less severe SUD 3 = More severe MHD/less severe SUD 4 = Less severe MHD/more severe SUD 5 = More severe MHD/more severe SUD 6 = No co-occurring treatment needed |
|
| days_from_admit | Number field—no. of days from admission when the event took place | |
| EDS | 1 = EDS score of 0 2 = EDS score of 1 3 = EDS score of 2 4 = EDS score of 3 5 = EDS score of 4 6 = EDS score of 5 7 = Refused 8 = Unable to complete |
|
| IDS | 1 = IDS score of 0 2 = IDS score of 1 3 = IDS score of 2 4 = IDS score of 3 5 = IDS score of 4 6 = IDS score of 5 7 = Refused 8 = Unable to complete |
|
| Provider | See list a | |
| SDS | 1 = SDS score of 0 2 = SDS score of 1 3 = SDS score of 2 4 = SDS score of 3 5 = SDS score of 4 6 = SDS score of 5 7 = Refused 8 = Unable to complete |
|
| Timing | 0 = Baseline (T1) 1 = Year 1 follow-up (T2) 2 = Year 2 follow-up (T3) |
|
| Uniqueid | Number field | |
| FINAL_BHDS_NIATX_PGM_ADMITS Admission information for clients originating in BHDS. |
admission_sequence | Number field representing the sequential order of admissions for a given client by a given provider in a given follow-up period |
| Age | Number field—calculated age at admission | |
| BHDS_table | 1 = CalEpi (admission is constructed from encounter) 2 = PgmEnroll (admission is from the program enrollment table) 3 = ServiceEpi (admission is from the service episode table) |
|
| Group | 1 = NIATx 2 = Waitlist |
|
| Los | Number field—length of stay—no. of days between admission and discharge | |
| ProgramCd | 51 = SUD—OP 52 = SUD—intensive OP 54 = SUD—IIP 55 = SUD—LTR 56 = SUD—recovery home 57 = SUD—WM (aka DX) 58 = SUD—OST 59 = SUD—housing SUPPORT |
|
| ProgramEndReason | 1 = Treatment completed 2 = Left against advice, including dropout 3 = Terminated by facility 4 = Transferred to another SA treatment or MH program 5 = Incarcerated 6 = Death by suicide 7 = Death not by suicide 8 = Other 9 = Lost to contact 10 = Administrative closure (Note: Codes 0 and 97 are invalid values) |
|
| Provider | See list a | |
| Timing | 0 = Baseline (T1) 1 = Year 1 follow-up (T2) 2 = Year 2 follow-up (T3) |
|
| tx_Dx_mode_txt | 1 = DX 2 = IIP 3 = LTR 4 = OP 5 = OST 6 = RH |
|
| Uniqueid | Number field | |
| FINAL_BHDS_NIATX_PROFILE Profile information for clients originating in BHDS |
admission_sequence | Number field representing the sequential order of admissions for a given client by a given provider in a given follow-up period |
| days_from_admit | No. of days from admission when the event took place Number field (these include positive and negative numbers, where positive numbers mean the event was after the admission and negative numbers mean the event was before admission) |
|
| EducationCd | 1 = No formal schooling 2 = Nursery school, pre-school, head start 3 = Kindergarten, less than one school grade 4 = Grade 1 5 = Grade 2 6 = Grade 3 7 = Grade 4 8 = Grade 5 9 = Grade 6 10 = Grade 7 11 = Grade 8 12 = Grade 9 13 = Grade 10 14 = Grade 11 15 = Grade 12 16 = High school diploma or GED 17 = First year of college/university (freshman) 18 = Second year of college/university (sophomore) or associate degree 19 = Third year of college/university (junior) 20 = Fourth year of college/university (senior) 21 = Bachelor's degree 22 = Graduate or professional school—includes master's and doctoral degrees, medical school, law school, etc. 23 = Vocational school - includes business, technical, secretarial, trade, or correspondence courses which provide specialized training for skilled employment 97 = Unknown |
|
| ResidenceCd | 1 = Homeless without housing 2 = Foster home/Foster care 3 = Residential care 4 = Crisis residence 5 = Institutional setting 6 = Jail/correctional facility 7 = Private residence 8 = Independent living 9 = Dependent living 10 = Private residence 11 = Other residential status 12 = Homeless with housing 97 = Unknown |
|
| SchoolAttendanceFlag | 1 = Yes 2 = No 3 = Refused to answer 4 = Unknown |
|
| SelfHelpCount | 1 = No attendance 2 = Less than a week 3 = About one a week 4 = 2 to 3 times per week 5 = At least 4 times a week 6 = Not collected 97 = Unknown (Note: code 0 is an invalid value) |
|
| SmokerCd | 1 = Current smoker 2 = Former smoker 3 = Never smoked 97 = Unknown 98 = Refused to answer |
|
| Timing | 0 = Baseline (T1) 1 = Year 1 follow-up (T2) 2 = Year 2 follow-up (T3) |
|
| Uniqueid | Number field | |
| UsedNeedleRecentlyFlag | 1 = Yes 2 = No 3 = Refused to answer 4 = Unknown |
|
| FINAL_BHDS_NIATX_RESIDENCE Residence information for clients originating in BHDS. |
admission_sequence | Number field representing the sequential order of admissions for a given client by a given provider in a given follow-up period |
| final_bho | 1 = Salish 2 = Spokane 3 = King 4 = Great Rivers 5 = Greater Columbia 6 = North Sound 7 = Pierce Optum 8 = MCO 9 = Thurston/Mason |
|
| final_county | 1 = Kitsap 2 = Spokane 3 = King 4 = Cowlitz 5 = Columbia 6 = Whatcom 7 = Snohomish 8 = Clallam 9 = Franklin 10 = Yakima 11 = Lewis 12 = Pierce 13 = Clark 14 = Benton 15 = Kittitas 16 = Manson 17 = Thurston 18 = Whitman 19 = Skagit 20 = Asotin 21 = Grays Harbor |
|
| months_from_admit | Number field—no. of months the closest residence info was from the month of admission | |
| Provider | See above | |
| Timing | 0 = Baseline (T1) 1 = Year 1 follow-up (T2) 2 = Year 2 follow-up (T3) |
|
| Uniqueid | Number field | |
| FINAL_BHDS_NIATX_SUBSTANCE Substance Use information for clients originating in BHDS. |
admission_sequence | Number field representing the sequential order of admissions for a given client by a given provider in a given follow-up period |
| agelastused1 | Number field—age last used primary substance | |
| agelastused2 | Number field—age last used secondary substance | |
| agelastused3 | Number field—age last used tertiary substance | |
| days_from_admit | Number field—no. of days from admission when the event took place | |
| FirstUseAge1 | 0 = Client born with a SUD resulting from in-utero exposure 1-98 = Age at first use, in years 99 = Not applicable |
|
| FirstUseAge2 | ||
| FirstUseAge3 | ||
| FrequencyUse1Cd | 1 = No use in the past month 2 = 1–3 times in the past month 3 = 4–12 times in the past month 4 = 13 or more times in the past month 5 = Daily 6 = Not applicable 7 = Not available |
|
| FrequencyUse2Cd | ||
| FrequencyUse3Cd | ||
| Method1Cd | 1 = Inhalation 2 = Injection 3 = Oral 4 = Other 5 = Smoking (Note: code 7 is an invalid value) |
|
| Method2Cd | ||
| Method3Cd | ||
| PeakUse1Cd | 1 = No use in the past month 2 = 1–3 times in the past month 3 = 4–12 times in the past month 4 = 13 or more times in the past month 5 = Daily 6 = Not applicable (Note: Code 7 is an invalid value) See above |
|
| PeakUse2Cd | ||
| PeakUse3Cd | ||
| Provider | ||
| Substance1Cd | 1 = None 2 = Alcohol 3 = Cocaine/crack 4 = Marijuana/hashish 5 = Heroin 6 = Other opiates & synthetics 7 = PCP 8 = Other hallucinogens 9 = Methamphetamine 10 = Other amphetamines 11 = Other stimulants 12 = Benzodiazepine 13 = Other non-benzodiazepine tranquilizers 14 = Barbiturates 15 = Other non-barbiturate sedatives or hypnotics 16 = Inhalants 17 = Over the counter 18 = Oxycodone 19 = Hydromorphone 20 = MDMA (ecstasy, Molly, etc.) 21 = Other |
|
| Substance2Cd | ||
| Substance3Cd | ||
| Timing | 0 = Baseline (T1) 1 = Year 1 follow-up (T2) 2 = Year 2 follow-up (T3) |
|
| Uniqueid | Number field | |
| FINAL_BHDS_MAT_NIATX MAT Rx information for clients originating in BHDS |
days_from_first_admit | Number field—no. of days from the FIRST admission in the follow-up period by the given provider when the event took place |
| Provider | See list a | |
| Timing | 0 = Baseline (T1) 1 = Year 1 follow-up (T2) 2 = Year 2 follow-up (T3) |
|
| Uniqueid | Number field | |
| FINAL_BHDS_NIATX_ENCOUNT ERS CD and MH encounter information for clients originating in BHDS |
days_from_first_adm | Number field—no. of days from the FIRST admission in the follow-up period by the given provider when the event took place |
| Disorder | 1 = CD (SUD) 2 = MH (MHD) |
|
| Group | 1 = NIATx 2 = Waitlist |
|
| Modality | 1 = Assessment 2 = Brief intervention 3 = Case management 4 = Family treatment 5 = Group treatment services 6 = Individual treatment services 7 = Intake evaluation 8 = IIP residential services 9 = Long-term care residential services 10 = Medication management 11 = Medication monitoring 12 = Mental health services provided in a residential setting 13 = OOST treatment 14 = OP treatment 15 = Recovery house residential services 16 = Rehabilitation case management 17 = Special population evaluation 18 = Supported employment |
|
| niatx_mode | 1 = CD assessment 2 = CD medication management 3 = CD OP 4 = CD residential 5 = MH assessment 6 = MH medication management 7 = MH OP 8 = MH residential |
|
| Provider | See list a | |
| Timing | 0 = Baseline (T1) 1 = Year 1 follow-up (T2) 2 = Year 2 follow-up (T3) |
|
| Uniqueid | Number field | |
| FINAL_BHDS_NIATX_MH_RX Psychotropic Rx information for clients originating in BHDS |
days_from_first_admit | Number field—no. of days from the FIRST admission in the follow-up period by the given provider when the event took place |
| Provider | See list a | |
| Timing | 0 = Baseline (T1) 1 = Year 1 follow-up (T2) 2 = Year 2 follow-up (T3) |
|
| Uniqueid | Number field | |
| FINAL_BHDS_NIATX_PGM_AD MITS Admission information for clients originating in BHDS. |
admission_sequence | Number field representing the sequential order of admissions for a given client by a given provider in a given follow-up period |
| Age | Number field (calculated age at admission) | |
| BHDS_table | 1 = CalEpi (admission is constructed from encounter) 2 = PgmEnroll (admission is from the program enrolment table) 3 = ServiceEpi (admission is from the service episode table) |
|
| Group | 1 = NIATx 2 = Waitlist |
|
| Los | Length of stay—no. of days between admission and discharge (number field) | |
| ProgramCd | 51 = SUD—OP 52 = SUD—intensive OP 54 = SUD—IIP 55 = SUD—LTR 56 = SUD—recovery home 57 = SUD—WM (aka DX) 58 = SUD—OST 59 = SUD—housing support |
|
| ProgramEndReason | 1 = Treatment completed 2 = Left against advice, including dropout 3 = Terminated by facility 4 = Transferred to another SA treatment or MH program 5 = Incarcerated 6 = Death by suicide 7 = Death not by suicide 8 = Other 9 = Lost to contact 10 = Administrative closure (Note: Codes 0 and 97 are invalid values) |
|
| Provider | See list a | |
| Timing | 0 = Baseline (T1) 1 = Year 1 follow-up (T2) 2 = Year 2 follow-up (T3) |
|
| tx_Dx_mode_txt | 1 = DX 2 = IIP 3 = LTR 4 = OP 5 = OST 6 = RH |
|
| Uniqueid | Number field |
ASAM, American Society of Addiction Medicine; BHDS: behavioral health data system; CD: chemical dependency; DX: detox; IIP: intensive inpatient; LTR: long-term residential; OP: outpatient; OST: opiate substitution; RH: recover house; EDS: externalizing disorder score; GED: general educational development; IDS: internalizing disorder score; MDMA: 3,4-methylenedioxymethamphetamine; MH: mental health; MHD: mental health disorder; WM: withdrawal management; NIATx: network for the improvement of addiction treatment; PCP: phencyclidine; SA: substance abuse; SDS: substance use disorder score; SUD: substance use disorder; OTP: opioid treatment program; AI/ANs: American Indians and Alaska Natives; MCO: managed care organization.
Provider names: 0 = Agape Unlimited; 1 = Alcohol Drug Dependency Services; 2 = American Behavioral Health-Cozza; 3 = American Behavioral Health-Mission; 4 = Asian Counseling and Referral Service; 5 = Awakenings; 6 = Blue Mountain Counseling; 7 = Cascadia-Bountiful Life Addiction Treatment Center, LLC; 8 = Catholic Community Services Bellingham; 9 = Catholic Community Services NW Everett; 10 = Cedar Grove Counseling; 11 = Center for Human Services; 12 = Central Washington Comprehensive Mental Health Yakima; 13 = Central Washington Comprehensive Mental Health Pasco; 14 = Community Allied Behavioral Health; 15 = Consejo Counseling Tacoma; 16 = Consejo Counseling Seattle; 17 = Cowlitz Family Health Center aka DAPC Castle Rock; 18 = Cowlitz Family Health Center aka DAPC Longview; 19 = Daybreak Youth Services Vancouver; 20 = Daybreak Youth Services Spokane; 21 = Eugenia Center; 22 = Evergreen Recovery Centers Seattle; 23 = Evergreen Recovery Centers Everett; 24 = Excelsior Youth Center; 26 = First Step Community Counseling Services; 27 = Good Samaritan Behavioral Health Chemical Dependency Program aka Multicare Health Systems; 28 = Isabella House-New Horizons; 29 = Navos; 30 = Northwest Resources II Olympia; 31 = Northwest Resources II Shelton; 32 = Olalla Guest Lodge; 33 = Olympic Personal Growth Center; 34 = Palouse River Counseling; 35 = Phoenix Recovery Services LLC; 36 = Pierce County Alliance; 37 = Pioneer Center North; 38 = Port Gamble S’Klallam Tribal Wellness Center; 39 = Prosperity Wellness Center; 40 = Quality Behavioral Health; 41 = Sea Mar Turning Point Recovery; 42 = Somerset Counseling Center (DROPPED OUT); 43 = Specialty 1; 44 = Specialty 2; 45 = Sunrise Services; 46 = The Healing Lodge of the Seven Nations; 47 = Triumph-Beth's Place; 48 = Triumph-Casita; 49 = Tsapowum Chehalis Tribal BH.
Appendix 4. Exploratory per-protocol analysis. a

| Level 1 model |
| Prob[OUTCOME(1) = 1|βj] = ϕ1ij Prob[OUTCOME(2) = 1|βj] = ϕ2ij Prob[OUTCOME(3) = 1|βj] = ϕ3ij Prob[OUTCOME(4) = 1|βj] = ϕ4ij = 1 − ϕ1ij − ϕ2ij − ϕ3ij log[ϕ1ij/ϕ4ij] = β0j(1) + β1j(1)*(PP_TIME ij ) + β2j(1)*(ETHID ij ) + β3j(1)*(GENDID ij ) + β4j(1)*(RACEID1 ij ) + β5j(1)*(RACEID2 ij ) log[ϕ2ij/ϕ4ij] = β0j(2) + β1j(2)*(PP_TIME ij ) + β2j(2)*(ETHID ij ) + β3j(2)*(GENDID ij ) + β4j(2)*(RACEID1 ij ) + β5j(2)*(RACEID2 ij ) log[ϕ3ij/ϕ4ij] = β0j(3) + β1j(3)*(PP_TIME ij ) + β2j(3)*(ETHID ij ) + β3j(3)*(GENDID ij ) + β4j(3)*(RACEID1 ij ) + β5j(3)*(RACEID2 ij ) |
| Level 2 model |
| β0(1) = γ00(1) + γ01(1)*(PERPROTOj) + γ02(1)*(FOCUS
j
) + u0j(1) β1(1) = γ10(1) + γ11(1)*(PERPROTOj) + γ12(1)*(FOCUS j ) + u1j(1) β2(1) = γ20(1) β3(1) = γ30(1) β4(1) = γ40(1) β5(1) = γ50(1) β0(2) = γ00(2) + γ01(2)*(PERPROTOj) + γ02(2)*(FOCUS j ) + u0j(2) β1(2) = γ10(2) + γ11(2)*(PERPROTOj) + γ12(2)*(FOCUS j ) + u1j(2) β2(2) = γ20(2) β3(2) = γ30(2) β4(2) = γ40(2) β5(2) = γ50(2) β0(3) = γ00(3) + γ01(3)*(PERPROTOj) + γ02(3)*(FOCUS j ) + u0j(3) β1(3) = γ10(3) + γ11(3)*(PERPROTOj) + γ12(3)*(FOCUS j ) + u1j(3) β2(3) = γ20(3) β3(3) = γ30(3) β4(3) = γ40(3) β5(3) = γ50(3) |
In the per-protocol model: Outcome(1) is both addiction and psychotropic medications; Outcome(2) is psychotropic medications only; Outcome(3) is addiction medication only; and Outcome(4) is no medication. The FOCUS variable is comparing agencies licensed as addiction and mental health to those agencies licensed as addiction only. The ETHID variable compares patients identifying as Hispanic to those patients who identified as Non-Hispanic. GENDID compares RACEID variable provides a comparison of Non-White to Caucasian patients or other race patients to patients who identify as Caucasian.
Appendix 5. Participating agency level characteristics.
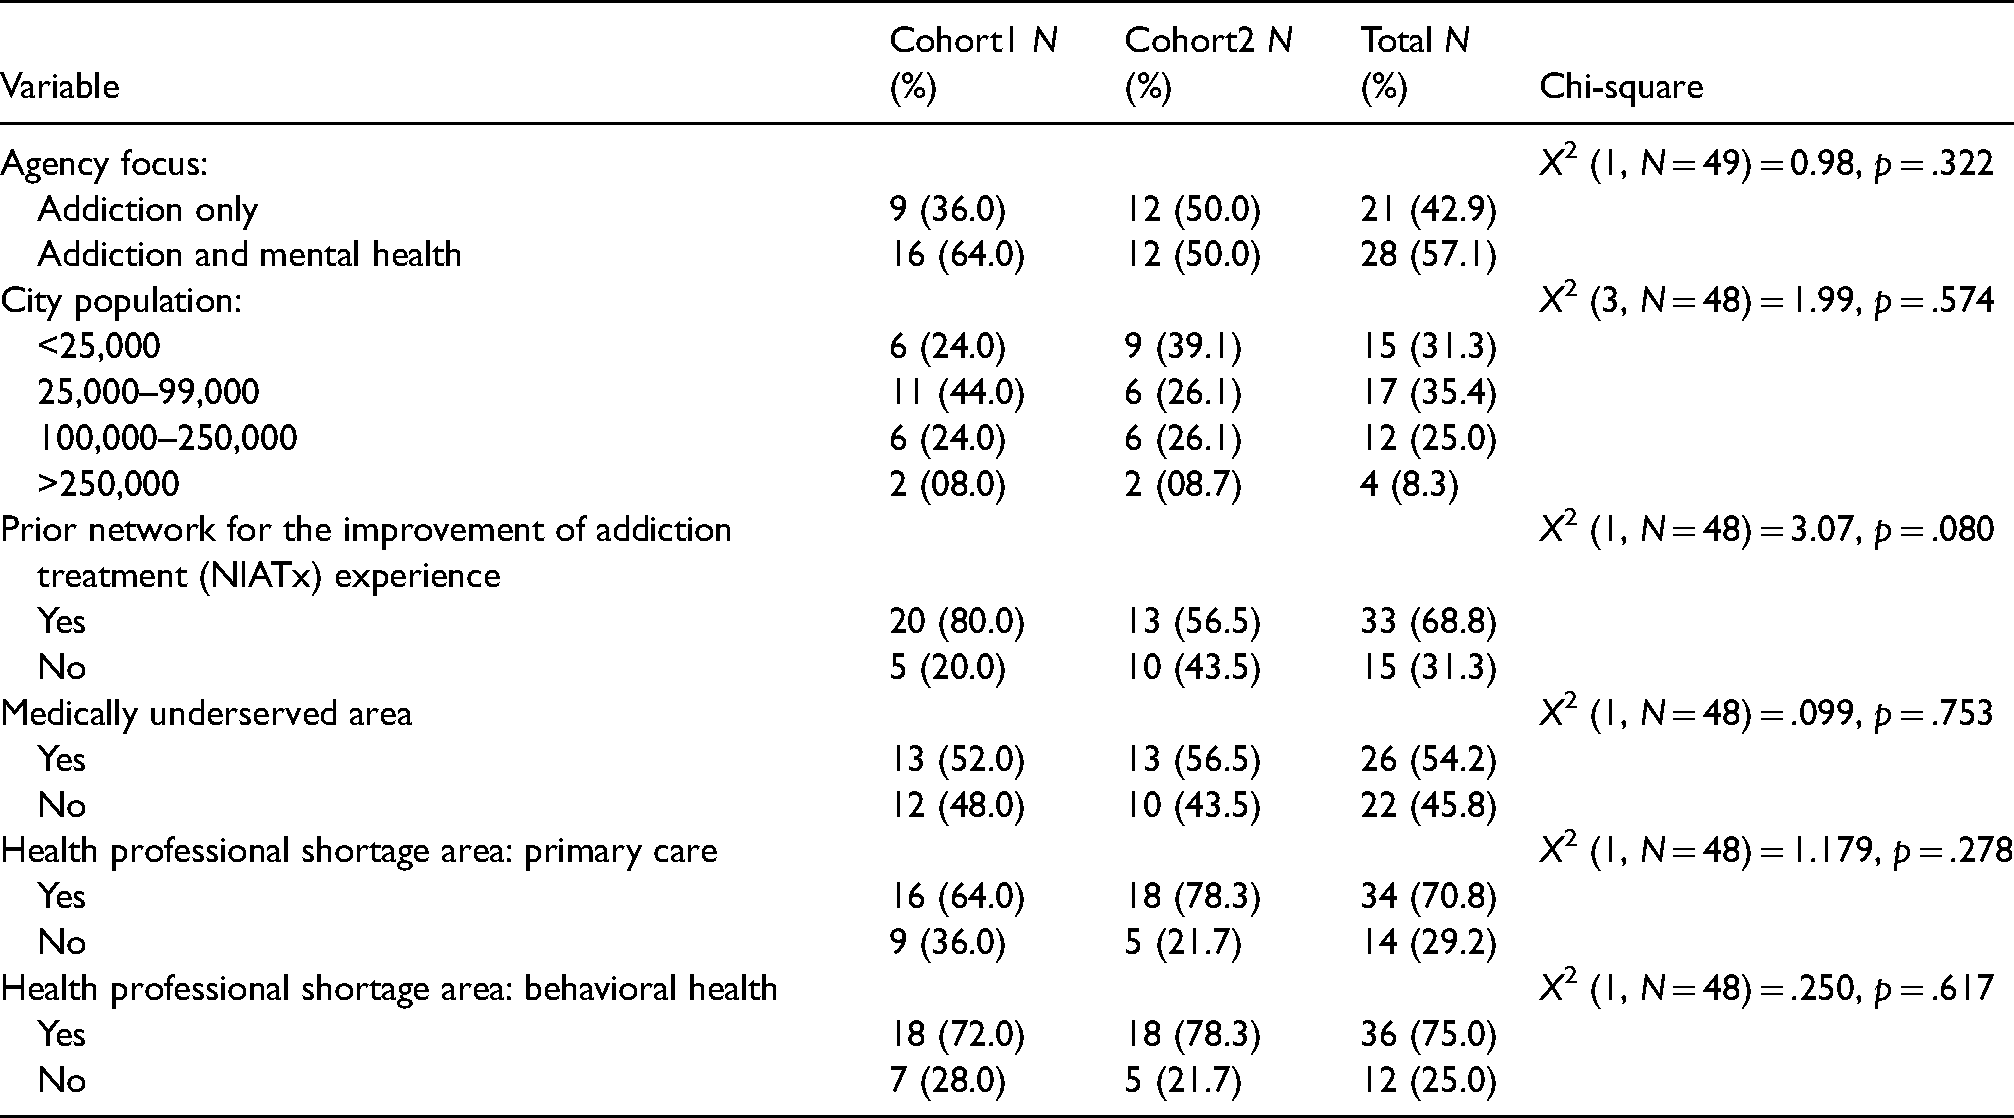
| Variable | Cohort1 N (%) | Cohort2 N (%) | Total N (%) | Chi-square |
|---|---|---|---|---|
| Agency focus: | X2 (1, N = 49) = 0.98, p = .322 | |||
| Addiction only | 9 (36.0) | 12 (50.0) | 21 (42.9) | |
| Addiction and mental health | 16 (64.0) | 12 (50.0) | 28 (57.1) | |
| City population: | X2 (3, N = 48) = 1.99, p = .574 | |||
| <25,000 | 6 (24.0) | 9 (39.1) | 15 (31.3) | |
| 25,000–99,000 | 11 (44.0) | 6 (26.1) | 17 (35.4) | |
| 100,000–250,000 | 6 (24.0) | 6 (26.1) | 12 (25.0) | |
| >250,000 | 2 (08.0) | 2 (08.7) | 4 (8.3) | |
| Prior network for the improvement of addiction treatment (NIATx) experience | X2 (1, N = 48) = 3.07, p = .080 | |||
| Yes | 20 (80.0) | 13 (56.5) | 33 (68.8) | |
| No | 5 (20.0) | 10 (43.5) | 15 (31.3) | |
| Medically underserved area | X2 (1, N = 48) = .099, p = .753 | |||
| Yes | 13 (52.0) | 13 (56.5) | 26 (54.2) | |
| No | 12 (48.0) | 10 (43.5) | 22 (45.8) | |
| Health professional shortage area: primary care | X2 (1, N = 48) = 1.179, p = .278 | |||
| Yes | 16 (64.0) | 18 (78.3) | 34 (70.8) | |
| No | 9 (36.0) | 5 (21.7) | 14 (29.2) | |
| Health professional shortage area: behavioral health | X2 (1, N = 48) = .250, p = .617 | |||
| Yes | 18 (72.0) | 18 (78.3) | 36 (75.0) | |
| No | 7 (28.0) | 5 (21.7) | 12 (25.0) |
Appendix 6. Results from exploratory per-protocol analysis. a
(Continued)

| Final estimation of variance components | |||||
|---|---|---|---|---|---|
| Random effect | Standard deviation | Variance component | df | χ2 | p-value |
| INTRCPT1(1), u0(1) | 0.917 | 0.841 | 35 | 166.279 | <0.001 |
| PP_TIME(1), u1(1) | 0.466 | 0.217 | 35 | 41.574 | 0.206 |
| INTRCPT1(2), u0(2) | 0.616 | 0.379 | 35 | 231.568 | <0.001 |
| PP_TIME(2), u1(2) | 0.144 | 0.021 | 35 | 40.069 | 0.255 |
| INTRCPT1(3), u0(3) | 1.011 | 1.022 | 35 | 94.358 | <0.001 |
| PP_TIME(3), u1(3) | 0.314 | 0.099 | 35 | 29.107 | >0.500 |
Note. The chi-square statistics reported above are based on only 38 of 40 units that had sufficient data for computation. Fixed effects and variance components are based on all the data.
In the per-protocol model, Outcome(1) is both addiction and psychotropic medications; Outcome(2) is psychotropic medications only; Outcome(3) is addiction medication only; and Outcome(4) is no medication. The FOCUS variable is comparing agencies licensed as addiction and mental health to those agencies licensed as addiction only. The ETHID variable compares patients identifying as Hispanic to those patients who identified as non-Hispanic. GENDID compares RACEID variable provides a comparison of non-White to Caucasian patients or other race patients to patients who identify as Caucasian.