
Abstract
Carbon fiber-reinforced polymer (CFRP) drilling is a typical process in the aircraft industry. Because the components of CFRP are different and uneven, it is difficult to extract tool wear characteristics from the machining signals, which are composed of the processing characteristics of various materials and the tool state characteristics. The aim of this work is to present a new comprehensive approach based on multicharacteristics and multisignal sources to predict the tool wear state during CFRP drilling through a combination of a backpropagation (BP) artificial neural network (ANN) model and an efficient automatic system depending on the sliding window algorithm. It was verified that the peak factor and Kurtosis coefficient of different signals and the energy value of the d5 layer of the thrust force signal and the d3 layer of the vibration signal after wavelet decomposition were related to tool wear. Among them, the energy value of the d3 layer of the vibration signal was selected as the wear indicator and was able to describe the state of the tool during the CFRP drilling process regardless of the drilling conditions and individual tool differences. A confirmatory drilling experiment using 6-mm-diameter polycrystalline diamond twist drilling under different processing parameters was conducted to verify the ANN model based on multicharacteristics and multisignal sources. A lower feed speed and a higher cutting speed were both highly correlated with the VB value of flank wear. Drill wear accelerated because of the occurrence of adhesive wear when the number of drilled holes reached around 90. The accuracy of the neural network model is 80–87% when using the value of only one characteristic but clearly increases based on multicharacteristics and multisignal sources in real time, indicating that the BP ANN model has higher accuracy in predicting the tool state in CFRP drilling through the sensor signal fusion method.
Introduction
Carbon fiber-reinforced polymer (CFRP) has made great progress in the aerospace and automotive fields due to its characteristics of lightweight, low pollution, and low energy consumption at the same time. In the field of aeronautics and astronautics, CFRP drilling is not only the most frequent application in the machining process but also the most economical, efficient, and widely used method in hole-making production. 1
However, due to the anisotropy, high strength, and toughness of carbon fiber, fast wear and failure of CFRP drilling tools is an important problem, which greatly affects the machining accuracy and surface roughness of workpieces. Bayraktar and Turgat 2,3 found that uncoated drills caused less delamination than TiN- and TiAN-coated high speed steels (HSS) drills, and the most effective parameter in hole delamination of composites was determined by the feed rate. Even though the minimum quantity lubrication environment cannot prevent the premature failure of drill bits during the machining of CFRP stacks, 4 it was found that the delamination factor decreases under dry drilling in some conditions. 5 In the aviation industry, dimensional tolerance and surface integrity of various workpieces are strictly required. Therefore, when the cutting tools should be replaced has become a problem requiring attention.
In recent years, many research methods have been considered to extract characteristic values from sensor signals in the cutting process for tool condition monitoring, such as finding more suitable influence factors 6 through cutting force signals, vibration signals, acoustic emission signals, and so on. Rmili et al. 7 proposed an automatic tool wear detection system based on vibration analysis. According to the particularity of acoustic emission in micromachining, Ren et al. 8 proposed a fuzzy tool state detection system based on acoustic emission. Neugebauer et al. 9 identified the machining position of the tool in drilling CFRP through acoustic emission signals to achieve a better machining effect. To study the machining mechanism of CFRP, Möhring et al. 10 considered various machining defects that may occur in actual operation, observed the acoustic emission spectrum, and discussed the influence of different drilling mechanisms on chips. In these studies, only a single sensor provides a single signal source without considering the influence of other characteristic values on the whole processing.
As CFRP is a kind of nonmetallic material, its processing signals are mixed with the characteristic information of fiber breakage and epoxy resin melting, which makes it very difficult to extract information about tool wear. Therefore, very little research on the extraction and monitoring of CFRP tool wear has been carried out so far. Kim and Ramulu 11 found the relationship between the sensor signal and the characteristics of the drilled composite hole quality by analyzing the frequency from multiple signal sources. Caggiano et al. 12 monitored the tool wear of CFRP drilling by establishing an artificial neural network (ANN) model based on the special peak values of drilling force and torque found in frequency domain analysis. According to the research of Amini et al., 13 the vibration and drilling force signals have more influence than other processing parameters and signals. Wang et al. 14 found that multisignals and multifeatures can better correlate the predicted value with the actual value by analyzing the characteristic values of thrust force and vibration in microdrilling research. Jain and Lad 15 proposed a new integrated tool condition monitoring system to help improve system performance and diagnostic reliability and predict tool wear better.
In this article, a multicharacteristic and multisource backpropagation (BP) ANN model was established to predict the tool state in CFRP small hole drilling by simultaneously collecting thrust force signals and vibration signals. The characteristics of thrust force and vibration signals in the CFRP drilling process were obtained after wavelet decomposition. With the characteristic values, a BP ANN model was trained and predicted through samples of tool wear and blade breakage characteristics. The prediction accuracy can be dramatically improved by fusion of different sensor sources using evidence theory. Finally, a high-efficiency automatic detector was used to evaluate this tool state monitoring model. This research is expected to provide a theoretical method and realizable path for online tool monitoring of composite materials processing, which is not expensive for industry and can be used to monitor important stations on production lines.
Modeling method of tool wear based on BP neural network
The error BP algorithm is an important neural network model 16 proposed by Rumelhart, which has the advantages of a simple learning algorithm and high computational efficiency. As shown in Figure 1, the BP ANN is composed of three layers: an input layer, a hidden layer, and an output layer. The technical route of neural network modeling is shown in Figure 2.

BP neural network structure diagram. BP: backpropagation.

Flowchart of modeling based on BP neural network. BP: backpropagation.
The learning algorithm of the BP ANN was implemented according to the following steps:
1. The characteristic values that are sensitive to tool wear are selected as state characteristic values and put into the input layer. 17 The BP neural network model is trained by characteristic sample data under the conditions of normal, blunt, and damaged to obtain a prediction result for the tool state. The prediction state values, [ 1,0,0], [0,1,0], and [0,0,1], represent the normal, blunt, and damaged tool states.
To determine the number of hidden nodes in the hidden layer in the BP neural network model, 18 the number of nodes with the smallest error is obtained through trial and error by continuously increasing the value of the positive integer a in equation (1). The number of hidden layers is finally determined to be 13

2. Based on the regression principle, network weight, and threshold method, the characteristic value from the input layer is processed by a sigmoid function using equations (2) and (3)


Among them, wjk is the weight connecting the j’th node of the hidden layer and the k’th node of the output layer, vij is the weight connecting the i’th node of the input layer and the j’th node of the hidden layer, f(x) is a sigmoid function, and x 0 and y 0 are the thresholds of the input layer and the hidden layer, respectively.
3. When the actual state is not equal to the target state, the output error E is expanded and equation (4) is obtained. The error can be reduced by adjusting wjk and vij , where dk is the ideal output value

4. The error of each node of the output layer and hidden layer is calculated as

5. The weights and thresholds of the connection layers are updated using the errors of the nodes of the output layer and the hidden layer as follows


where N is the number of corrections. The iterations are executed m times. α and β are random vectors in the range of [0,1].
6. When the specified error limit has not been reached, the calculation starts again from step (2).
7. When the number of iterations has been completed or a specified error limit has been reached, the update is stopped.
Case study
Experimental scheme and platform
Workpiece
The CFRP (Wuxi Jiabo Composites Co., Wuxi, Jiangsu, China) with a size of 60 × 50 × 5 mm3 was formed by stacking 10 layers of unidirectional prepreg composed of AG-8 epoxy resin and T700 carbon fiber (TORAY Co., Tokyo, Japan) according to the angle sequence of [0°/−45°/45°/90°], as shown in Figure 3. The fiber angle of each layer can be reduced by choosing the fiber direction between each layer during customization, which can effectively prevent delamination of layers and ensure a good machining process. The fiber number of T700 carbon fiber is 12 K/beam with a monofilament diameter of 1–2 μm. The tensile strength of fiber is 4900 MPa and the tensile elastic modulus is 230 GPa. AG-8 epoxy resin with a density of 1.1–1.2 g/cm3 and a Poisson ratio of 0.30–0.39 were adopted, and its maximum processing temperature was 150–170°C. A polycrystalline diamond (PCD) twist drill brazed with two separated PCD inserts (Ningbo Yongzuan Co., Ningbo, Zhejiang, China) was selected, as shown in Figure 4.

CFRP workpiece. CFRP: carbon fiber-reinforced polymer.

(a, b) PCD drill bit. PCD: polycrystalline diamond.
Experimental scheme
Cutting speeds of Vc = 113, 132, 150, and 170 m/min and feed speeds of V f = 80, 90, 100, and 110 mm/min were adopted in this experiment, wherein a brand new PCD twist drill was used for continuous drilling under each group of parameters. Through-hole dry drilling 19 without coolant was adopted.
Data acquisition and experimental platform
The experiment was carried out on a FANUC ROBODRILL_α-T14iFLb vertical machining center with a maximum spindle speed of 24,000 r/min and a rated power of 11 kW. The thrust force signal was collected by a Kistler 9257B piezoelectric dynamometer (Kistler Group, Inc., Bern, Kanton Bern, Switzerland) and a Kistler 5070A charge amplifier (Kistler Group, Inc., Bern, Kanton Bern, Switzerland). The vibration signal was collected by a PCB 356A01 triaxial sensor (PCB Piezotronics, Inc., Buffalo, State of New York, USA) and recorded by an NI 9234 sound and vibration module (National Instruments Corporation, Austin, State of Texas, USA). Based on Shannon’s sampling theory, the sampling frequency of the test was chosen as 10 kHz. The original signal was denoised by a finite-impulse response low-pass filter to delete the noise signal and distinguish the tool state during processing. Figure 5 shows a diagram of the experimental and test system.
Measurement method of tool wear
Because the resin wraps around the fiber, the CFRP chips stick to the drill bit, making it hard to clean, and thus, it is difficult to measure the tool wear through changes in quality. Furthermore, the hardness of the PCD insert is significantly higher than that of the tool shank made of cemented carbide, which means the flank wear on the tool shank becomes a major wear. Therefore, the state of the cutting tool was monitored on the basis of the tool wear width (VB). After drilling of every 10 consecutive holes, a scanning electron microscope (SEM) was used to observe the surface wear and measured the average VB. The flank wear value and the wear degree classification were obtained accordingly. 20 To investigate the complex wear mechanisms and hardness difference between different parts of the drill bit in the high-speed process, 21,22 the flank wear was measured after drilling 10 consecutive holes at 1/12 and 4/12 of the diameter on both the left and the right cutting edge, as shown in Figure 6, and the calculation method was as follows

where VB
0 is the new drill bit’s total value of VB
1, VB
2,

Experimental and test system diagram.

Tool wear types for drill bit.
Extraction of characteristics
Classification of tool wear characteristics
Figure 7 showed the SEM morphology at different drilling times under the processing conditions of Vc = 132 m/min and Vf = 100 mm/min. It can be seen from Figure 7(a) and (b) that the wear of the tool shank was quite obvious because the hardness of the tool shank made of cemented carbide was significantly lower than that of the PCD insert. Cracks and fractures were often caused by stress concentration at the connection between the PCD insert and the tool shank, as shown in Figure 7(c).

Tool wear at different drilling times (conditions: Vc = 132 m/min, Vf = 100 mm/min). (a) The flank wear after 30 holes, (b) the flank wear after 80 holes, and (c) the state of the broken edge.
Using equation (11), the VB value of flank wear under various cutting parameters was obtained and the increasing trend of flank wear is shown in Figure 8. According to the calculated VB values of all drills, a VB value greater than 0.05 mm was considered to indicate the blunt state. The normal state was marked as type I and labeled as [1,0,0], the blunt state was marked as type II and labeled as [0,1,0], and the damaged state was marked as type III and labeled as [0,0,1].

Flank wear under different cutting parameters: (a) Different cutting speeds and (b) different feed speeds.
The delamination factor (F d) has been widely used to characterize the degree of damage of the workpiece at the entrance and exit during drilling of composites. It may be calculated from the ratio of the maximum diameter (D max) of the delamination zone to the drill diameter (D), as expressed by equation (12)

Figure 9 shows the drilled surface of the entrance and exit under different cutting parameters. Unlike the surface morphology of the entrance, there was certain delamination at the exit of the hole and the fiber at the bottom was torn out dramatically. This result can be explained by the fact that as the cutting speed is increased, the cutting edge action decreases as the number of passes across the same region, and the friction between the cutting edges and the board will cause temperature elevation and softening of the matrix phase, thus reducing damage. 23 –26 And it can be seen that a low feed rate was advantageous in drilling of CFRP composite to reduce delamination. It was noted that the material removal rate increased with the feed rate, which led to a greater thrust force and sped up the tool wear. It further indicated that the delamination factor had a negative correlation with Vc and had a positive correlation with Vf and the thrust force. The rationality of the VB value can also be verified through delamination factor’s change trend.

The drilled surface of the entrance and exit under different cutting parameters at hole 90.
Figure 10 shows the energy spectrum of the drill bit before and after it became blunt. The substrate was exposed, as confirmed by the increased presence of the drill bit matrix element W at both points A and B. Increases in the elements N and P, the main elements of epoxy resin, indicated that the adhesive wear occurred when the number of holes reached 90 at both points A and B. The adhesive wear increased the friction to some degree, and the rapidly increasing VB value in Figure 8 proved the influence of adhesive wear from another angle.

The energy spectrum of the flank wear drill bit surface before and after the blunt state. (a) The new drill bit and (b) the blunt drill bit.
Analysis and extraction of time-domain characteristics
Dimensionless time-domain characteristics are a commonly used feature. Within the scope of this study, they were not affected by drilling conditions and can reflect the inherent characteristics of the signal. Therefore, dimensionless time-domain feature parameters 27 can be selected to extract tool features. The peak factor, waveform factor, and Kurtosis coefficient in the time domain were selected to determine whether they had a decisive influence on the tool state. The definitions of these characteristics were given in equations (13) to (15)


where X av is the absolute average value of the signal, X peak is the peak value, X rms1 is the root mean square value of X in the time domain signal, xk is the sample value of the k’th time-domain signal, and n is the number of time-domain signals, n = 1, 2,…, n.
Figure 11 showed the relationship between the characteristic value of the signal in the time domain and the number of holes. It is known that the number of holes has a positive correlation with the tool flank wear, which is clearly reflected by the peak factor and Kurtosis coefficient in Figure 11. Therefore, these two characteristic parameters can be considered to represent the tool state.

Relationship between the characteristic value of the signal and the number of holes in the time domain (conditions: Vc = 150 m/min, Vf = 100 mm/min). (a) Thrust force signal and (b) vibration signal.
Analysis and extraction of frequency-domain characteristics
Although the time domain signal has the advantages of intuition and accuracy after filtering the influence of environment and other factors on the original signal, it cannot solve the influence of processing parameters, such as cutting speed, feed speed, and depth of cut, on the original signal. Thus, further frequency domain analysis of the thrust force and vibration signal was necessary.
The DB10 wavelet basis function was selected to decompose the original signal into multiple layers. Because the characteristics of a7 layer were the closest to the original signal, the number of decomposition layers was set at 7. The frequency used in wavelet decomposition must be halved, and then, the corresponding frequency distribution ranges of a7, d7, d6, d5, d4, d3, d2, and d1 were (0–39.0625 Hz), (39.0625–78.125 Hz), (78.125–156.25 Hz), (156.25–312.5 Hz), (312.5–625 Hz), (625–1250 Hz), (1250–2500 Hz), and (2500–5000 Hz), as shown in Figure 12.
As an expression of the average energy of the signal,
28
the wear state of the tool can also be identified by monitoring the changes of the

where xi is the amplitude of the i’th original frequency domain signal and n is the number of signals, n = 1, 2,…, n.

Wavelet decomposition of the original force signal (conditions: Vc = 150 m/min, Vf = 100 mm/min).
Wavelet decomposition was carried out on force signals and vibration signals for the normal, blunt, and damaged states, respectively. Figure 13 shows the relationship between

where xi, j is the discrete point values, r is the number of sampling points, and i is the number of decomposition layers. Figure 14 shows the relationship between the decomposition layers and energy values. Due to the increase of tool wear and microcrack propagation, the internal crystal of the drill was seriously damaged, and the potential energy release was enhanced, which revealed the obvious energy difference before and after the blunt state. It can be seen that the difference between normal state and abnormal state (blunt and damaged) of the d5 layer in Figure 14(a) and the d3 layer in Figure 14(b) is the most significant, indicating that these two layers were the most sensitive to abnormal state.

Relationship between root mean square and decomposition layer under different tool conditions (conditions: Vc = 150 m/min, Vf = 100 mm/min). (a) Thrust force signal and (b) vibration signal.

Relationship between energy and decomposition layer under different tool conditions (conditions: Vc = 150 m/min, Vf = 100 mm/min). (a) Thrust force signal and (b) vibration signal.
Prediction of tool state
Prediction of tool state based on thrust force signals
Twenty-five groups of data samples (10 groups of normal state samples, 10 groups of blunt state, and 5 groups of damaged state) were used for training the network 1000 times with a minimum error of 0.001. The variance approximation curve of the learning process after training is shown in Figure 15. It can be seen that the BP network reached the error limit value after only 11 iterations, which indicated that the training effect was ideal.

BP network signal training process based on thrust force signal. BP: backpropagation.
After the network training, the prediction state was predicted by inputting actual experimental data. The prediction results of tool wear state based on thrust force can be seen in Table 1. Only the results of groups 3 and 14 deviated from the actual state, while the other output values were relatively close to the actual state. The tool wear state was predicted with an accuracy of 87%.
The thrust force signal prediction results.
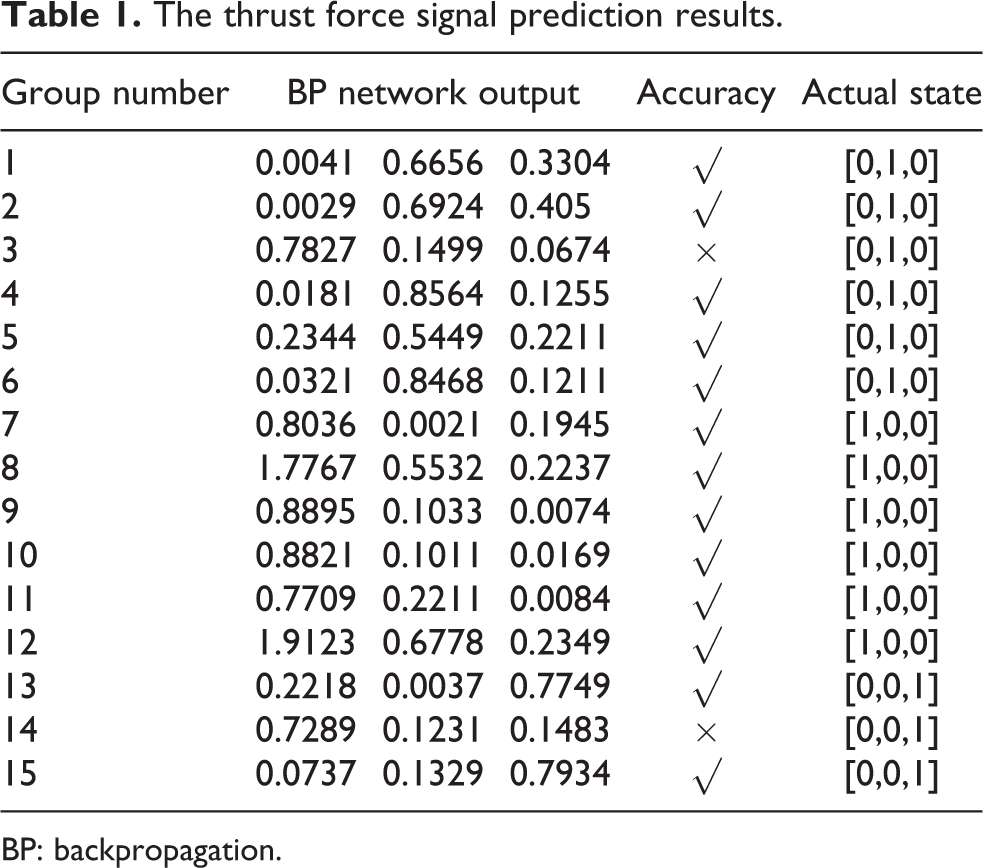
BP: backpropagation.
Prediction of tool state based on vibration signals
With the same method mentioned above, the sample data of the vibration signal were trained by the neural network and the learning process variance approximation curve was obtained, as shown in Figure 16. The training times of vibration signals were greater than those of thrust force signals, which indicated the need for fusion of different sensor signals in different scales to improve the accuracy. After obtaining the training results, the neural network model was used to predict the state of the tool. Table 2 lists the prediction results of tool wear state based on the vibration signal. The accuracy of the prediction result was 80% based on the vibration signal. The prediction accuracy was obviously different based on different sensors.

BP network signal training process based on vibration signal. BP: backpropagation.
The vibration signal prediction results.

BP: backpropagation.
Multifeature and multisensor fusion
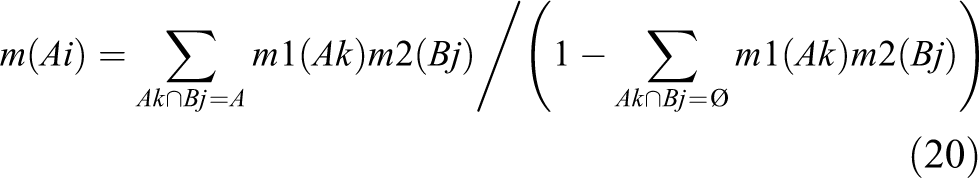
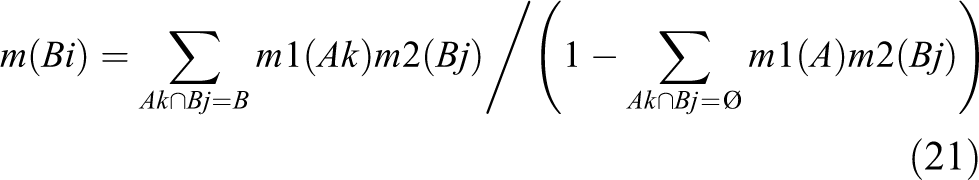
To reduce the difference between different sensors, it is necessary to fuse the prediction results of different sensors to improve the prediction accuracy and stability. Evidence theory was used to fuse the signals of thrust force and vibration. The basic trust allocation 29 was established by predicting the failure samples in the previous results, where


Here, m 1(Ai ) represents the prediction result of the normalized thrust force signal sample at the i’th node; m 2(Bi ) is the prediction result of the normalized vibration signal sample at the i’th node; y(Ai ) and y(Bi ) are the i’th node of thrust force and vibration in the network output layer, respectively, i = 1, 2, 3. Combining equation (18) with equation (19) gives
Using the above fusion method, the samples that were incorrectly predicted by the single sensor signal are repredicted in Table 3.
Reprediction results obtained by fusion of signals of thrust force and vibration.

Finally, the comparison of different model results is summarized in Table 4. The prediction accuracy of the fused data from the multicharacteristics and multisignal sources was higher than that of any previous single sensor. Therefore, the BP neural network model based on multicharacteristics and multisignal sources can effectively predict the tool wear and the blunt and damaged states in the CFRP drilling process.
Comparison of different models.

BP: backpropagation.
Model verification by automatic detector
Automatic detector principle
According to the above analysis, the tool state can be detected and predicted using the collected characteristic values with consideration of different processing parameters. However, the prediction accuracy decreased when single vibration data of different processing parameters were input into the ANN prediction model above. It is necessary to reduce the influence of processing parameters on the accuracy of the prediction model. Therefore, a wear indicator was proposed to detect the change tendency of the vibration signal’s energy value of the d3 layer.
The energy values of the d3 layer of the vibration signal collected in 16 groups of process parameters of this article were selected for temporal signal processing based on equation (22). The value “1” corresponds to the presence of possible transitions noted in the tool lifespan, and the value “0” indicates that no changes have been detected. Based on the sliding window algorithm, 30 the energy value of the vibration signals is input into the sliding window algorithm and then divided into sections to compare the energy values with each other to find out the abnormal change

where I is the wear indicator, Ne is the number of samples when the analyzed signal is stable, λ is the parameter indicating the sliding window, and

The flowchart of the automatic detection.
Verification of the wear indicator
Influence of individual tool differences on automatic detection
To make a general assessment of tool wear, the sensitivity of individual tool differences to characteristic values was first verified. Three drills (labeled A, B, and C) of the same specification were investigated in the same experiment, as shown in Figures 18 and 19. No matter which drill was adopted, it represented a clear tendency of accelerated wear when 45 holes had been drilled. Therefore, the tool manufacturing error has little influence on the wear indicator. After around 90 holes had been drilled, the energy value of the d3 layer suddenly changed dramatically. Figure 19 shows the high correlation between the energy value of the d3 layer of the vibration signal and the VB value of flank wear. Hence, the energy value of the d3 layer of the vibration signal can be defined as the wear indicator, since it can detect a small amount of wear before the blunt state is reached.

Relationship between energy value of the d3 layer of the vibration signal and number of holes (conditions: Vc = 132 m/min, Vf = 100 mm/min).
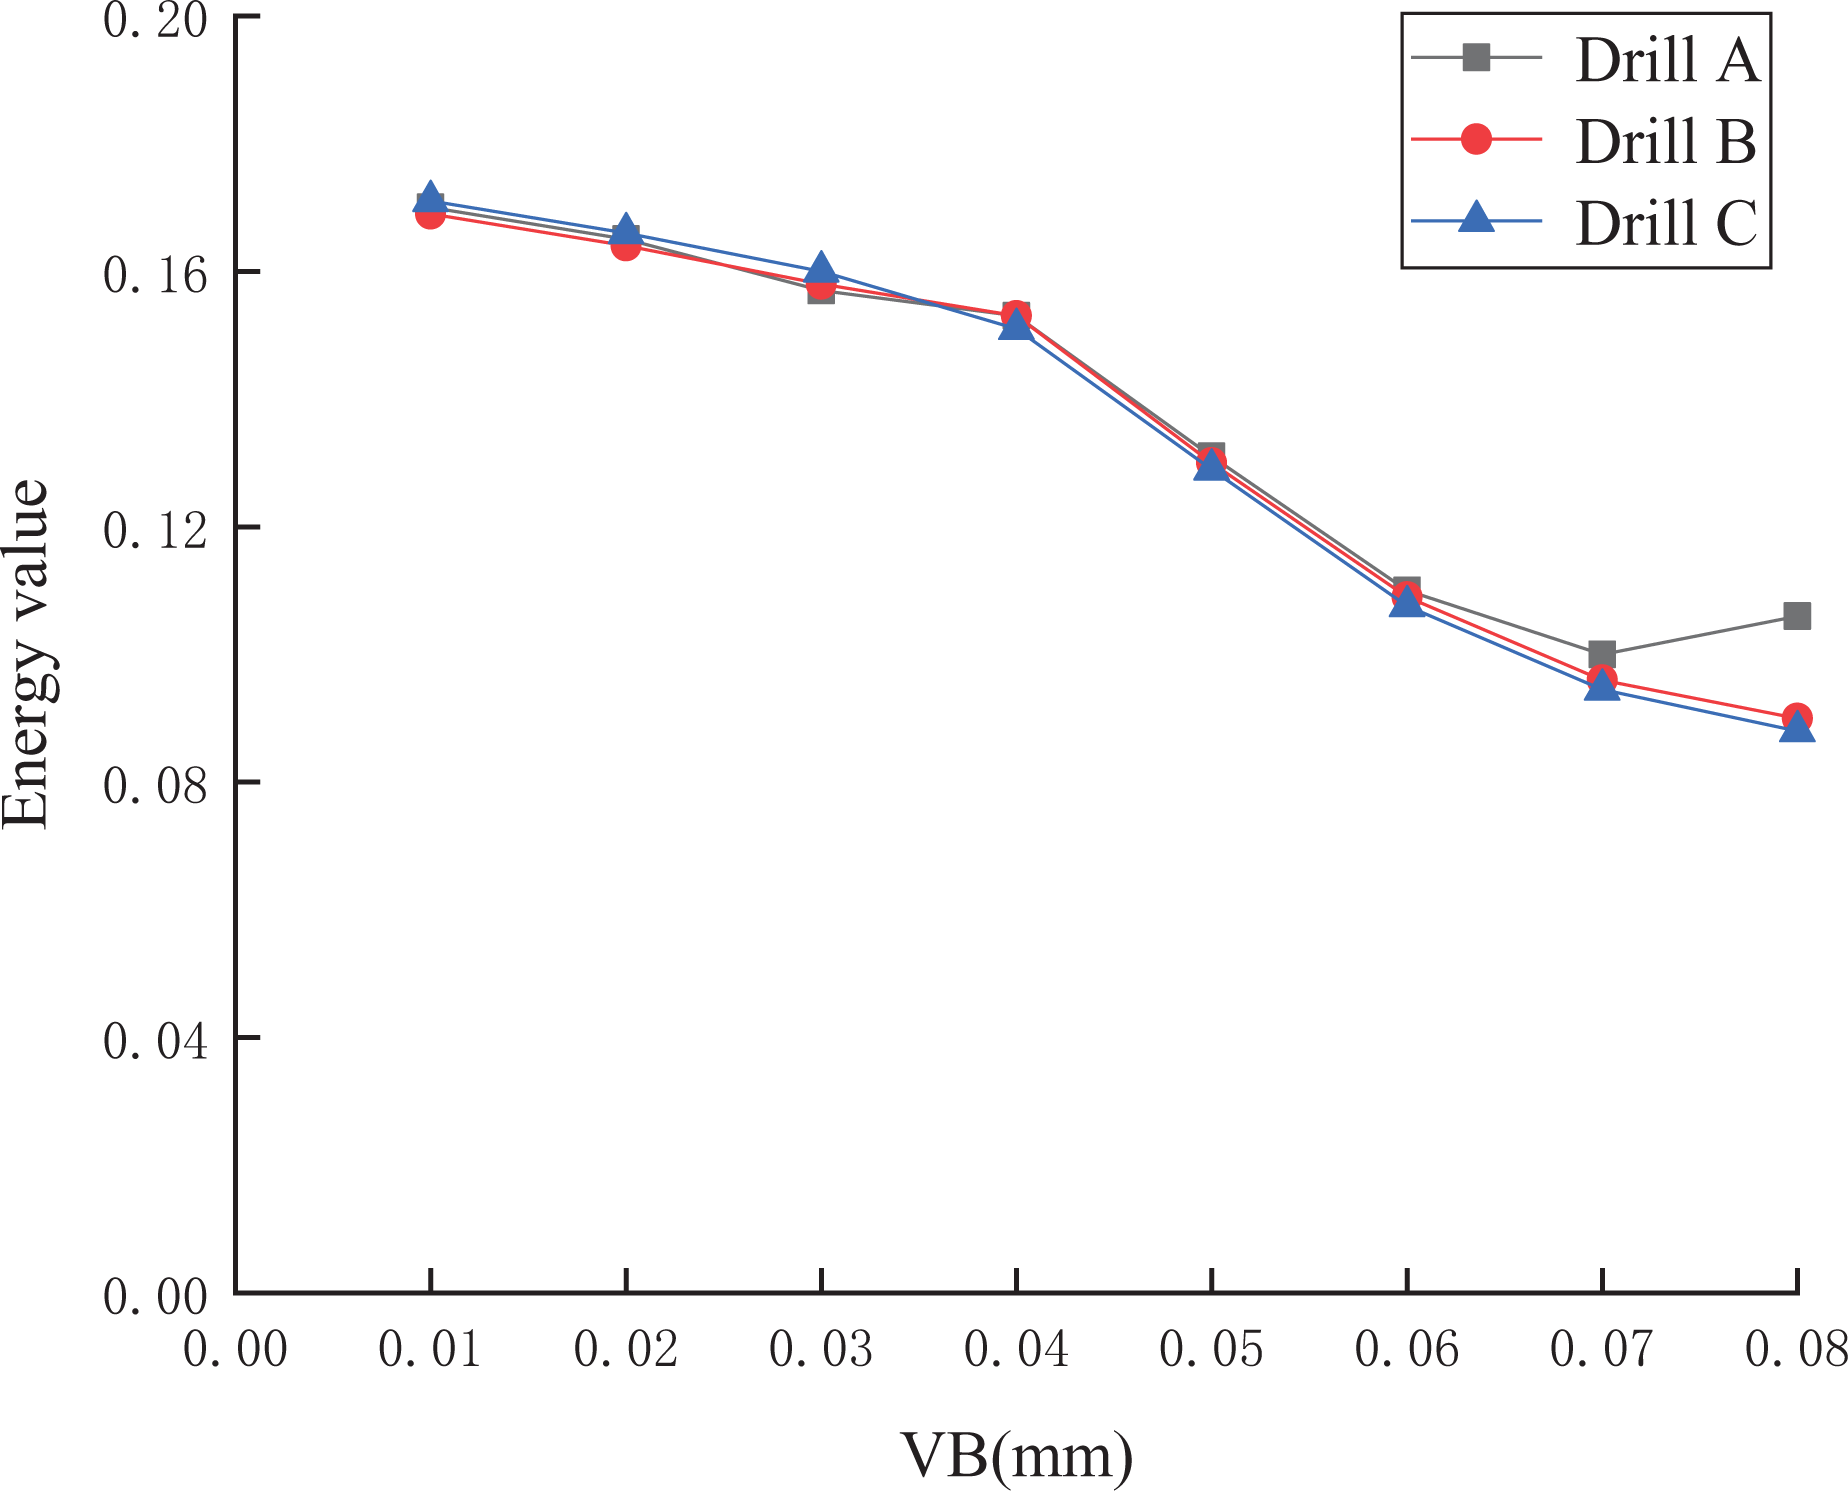
Relationship between energy value of the d3 layer of the vibration signal and flank wear (conditions: Vc = 132 m/min, Vf = 100 mm/min).
Influence of processing parameters on automatic detection
Secondly, to avoid the influence of different processing parameters, the unused 15 sets of different processing parameters in this article were tested by the automatic detector. Figure 20 shows the relationship between the energy value of the d3 layer of the vibration signal and the flank wear under two randomly selected parameters. The transition from stable wear to accelerated wear before the blunt state was obviously free from the influence of processing parameters. The results indicated that the energy value of the d3 layer of the vibration signal was an effective indicator for monitoring the change of the wear during the CFRP drilling process regardless of the processing parameters.

(a, b) The relationship between the energy value of the d3 layer of the vibration signal and the number of holes.
Verification of automatic detector
With the application of the automatic detector, data from all the experiments were used to verify the effectiveness of the automatic detector. Figure 21 shows the wear state identification by automatic detector, which displays the effective sensitivity to tool wear and can automatically predict the accelerated wear state before the blunt state, in spite of individual differences in the drill bit and different processing parameters.

(a–d) Wear state identified under various processing conditions.
From the above discussion, we could verify that the BP neural network for the prediction of tool wear from multicharacteristics, multisource sensors, and the wear indicator can find the tool wear moment accurately.
Conclusion
A BP ANN model based on multicharacteristics and multisources was built to predict the normal, blunt, and damaged tool states after extracting characteristic values reflecting the tool states during machining of composite materials. An experiment was conducted with various processing parameters to train and predict the tool state of CFRP small hole drilling by simultaneously collecting the thrust force signals and vibration signals. The main results were as follows: Five types of characteristic values (time-domain of peak factor and Kurtosis coefficient, the energy value of the d5 layer of the thrust force signal, and the d3 layer of the vibration signal after wavelet decomposition) were extracted to reflect the tool states during machining. A BP ANN model was established to train and predict the normal, blunt, and damaged tool states. There was certain delamination at the exit of the hole and the fiber at the bottom was torn out dramatically. Either a lower feed speed or a higher cutting speed could effectively reduce the delamination factor, which was highly correlated to the VB value of flank wear. The wear of the drill accelerated because of the occurrence of adhesive wear when the number of drilled holes reached around 90. The accuracy of single sensor source training and prediction varied among different sensor sources: the prediction accuracy based on thrust force was 87% and had faster convergence, whereas the accuracy of the prediction result was 80% based on the vibration signal. Two sources of prediction results from thrust force and vibration were fused by evidence theory. Compared with the prediction accuracy based on force signal and vibration signal alone, the final fusion result showed that the prediction accuracy of sensor fusion data using multicharacteristics and multisignal sources was improved by 13% and 20%, respectively. By setting up an automatic detector, the energy value of the d3 layer of the vibration signal was set as a wear indicator for sensitively detecting a small amount of wear before the blunt state was reached, in spite of individual differences in the drill bit and different processing parameters. The BP neural network model based on multicharacteristics, multisignal sources, and the wear indicator can effectively predict the normal, blunt, and damaged tool states in the CFRP drilling process.
Footnotes
Declaration of conflicting interests
The author(s) declared no potential conflicts of interest with respect to the research, authorship and/or publication of this article.
Funding
The author(s) disclosed receipt of the following financial support for the research, authorship, and/or publication of this article: This study was supported by the National Nature Science Foundation of China [Nos 51965004 and 51565005] and the Guangxi Key Laboratory of Processing for Non-Ferrous Metal and Featured Materials [Grant No. 2019GXYSOF02].