
Abstract
Structural optimization models often feature many uncertain factors, which can be handled by robust optimization. This work presents a complete robust optimization program for composite blade based on the kriging approximation model. Two case studies were given and performed using a genetic algorithm. The first being typical optimization, where the first natural frequency of the blade is selected as the optimized objective and the optimal sizing distribution for the entire blade shell is sought to ignore the uncertain factors. The other case determines the standard deviation of the optimized objective in the first case as another optimization goal. Moreover, a 6σ robustness for the optimization results of the two cases was evaluated. The result shows that typical optimization increases the first natural frequency of the blade by 19%, while its robustness level has a reduction of 61% compared with the first blade. Nevertheless, the robust optimization not only results in an increment of 15.4% in the first natural frequency of the blade but also increases its robustness level by up to 90%. Therefore, the proposed approach can effectively improve optimization objectives, especially reduce the impacts of uncertainties on the objective functions.
Introduction
The large horizontal-axis wind turbine (HAWT) blade, one of the most critical components of the wind power system, is characterized by slender shape, composite structure, and flexible body. Its long blade span, limited capacity to control blade tip deflection for ensuring a safe distance between tip and tower, along with the trend of individual wind turbine capacity increasing year by year, all suggest that it requires a higher stiffness than other small and medium blades. 1– 4 For these HAWTs, studies have found that the blade weight grows with a rotor radius at R 2.3 while the rotor power grows with R 2.1. 5 Future larger wind turbines for higher power extraction capabilities require increasing blade stiffness to accommodate the significantly increased blade weight as the rotor radius grows. In addition to improvements in the design and manufacture process, blade structure optimization can be an effective method to increase the blade stiffness. Here, we reviewed the current literatures on the structure design and optimization of the composite blade. 6– 8
Several authors have explored some specific issues of the structural optimization of the composite blades. In work by Anderson et al., 9 a high-fidelity multidisciplinary optimization capability is employed for the structural optimization of wind turbine blades. The optimal fiber angles distribution throughout the internal structure of the blade were sought to minimize a stress parameter for each of several load cases. The result showed that the driving stress for fatigue has a reduction of 18–60% after optimization. Barr and Jaworski 10 explored the concept of passive aeroelastic tailoring to maximize the power extraction of an NREL 5 MW wind turbine blade and presented a variable-angle tow composite materials model along blade span to couple the bend-twist deformations under aerodynamic load. The resulting computational formulation predicted an increase of 14% in turbine power extraction when the optimization is performed around the cut-in wind speed, and by 7% when the blade is optimized near the rated wind speed. Albanesi et al. 11 presented a metamodel-based method, combining a genetic algorithm with an artificial neural network, to optimize the composite laminate layout of wind turbine blades. An actual case investigation showed that laminated weight could be saved up to 20% compared to the reference design. Fagan et al. 12 completed the structural optimization of the wind turbine blade using the multi-objective genetic algorithm and a finite element model. A candidate blade design was manufactured and tested for some structural characteristics, including mass, the center of gravity, deflections, strains, and natural frequencies. Almeida et al. 13 presented a methodology to perform cross-section evolutionary optimization for a topologically optimized structure using a genetic algorithm. The structure with both topology and cross-section optimization accomplished a specific stiffness 330% higher than the structure of the quasi-isotropic stacking sequence. Buckney et al. 14 utilized the topology optimization to find optimal structural configurations for a 3-MW wind turbine blade and saved weight by up to 13.8% compared to a conventional design. Generally speaking, there are two different approaches to achieve structural optimization of the blade: the first approach is the optimization in spanwise material distribution, the selection of materials, size of parts such as spar flange and shear webs through the knowledge of typical blade build-up and constraint 9–12 ; the other is topology optimization, which seeks the optimal material distribution. 13,14 Here the authors’ focus will be the first approach. Most of the published literature demonstrated that the simulation predictions for strains, natural frequencies, and mass are a good agreement with the test results. In the study by Albanesi et al., 15 the authors propounded a novel method simultaneously to optimize the ply-order, ply-number, and ply-drop configuration using simulation-based optimization. As an actual application, they redesigned the composite layout of a 40-kW wind turbine blade and demonstrated a reduction in weight by up to 15% compared to the existing layout. These researchers have made outstanding contributions to the structural optimization of blade by redesigning its laminate configuration. However, they all neglected a critical issue that the blade structural parameters are not constants in the actual engineering application, but fluctuate up and down based on the design values, and this phenomenon reflects the blade robustness. In the case where the blade performance metrics are too sensitive to the design parameters or their robustness is relatively weak, a slight fluctuation in design parameters may lead to a significant drop in the blade performance metrics. 16– 19 This selection of an appropriate optimization algorithm is challenging for composite structural design problem that contains plenty of variables.
This work aims to develop a new method to improve the robustness of blade performance metrics and structural parameters based on a kriging model. This methodology combines the general optimization with robust optimization organically. Therefore, general optimization is first implemented to improve the blade performance, 20 and then, the optimal results and its robustness level are analyzed comprehensively. The evaluation results test whether robust optimization is necessary. If the evaluation results showed that the robustness of the overall optimization results does not satisfy the requirements, the robust optimization would be performed eventually.
The kriging approximation model using experimental design
The kriging approximation model is an unbiased estimation model with the smallest estimated variance. 21 It can describe not only high nonlinear processes but also smooth target effects, remove numerical noise, and significantly improve optimization efficiency. The model can provide an accurate interpolation. Its fundamental theory can be briefly described as follows.
The model is superposed by a global model and local deviations, as shown in the following equation:

where Y (x) is an unknown approximation model, f (x) denotes a known polynomial function, and Z (x) represents a stochastic process with a mean of zero, a variance of σ 2, and a covariance of zero. f (x) provides a global approximation model of the design space, while Z (x) creates a local bias based on the global model. The covariance matrix of Z (x) can be expressed as the following equation:

where R denotes the correlation matrix and R (xi , xj ) is the correlation function of sample points xi and xj . The correlation function has different forms. The Gaussian correlation function has been selected to study, which is defined as the following equation:

where ndv is the number of design variables and θk denotes an unknown related parameter. Once the correlation function is determined, the response estimate for any test point x can be calculated by the following equation:
where y is the column vector of length ns
(sampling points). r
T (x) denotes the correlation vector of length ns
between test point x and sample points {x
1
, x
2
,…,

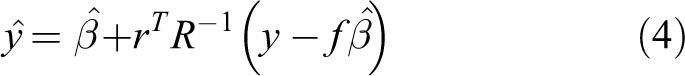
β in equation (4) is estimated by the following equation:

The variance estimate of the global model is obtained by the following equation:

The nonlinear unconstrained optimization problem is shown in equation (8), which can be solved by the maximum likelihood estimation approach to get the correlation parameter θ.

When θk is calculated, the correlation vector r T (x) between the unknown point x and the known sample data can be got from equation (5), and the response value can be obtained by equation (4). In the construction of the kriging model, the choice of test points has a direct impact on the accuracy of the constructed model. In this investigation, the kriging model is constructed by using the optimal Latin square test design method, which has the advantages of dispersing the test design points in the design space and representing as much information as possible with as few test design points as possible.
Formulation of the optimization problem
General optimization: Case 1
Optimization design
The blade modal characteristics, including the modal frequency and modal mode, are the important factors affecting the blade vibration and noise. Since the blade modal characteristics are the global characteristic of the blade, the first modal frequency is selected as the optimal target. Equation (9) is the general optimization objective function:

where f 1 denotes the first-order modal frequency of the blade.
In the present work, due to the complex lay-up schedule of the analyzed rotor blade (up to 100 layers in some crowded places), the optimal design is seriously challenging to complete if each layer thickness of each section is used as a layer design variable. Therefore, the basic unit of the blade laminate has been selected as the optimal design variable, namely the thickness of the uniaxial fiberglass (x 1), the thickness of the biaxial fiberglass (x 2), the thickness of the triaxial fiberglass (x 3), the single-layer thickness of the balsa wood (x 4), and the single-layer thickness of the reinforcing material (x 5). Besides, the width of the spar cap (x 6) is also selected as a design variable, and design variables and existing values are presented in Table 1. 22
Design variables and existing values.

Different types of composite materials are adopted for the blade construction to achieve better mechanical properties of the blade. Because of the complex loading on the blade, it must satisfy the strength requirements in the optimization process. It is inappropriate to utilize the maximum stress as the strength constraint because mechanical properties vary in different directions of material. Therefore, the Tsai–Wu failure criterion as shown in equation (10) could be applied to check composite structure.

Besides, another constraint is that the blade weight does not increase compared to the first blade’s during the optimization process, as shown in the following equation:

where m 0 is the actual blade weight.
Adaptive single-objective, integrated into design exploration, combines the optimal space-filling (OSF) sampling method, kriging response surface, and mixed-integer sequential quadratic programming (MISQP) algorithm with computational domain reduction technique. 23 The OSF sampling method, optimized a version of Latin hypercube sampling, has a better space-filling ability and is more suitable for generating particularly complex response surfaces. The MISQP algorithm can process both continuous and discrete input parameters for optimization of the individual output parameters.
Optimization results
According to the optimization design scheme in “Optimization design” section, the kriging approximation model is established using 60 samples, generated by the OSF sampling method. During the optimization process, the maximum number of iterations and the convergence tolerance are set to 120 and 1 × 10⁻⁶, and finally, three candidate solutions satisfy the strength criterion and the quality constraint are generated. The general optimization iteration result of the 1.5 MW wind turbine blade is shown in Figure 1. It revealed that the frequency response value has gradually converged when the iteration step reaches 40 and the optimization effect is remarkable.

The iterative process of the optimal design scheme.
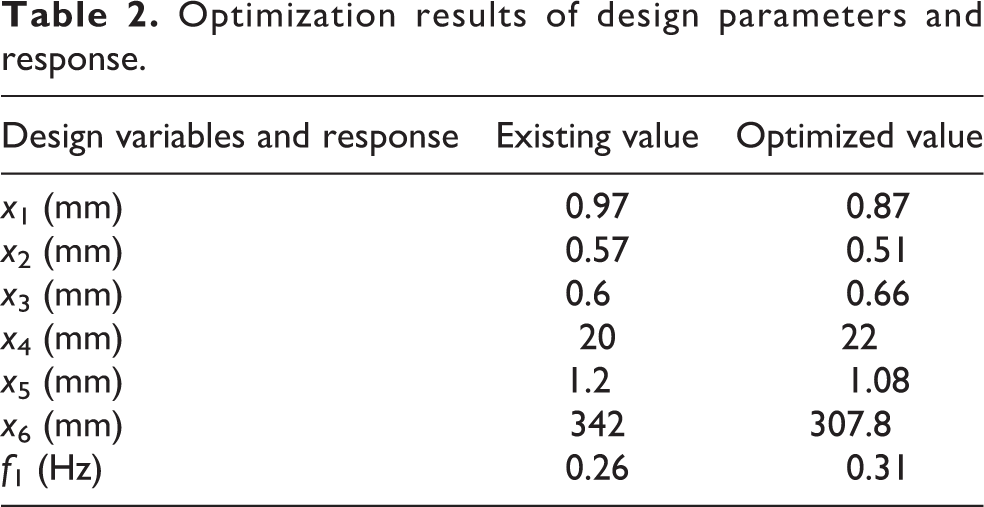
Taking the manufacturing and processing of composite laminates into account, all optimized parameters are rounded off and listed in Table 2. The blade first-order natural frequencies are 0.26 Hz and 0.31 Hz, respectively, for the first and optimized blade. Results in Table 3 turn out that the blade first-order natural frequency is improved (about 19%) after general optimization. Except for the slight increase of the thickness of balsa wood and triaxial glass, other materials’ thickness and the width of the spar cap are decreased, which ensures that the weight of the optimized blade is not more massive than the first blade’s. Although the thickness of balsa wood increases slightly, its density is much smaller than other materials. Therefore, the optimized blade can satisfy the constraints required by equation (11).
Optimization results of design parameters and response.
Accuracy test for the kriging model.

RAE: relative average error.
The 6σ robustness analysis results of the first-order natural frequency for the initial and optimized blades are summarized in Figure 2. As can be seen clearly from Figure 2, the 6σ level of the first-order natural frequency for the initial and optimized blades is 3.1615σ and 1.23333σ, respectively. The robustness of the first-order natural frequency is relatively low for both blades. Further analysis showed that the first-order natural frequency robustness of the optimized blade is significantly lower than the first blade. It is evident that the optimization of blade structure parameters does not ensure that the blade robustness obtains a remarkable improvement without considering the parameter value fluctuation. Hence, blade modal frequencies and robustness must both be regarded as optimization targets for the comprehensive improvement of blade performance.

6σ robust analysis for both blades of initial design and case 1.
Robust optimization: Case 2
Taking the 1.5 MW wind turbine blade as an example, the proposed kriging model and the robust optimization method are validated. 24 The entire optimization process based on the kriging model is shown in Figure 3. The kriging approximation model is constructed by the optimized space-filling test method, which has the better space-filling ability and is more suitable for generating complex response surfaces than the Latin hypercube test method.

Optimization process based on the kriging model.
The premise of robust optimization is to calculate the mean and variance of the response values. The commonly used methods are matrix method, analytical method, and Monte Carlo simulation method. The characters of Monte Carlo simulation are simple and fast, its extremely few mathematical calculations and computer dependence, both suggest that the Monte Carlo simulation method is an effective method for evaluating the probability characteristics. Therefore, the Monte Carlo simulation method was selected for this work. First, the experiment is designed according to the optimized space-filling experiment design method, and the relevant sample point data are calculated and extracted by the finite element method. Then, a kriging response surface model is built using these sample point data. Finally, the robust optimization of the blade structure is performed based on the kriging approximation model.
Robust optimal design based on Monte Carlo simulation technology
The blade is composed of a multilayer material, and the thickness of each layer has a certain fluctuation based on the design value. Therefore, to fully consider the impact of design variable fluctuations, the 6σ robust optimization method described in “Robust optimization: Case 2” section is applied to the blade structure optimization. For a typical robust optimization, the mathematical model is determined in the following equation:

where x is the design variable, j denotes the number of constraint functions, and xU and xL are the upper and lower limits of the design variations. In this mathematical model, the objective function F can be written as follows:

where w 1i and w 2i denote weights, R 1i and R 2i are scale factors, and m is the number of responses. The principle of selecting positive and negative signs in the formula is as follows: a positive sign means minimizing the response average and a negative one is an inverse.
Monte Carlo simulation technology is recognized as the most accurate method to evaluate probability characteristics, and the mean μ and variance σ 2 in the above robust optimization design Equation (12) need to be solved by this technique. In the first step, the random variable value and the design variable value are obtained by sampling, and the next step is to substitute the variable value into the kriging model to obtain a Monte Carlo distribution cloud map of the response. Finally, the mean μ and variance σ 2 can be calculated from the Monte Carlo distribution map.
Robust optimization design of wind turbine blade
As the general optimization scheme, the single-layer thickness of each layer material and the first-order natural frequency of the blade are determined as experimental parameters and evaluation indexes of robust optimization, respectively. First, 200 design points were generated using the optimized space-filling experiment method. Then, the kriging model between design variables and optimization goals is established by these design points. The determination coefficient R 2 and relative average error (RAE) are used to evaluate the fitting accuracy of the kriging response surface model. As given in Table 3, the larger R 2 or the smaller RAE, the higher the accuracy of the response surface, and vice versa. As can be seen from Table 3, the R 2 and RAE values of the established kriging response surface model are 97.6% and 2.2%, respectively. It can be seen that the kriging model has sufficient accuracy to perform subsequent robust optimization of the blade.
Referring to equations (12) and (13), the corresponding mathematical model of 6σ robust optimization for a blade is defined as follows:

where xil and xiu represent lower and upper limits of design variables, and xi is design variables.
Robust optimization results
6σ robust optimization significantly reduces the response fluctuation of the objective function and improves the 6σ level of the response distribution. The results contrast of general and 6σ robust optimization is presented in Table 4. As given in Table 4, general optimization increases the frequency value by 19% and has a relatively low 6σ level (only 1.23σ). The preliminary analysis results obtained from the 6σ robust optimization is that the robust optimization reduces the frequency of 0.01 Hz than general optimization. However, the 6σ level of the frequency response and design variables are improved. The results in this chapter indicate that the robustness of almost all parameters has reached or exceeded the 6σ level after robust optimization, the next chapter, therefore, moves on to discuss the sensitivity of design variables and frequency response.
General and robust optimization results.

Results and discussion
Modal sensitivity analysis of design variables
The sensitivity of a structural parameter is an indicator of whether the parameter has a significant impact on structural performance. The higher the sensitivity of the structural parameters, the worse the robustness of the structural performance, and vice versa. The modal sensitivity of the blade is the rate of change of its natural frequency to its structural parameters, which can be obtained by solving the first derivative of the blade free vibration differential equation for design variables. The modal sensitivity results of design variables from the blades of the initial design, case 1, and case 2 are shown in Figure 4. The label values from 1 to 6 along the x-axis represent the single-layer thickness of the unidirectional glass, biaxial glass, triaxial glass, balsa, reinforcing material, and width of spar cap, respectively. The label values on the y-axis denote the numerical results of the modal sensitivity of the design variables selected in this study. The data from this figure is another essential illustration of the conclusions obtained by the 6σ robustness analysis for the optimized solutions in case 1 and case 2. The single most striking observation to emerge from the data comparison was the modal sensitivity of the third design variable (single-layer thickness of the triaxial glass) for first blade and blades in case 1 and case 2. The modal sensitivity values for case 1 and case 2 has a reduction by up to 39% and 83% compared to the first blade, respectively. Therefore, the optimal results from robust optimization (case 2) show lower sensitivity of the design variables and stronger robustness of the objective function than the optimal result from typical optimization (case 1).

Modal sensitivity of design variables in initial design, case 1 and case 2.
Sensitivity analysis of natural frequency response of the blade
As described in “Robust optimization: Case 2” section, one of the purposes of robust optimization is to minimize the fluctuation of the objective function when the design variable changes with a specified distribution law. From another perspective, it also means that the sensitivity of the objective function to the design variables is minimized. Figure 5 illustrates the fluctuation law of the natural frequency response of the blade as each design variable changes within the specified range. All figures other than Figure 5(f) show that the frequency response of all three blades from initial design, case 1, and case 2 has a consistent trend as design variables change, only the frequency response of the blades in case 1 and case 2 is more significant than the frequency response of the initial blade, and the frequency response of the blade in case 2 varies more smoothly with the design variables than the other two. From the data in these subfigures, it is apparent that although the typical structural optimization approach (case 1) can significantly improve the response value of the objective function, it cannot ensure that the sensitivity of the objective function to design variables is reduced. The proposed robust optimization (case 2) can simultaneously optimize the response of the objective function and the sensitivity of the objective function to design variables. The most striking result to emerge from Figure 5(f) is that once the width of the spar cap exceeds approximately 300 mm, the frequency response of the blade in case 1 fluctuates dramatically. These further analyses for Figure 5(f) revealed from another perspective that the typical structural optimization might exacerbate the response fluctuation of the objective function, thereby reducing the robustness of the structural performance.

The fluctuation of the natural frequency response of blade as design variables change within a specified range. (a) The single-layer thickness of UD glass, (b) single-layer thickness of biaxial glass, (c) single-layer thickness of triaxial glass, (d) single-layer thickness of balsa, (e) single-layer thickness of reinforcing material, and (f) width of spar cap.
Conclusions
How to minimize structural performance fluctuations caused by uncertain factors while maximizing structural performance is an extremely challenging task. To address this knowledge gap, this study proposed a robust optimization strategy based on the kriging approximation model and compared it with the typical structural optimization approach. Finally, two concrete cases for the structural optimization of the composite blade were performed using a genetic algorithm. The most significant findings from the optimization design include the following: The solution results of case 1 showed that the typical structure optimization increases the first natural frequency of the blade by 19% without considering the fluctuation of the design variables. However, further analysis for robustness evaluation indicated that the 6σ level of the first natural frequency has a reduction by up to 61%. Although the typical optimization approach can obtain the optimal solution of the design problem, it is hard to ensure that the anti-fluctuation performance (robustness) of the objective function is also improved. The solution results of case 2 demonstrated that the proposed robust optimization results in an increment of 15.4% in the first natural frequency of the blade and increases 6σ level of the first natural frequency of the blade by up to 90% compared to the first blade. The proposed robust optimization is a practical approach that can simultaneously find the optimal solution of the optimization design and solve the fluctuation problem of the objective function. Further sensitivity analysis results for the natural frequency response and the design variables of the blade also demonstrated that the proposed robust optimization is superior to the typical structure optimization approach.
Footnotes
Author contributions
Ma Huidong contributed to data curation, formal analysis, visualization, writing of original draft. Zheng Yuqiao contributed to funding acquisition, methodology, project administration, and review and editing of the original manuscript. Wei Jianfeng contributed to investigation, resources, and validation. Zhu Kai contributed to software and supervision.
Declaration of conflicting interests
The author(s) declared no potential conflicts of interest with respect to the research, authorship, and/or publication of this article.
Funding
The author(s) disclosed receipt of the following financial support for the research, authorship, and/or publication of this article: This work was supported by the National Natural Science Foundation of China [grant numbers 51965034 and 51565028] and the Fundamental Research Funds for the Lanzhou city Innovation and Entrepreneurship Project No. 2018-RC-25.