
Abstract
Composite columns such as concrete-filled steel tube (CFST) were adopted in many building constructions in recent years because of carrying high loading with the ability to resist buckling and small cross-sectional area. The high behavior of the CFST columns is due to the interaction between steel and concrete which called the composite action. This type of composite column without main and tie reinforcements embedded in concrete gives high axial compression strength to resist the external loadings with the economic sectional area. The work presented in this article includes simulation models that tested by other researchers and a parametric study on the performance of frames that connected steel beam by composed columns of circular CFST that subjected to lateral loading. A finite element (FE) approach is adopted to simulate the models by ANSYS software. All models consider the linear and nonlinear material analysis of the concrete and steel. The validity of the developed model was examined by comparing with the experimental data founded in the literature. Different parameters such as the ratio of the axial load, the slenderness ratio of CFST column, the linear stiffness ratio of the beam–column, the steel yield strength of the beam, the steel yield strength of the tube, and concrete strength on the performance of the composite frames were also studied and the load-deformation performance was obtained over the different cases of the study. Analysis results by FE modeling were in good agreement with the experimental results.
Keywords
Introduction
The constructions of composite elements such as composite columns become so fast that make and lead the composite column is a key application that adopted by most of the structural engineering designers during recent years. Concrete-filled steel tube (CFST) columns have been constructed in different structures around the whole world due to the combined properties of steel and concrete. Experimental and theoretical approaches were adopted by many researchers to try understanding the actual behavior of the composite columns but little deals with the steel beam rest on CFST columns. The most effective parameters that affect the behavior and performance of such problems were investigated. 1 –9 Schneider 5 simulated a three-dimensional (3-D) nonlinear finite element (FE) model for CFST members by the ABAQUS software. Hu et al. 6 used ABAQUS to develop a nonlinear FE model to study the performance of CFST columns with confinement effect. Han et al. 7 also used ABAQUS for modeling the torsional response of CFST columns. They adopted a uniaxial compression stress–strain relationship for the confined core concrete of CFST columns, and the core concrete was simulated using a plastic damage concrete model in which the analysis results compared with experimental ones. Liu and Foster 8 studied by FE approach the performance of concentrically loaded columns with concrete strength up to 100 MPa. Ellobody and Young 9 studied the behavior of normal and high strength CFST columns under the effects of static loadings by ABAQUS software. They used the cold-formed stainless steel tube. The concrete model and the other parameters used were similar as in the study of Hu et al. 6 There are recent investigations on the performance and behavior of the composite frames and connections such as presented by Han et al. 10 They investigated square CFST columns framed to steel beams by experimentally and FE modeling under cyclic loading in which the analysis was verified by six frame specimens. Also, Han et al. 11 investigated the behavior and strength of the frames with circular CFST columns under a constant axial load on the CFST columns and a lateral cyclic load. Based on the analysis of the results, a simplified hysteretic lateral load versus lateral displacement model was proposed. Mou et al. 12 studied the earthquake response of frame joints subjected to bidirectional cyclic loading test and they concluded that in case of constant D/t ratio, the bending moment of the specimens under the biaxial symmetrical loading was about 20% less as compared to specimens under uniaxial loading. Ding et al. 13 studied the frame of circular CFST column to steel-concrete composite beam under lateral cyclic loading. The results based on the FE modeling were closed with the experimental results in terms of the failure modes, load–displacement hysteretic curves, and skeleton curves. Hajjar et al. 14 proposed a 3-D modeling of interior beam-to-column composite connections. Wang et al. 15 investigated several types of CFST column to steel beam connections by using two types of CFST with square and circular sections with outside stiffening ring plate or with penetrating ring plate. It was pointed out that these joints could improve the resistant of the progressive collapse when compared with the other types of connections. Mou and Bai 16 results indicated that rebar stiffeners could be very effective to improve the seismic behavior of joints for the CFST column and steel beam. Mou et al. 17 declared that the composite action of the floor slab and the steel beam was particularly significant under the sagging moment for the CFST column (square section) and steel beam joint. Muhummud 18 predicted the seismic behavior of a multi-story CFST composite frame using the nonlinear dynamic time history analysis by DRAIN-2DX software. Herrera 19 investigated the earthquake response of CFST column-wide flange beam frames.
Aim and significance of research
Experimental investigations of the CFST elements are quite costly and time spoliation. FE approach as a branch of numerical analysis has become more desirable or suitable due to the widespread. Many FE software can be utilized to simulate the composite sections, one of them is ANSYS software. 20 The main focus on the analysis and design of the CFST column is the strength capacity, ductility, and the whole stiffness of the column in addition to the column–beam connection relation. The important points that the actual relationships between the concrete core and the surrounding steel tube in the elastic, elasto-plastic, and in the plastic zone but still the performance of the composite frame in the elastic range is the base for structural design. This study sets out a numerical realization of the performance and strength of frames with CFSTs and steel beams using the FE approach by ANSYS software. The CFST column and their connection with the steel beam offer more than an increase in strength capacity and stiffness but give more ductile so that no sudden failure will occur. The essential elements that adopted to simulate the composite action of the CFST are concrete, steel, and the interface between the outer concrete surface and inner steel tube elements. The main objective of the present study is to characterize and develop an accurate FE model to simulate the performance of the composite frames with circular CFST columns to a steel beam by the FE software ANSYS. Toward this aim, the effects of concrete strength and concrete confinement were considered in the analysis. The interface between concrete and the steel tube was also modeled as a contact surface. To validate the FE model, the experimental test data given in the literature were used, then, a parametric study was conducted in which 31 composite frame cases were considered. The adopted parameters included the axial load level, the slenderness ratio of the columns, the linear stiffness ratio of the beam–column, the steel yield strength of the beam, the yield strength of the tube, and concrete strength. Each model specimen consisted of two CFST columns and a steel beam to represent a typical frame element in a building, and each specimen was subjected to the lateral load. The analyses of the results were given and discussed comparatively.
Composite frames—FE approach
Thirty-one CFST composite frames were designed and analyzed to study the effect of the different parameters on the performance of such frames. All specimen information summary is listed in Table 1 while Figure 1 shows the layout of the frame model and basic frame elements and Figure 2 represents the composite frame with an illustration of the beam–column and column–base connection. Different parameters are considered as follows
Details of the composite frames and basic parameters studied.


Typical frame element (unit: mm).
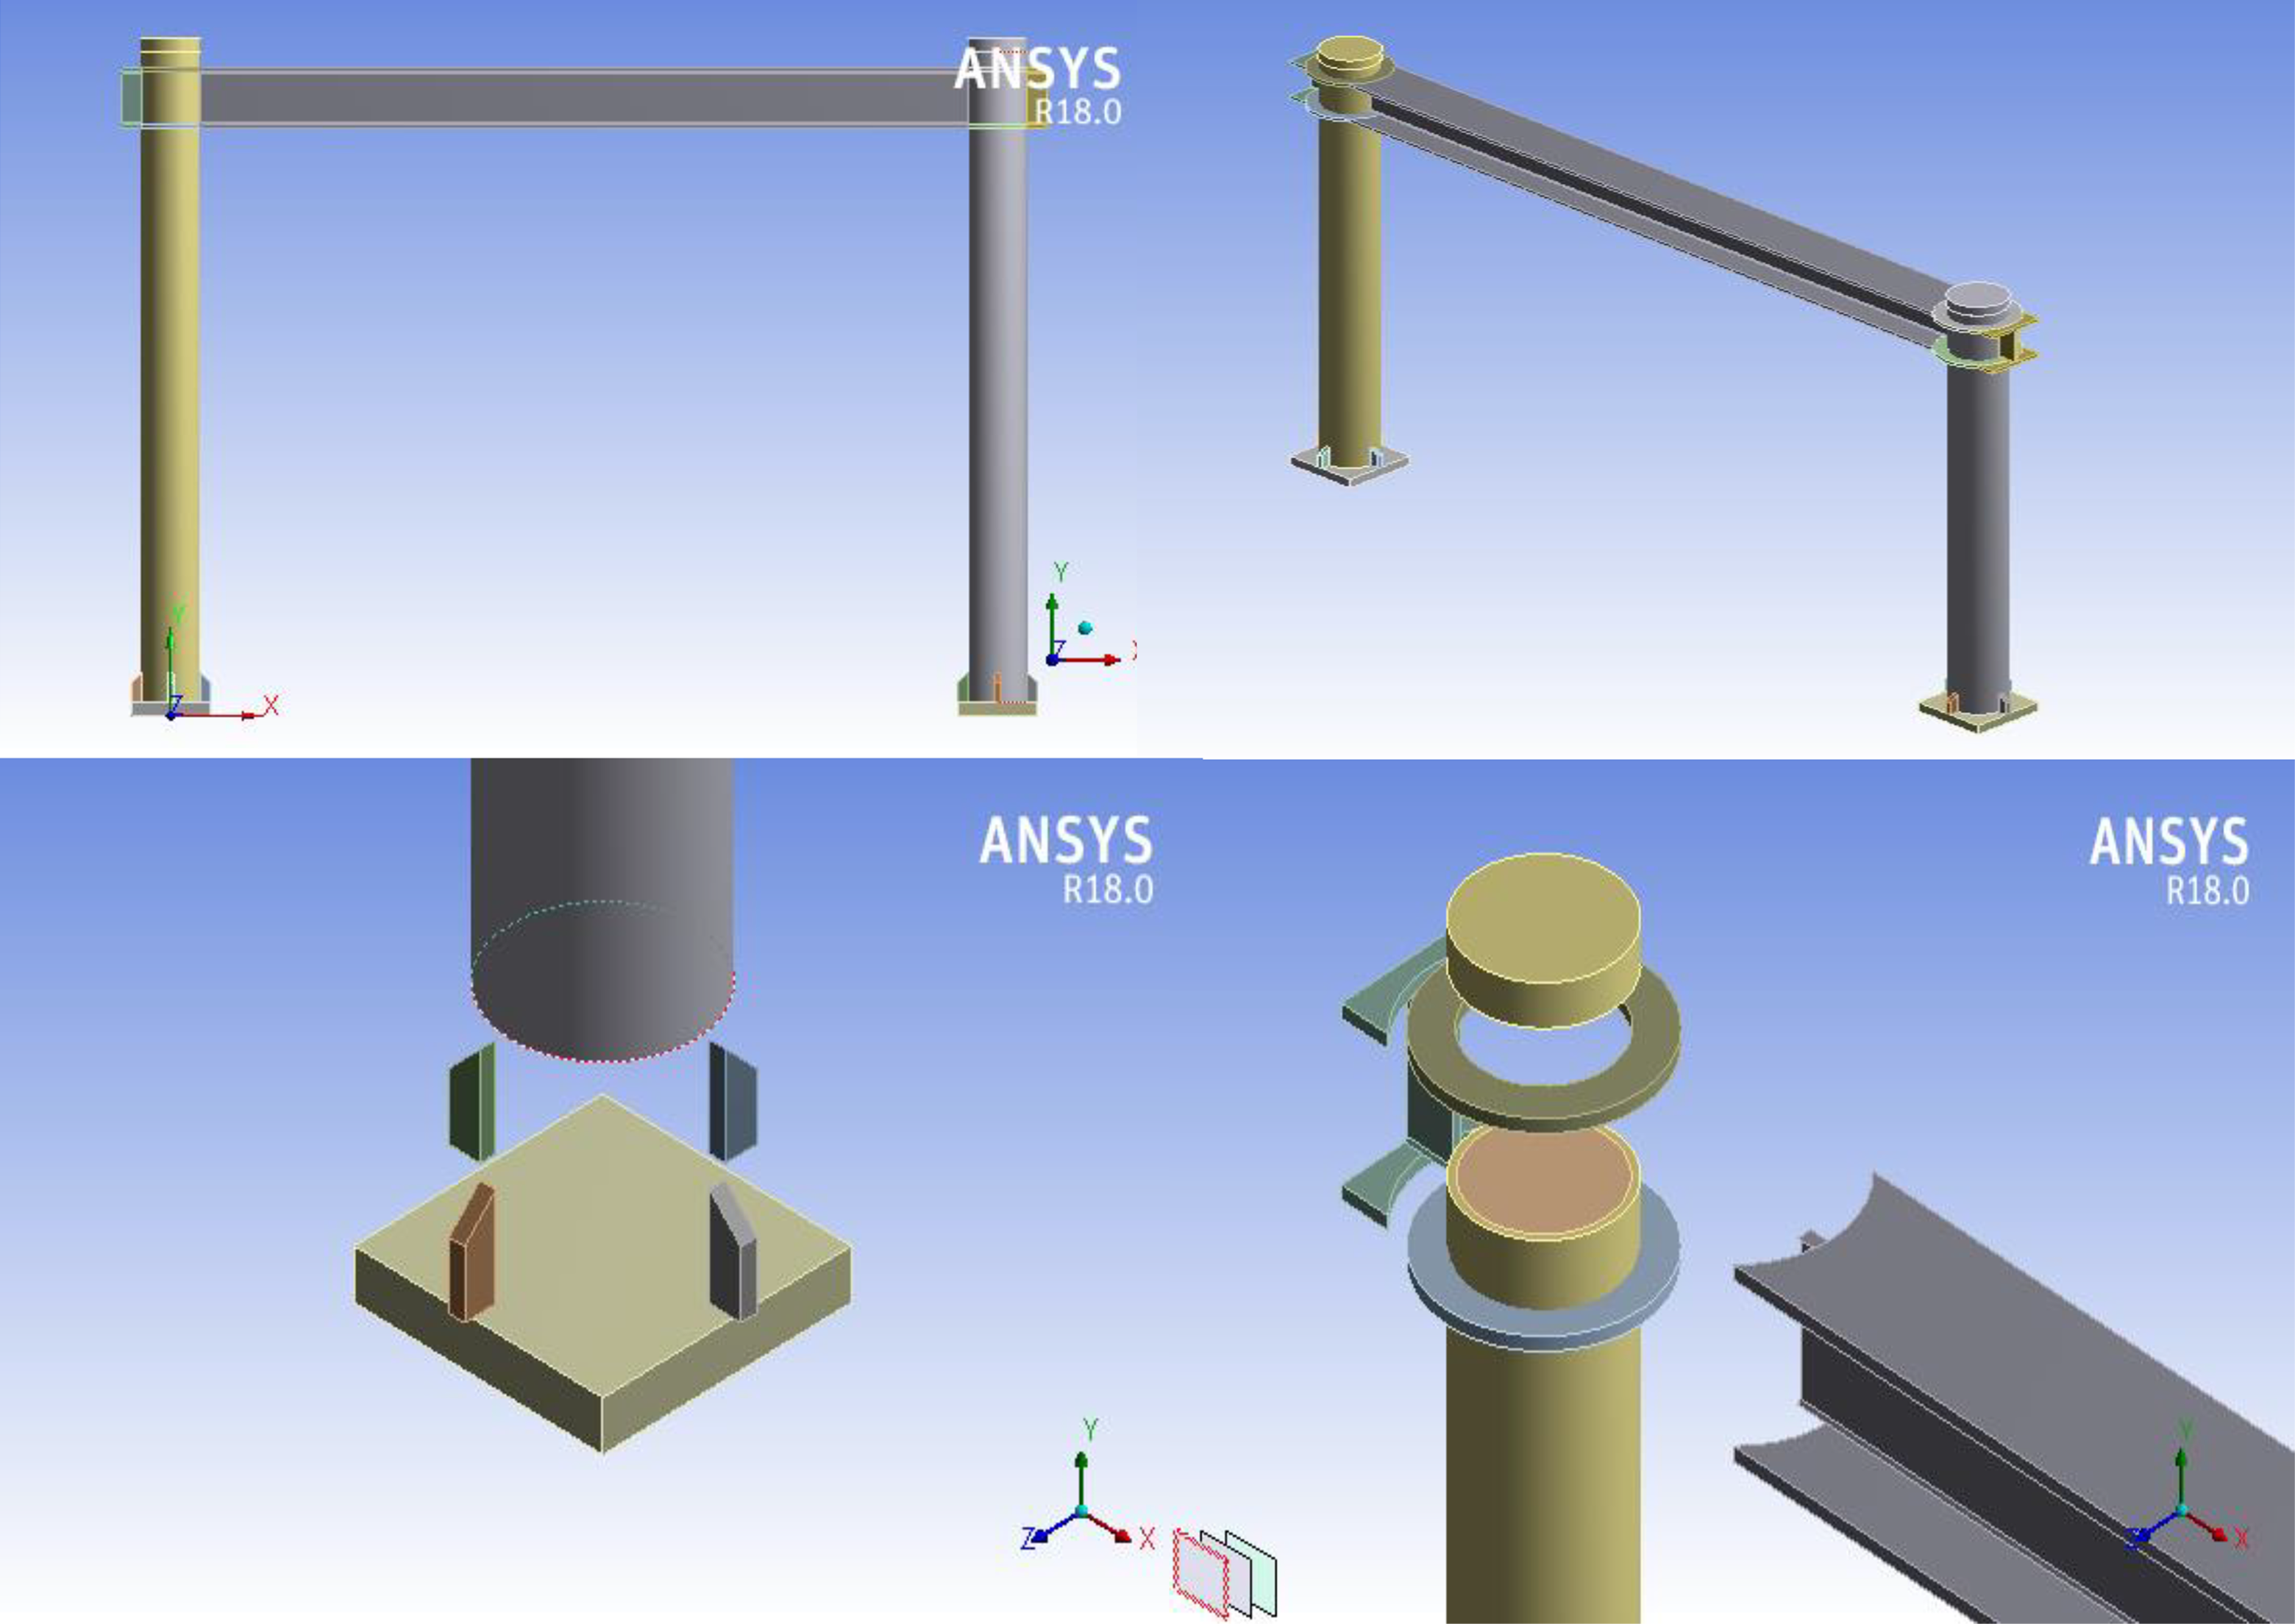
Typical composite frame and connections in FE model. FE: finite element.
Axial load ratio (n) of CFST columns such as (0.0, 0.1, 0.3, 0.5, 0.7, 0.9, and 1.1): The axial load ratio is described as n = (N
o
/N
u), where N
o is the applied axial load to the column and N
u is the axial compressive column capacity.
Slenderness ratio (λ) of CFST columns (24, 48, 72, and 96): The slenderness ratio (λ) is
Beam-to-column linear stiffness ratio (k) (1.8, 3.0, 5.4, and 6.6): k is computed as i
B/i
C, i
B is determined as E
s
I
eq
/l
b, where I
eq is the moment of inertia of the transformed section in accordance with GB 50017-2003,
21
and l
b is the length of the steel beam. i
C is calculated as E
h
I
h
/H. The stiffness of the circular CFST column (E
h
I
h) is calculated as
Steel beam yield strength (f y Beam) (235, 290, 345, 390, and 420 MPa).
Steel column tube yield strength (f y Column) (235, 290, 345, 390, and 420 MPa).
Concrete compressive strength (
FE modeling of the frames
Material modeling
The composite action between the steel and the concrete that caused by the contact between the steel tube and the concrete in a CFST column leading to exerted radial lateral confining pressure by the steel tube on the concrete induces the confinement in concrete. A biaxial state of stress is also induced in steel, which may cause some reduction in its axial load capacity. Thus, any numerical model that intends to capture the behavior of CFST in compression must use a suitable constitutive model for the steel tube and concrete. Further, to effectively replicate the inherent advantages of CFST, it is necessary that the composite action between steel and concrete could be carefully modeled.
Concrete
Confinement of concrete column by means of steel tube section enhances the strength capacity of composite column and concrete ductility. The steel tube provides passive confinement to the concrete and over the entire composite member. The adopted compressive strength 

Stress–strain relation of steel tube confined concrete. 23
The value of k 1 conducted by a test that ranged between 4 and 6 in which the present study 4.5 is adopted. 7 The average radial pressure f l relies on the ratio of diameter to thickness of the tube (D/t) that was calculated by adopting the following empirical formula 23 :


ε cc is the strain corresponding to maximum stress f cc and ε o is the strain corresponding to maximum compressive stress. Supposing that the confinement of concrete in the initial stage of loading (elastic) does not exist because the Poisson’s ratio of concrete in cases of normal and high strength concrete is lower than that of the steel tube (0.3) so that at the initial stage, the stress–strain performance is same as for unconfined concrete. After the initial stage, the confinement will work and the stress is calculated by Saenz equation as follows 23 :
The descending part of the stress–strain curve is represented as follows 23 :

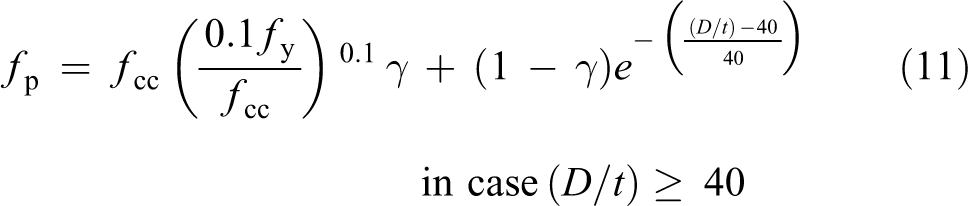
In which f p is the residual compressive stress and k is the parameter representing the descending rate equal to 0.6. 11 The magnitudes of f p rely on the D/t ratio and are calculated as follows:

Steel tube column and base plate
The steel tube that surrounding the concrete core subjected to hoop tension stress during the applied loading on the composite columns. The yield criteria based on Von Misses are adopted as following with axial and hoop stress σ a and σ h, respectively:

The stress–strain curve as the numerical analysis is assumed to be linear with a slope of E s up to the yield point and then the slope changes to 0.1E s to improve the numerical stability analysis. 23
Elements description
Solid 186 element was used to model the steel tube, its stiffening diaphragms, and the steel beam and adopted to model the base plate of 50 mm in thickness to prevent any stress concentration. This element is a higher order 3-D 20-node solid element that exhibits quadratic displacement behavior. Each node had three degrees of freedom translations x, y, and z directions. While for the concrete, the solid element Solid 65 which has eight nodes with three degrees of freedom at each node—translations in the nodal x, y, and z directions. The element is capable of plastic deformation, cracking in three orthogonal directions, and crushing.
Loading and the boundary conditions
The load condition which is used in these models had constant axial load through nodes on columns according to special values, and lateral load subjected on the end of the steel beam through nodes increases step-by-step until it reaches failure. The support conditions at the left and right of columns bases are restraints in all directions(x, y, and z) so that working as fixed.
Concrete–steel tube interface
The coefficient of friction between the concrete and steel surfaces used was 0.6 as suggested by Han et al. 11 ANSYS interface elements were used in order to model the contact area between the steel tube and the concrete. The two surfaces of the element in the normal direction is a hard contact, while the tangent contact surface is modeled by the Coulomb friction model. As far as the faces remain in contact, the friction between them is maintained.
FE model verification
To verify the validity of the FE model, the analysis results obtained from the FE model were compared with the experimental results. Composite frames with circular CFST columns to steel beam tested by Han et al. 11 were utilized in this study to verify the proposed FE model using ANSYS software.
For the frame CF-13, 11 with circular CFST columns, the beam span was 1450 mm and column height 2500 mm. The column size is Φ140 × 2 mm thick tube, while the beam size (depth × flange width × flange thickness × web thickness) is 140 × 65 × 3.44 × 3.44 mm4. Table 2 lists the mechanical properties for the beam and CFST column.
Material properties of the steel—CFST frame. 11
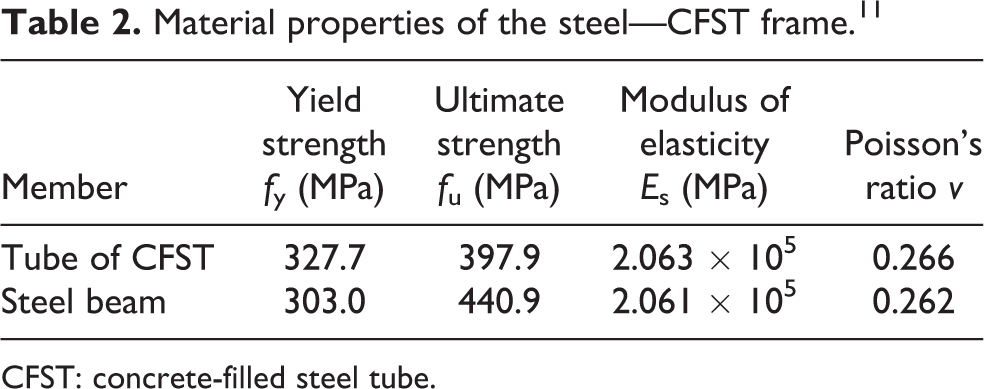
CFST: concrete-filled steel tube.
The verification analysis results are given in Table 3. The comparison shows closed for predicting the load–displacement behavior of the composite frames. Figure 4 shows the deflected shape of the frame under the FE model analysis. Figure 5(a) to (c) shows the maximum Von Misses stresses at the regions of the frame connections. The application of Von Misses yield criteria as the square of sum difference between the principle stresses must be less than the square of the magnitude of the yield strength. The Von Misses stress at the frame connections was greater than the yield strength so that the frame fail at the final load stage. The largest recorded stress values were in the CFST column–steel beam connection and the lower part of CFST column nearest to the loading region was observed. Figure 6 also represents the comparison between the experimental and numerical analysis result based on the load-displacement behavior.
Verified theoretical and experimental results.

FE: finite element.
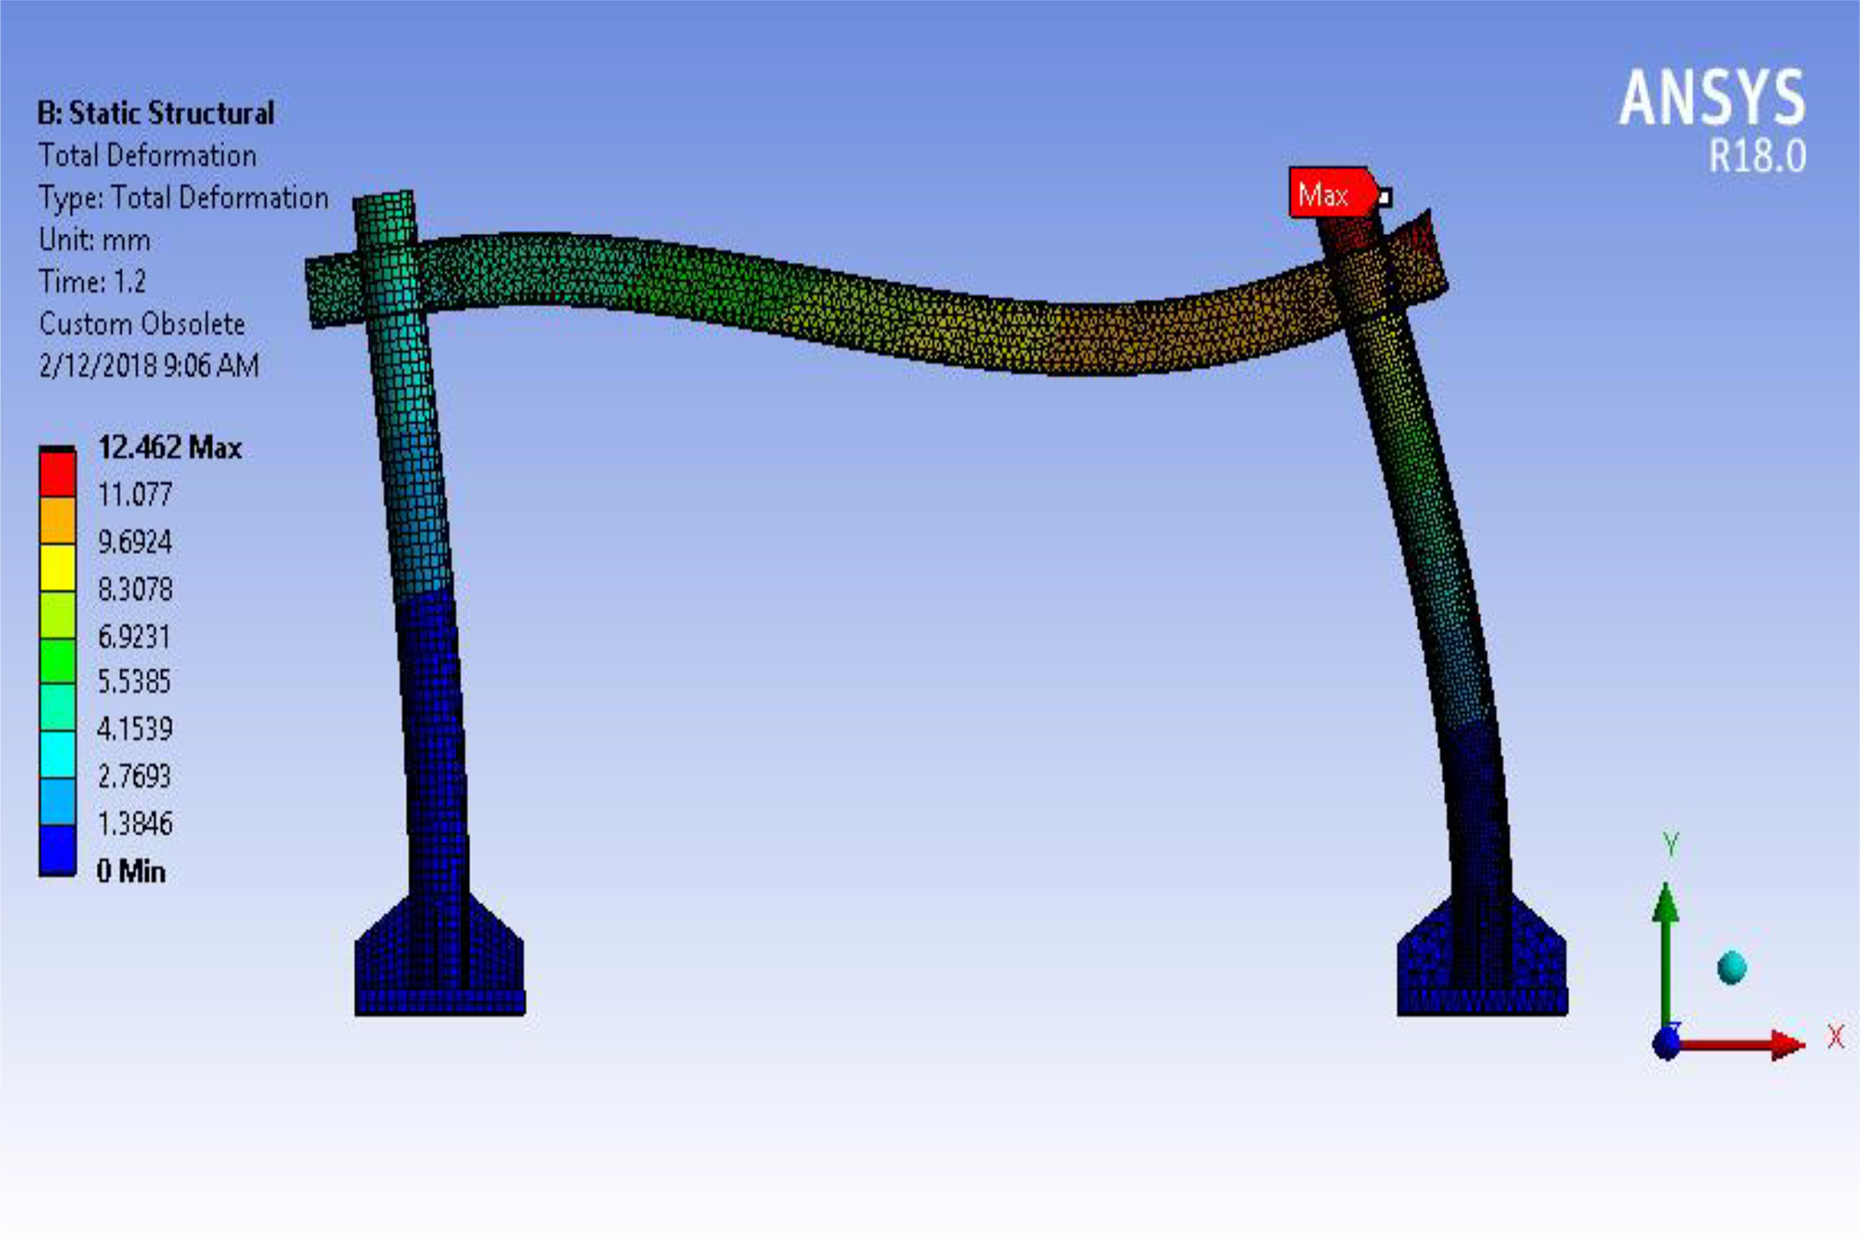
Deflected shape of Han et al.’s 11 frame under FE model analysis for the verification purpose. FE: finite element.

Maximum principle stresses at the region of (a) the right column–base connection, (b) the left column–base connection, and (c) the beam–column connection of Han et al.’s frame. 11
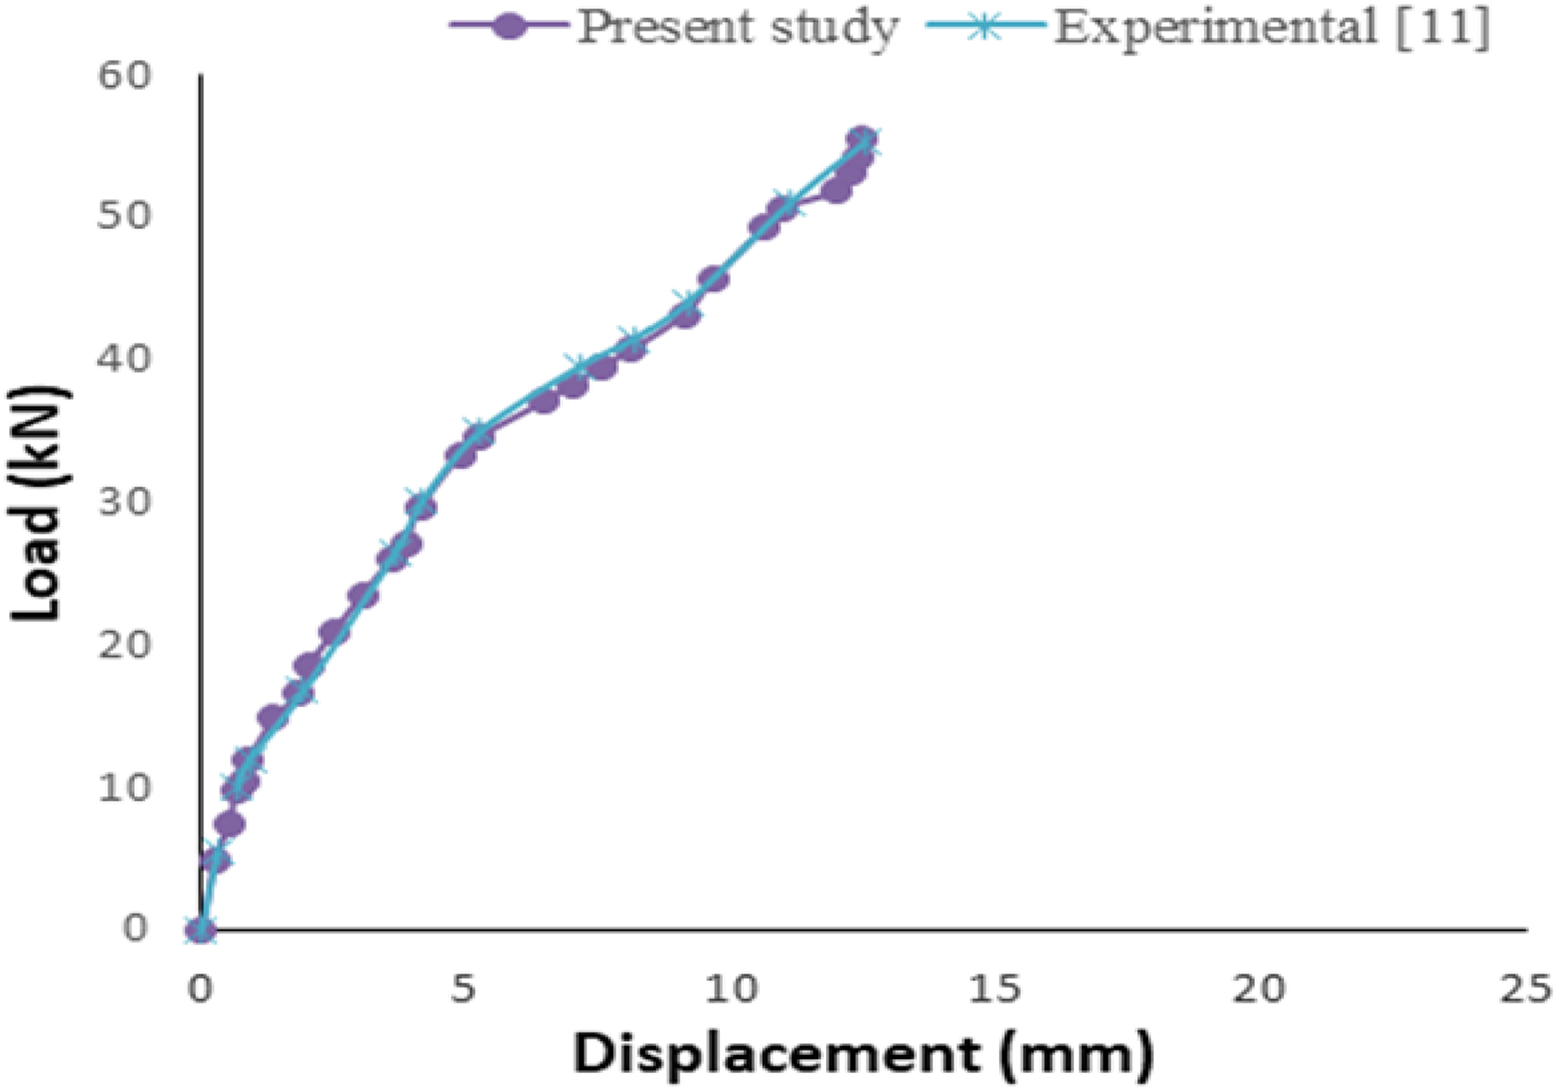
Comparison between the experimental and numerical analysis result.
Nonlinear analysis
In the nonlinear static analysis, the ultimate applied load was divided into a number of load increments as steps. At the end of each load step, the model stiffness matrix was recalculated and updated the nonlinear changes in the structural stiffness and then it proceeds to the next load step by applying the Newton–Raphson method that built in ANSYS with a displacement control tolerance of 0.001. Figures 7 and 8 illustrate the failure modes, the maximum stresses, and the deformed shape of the composite frame, all the composite frames exhibited similar failure mode. Plastic hinges were formed at the top and the bottom of the CFST column when the loads reach the ultimate. The maximum stress propagations are shown in Figures 7 and 8 at the ultimate load stage. The stress concentration at the beam–column connection and at the top and bottom regions of the CFST due to this area is the weak zone. The maximum stress is 312 MPa which is greater than the yield strength 290 MPa that indicates a plastic hinge formation at the connection of the steel beam and at the top of the CFST.

Failure mode and maximum stresses at beam–column and column–base connections.

Deformed shape of a composite frame (specimen F2-3).
Figure 9 illustrates the stages of loading and the resulted stresses. At stage 1, the lateral load is low and elastic condition prevails, when the load increased and the elastic range is over, higher stresses are shown at the tension sides of the column and beam. At stage 3, the final stage, the maximum stresses are reached and the failure has occurred as shown in the beam just near the connection, which confirms that the failure was based on the weak beam–strong column principle.
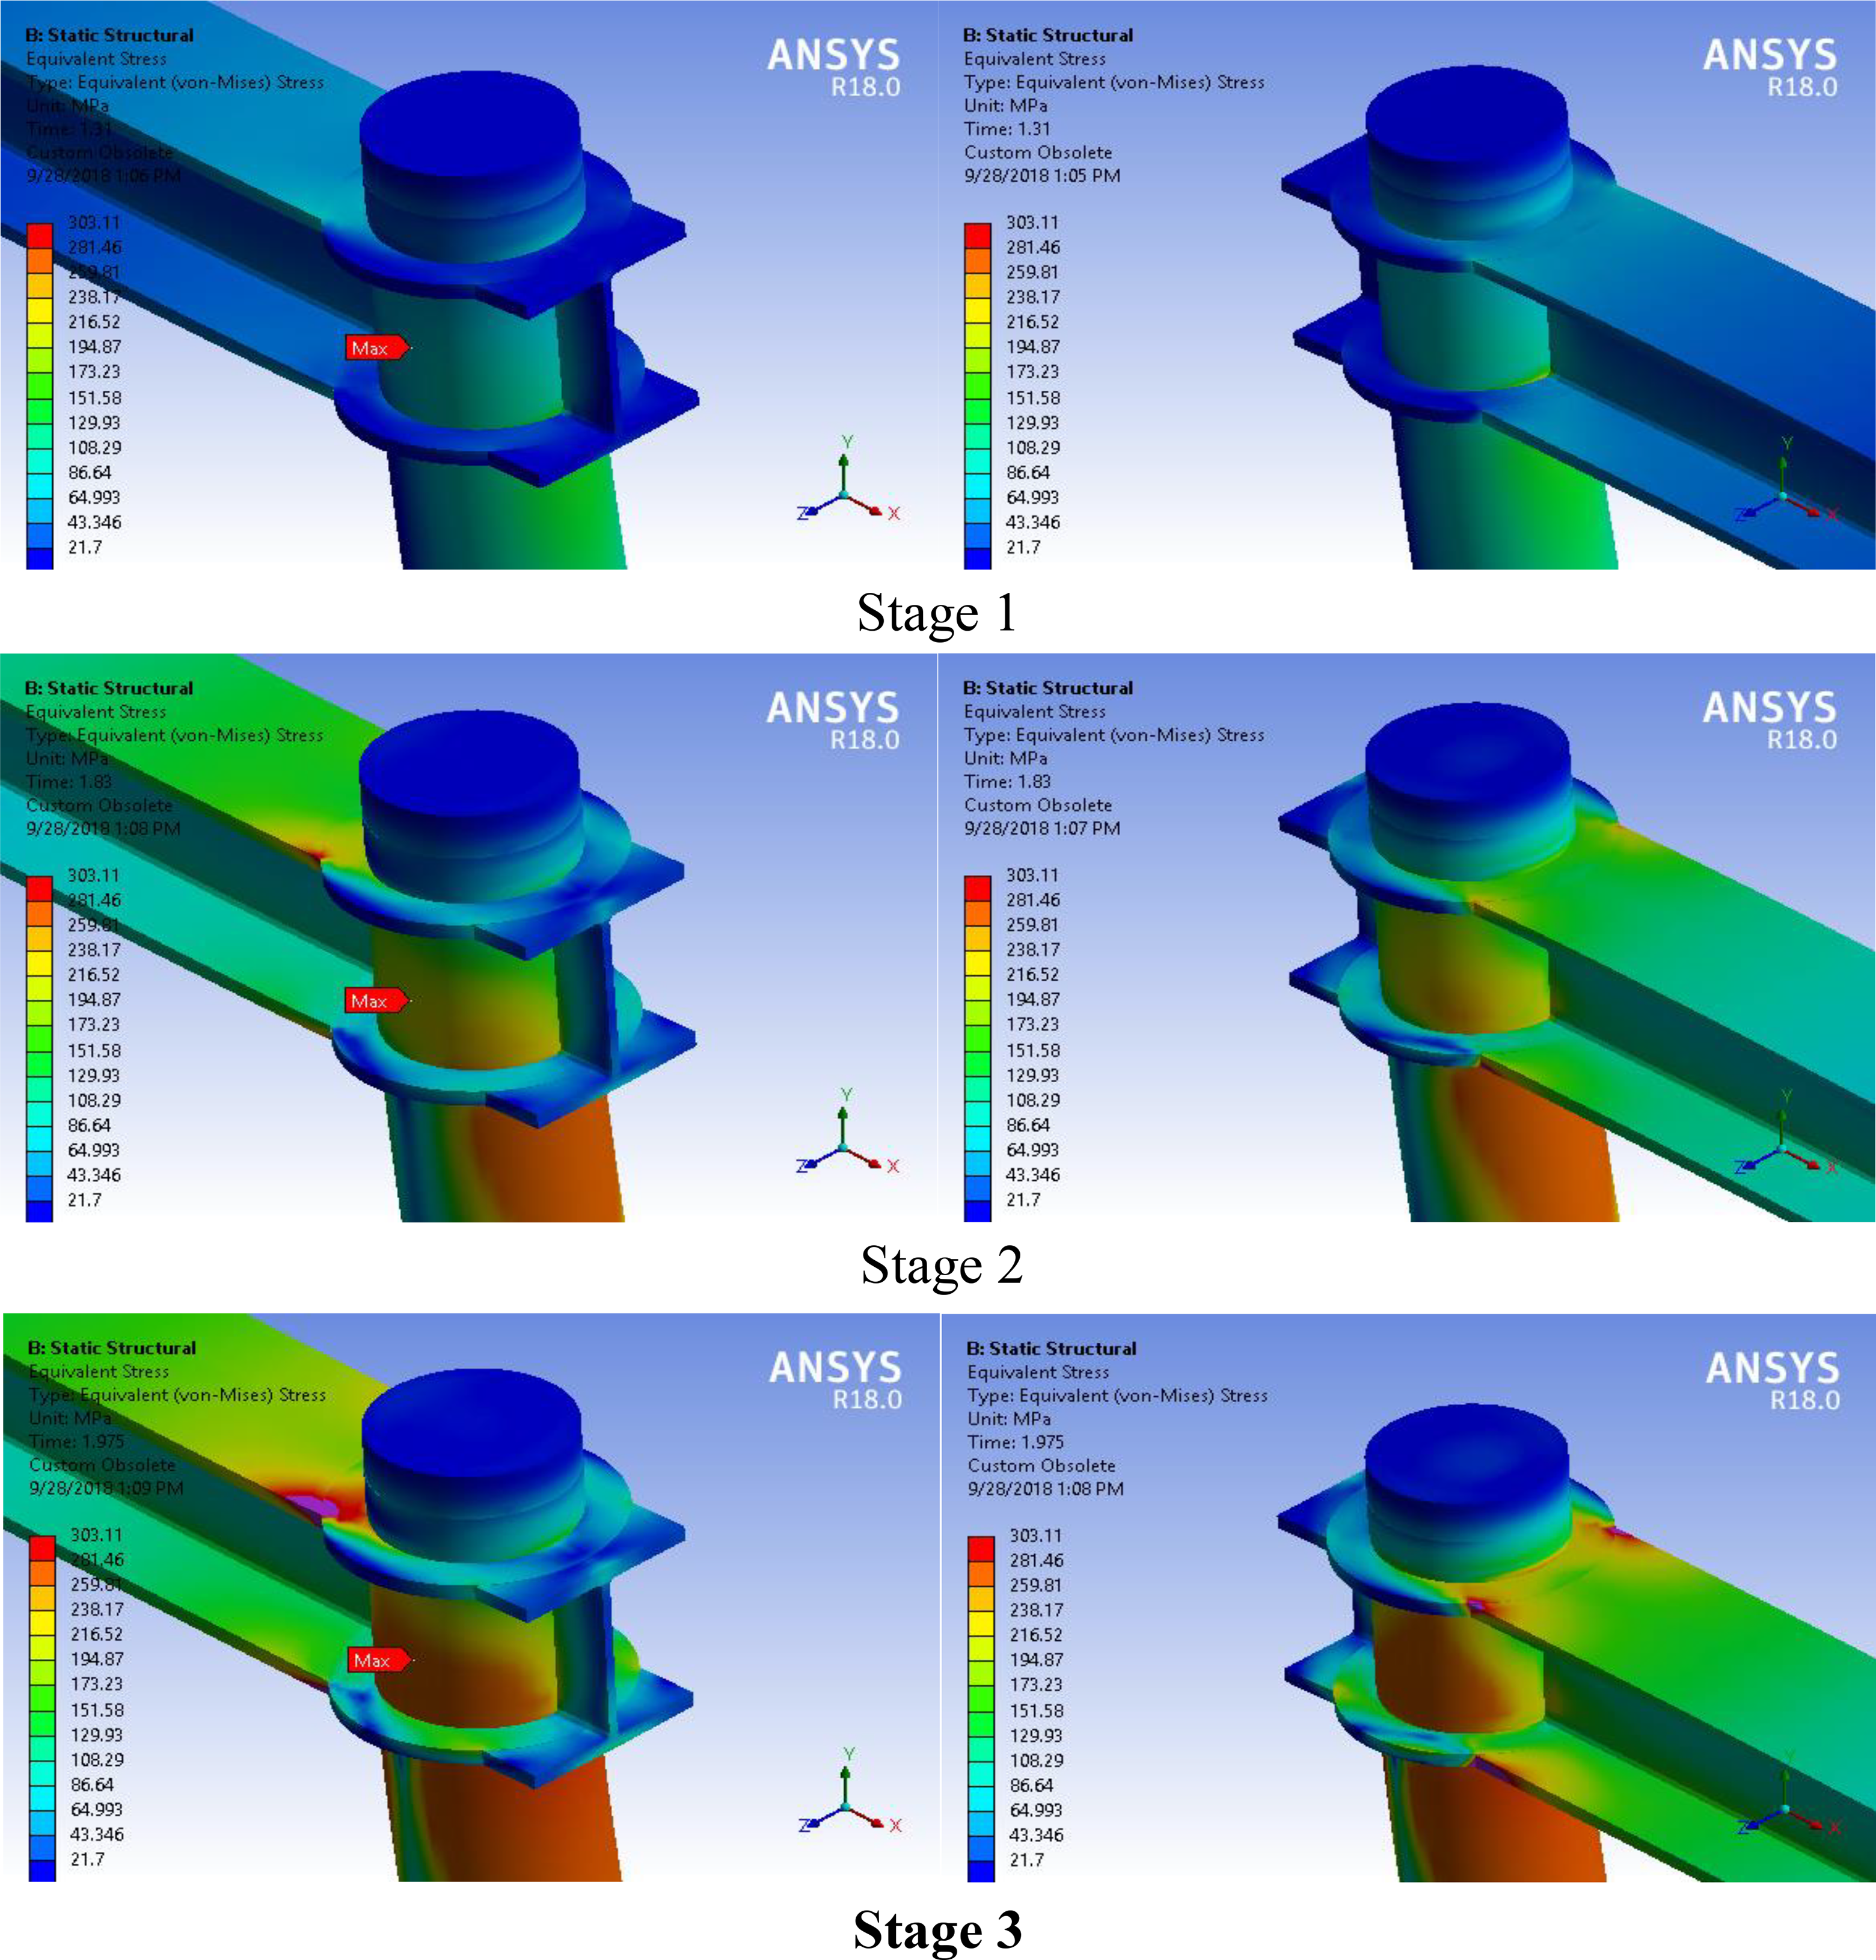
Stages of loading and corresponding stresses (specimen F2-3).
Parametric study
Different parameters are considered in the numerical analysis such as axial load ratio (n), slenderness of the column, linear stiffness ratio of the beam–column (k), steel yield strength of the beam (f
yBeam), steel yield strength of the tube of the column (fy
Column), and concrete strength (
Axial load ratio
The axial load ratio (n) varied as 0.0, 0.1, 0.3, 0.5, 0.7, 0.9, and 1.1. The other parameters were kept constant as shown in Table 1 (F1-1 to F1-7). Figure 10 shows the fitted relations of lateral load with lateral displacement of the composite CFST frames at various axial load ratios. Increase in the lateral load capacity for the frames with increasing n values from 0.1 to 0.7 and closed increasing for n values from 0.7 to 1.1. Figure 11 reveals the maximum lateral load versus n values. The lateral stiffness of the frame improves with the increase of the axial load ratio, at all stages, with no descending whatsoever. As the axial load ratio increases from 0 to 0.7, see Figure 12, the frame stiffness at all stages also increases clearly. From 0.7 to 1.1, the frame stiffness at the elastic and yield stages looks very close, while the lateral post-yield stiffness of the frame increases slightly.

Lateral load–displacement relationships for various axial load ratios.

Maximum lateral load versus n value.
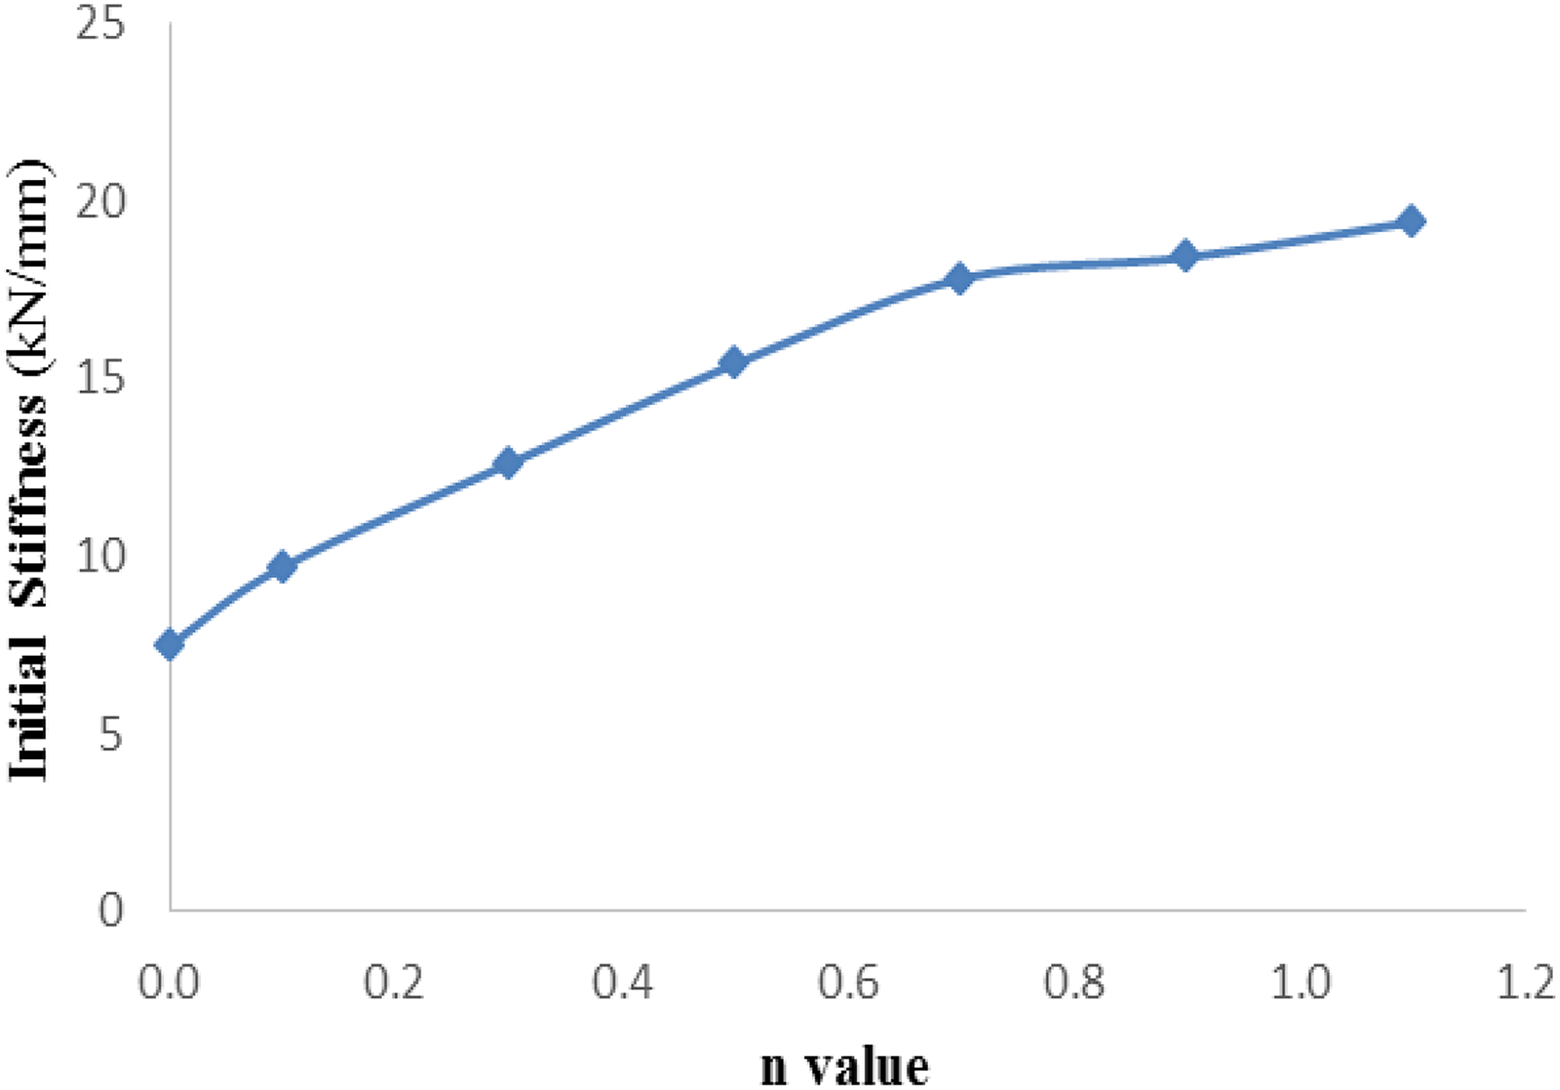
Initial stiffness versus n value.
Slenderness of column
The column slenderness (λ) varies as 24, 48, 72, and 96. The other parameters were kept constant as shown in Table 1 (F2-1 to F2-4). Figure 13 shows the relationship of lateral load–lateral displacement of the composite CFST frames at different slenderness values. As shown from the figure, the structural responses of the case study frames are depended on the level of the column slenderness. The performance of all models is straight up to the inflection point and then the curve behaves as nonlinear in the direction of horizontal due to a decrease in stiffness. Moreover, as observed in Figure 14, there is a clear trend that the rapid decrease of the maximum load as the slenderness increased. Similarly, the lateral stiffness of the frame decreases with the increase of the slenderness value (see Figure 15). However, the less-stiff frames show greater lateral displacements and therefore greater ductility. None of the curves is shown descending, however, lateral displacement looks larger. Hereby the yield and ultimate load are seen constant, which indicates imminent structure failure. With the increase of the column’s slenderness due to increase in column height, the yield load and ultimate load decrease very clearly, in case of λ = 24 compared to λ = 48, λ = 72, and λ = 96, respectively, the ultimate load decreases 1.77, 2.82, and 4.63 times. It is shown that the slenderness of the column is more than 48; the overall frame instability is due to the formation of plastification.

Lateral load versus displacement relationships for various column slenderness ratios.
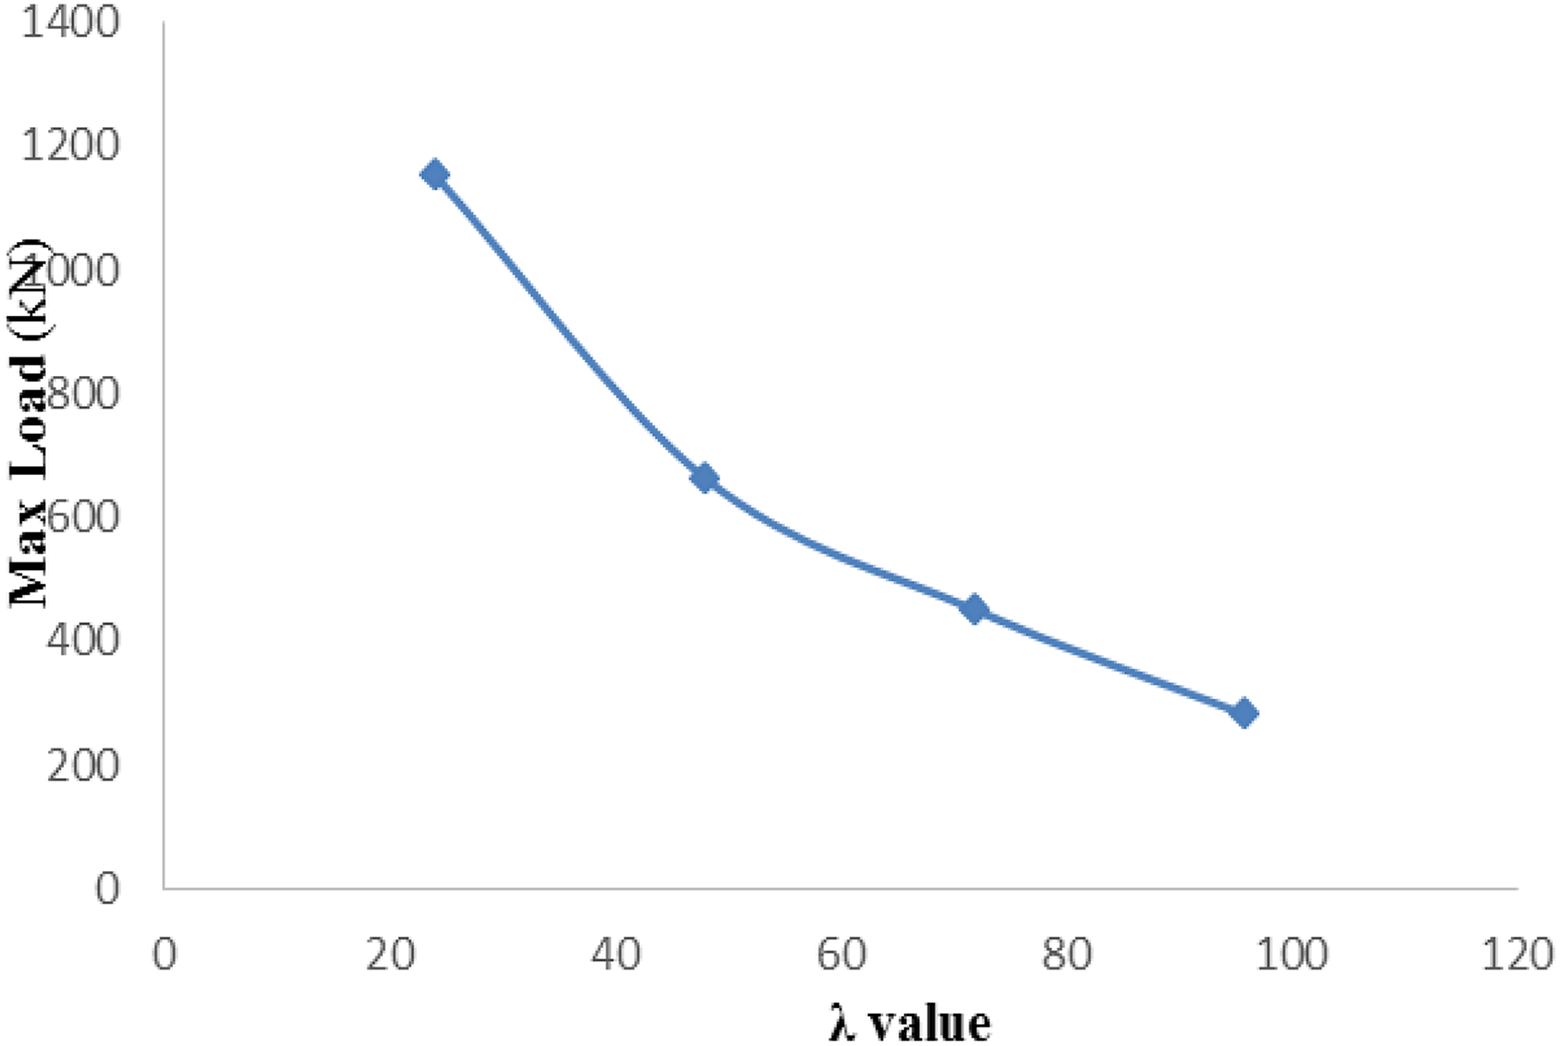
Maximum lateral load versus λ value.

Initial stiffness versus λ value.
Linear stiffness ratio of the beam–column
To study the influence of the beam–column linear stiffness ratio (k) on the frame structures response, the steel beam length was varied while the other input parameters kept unchanged, to achieve the case of changing the linear stiffness ratio of the beam–column as shown in Table 1 (F3-1 to F3-5). The lateral load versus lateral displacement relationship is shown in Figure 16. Figures 17 and 18 show the relationships of the lateral load versus k values and the initial stiffness versus k values, for the composite CFST frames, respectively. With the increase of the linear stiffness ratio of the beam–column, the lateral stiffness of the frame at the elastic stage increases with significant differences. When the linear stiffness ratio of the beam–column increased from k = 1.8–6.6, both the lateral stiffness and the maximum lateral load exhibit approximately a constant increase. The initial stiffness increases from 11.8 to 33.2 (180% increment) and the lateral load increases from 585 kN to 864 kN (48% increment). The linear stiffness ratio of the beam–column represents the constraint level, and furthermore, it puts an effect on the capacity for the lateral deformation of the framed column. Thus, the studied ratio is directly influencing the bearing capacity of the frame.

Lateral load versus displacement relationships for various linear stiffness ratios.

Maximum lateral load versus k value.

Initial stiffness versus k value.
Steel yield strength of the beam
To study the influence of the strength of the steel beam on the behavior of the frame, steel yield strength of 235, 290, 345, 390, and 420 MPa was used by keeping the other parameters constant as shown in Table 1 (F4-1 to F4-5). Figure 19 shows the relationship of lateral load–lateral displacement of the composite CFST frames at different steel yield strengths of the beam. With the increase of the strength of steel, the lateral stiffness of all frames at the elastic stage remains so close. It can be seen that the frames also can continue to carry load and deformation. It is shown that the frames of lower beam steel strength have greater deformation capacity and thereby greater ductility, however, the shape of the curves and trends of the lateral load–lateral displacement of the frame almost remain the same. The maximum lateral load increased from 635.8 kN to 741 kN (16.5% increment) when the beam steel yield strength increases from 235 MPa to 420 MPa, as shown in Figure 20. The initial stiffness also rises from 14 kN/mm to 22 kN/mm (57% increment) as observed in Figure 21.
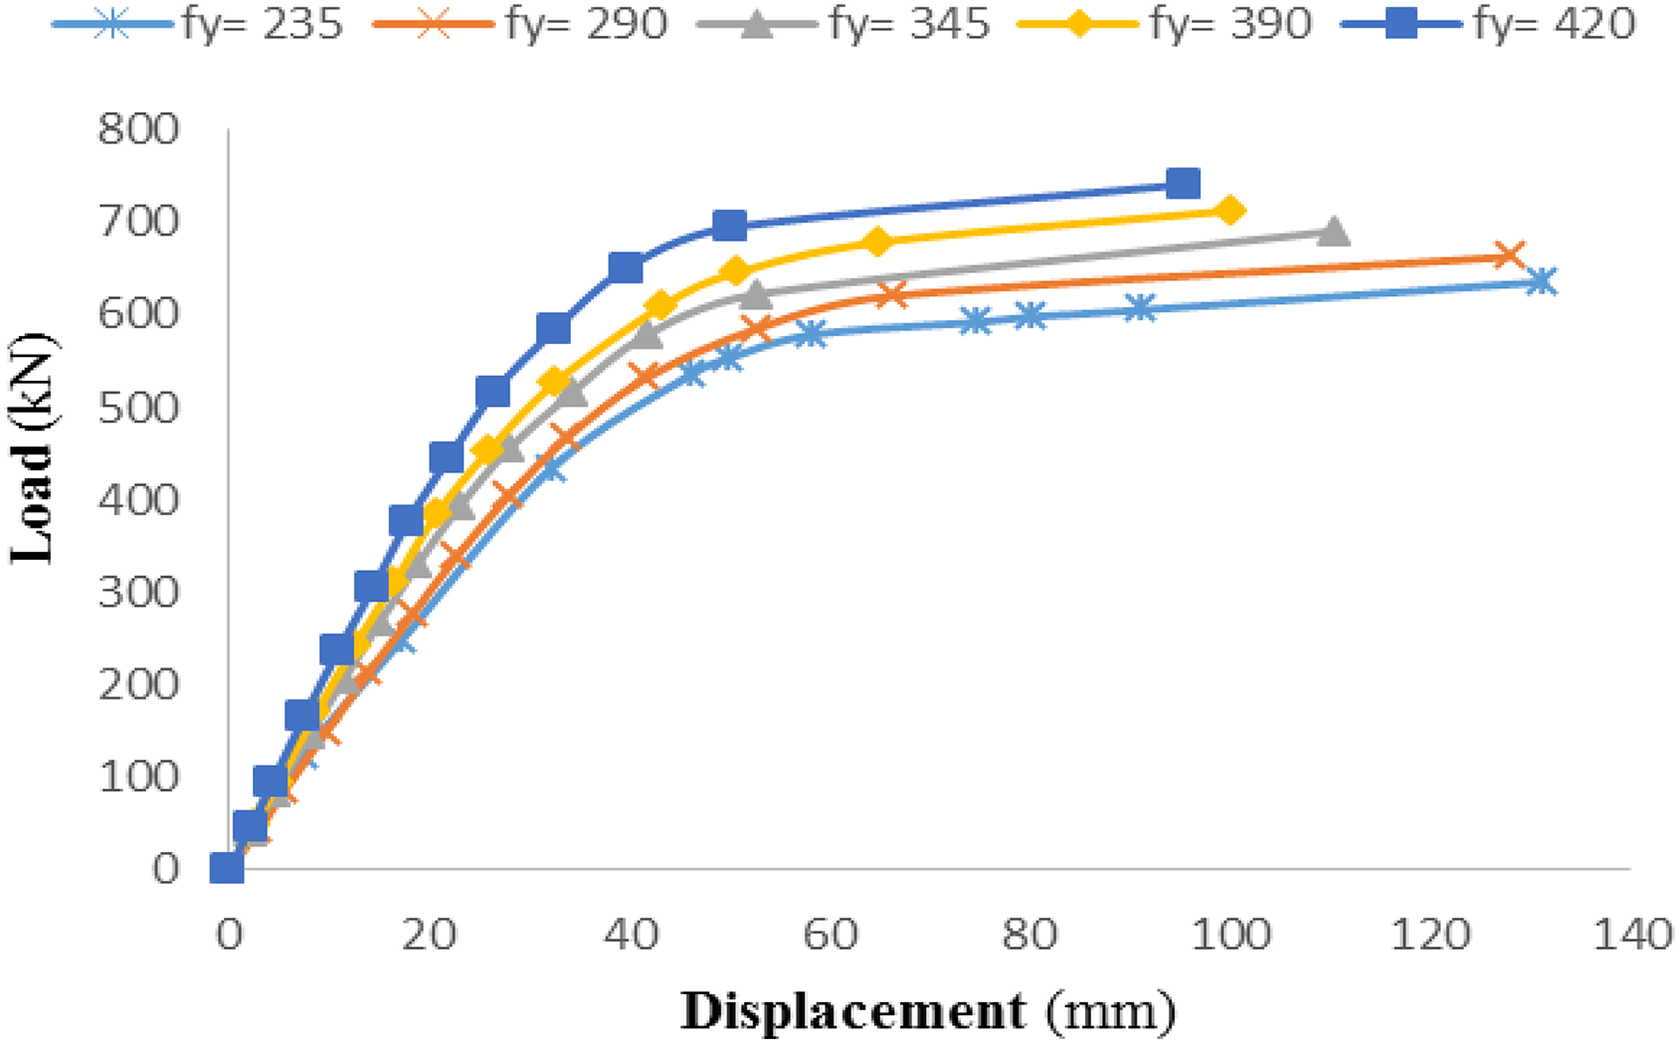
Lateral load versus displacement relationships for different beam yield strengths.
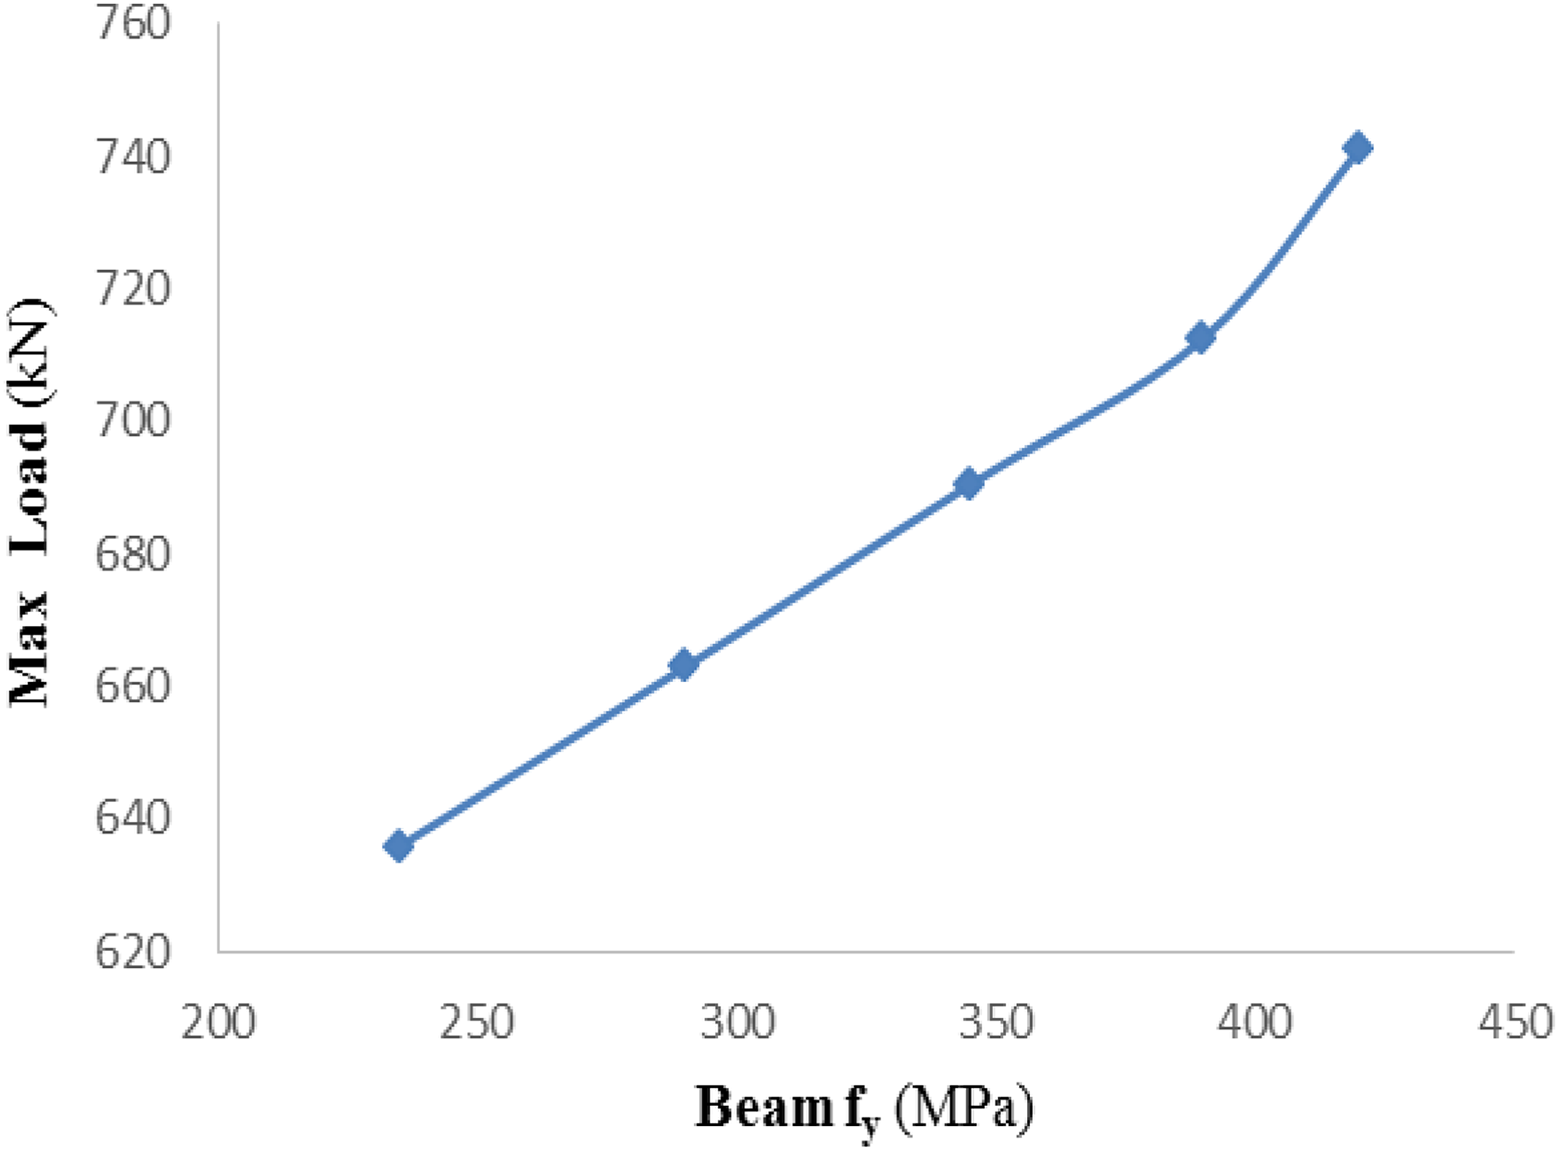
Maximum lateral load versus beam f y.

Initial stiffness versus beam f y.
Steel yield strength of the column
To examine the effect of the steel yield strength of tube of the CFST columns on the lateral performance of the composite frames, the following steel strengths of the tubes were used: 235, 290, 345, 390, and 420 MPa by keeping the other parameters constant as shown in Table 1 (F5-1 to F5-5). Figure 22 shows the fitted relationship of lateral load–lateral displacement of CFST frames for different column tube steel strengths. With the increase of the strength of steel, the lateral stiffness of all frames at the elastic stage remains close and increased at later stages as the tube strength is increased; it is shown that the frames with higher column steel strength have improved deformation capacity.

Lateral load–displacement relationships for different column tube yield strengths.
The shape of the curves and trends of lateral load–lateral displacement of the frame almost remain the same. The maximum lateral load increased from 624 kN to 710.5 kN (14% increment) when tube steel strength increases from 235 MPa to 420 MPa, as shown in Figure 23. The initial stiffness increases when tube steel strength increases from 235 MPa to 420 MPa. As shown in Figure 24, it is increased from 14.3 kN/mm to 17.6 kN/mm (23% increment). The effect is less pronounced than what resulted when studying the beam steel strength. This may be due to the composite action of the column.
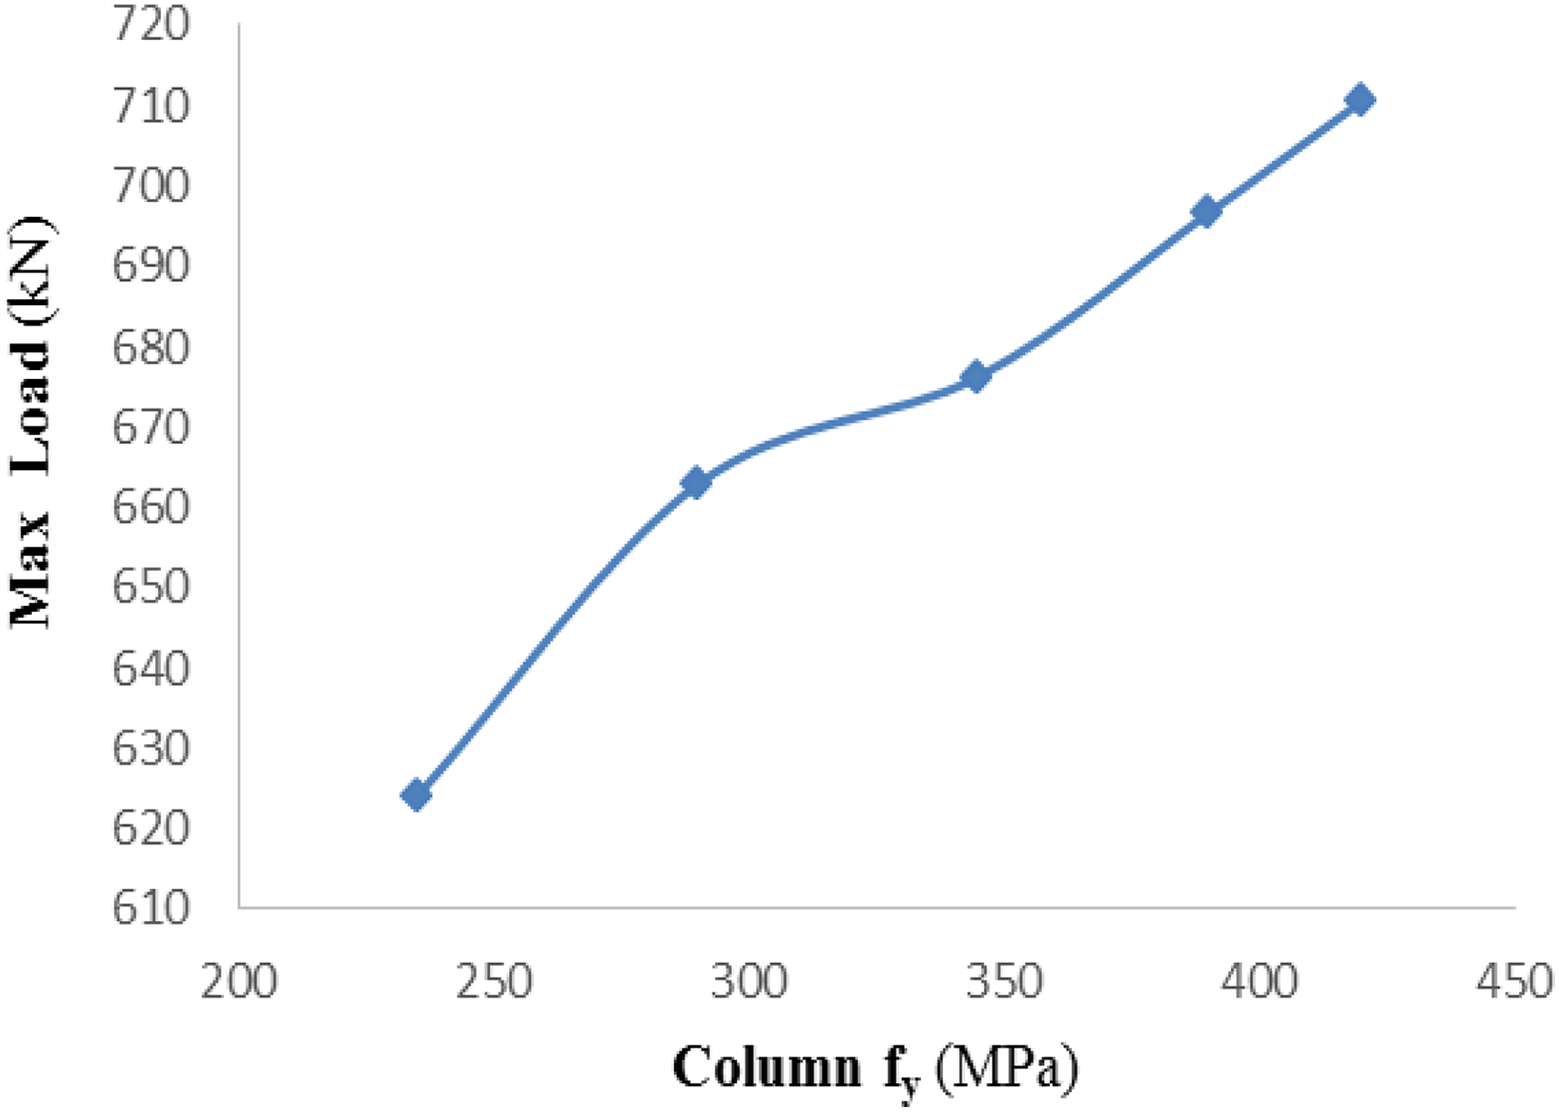
Maximum lateral load versus column f y.
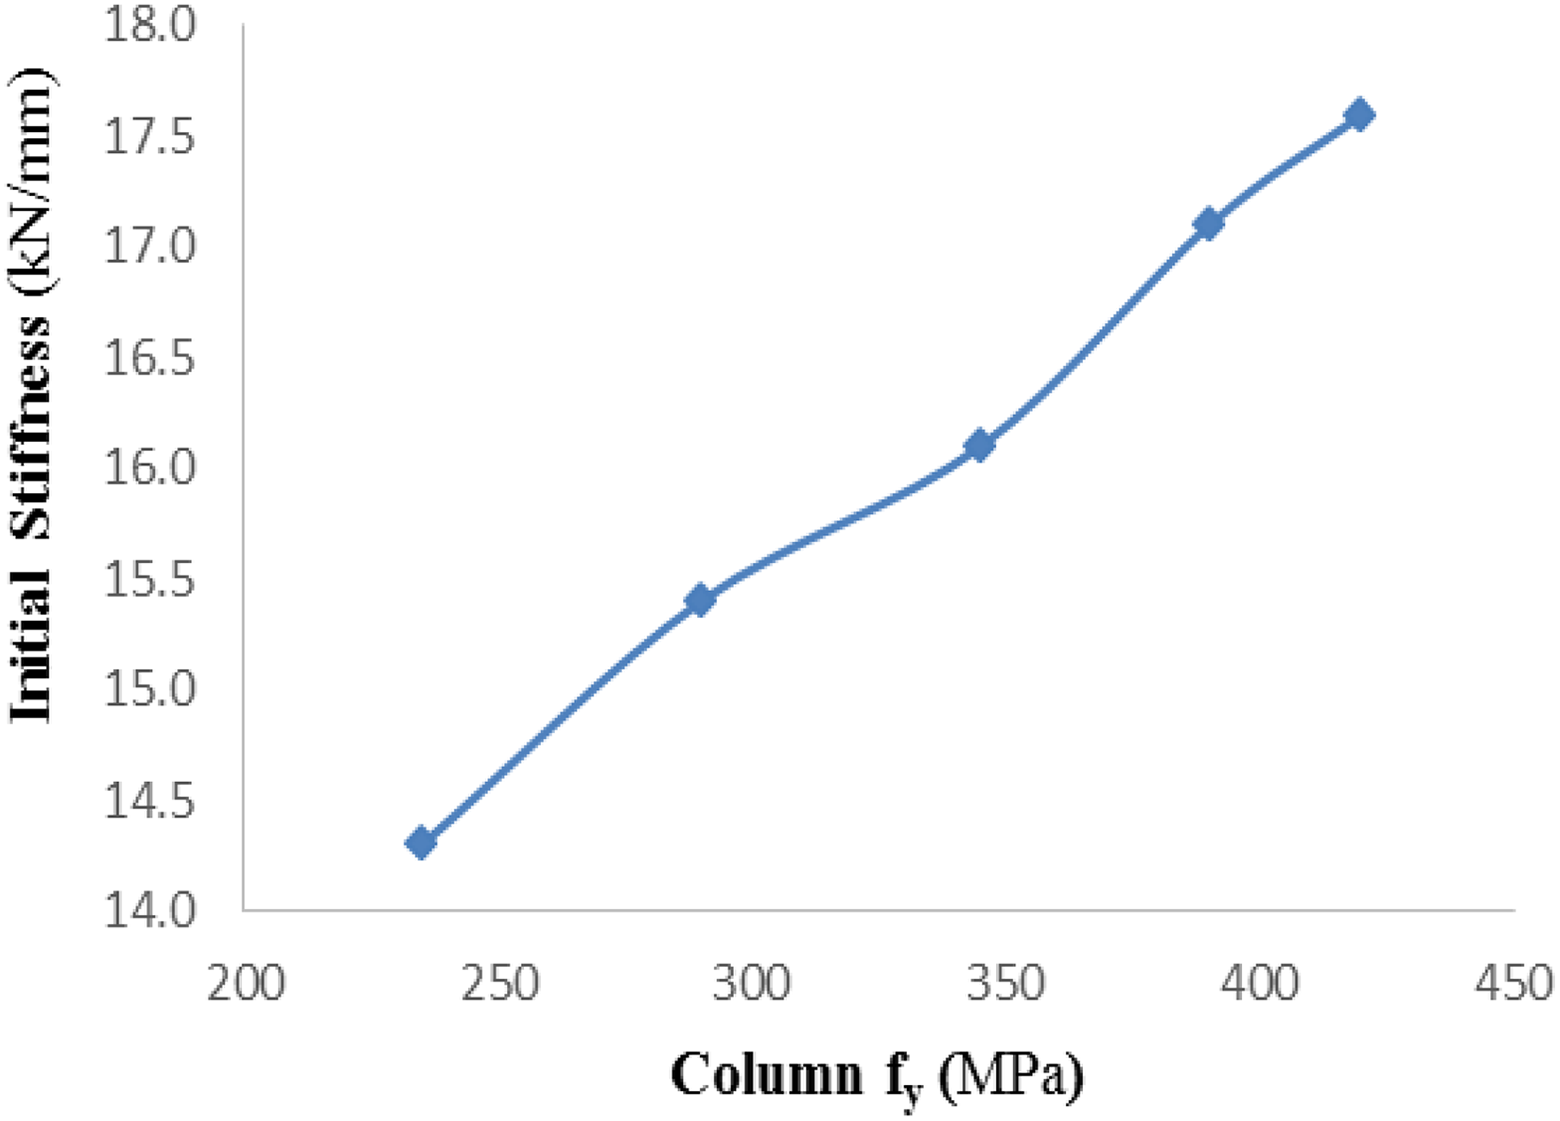
Initial stiffness versus column f y.
Concrete strength
Due to the influence of the compressive strength of concrete core of CFST columns on the behavior of the composite frame, different concrete cylinder strengths of 28, 56, 68, 88, and 108 MPa are adopted, as listed in Table 1 (F6-1 to F6-5). Figure 25 shows the relationship of the lateral load–lateral displacement of the composite frames at different strengths of concrete up to ultimate load (note that the final displacement not drawn). With the increase of the compressive strength of concrete, the maximum lateral load increases due to the increase in modulus of elasticity of the concrete that increases in strength capacity of the member due to the increase in stiffness. As concrete strength increases from 28 MPa to 108 MPa, the maximum lateral load increases from 662.9 kN to 758.9 kN (only 14.5% increment). It means a little gain of the CFST frame strength is obtained when a huge increase in concrete strength is made (see Figure 26). Moreover, the initial stiffness increases from 14.8 kN/mm to 22.1 kN/mm (49% increment) as given in Figure 27.

Lateral load versus displacement for various concrete strengths.

Maximum lateral load versus f c.

Initial stiffness versus f c.
Toughness
The area under the load–displacement curve is measured as an indicator of the toughness of the composite frame. Figure 28 shows the toughness versus various studied parameters. As the axial load ratio (n) is increased from n = 0 to n = 0.7, a clear increase in toughness is shown (84% increment), then a less increase from n = 0.7 to n = 1.1 (5% increment). It can be indicated that as n is increased (as the axial compression becomes larger), the composite frame displays both strength and ductility.
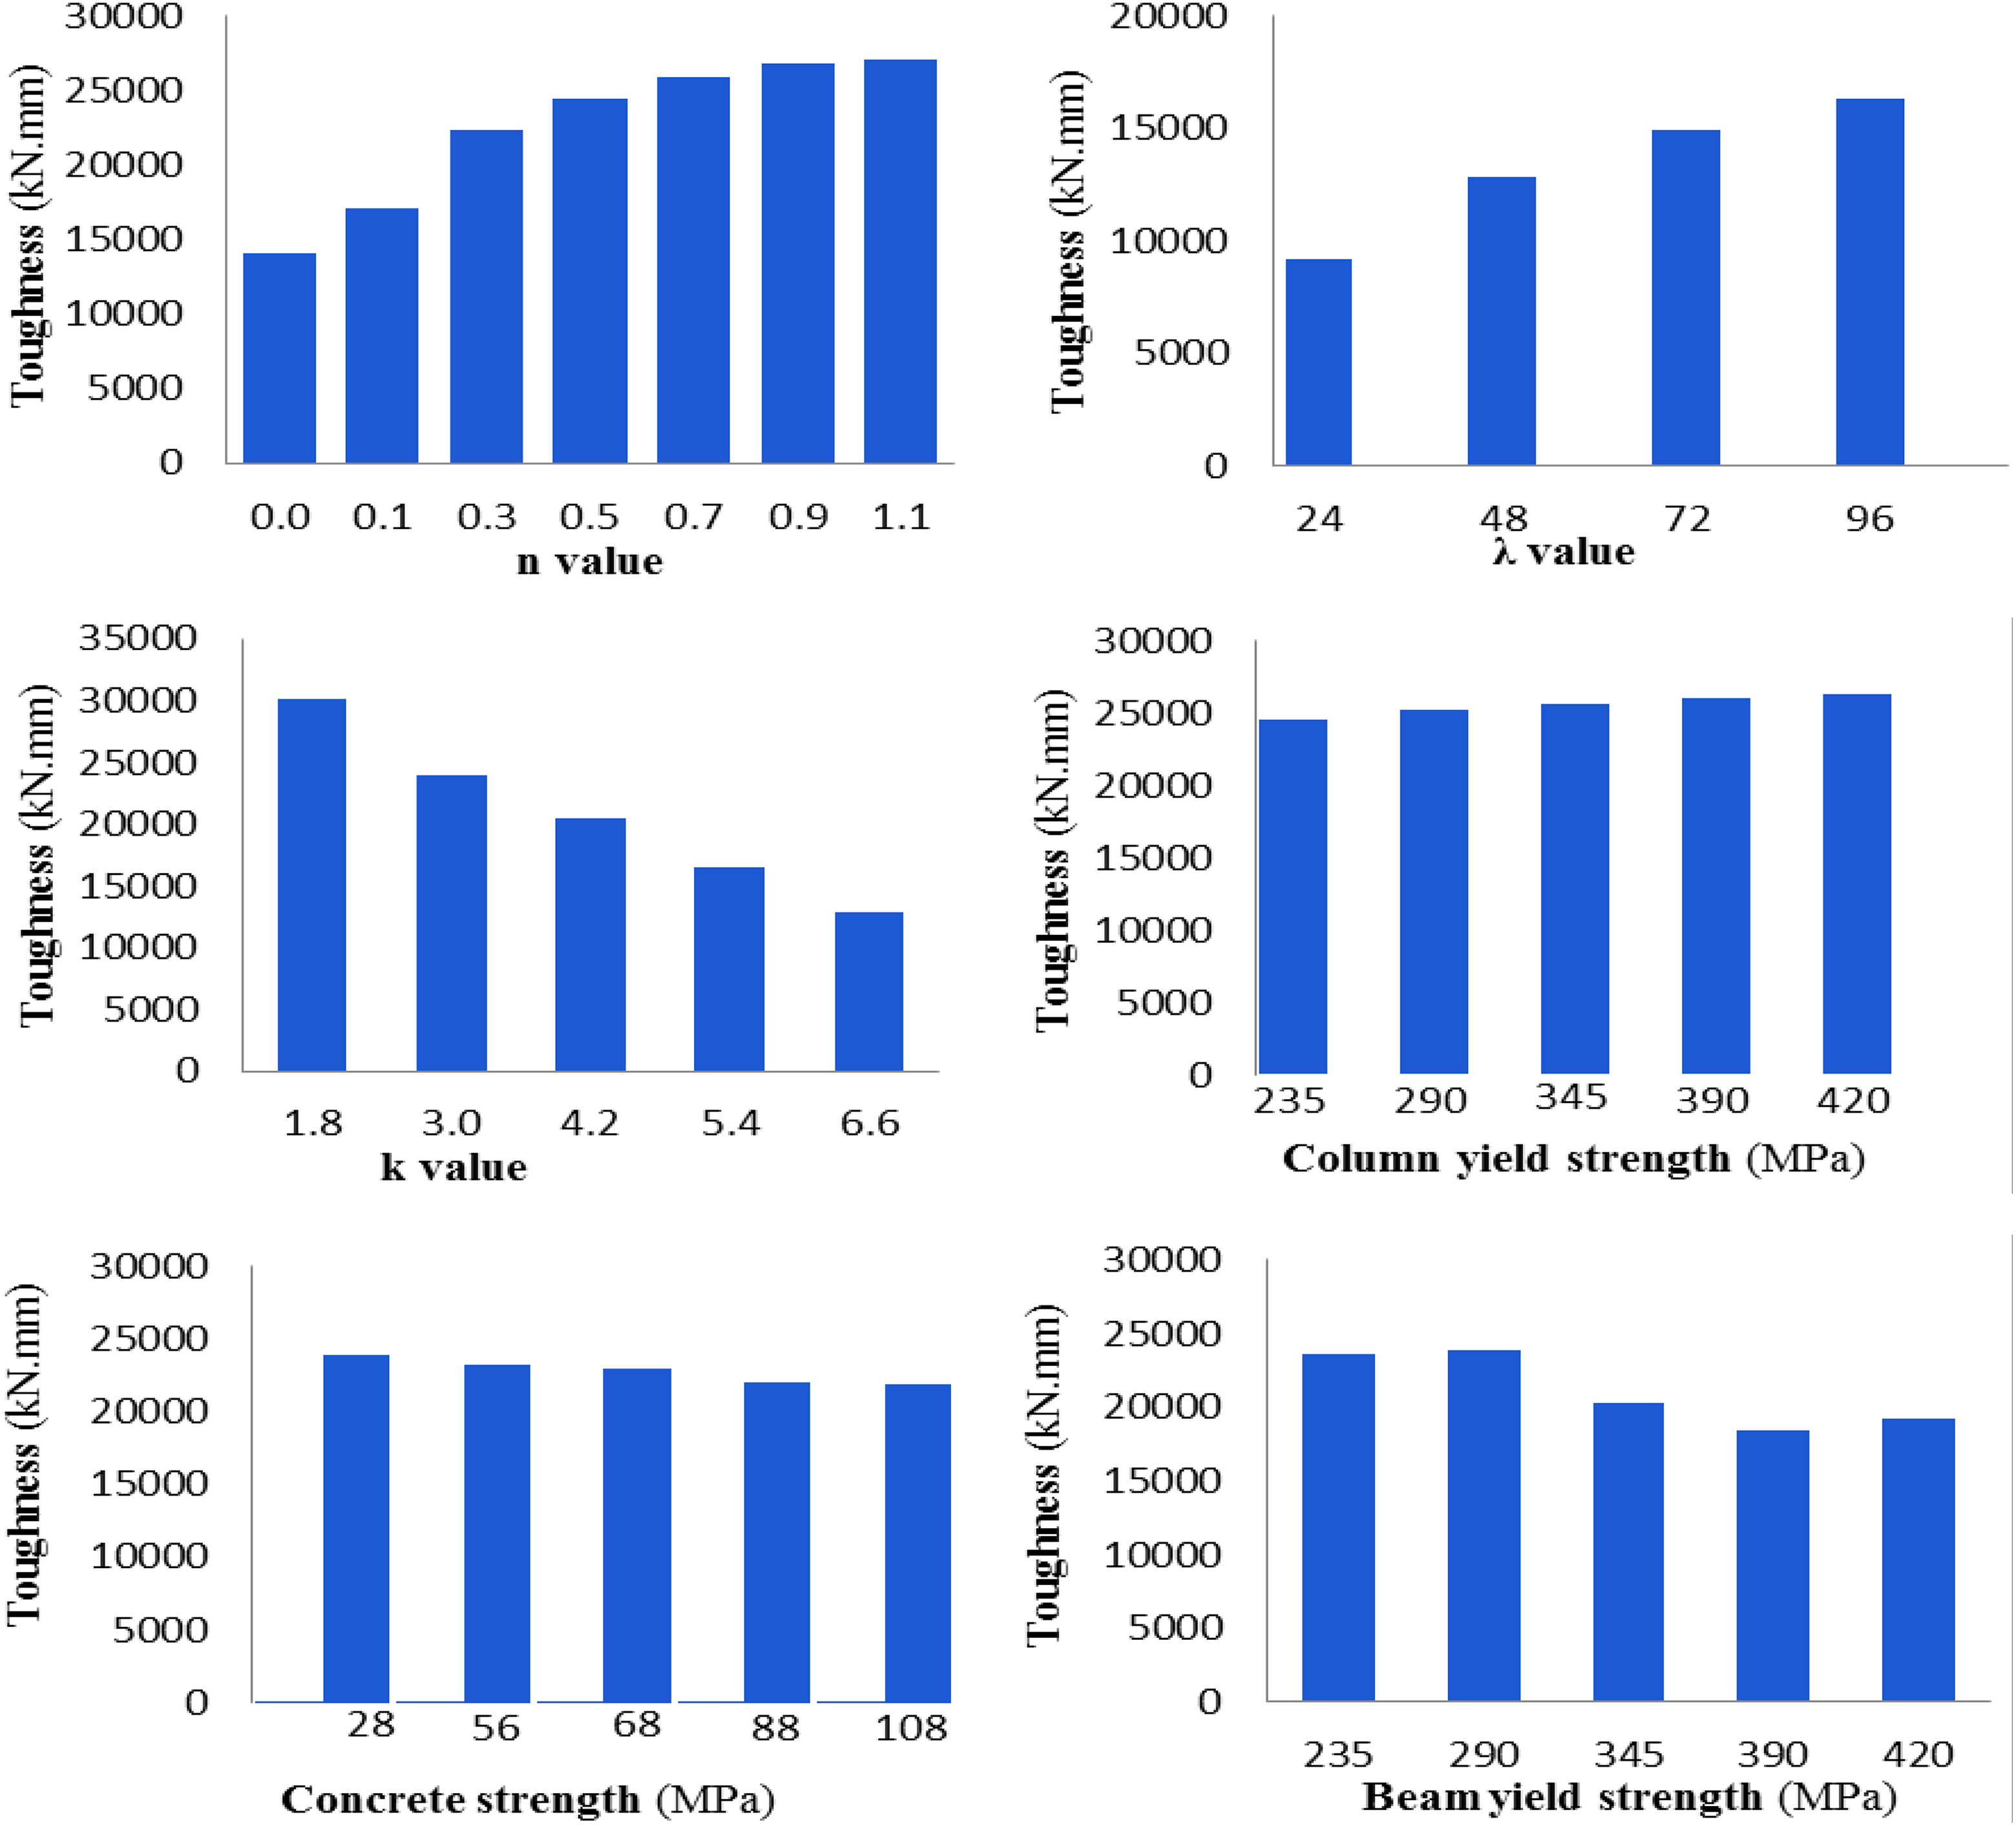
Toughness versus various studied parameters.
As the column slenderness ratio (λ) is increased, an increase in the toughness is shown. For instance, as λ is increased from 24 to 96, the toughness increases by more than 70%. Meanwhile, as the stiffness ratio of the beam–column (k) is increased, a decrease in toughness is observed. For instance, as k is increased from 1.8 to 6.6, the toughness increases by more than 50%. It is indicating that a higher beam to column linear stiffness ratio may result in lower energy absorption; however, this may be compromised by the increase in the axial load ratio. On the other hand, when investigating the material strengths, lower effects on the toughness might be obtained. As the beam’s steel strength is increased, a small decrease in the toughness is shown. For instance, as the steel yield strength is increased from 235 MPa to 420 MPa, the toughness increases by only 15%. Moreover, as the column’s tube steel strength is increased, little change in toughness is observed. The same is true when discussing the effect of the strength of concrete infill. As the composite column’s concrete strength f c is increased, no change in toughness or a very small reduction is seen as f c is increased from 28 MPa to 108 MPa. It may be indicated that the loading condition, stiffness, and slenderness ratios for the composite frames have greater effects on the toughness, which is an indicator of energy absorption.
Conclusions
The structural performance of the composite frames including CFST columns connected to the steel beam under the lateral load was studied. The FE modeling was adopted to analyze the frames by ANSYS software. The lateral load was applied up to the failure under the effects of various parameters. From the study results, at an early stage, no confinement of steel tube around the perimeter of the concrete core due to the Poisson’s ratio of concrete lower than that of steel tube so that there is no full capacity for the composite column. When the applied load increased, the longitudinal strains increased and then transverse strains also increased so that the lateral expansion of concrete gradually becomes greater than that of the steel tube. The presence of concrete inside the steel tube delays the local buckling of the tube wall and the concrete itself and reduces the buckling at the final stage loading. The contact element makes the force transfer between the steel tube and the core concrete due to the friction between the contact surface so that the composite action looks like full interactions. It was observed that the composite frames exhibited a similar failure mode. Plastic hinges were formed at the top and at the bottom of the CFST columns. No concrete core crush was observed. The lateral stiffness of the frame improved with the increase of the axial load ratio at all stages. The lateral stiffness and lateral load capacity of the composite frame increased as the slenderness of the CFST column decreased. When the linear stiffness ratio of the beam–column increased from 1.8 to 6.6, both the lateral stiffness and the maximum lateral load exhibited approximately a constant increase. Composite frames with lower steel beam strength had greater deformation capacity and thereby greater ductility than those with higher steel strengths. Frames with higher steel yield strength of the tube of CFST column had limited, improved deformation capacity. Little gain of the frame lateral strength was obtained when a huge increase of concrete core strength of CFST column was made. The composite frame displayed higher ductility, that is, higher toughness when the axial load ratio and column’s slenderness ratio were increased. While the stiffness ratio of the beam–column was increased, the frame exhibited lower toughness. Also, little effect on the toughness of the frame was found as the composite column’s steel strength and its concrete core strength were changed.
Footnotes
Declaration of conflicting interests
The author(s) declared no potential conflicts of interest with respect to the research, authorship, and/or publication of this article.
Funding
The author(s) received no financial support for the research, authorship, and/or publication of this article.