
Abstract
It is difficult to monitor lightning damage to carbon fibre-reinforced polymers (CFRPs) online. This work experimentally investigates the changes associated with the electrical resistance of CFRPs subjected to lightning strikes. Two kinds of simulated lightning currents with different amplitudes in the range of 10–80 kA were injected into the CFRP samples. By measuring and comparing the changes in the struck-side (front) surface resistance, the surface resistance of the side opposite to the struck-side (back) and the oblique resistance of each sample before and after the lightning strike, it was observed that inflection points exist in the curve of the resistance change rate. The resistance decreases with increasing peak currents before the inflection point and increases when the peak current goes beyond the inflection point. The change rate of the front surface resistance is more sensitive to the lightning damage than are those of the back surface resistance and the oblique resistance. Different simulated lightning currents have approximately the same action integrals at the inflection points of resistance change rate. The characteristics indicate that resistance change detection could be a possible method for the online monitoring of CFRP lightning damage.
Keywords
Introduction
Carbon fibre-reinforced polymers (CFRPs) are widely used in renewable energy, aviation, aerospace and other fields because of their light weight, high strength and high stiffness. 1,2 Lightning is a typical natural plasma phenomenon that causes inexorable damage to almost all directly struck materials. CFRPs used in wind turbines and aircraft are inevitably subjected to lightning threats. For a conventional metal aircraft, when a lightning strike occurs, the lightning energy can be quickly conducted away due to the high electrical conductivity of the aluminium alloy material of the structures. However, when CFRPs suffer from lightning strikes, severe damage may occur because of the relatively low electrical conductivity of the material. 3
The damage caused by lightning to metal alloys and other composite materials has been widely addressed. 4 –7 Lightning exposure can not only destroy CFRP surfaces but also cause various mechanical damage characteristics, such as delamination, fibre–matrix debonding and fibre breakage. 8 –10 Large areas of damage to CFRPs and surface damage to CFRPs can be visually inspected, but internal damage is more difficult to detect. Pulsed thermography and digital shearography technologies have been developed to investigate CFRP damage and depth positions of different sizes. 11,12 Microwaves and terahertz imaging methods have been used to detect CFRPs with an air gap or other defects in the plate. 13,14 Optical microscopy and ultrasonic scanning methods have been proposed to observe and analyse lightning damage to carbon fibre panels with fasteners. 15 However, the instruments adopted in these detection methods are expensive and require specialized sensors.
Carbon fibre has a high electrical conductivity, and its matrix material is generally composed of an insulating epoxy resin. In this way, the composite has high conductivity in the direction of the fibres but high resistivity in the transverse direction of the fibres. The composite is electrically conductive in the transverse direction due to the contact between the fibres. For the same reason, in the thickness direction, it is also conductive. According to the test results, the conductivity in the transverse direction is approximately one thousandth of that in the fibre direction, and the ratio of the electric conductance between the transverse direction to the through-thickness direction is approximately 10. 16 Chung and Wang 17 used this property to achieve self-perception of the damage and strain of carbon fibre composites through direct current (DC) resistance measurements and summarized the model of the relationship between the fatigue damage and resistance. The resistance method is sensitive to slight changes in the structure, requires simple equipment, can be applied to materials or components of different sizes and has been extensively studied. 18 –20 However, the relationship between resistance changes and damage caused by lightning is discussed in few published studies. The types and characteristics of lightning damage are complicated. Many experimental results have shown that damage caused by stress and fatigue is significantly different from that caused by lightning. 4,5
In the research of CFRP lightning damage, most lightning waveforms refer to the standards MIL-STD-464 21 and SAE-ARP-5412. 22 The waveforms in the standards (Figure 1) consist of the first return stroke (component A), the intermediate current (component B), the continuing current (component C) and the subsequent return stroke current (component D). Components A and D with high current amplitudes and significant impulse properties are typically considered.
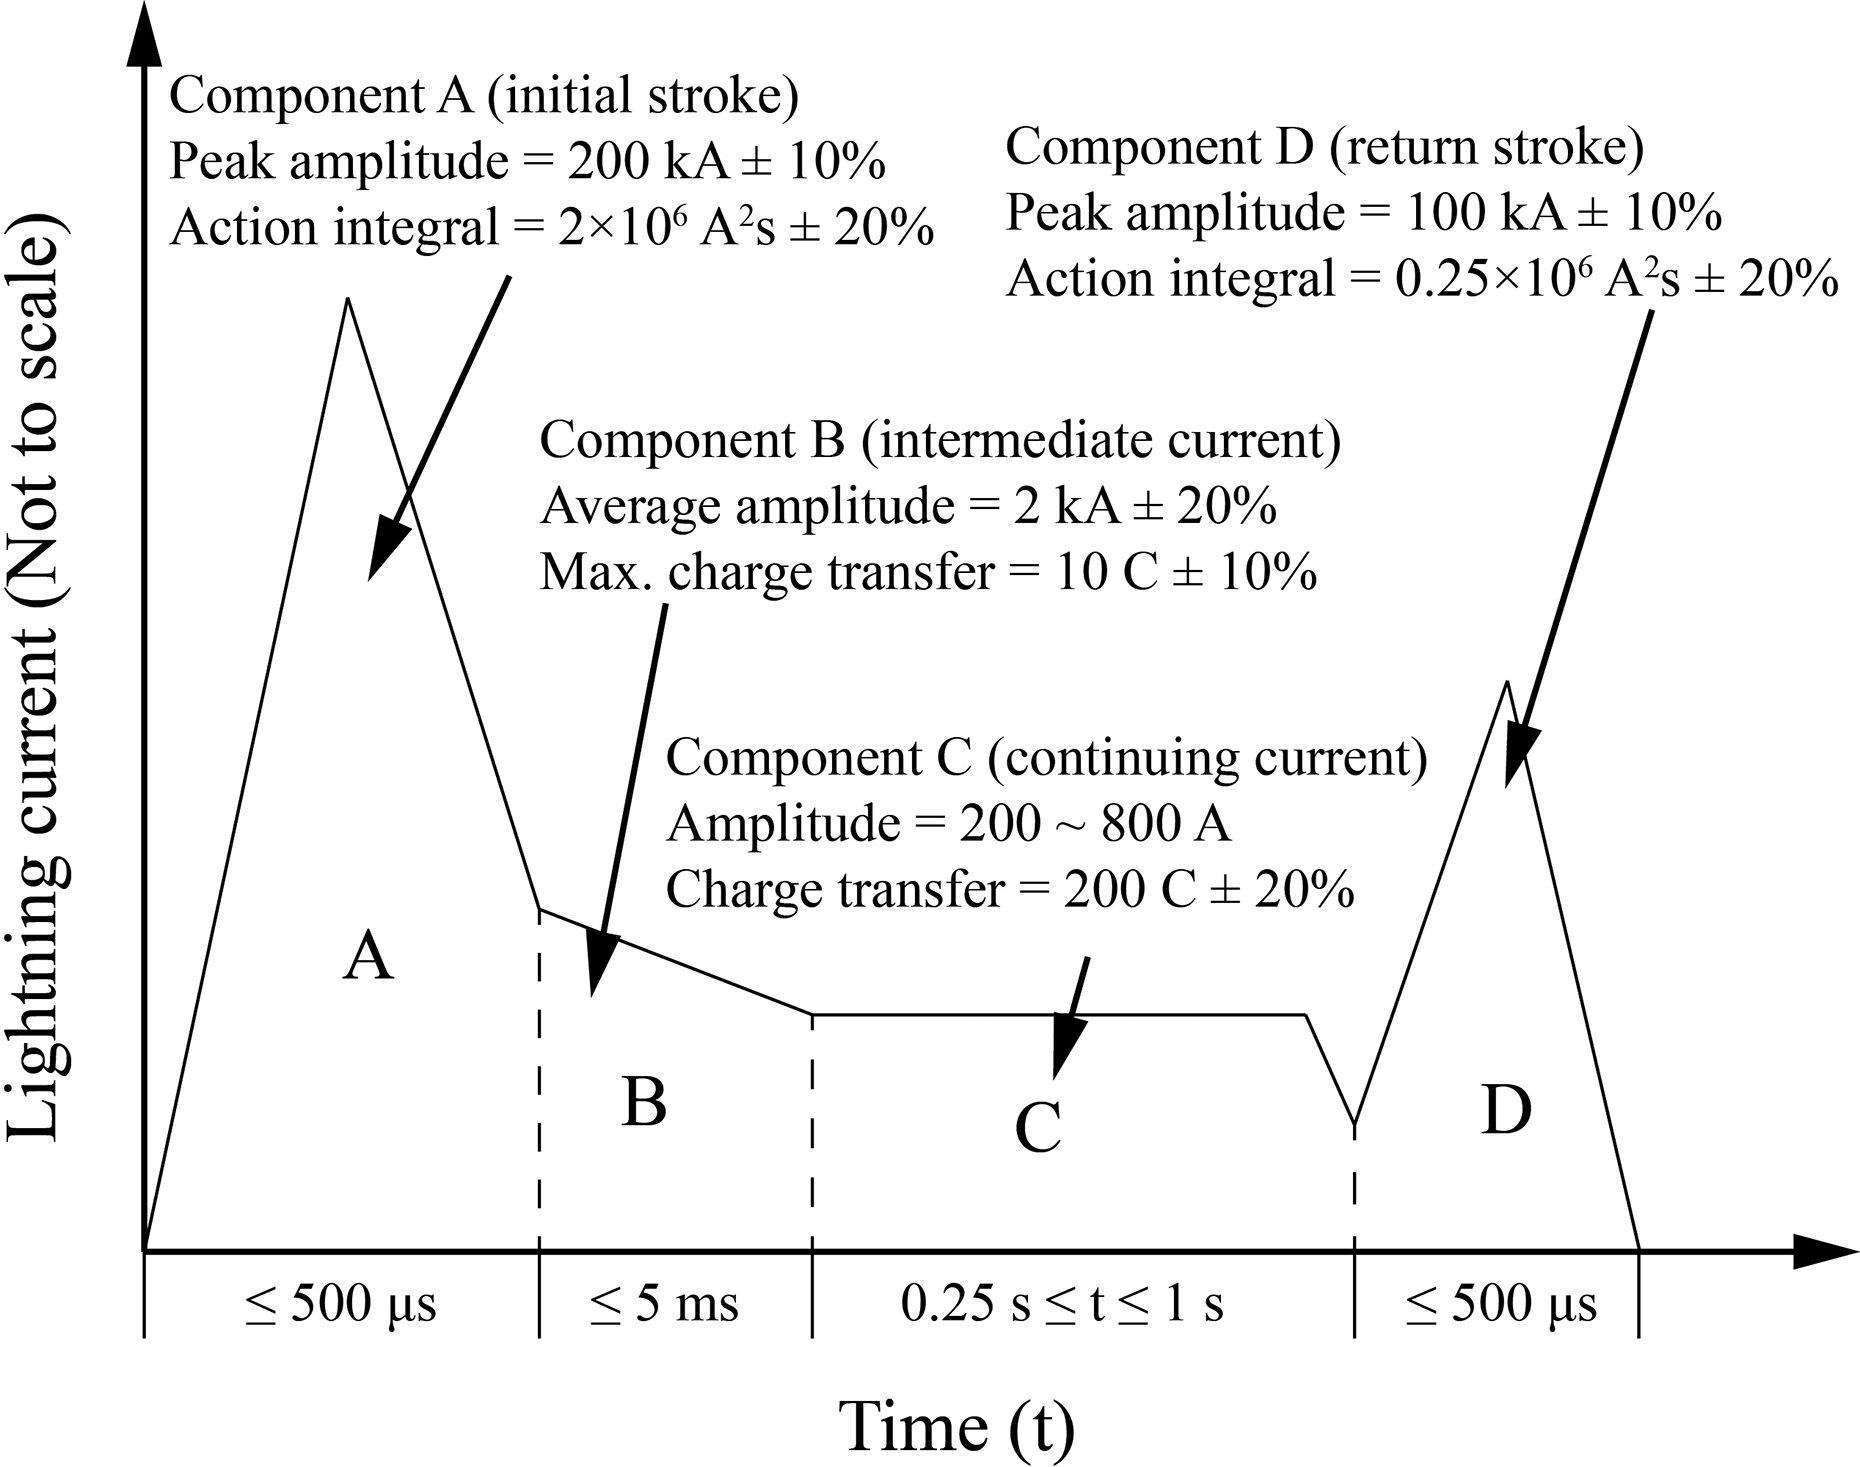
Current components A through D. 22
The purpose of this investigation is to explore a possible new method for detecting lightning strike damage in CFRPs. Compared with other existing CFRP damage detection methods, the method can achieve quasi-real-time online detection by utilizing the resistance changing characteristics of materials without expensive sensors. Components A and D with different amplitudes are adopted for the simulation of lighting impulse currents. The resistance of CFRPs was measured by the four-probe method before and after a lightning strike. The relationships between the resistance change and the peak current and action integral were obtained. The reasons for this phenomenon are explained qualitatively. An example of how to use this method to detect lightning strike damage is illustrated.
Materials and methods
Sample preparation
Flat panels of carbon fibre/epoxy (TC35/FRD-Y360, and the fibre mass fraction of the composites was 67%) composites were fabricated and machined to the final dimensions of 250 mm (longitudinal) × 50 mm (width) × 2 mm (thickness) in Figure 2. The stacking sequences of the samples were

Layout of the measurement electrodes.
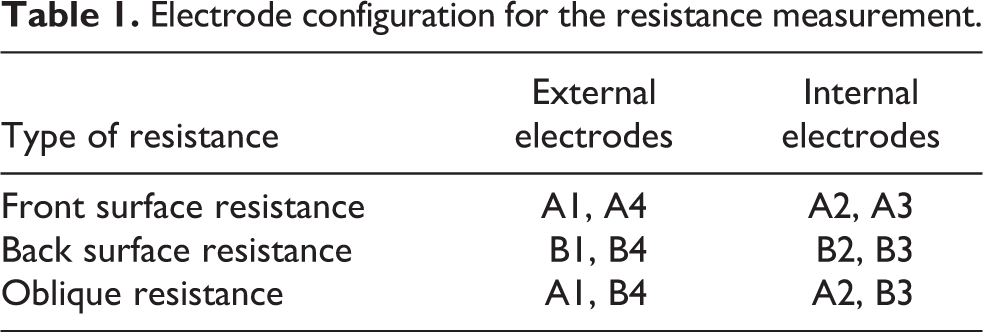
Electrode configuration for the resistance measurement.
Test set-up and waveform
The electrodes used for the measurements required special handling to ensure the accuracy and stability of the measurements. The areas for the eight measurement electrodes were polished with sandpaper and cleaned. A 0.5 mm-diameter copper wire with conductive silver paste (SINWE 3703), which was used as a measurement electrode, was placed on the area and left for 24 h at room temperature. Finally, each electrode was coated with epoxy resin and left for another 24 h at room temperature for solidification and fixation.
The resistance values were measured using the four-probe method, that is, the two external electrodes were connected to an adjustable DC power supply to generate an injecting current (I), and the internal two electrodes were used for the voltage (U) measurement. The resistance was calculated according to Ohm’s law, R DC = U/I. The surface resistance is sensitive to fibre damage, whereas the oblique resistance is more sensitive to delamination damage. 23
Before the lightning strike test, three kinds of resistance were measured. Three tests were performed at each current level, with a new sample used for every test. After the lightning strike test, the three kinds of resistance were measured.
Figure 3 shows the test schematic. In the schematic, L is the equivalent inductance of the circuit, including the regulating inductance and stray inductance of the circuit; R is the equivalent resistance of the circuit, including the regulating resistance and connecting resistance; C is the total capacitance of the circuit; and OSC is the oscilloscope for the current and waveform measurements. The impulse current generator developed using this structure outputs a simulated lightning impulse current, and the generated double-exponential current waveform can be expressed as

Schematic of the simulated lightning current test.
Here,

Lightning current waveform definition (a) and the measured waveforms (b).
Detailed experimental conditions of the samples.

A clamp designed for the test is shown in Figure 5. During the test, the sample was tightly attached to the left and right aluminium blocks, and the electrode was located 3 mm above the sample surface. The simulated lightning current was injected into the centre point of a sample as an arc discharge.

Clamp and connection.
Results and discussion
Test phenomenon
A typical example of morphological damage after a lightning test is shown in Figure 6. Visual inspection revealed carbon fibre breakage and ablation in the through-thickness direction from the surface at the attachment point (the centre point of the plate). There are many filaments resembling burst shapes in the direction of the fibres, which resulted from the high temperature of the arc causing the carbon fibre on the surface of the CFRP to pyrolyse and explode. The explosion tore the fibres and the epoxy matrix, and the damage profile occurred in an irregular shape, which was long in the direction of the fibre and short in the direction vertical to the fibre. The damaged area increased with the current amplitude. No damage was observed at the back surface, which means that the damage only occurred within a few plies near the attachment point. The lightning current flowed through several plies, and the arc did not penetrate all plies.
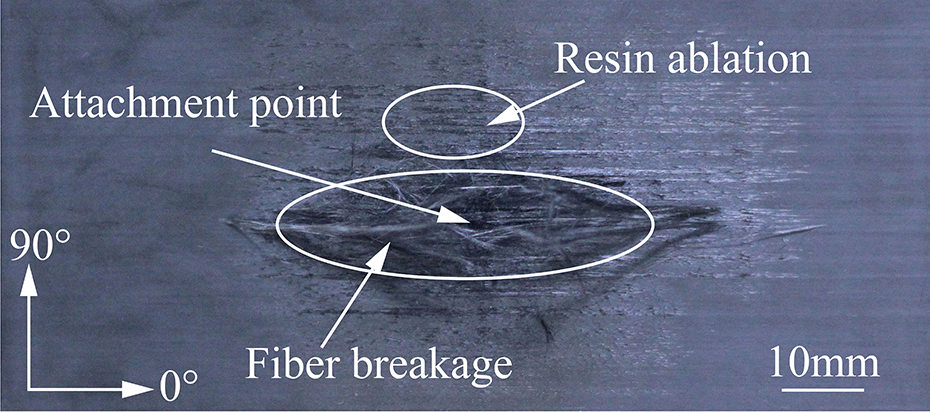
Damage morphology of the sample after the lightning strike (component D, 57.34 kA).
Data processing
The current characteristics of components A and D are characterized by the peak currents and action integrals. The action integral (AI) injected into the sample was calculated according to equation (2) after each test

where i is the lightning current flowing through the sample and t is the time covering the duration of the waveform. The resistances of the same waveform at the same current level before and after the test were obtained in the following way. Three samples were used, and each sample was tested once. The average value of three tests was taken.
The change rate of the resistance before and after a lightning strike test is defined as

where R 0 is the DC resistance before the test and R 1 is the DC resistance after the test.
Resistance change rate under different lightning current components
Components A and D were used to conduct lightning tests on the CFRPs, and then the change rates of the resistance of the samples after the lightning test were measured and calculated. By using B-spline, the relationship between the change rates of the resistance and the peak current and the action integral were obtained, as shown in Figure 7(a) and (b), respectively. As shown in the figure, the resistances of all three types decreased first and then increased under the action of lightning peak currents.

The relation between the change rate of the resistance and the (a) peak current and (b) action integral.
Figure 7(a) shows the curves of the resistance change rates of the samples subjected to different peak currents of components A and D. The change trends of the resistance can be obtained from the curves. For component A, the minimum values of the front surface resistance, back surface resistance and oblique resistance were −13.93%, −8.59% and −10.84%, which were lower than the values before the lightning test, respectively. Correspondingly, the peak current inflection points appeared at approximately 35.93 kA, 35.49 kA and 36.67 kA. When the peak current was less than the inflection point, the resistance was negatively correlated with the peak current. Thus, the larger is the peak current, the smaller is the resistance until the inflection points are reached. For example, when the peak current increased from 0 to the inflection point of 35.93 kA, the surface resistance rate decreased from 0 to the minimum value of −13.93%. As the current increased, the resistance increased from the minimum, and the corresponding resistance rate ranged from −13.93% to 0 and then increased. For component D, the minimum values of the front surface resistance, back surface resistance and oblique resistance were −15.29%, −10.39% and −11.50%, which were lower than the values before the lightning test, respectively. Correspondingly, the current inflection points appeared at approximately 50.82 kA, 50.31 kA and 51.33 kA. It can be seen from the figure that the position of the inflection point of the peak current is related to the current waveform. The average current inflection point for component A appears at approximately 36 kA, while the average current inflection point under component D appears at approximately 51 kA.
Figure 7(b) shows the relationships between the action integral and the resistance change rates after testing of the two kinds of lightning components. For component A, the minimum values of the front surface resistance, back surface resistance and oblique resistance correspond to the action integral inflection points that appear at approximately 67.03 × 10³ A2s, 65.27 × 10³ A2s and 69.81 × 10³ A2s, respectively. The average inflection point of the action integral under component A appears at approximately 67.37 × 10³ A2s. For component D, the minimum values of the front surface resistance, back surface resistance and oblique resistance correspond to the action integral inflection points appearing at approximately 70.11 × 10³ A2s, 68.64 × 10³ A2s and 71.72 × 10³ A2s, respectively. The average inflection point of the action integral under component D appears at approximately 70.16 × 10³ A2s, which is very close to the average inflection point of the action integral of component A. It seems that the positions of the inflection point of the action integral have little to do with the current waveforms. Different waveforms have approximately the same action integrals at the inflection points, even if the rates of resistance change at the inflection points are different.
It can be seen from Figure 7(a) and (b) that for the same current component, when the current amplitude or the action integral was the same, the front surface resistance change rates were always more significant than the oblique resistance change rates and the back surface resistance change rates, which may have been due to the most severe damage occurring to the front surface during lightning strikes and minimal damage occurring on the back surface.
During the front surface resistance measurement process, DC current flowed along two paths. One current flowed from the current injection electrode A1 into the inner layer of the CFRP and then came out to the current collection electrode A4, and the other flowed along the front surface of the CFRP. The resistance in the thickness direction of the plate was much larger than the resistance in the direction of the fibre. The DC current in the thickness direction sharply decreased as the thickness increased, and the DC current was concentrated on the top layer and the layer near the front surface. The front surface resistance mainly reflects the damage to the top layer and to the internal layer near the front surface. The oblique resistance is not sensitive to damage to the top layer, as it mainly reflects delamination damage, and the back surface resistance mainly reflects back damage and damage to the internal layer near the back surface. Therefore, the change rate of the front surface resistance is more sensitive to the lightning damage than is that of the back surface resistance and the oblique resistance.
From Figure 7(b), it can also be found that the three kinds of resistance change rates under component D were larger than those under component A for the same action integral. When a lightning current flows through a CFRP, a large amount of Joule heat is generated, and the epoxy resin in the CFRP is pyrolysed. If the temperature is high enough, the fibre will also sublime. The action integral of the injected current reflects the energy injected into the CFRP, and the same energy leads to the same damage to the CFRP. However, for different lightning waveforms, the current amplitude varies significantly when the action integral is the same. For example, the current amplitude of component D was larger than that of component A. Larger current amplitudes result in stronger shock waves, 25 which in turn cause more severe delamination and fracturing, possibly resulting in more pronounced resistance changes.
Possible mechanism of the CFRP resistance change during a lightning strike
After the lightning strikes, the front surface resistance, back surface resistance and oblique resistance of the CFRP showed no monotonous changes. With increasing peak current, the resistance first decreased and then increased. It is believed that the damages caused by lightning strikes such as resin carbonization and insulation degradation, graphitization, delamination and matrix cracking, and carbon fibre breakage significantly influence the electrical conductivity of CFRP materials and the combined effects of these damages resulted in the no monotonous changes of the resistances.
Resin carbonization and insulation degradation
The high temperature and high electric field intensity during a lightning strike will lead to thermal and electrical breakdown, resulting in deterioration of the resin.
The thermal breakdown is caused by the Joule heating of an electric arc and a current passing through the carbon fibre filament. During the simulated lightning current test, the attachment point had a very high temperature, which was enough to carbonize the epoxy resin. The current flowing through the carbon fibre filament and the high heat also caused carbonization of the epoxy resin near the carbon fibre filament. The resin began to lose its non-carbon atoms. The non-carbon atoms in the resin were expelled, and the remaining carbon atoms were closely arranged to render the epoxy conductive. 26
The electrical breakdown of insulating materials typically occurs in high-voltage environments, which will cause the insulating material to lose its insulating property. Von Hippel 27 believes that in polymer dielectric materials, such as epoxy resin, the positive ions in the material are almost unaffected by the applied electric field, but if the applied electric field is large enough, the electrons can pass through the material. Under high electric fields, electrons move towards the anode, leaving positive ions behind. Ions with positive charges can interfere with the electric field distribution, resulting in an ionization process. Repeating this ionization process weakens the insulation properties of the material, causing degradation of the insulation properties of the resin and ultimately resulting in electrical breakdown, 28 which will lead to a significant reduction in the electrical resistance. The resin carbonization and insulation degradation damage becomes more severe with the increase of the amplitude of the injected current and correspondingly decreases the resistance.
Graphitization
In addition, Gupta et al. 29 found that at high temperatures, the order of the carbon structure of carbon fibre materials will be improved, showing a trend of graphitization, and graphitization has been proven to contribute to an improvement in the electrical conductivity of carbon fibres. The graphitization damage becomes more severe as the amplitude of the injected current increases, which also leads to a decrease of the resistance.
Delamination and matrix cracking
Lightning current can be regarded as a special external impact that can simultaneously generate Joule heat, shock waves and electromagnetic forces within a short time. Due to its limited conductivity, when the energy of a lightning current was deposited on the surface of the carbon fibre resin matrix composite sample, an arc attachment area of high temperature occurred, and the temperature far exceeded the pyrolysis gasification temperature (approximately 600 K) of the resin, which made the sample near the attachment area undergo gap ablation. During the process of current conduction, the epoxy resin was heated, burned, pyrolysed and decomposed into gases. These gases were trapped in the plies. As the temperature increased, the gas pressure increased, and an explosion occurred near the attachment point of the lightning strike, resulting in large areas of delamination damage. In addition, the sound generated by the lightning strike and other forms of shock wave acted as external loads on the carbon fibre composite, further causing cracks, CFRP delamination and fibre–matrix debonding in the carbon fibre resin composite.
Because of random fibre-to-fibre contacts, CFRP is conductive in the thickness direction. 30 Delamination damage appearing in the CFRP will reduce the contact between the fibres, cut off part of the current flow path and reduce the ability of the carbon fibre resin matrix composite material to allow the flow of current. Obviously, delamination damage will lead to an increase in resistivity. 16,31 The delamination and matrix cracking damage becomes more severe with the increase of the amplitude of the injected current, leading to an increase of the resistance. Figure 8 shows the cross-sectional morphology of a CFRP observed using an optical microscope (Leica/M125, Germany) after a lightning strike test. The ‘ablative pit’ produced by the lightning current is surrounded by some broken, upturned, fluffy carbon fibres. Below the ablation pit, some layers of the CFRP are separated, and these layers are close to the front surface.

Cross-sectional observation results (component A, 20.9 kA).
Fibre breakage
Since the epoxy resin is insulated, the conductivity of the carbon fibre composite will be determined by the carbon fibre. Therefore, the composite material has a high electrical conductivity in the fibre direction. When a simulated lightning current acts on CFRPs, the high temperature of the arc and the lightning current with a high current density vaporize the fibre or pull some of the fibres apart when the material vaporizes. As shown in Figure 8, fracturing of the carbon fibre occurs on the surface and in several layers near the surface. Fibre breakage results in a decrease in the conductive path, which significantly reduces the conductivity of the CFRP. With the increase of the injected current, the fibre breakage damage becomes more serious, and the resistance also increases.
During a lightning strike, these damages, that is, the resin carbonization and insulation degradation, graphitization, delamination and matrix cracking, and carbon fibre breakage, occur almost simultaneously in a short time. The compound effects of these damages resulted in the resistance change behaviour of the CFRP. If the injected lightning current is relatively low, graphitization, resin carbonization and insulation degradation play the major role, showing that the resistance decreases with the peak current increase. When the injected lightning current reaches a certain amplitude, carbon fibre breakage, delamination and matrix cracking play the significant role, resulting that the resistance increase with the peak current increase. The combination of the above factors leads to the occurrence of an inflection point on the curve of the resistance change rate.
Algorithm of the application
By using B-spline, the relationship between the change rates of the resistance and the peak current and action integral were obtained, as shown in Figure 7(a) and (b). The fitting curves could be regarded as the characteristic curves of this type of sample under corresponding impulse current damage. Such characteristic curves could be used for the detection of lightning damage, that is, to infer the peak current and action integral causing such damage from the detected three kinds of resistance change rates. For the change rate of the resistance, there are usually two different corresponding peak currents or action integrals. The algorithm includes six steps when the resistance change rate curves are used for detecting CFRP lightning damage. For the illustration purpose, the derived data corresponding to the case with the detected front surface, back surface and oblique resistance change rates being −13.6%, −7.87% and −10.31%, are all summarized in Table 3, respectively, as follows:
Peak current and action integral parameters derived from the three kinds of resistance change rates.

RMS: root mean square.
a Average of the peak currents before the inflection point of component A: 33.07 + 30.43 + 32.93 = 32.14 kA.
b RMS error of the peak currents before the inflection point of component A:
c Total error of component A before the inflection point:
Step 1: According to Figure 7(a), for component A, the front surface resistance change rate (−13.6%) corresponds to two peak currents (33.07 kA and 56.91 kA) in the ‘A-front’ curve. The smaller one (33.07 kA) is used as the peak current before the inflection point, and the larger one (56.91 kA) is used as the peak current after the inflection point. The peak currents corresponding to the other two resistance change rates are similarly obtained in this way from the ‘A-back’ and ‘A-oblique’ curves. Step 2: Referring to ‘Note a’ and ‘Note b’ of Table 3, for component A, calculate the ‘Average’ (32.14 kA and 39.80 kA) and ‘root mean square (RMS) error’ (1.21 and 0.97) of the peak currents before and after the inflection point. Step 3: For component D, repeat steps 1 and 2, and find the peak currents from the ‘D-front’, ‘D-back’ and ‘D-oblique’ curves in Figure 7(a), and calculate the ‘Average’ (38.85 kA and 58.69 kA) and ‘RMS error’ (3.16 and 0.12), respectively. Step 4: For the ‘Action integral’ parameters, referring to the six curves in Figure 7(b), similarly repeat steps 1–3, look up the corresponding action integral parameters before and after the inflection points from the given resistance change rates, and calculate the ‘Average’ and ‘RMS errors’ of components A and D. As shown in Table 3, the calculated ‘RMS errors’ of components A and D are 3.98, 3.98 and 6.53, 0.52, respectively. Step 5: Calculate and compare the ‘Total error’ before and after the inflection point for components A and D, respectively. The ‘Total error’ is defined as the square root of the sum of squares of ‘peak current RMS error’ and ‘action integral RMS error’, as shown in ‘Note c’ of Table 3. It is obvious that 0.54 is the smallest total error. Step 6: Based on the criteria of data consistency, the resistance change or damage is most possibly caused by the current waveform with the least ‘Total error’ and with the corresponding peak current and action integral. For the example case with the front surface, back surface and oblique resistance change rates given as −13.6%, −7.87% and −10.31%, respectively, it can be deduced that the damage current would be an impulse current with the waveform of component D, with a peak current of 58.69 kA and an action integral of 95.63 × 10³ A2s.
From the above case, it is seen that resistance change detection could be a potential method for the online monitoring of the CFRP lightning damage.
Conclusions
Aiming to explore a new possible detection or monitoring method for CFRP damage under lightning strikes, the investigation in this work focused on the resistance characteristics of CFRPs under simulated lightning currents. This experimental investigation demonstrated that the resistance variation can be an effective indicator reflecting damage to CFRPs under lightning strikes. Two kinds of lightning current waveforms were used to investigate the changes in the front surface resistance, back surface resistance and oblique resistance after simulated lightning strikes. It can be concluded that the change rates of the three types of resistance have inflection points, and the change rate of the resistance increases with an increase in the peak current before the inflection point. The change rate decreases when the peak current goes beyond the inflection point, the change rate of the front surface resistance is more sensitive to the lightning damage than are those of the back surface resistance and oblique resistance. Different simulated lightning currents have approximately the same action integrals at the inflection points of resistance change rate.
This work provides a qualitative discussion of the various possible causes of the inflection point and proposes that the change in the resistance after a lightning strike is a result of multiple factors, such as the matrix fractures in the same layer, delamination, epoxy insulation deterioration, fibre breakage and graphitization of the carbon fibres. At the same time, these reasons are coupled to each other. For example, when a lightning current is injected, these effects occur at the same time, which makes quantification and modelling extremely difficult and beyond the scope of the current research. Thus, the work described in this article is the first stage of a long-term research project.
The present investigation was carried out on the resistance characteristics of CFRPs using components A and D, and the effects of the other components, such as components B and C, are not considered. The impacts of different material thicknesses and technological processes, such as the orientation of the fibres, stacking sequence, matrix material and bonding affinity between the fibres and the matrix, require follow-up studies. The findings are helpful for use in further research on the ablation characteristics and delamination of CFRP laminates and can also be used to evaluate the degree of lightning damage online.
Footnotes
Declaration of conflicting interests
The author(s) declared no potential conflicts of interest with respect to the research, authorship and/or publication of this article.
Funding
The author(s) disclosed receipt of the following financial support for the research, authorship and/or publication of this article: This work was supported by the National Key R&D Program of China (grant no. 2017YFC1501506).