
Abstract
The supply of institutional credit plays an important role in promoting agricultural growth and also saving the farmers from the clutches of private moneylenders who charge exorbitantly high rates of interest and force them to live in perpetual debt trap. There has been a phenomenal increase in the flow of institutional credit to agriculture in the recent years but this has been quite uneven between regions. As of 2018–2019, the Southern Region had the highest share (43.0 %) in the institutional credit followed by Northern Region (21.0 %), Central Region (13.6 %), Western Region (12.0 %), Eastern Region (9.0 %) and North Eastern Region (0.9 %) respectively. Despite so much talk about the need for green revolution in Eastern India, the institutional credit to agriculture in almost all the Eastern and North Eastern states has been very poor. Based on various standard criteria such as credit–deposit ratio, credit absorption capacity, level of agricultural diversification and untapped potentials for higher agricultural growth and poverty reduction, farmers in the eastern states deserve a better deal in terms of access to institutional credit. Besides, the article explodes the myth of low credit absorption of farmers in Eastern India.
Keywords
Introduction
Access to adequate institutional credit by farmers at affordable rates of interest, assumes special significance in India, for a number of reasons. First, institutional credit can play a significant role in saving the farming community from the clutches of private moneylenders, who charge usurious rates of interest and exploit. Second, small and marginal farmers in India have hardly any investible surplus of their own and therefore, inadequate supply of institutional credit is likely to constrain input use as well as investment in agriculture and consequently agricultural productivity growth.
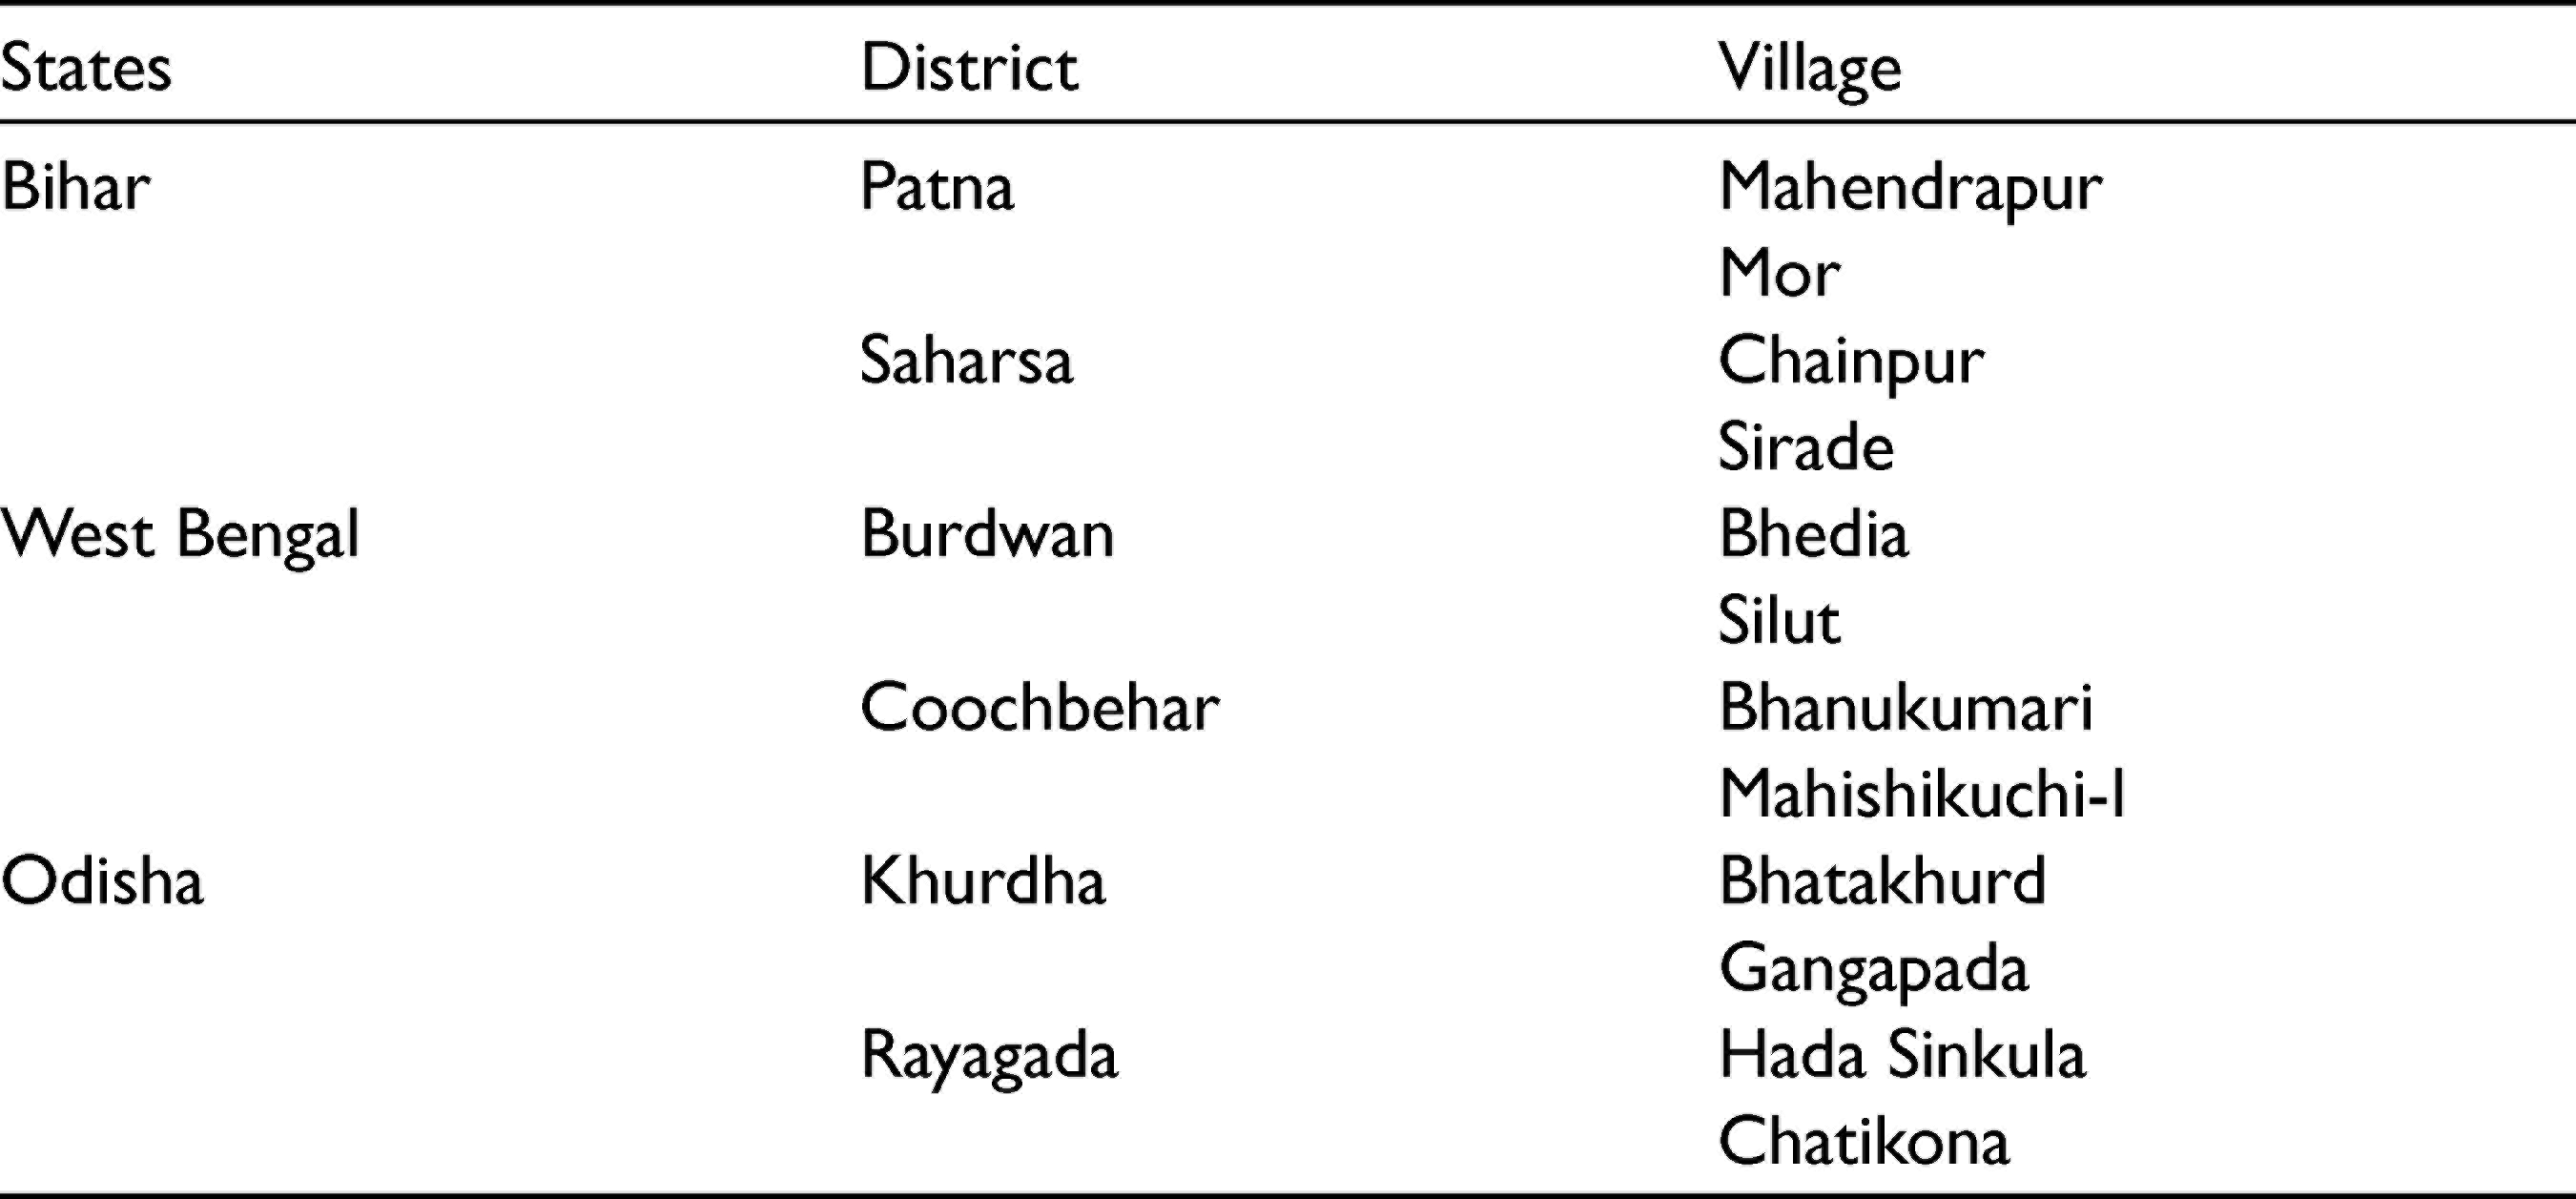
There has been a phenomenal increase in the flow of institutional credit to agriculture and allied activities in India in recent years. But several past studies and reports have indicated that there is wide regional imbalance and unequal access by small farmers to institutional credit disbursed for agriculture (Chavan, 2005; Haque & Verma, 1988; Ministry of Agriculture, 2010; Mohan, 2004; Reserve Bank of India [RBI], 2004; Subbarao, 2012). The Vyas Committee pointed out about a decade ago that not only the share of agricultural credit in total credit is declining, but also the pace of credit to agriculture is slowing, especially for term loans and regional imbalance seems to be widening and the share of small farmers in credit disbursed is declining (RBI, 2004). Eastern India which continues to be underdeveloped both agriculturally and economically, seem to suffer most from inadequacy of institutional credit. This article analyses the nature and extent of regional inequality in the flow of institutional credit to agriculture in India with special reference to Eastern India, comprising mainly Bihar, Jharkhand, Odisha, West Bengal and Eastern Uttar Pradesh. The article is based on both secondary and primary data. 1 For the purpose of primary data, a detailed questionnaire was prepared and canvassed among 1,200 farm households in the districts Patna and Saharsa of Bihar, Burdwan and Cooch Behar of West Bengal and Khurda and Rayagada of Odisha. About 200 farmers from each of the six districts were interviewed. Of the total sample, 506 were marginal farmers, 371 small farmers, 212 semi–medium farmers, 79 medium farmers and 32 large farmers. Also, 393 were self-cultivator cum tenant and 125 were pure tenants formed a part of the total samples. Of the total 1,200 sample farm households, 1,087 were male-headed and 113 female-headed households.
Trends in Direct and Indirect Institutional Credit
The total institutional credit for agriculture and allied activities in India increased overtime quite substantially. The total direct loans issued increased from ₹883 crore in 1971–72 to ₹682,833 crore in 2013–2014. The direct loans outstanding increased from 1,865 crore in 1971–72 to ₹705,828 in 2013–2014. The indirect institutional loans outstanding also increased from ₹369 crore in 1971–72 to ₹614,147 crore in 2013–2014.
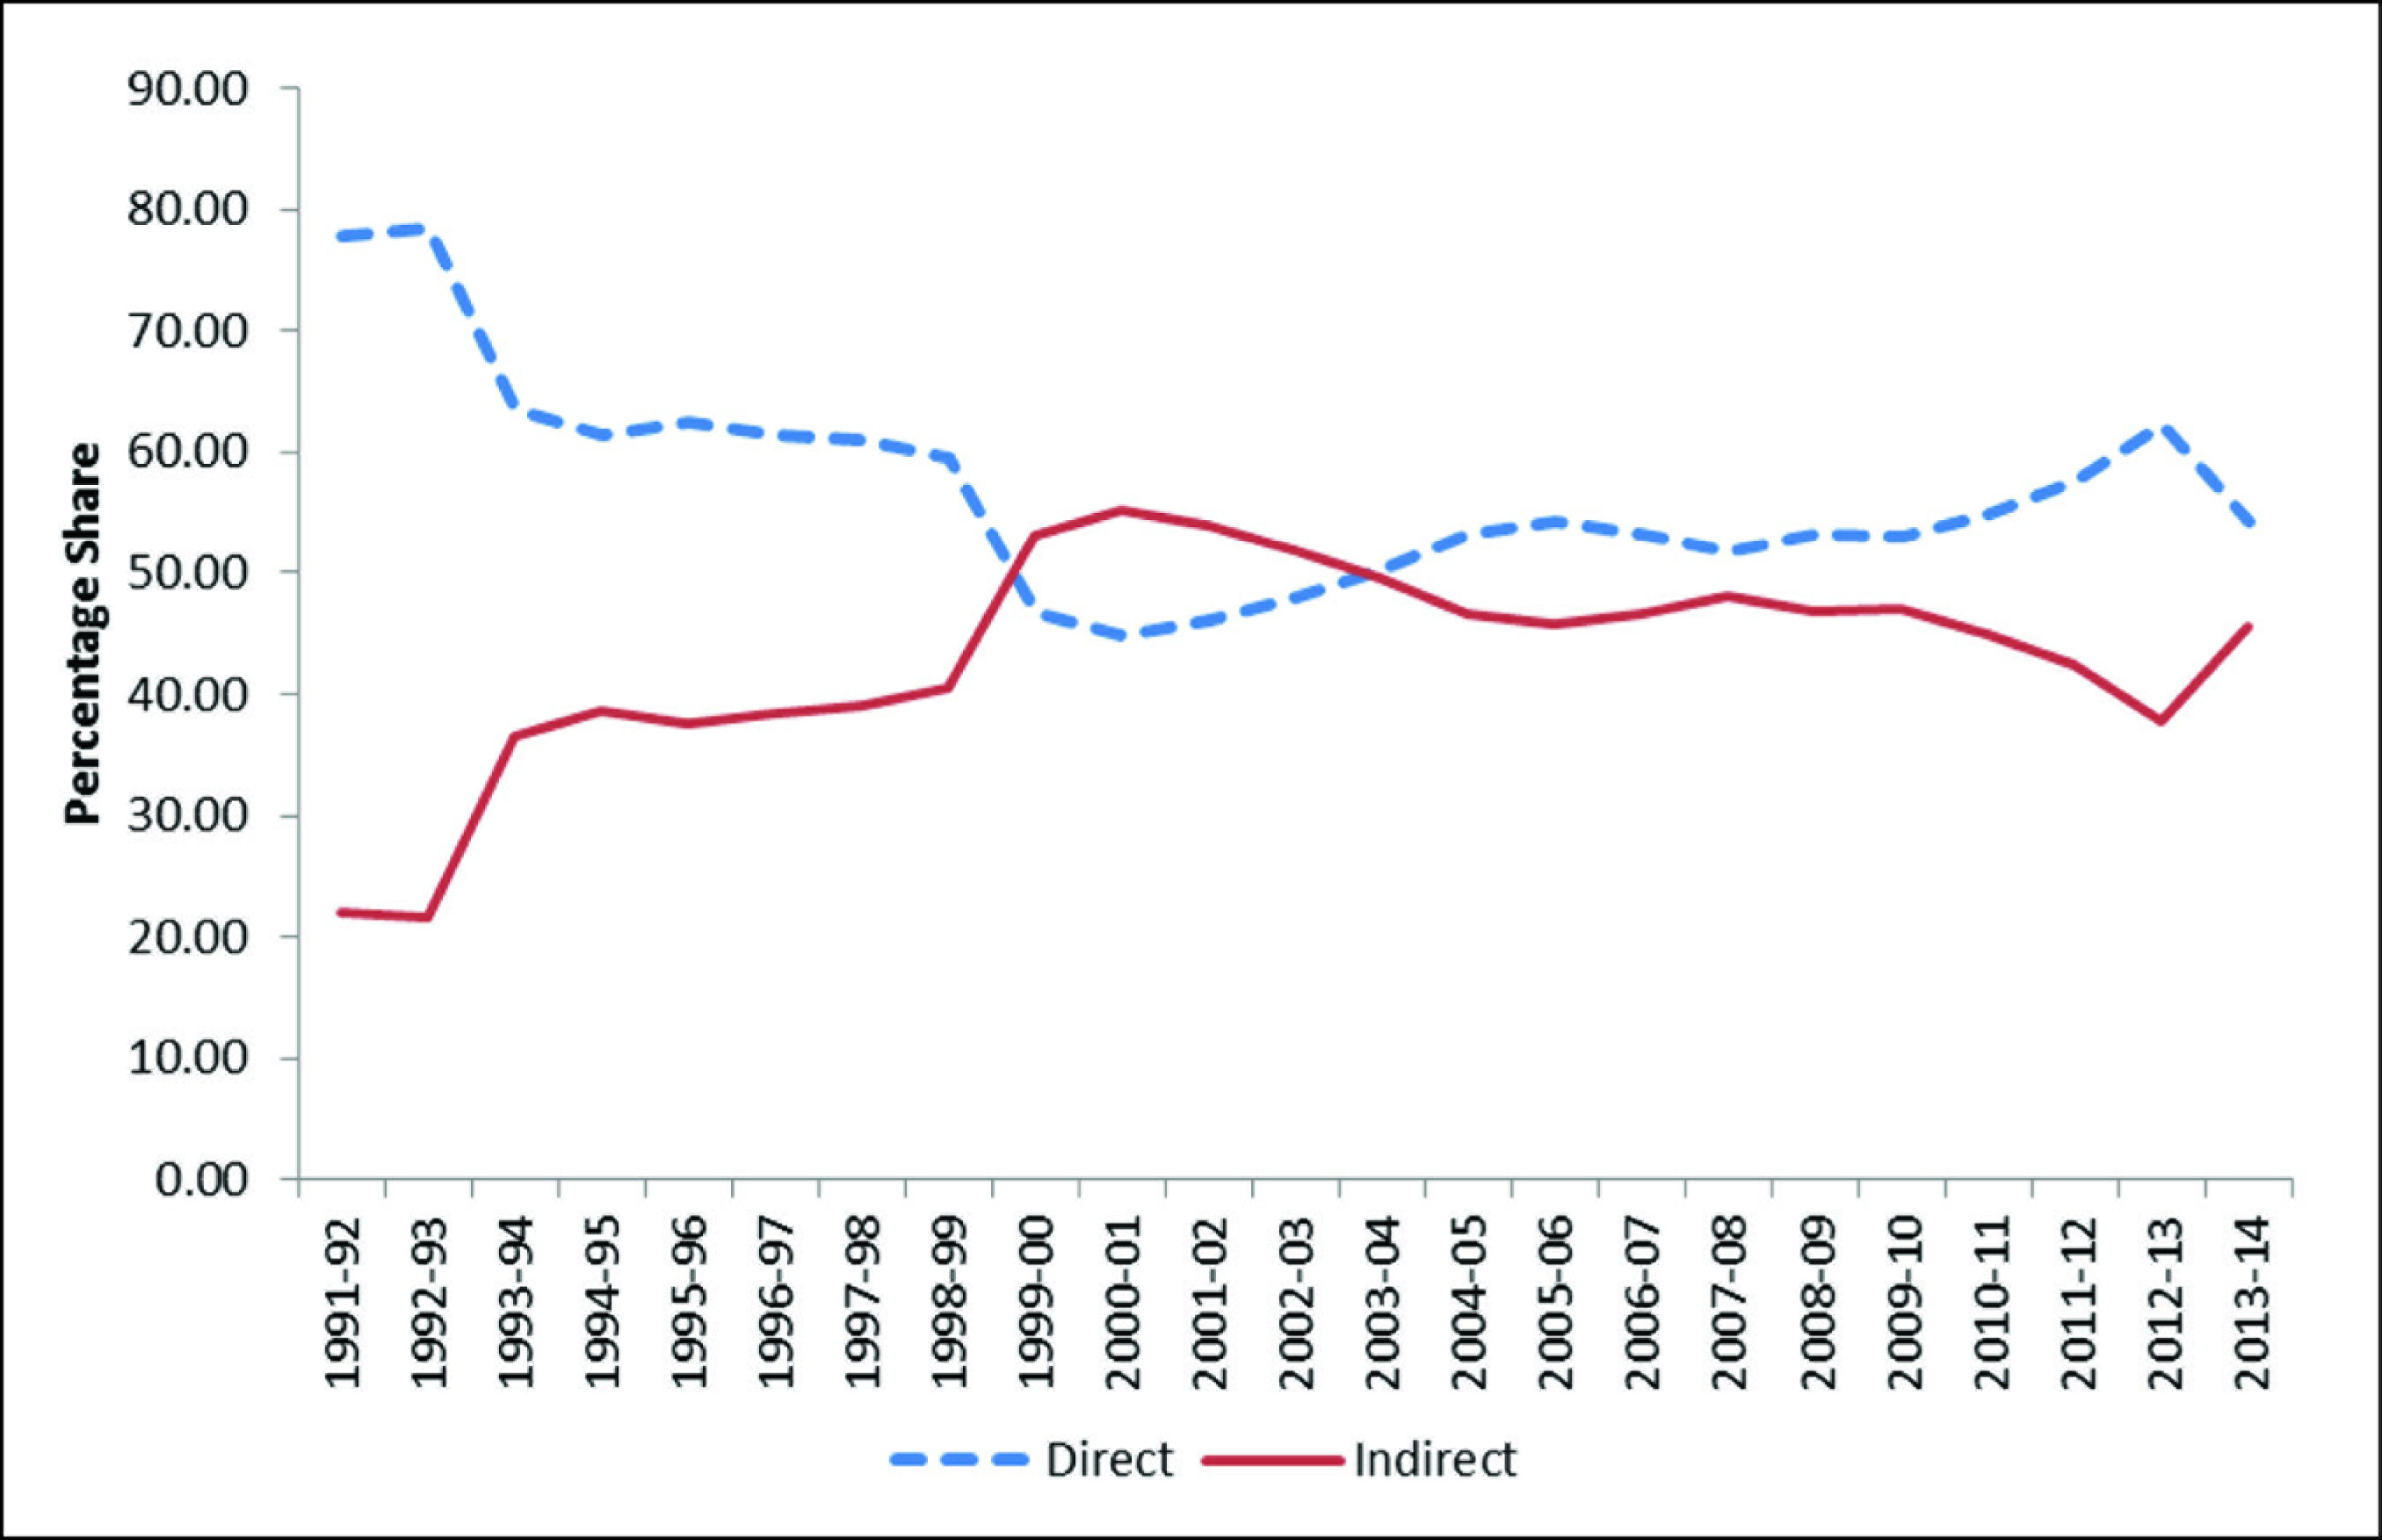
While the direct institutional credit by co-operatives, scheduled commercial banks and regional rural banks reach the individual farmers directly, indirect loans are issued by co-operatives, scheduled commercial banks, regional rural banks, rural electrification corporations, etc., to institutions and organizations which serve the interests of the farmers indirectly. The share of indirect credit in the agricultural credit increased from 8.3% in 1990–91 to 55.1% in 2000–2001 and then gradually dropped to 37.8% in 2012–2013 (Figure 1). While growth of indirect credit is mainly a reflection of the rising credit demand by agri-business, from the perspective of individual farmers, access to direct loans has greater significance. However, under the revised Priority Sector Lending guidelines of 2015, direct and indirect agricultural lending has been dispensed with. The eligible activities include farm credit, agri-infrastructure and ancillary activities. As per the new guidelines, the approach of agriculture under priority sector is to focus on ‘credit for agriculture’ instead of ‘credit in agriculture’ in order to give impetus to financing of supply value chain in the sector (2019).
Regional Disparities in the Flow of Institutional Credit
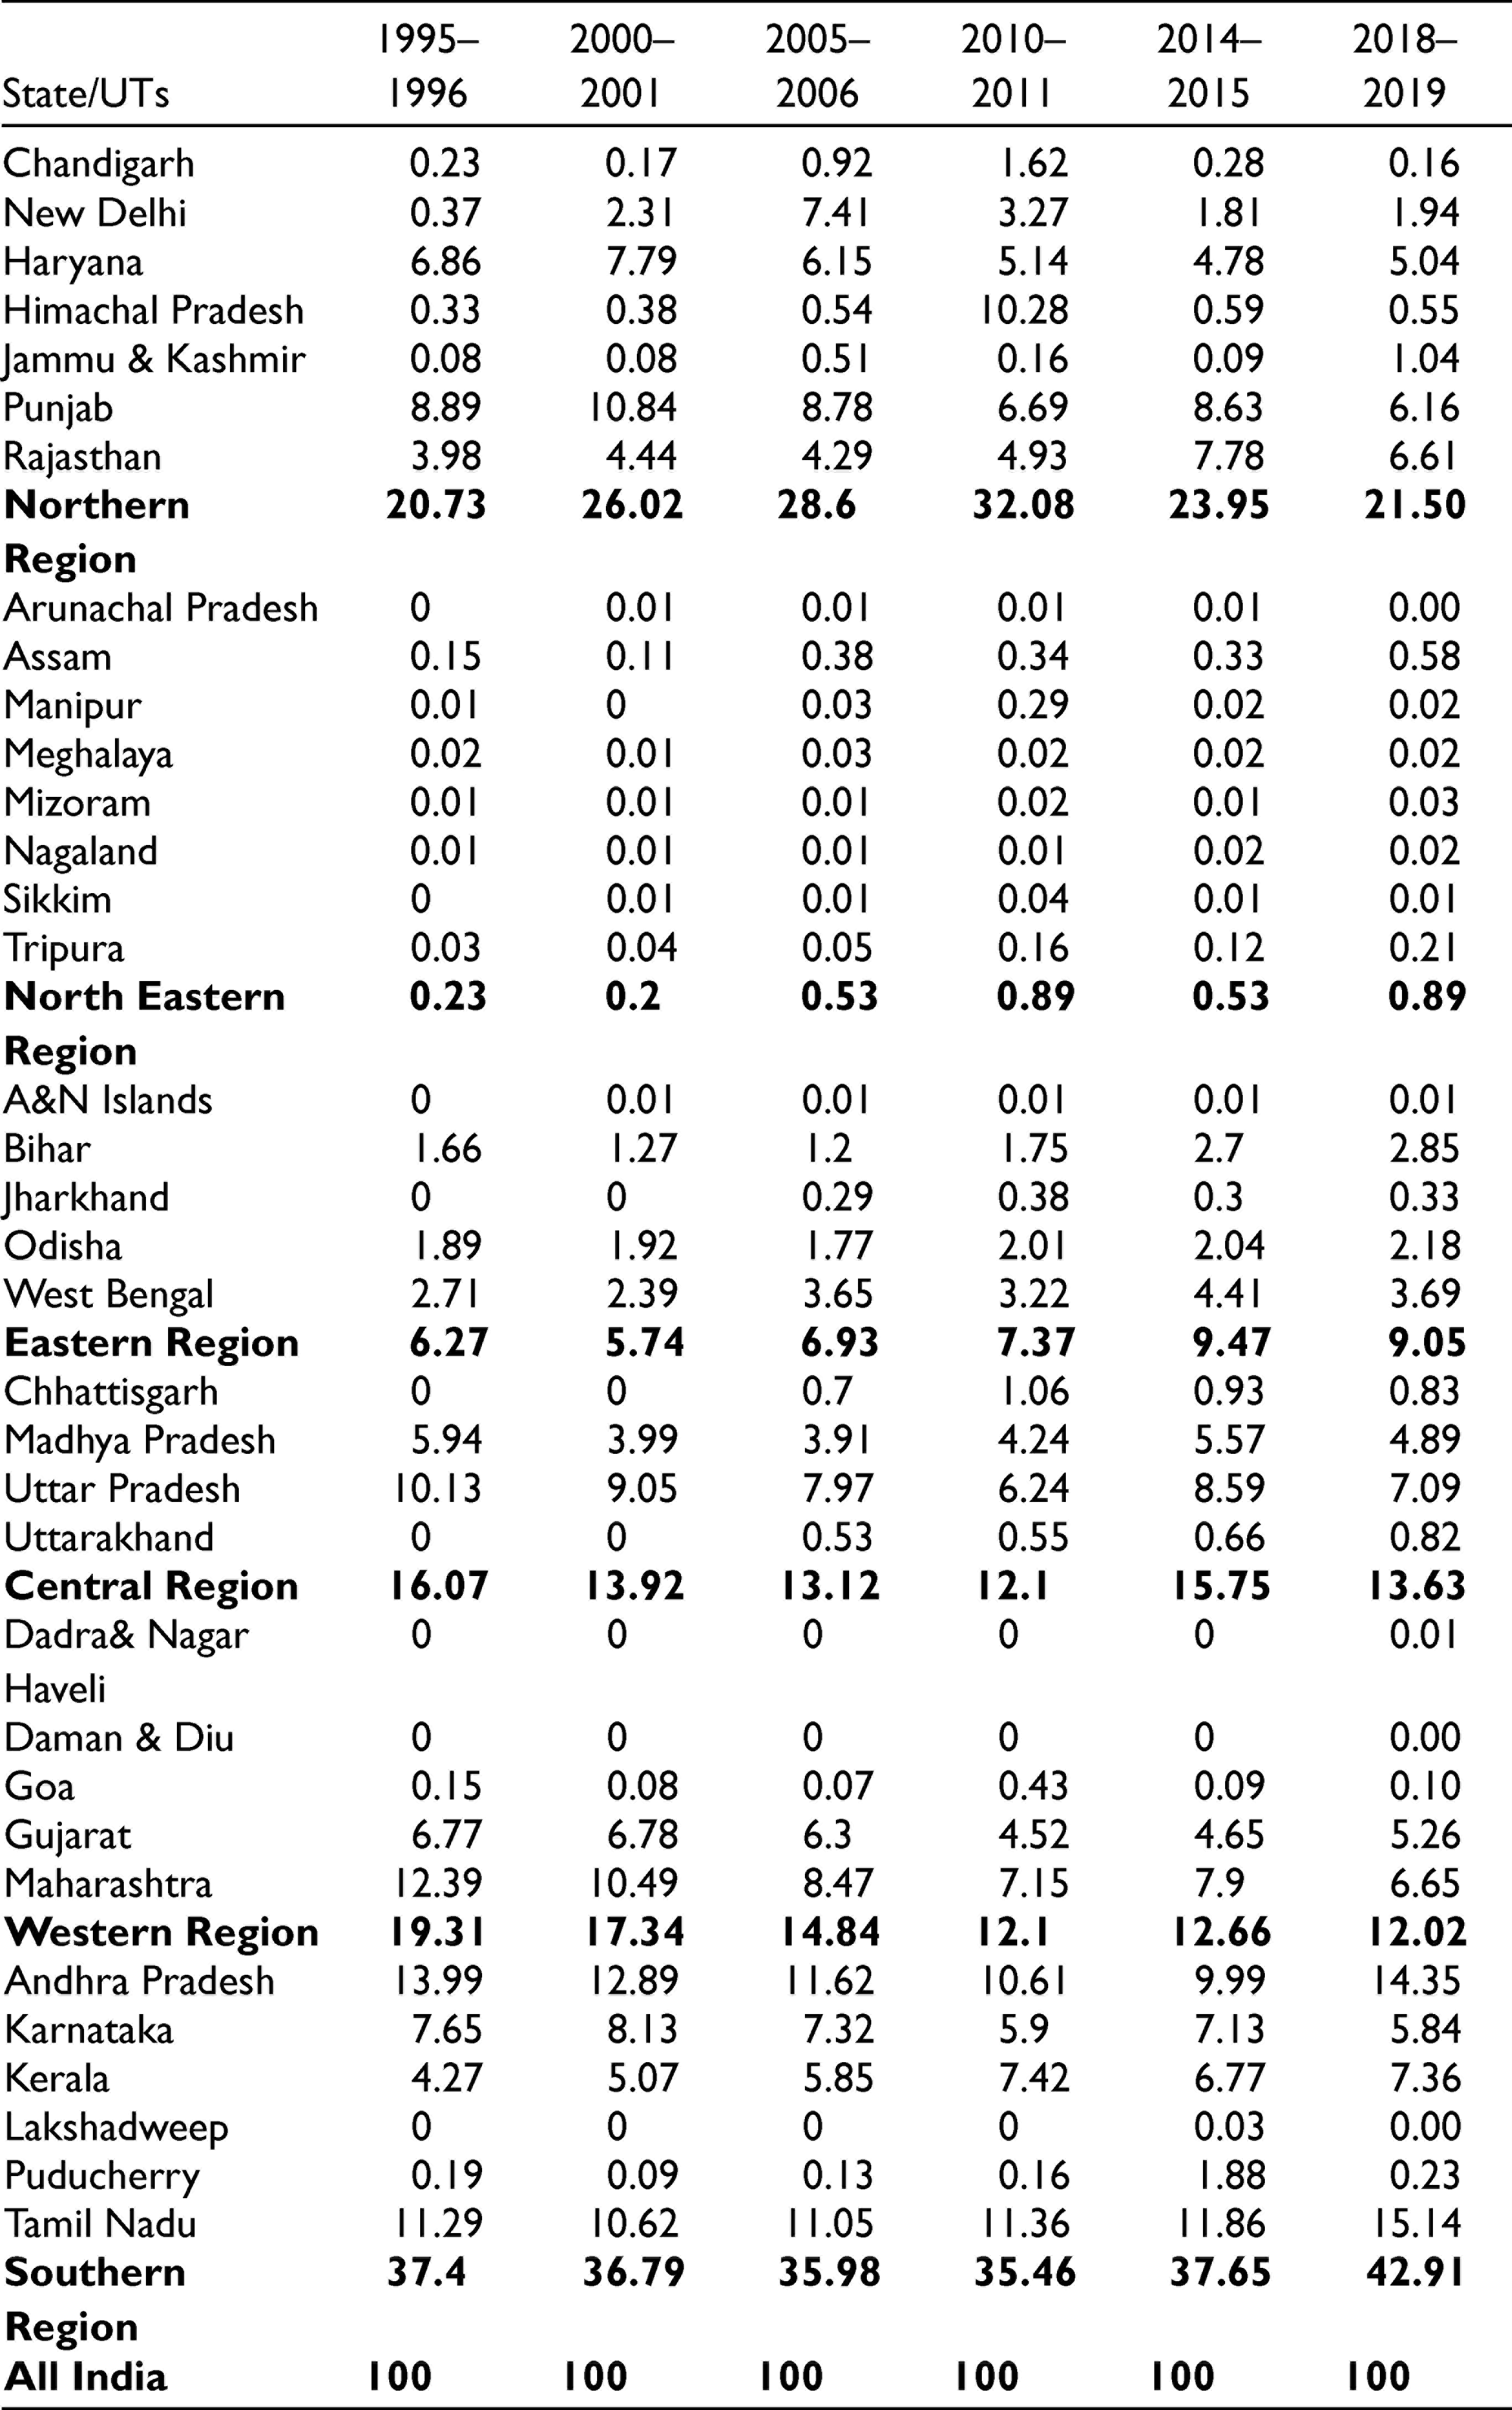
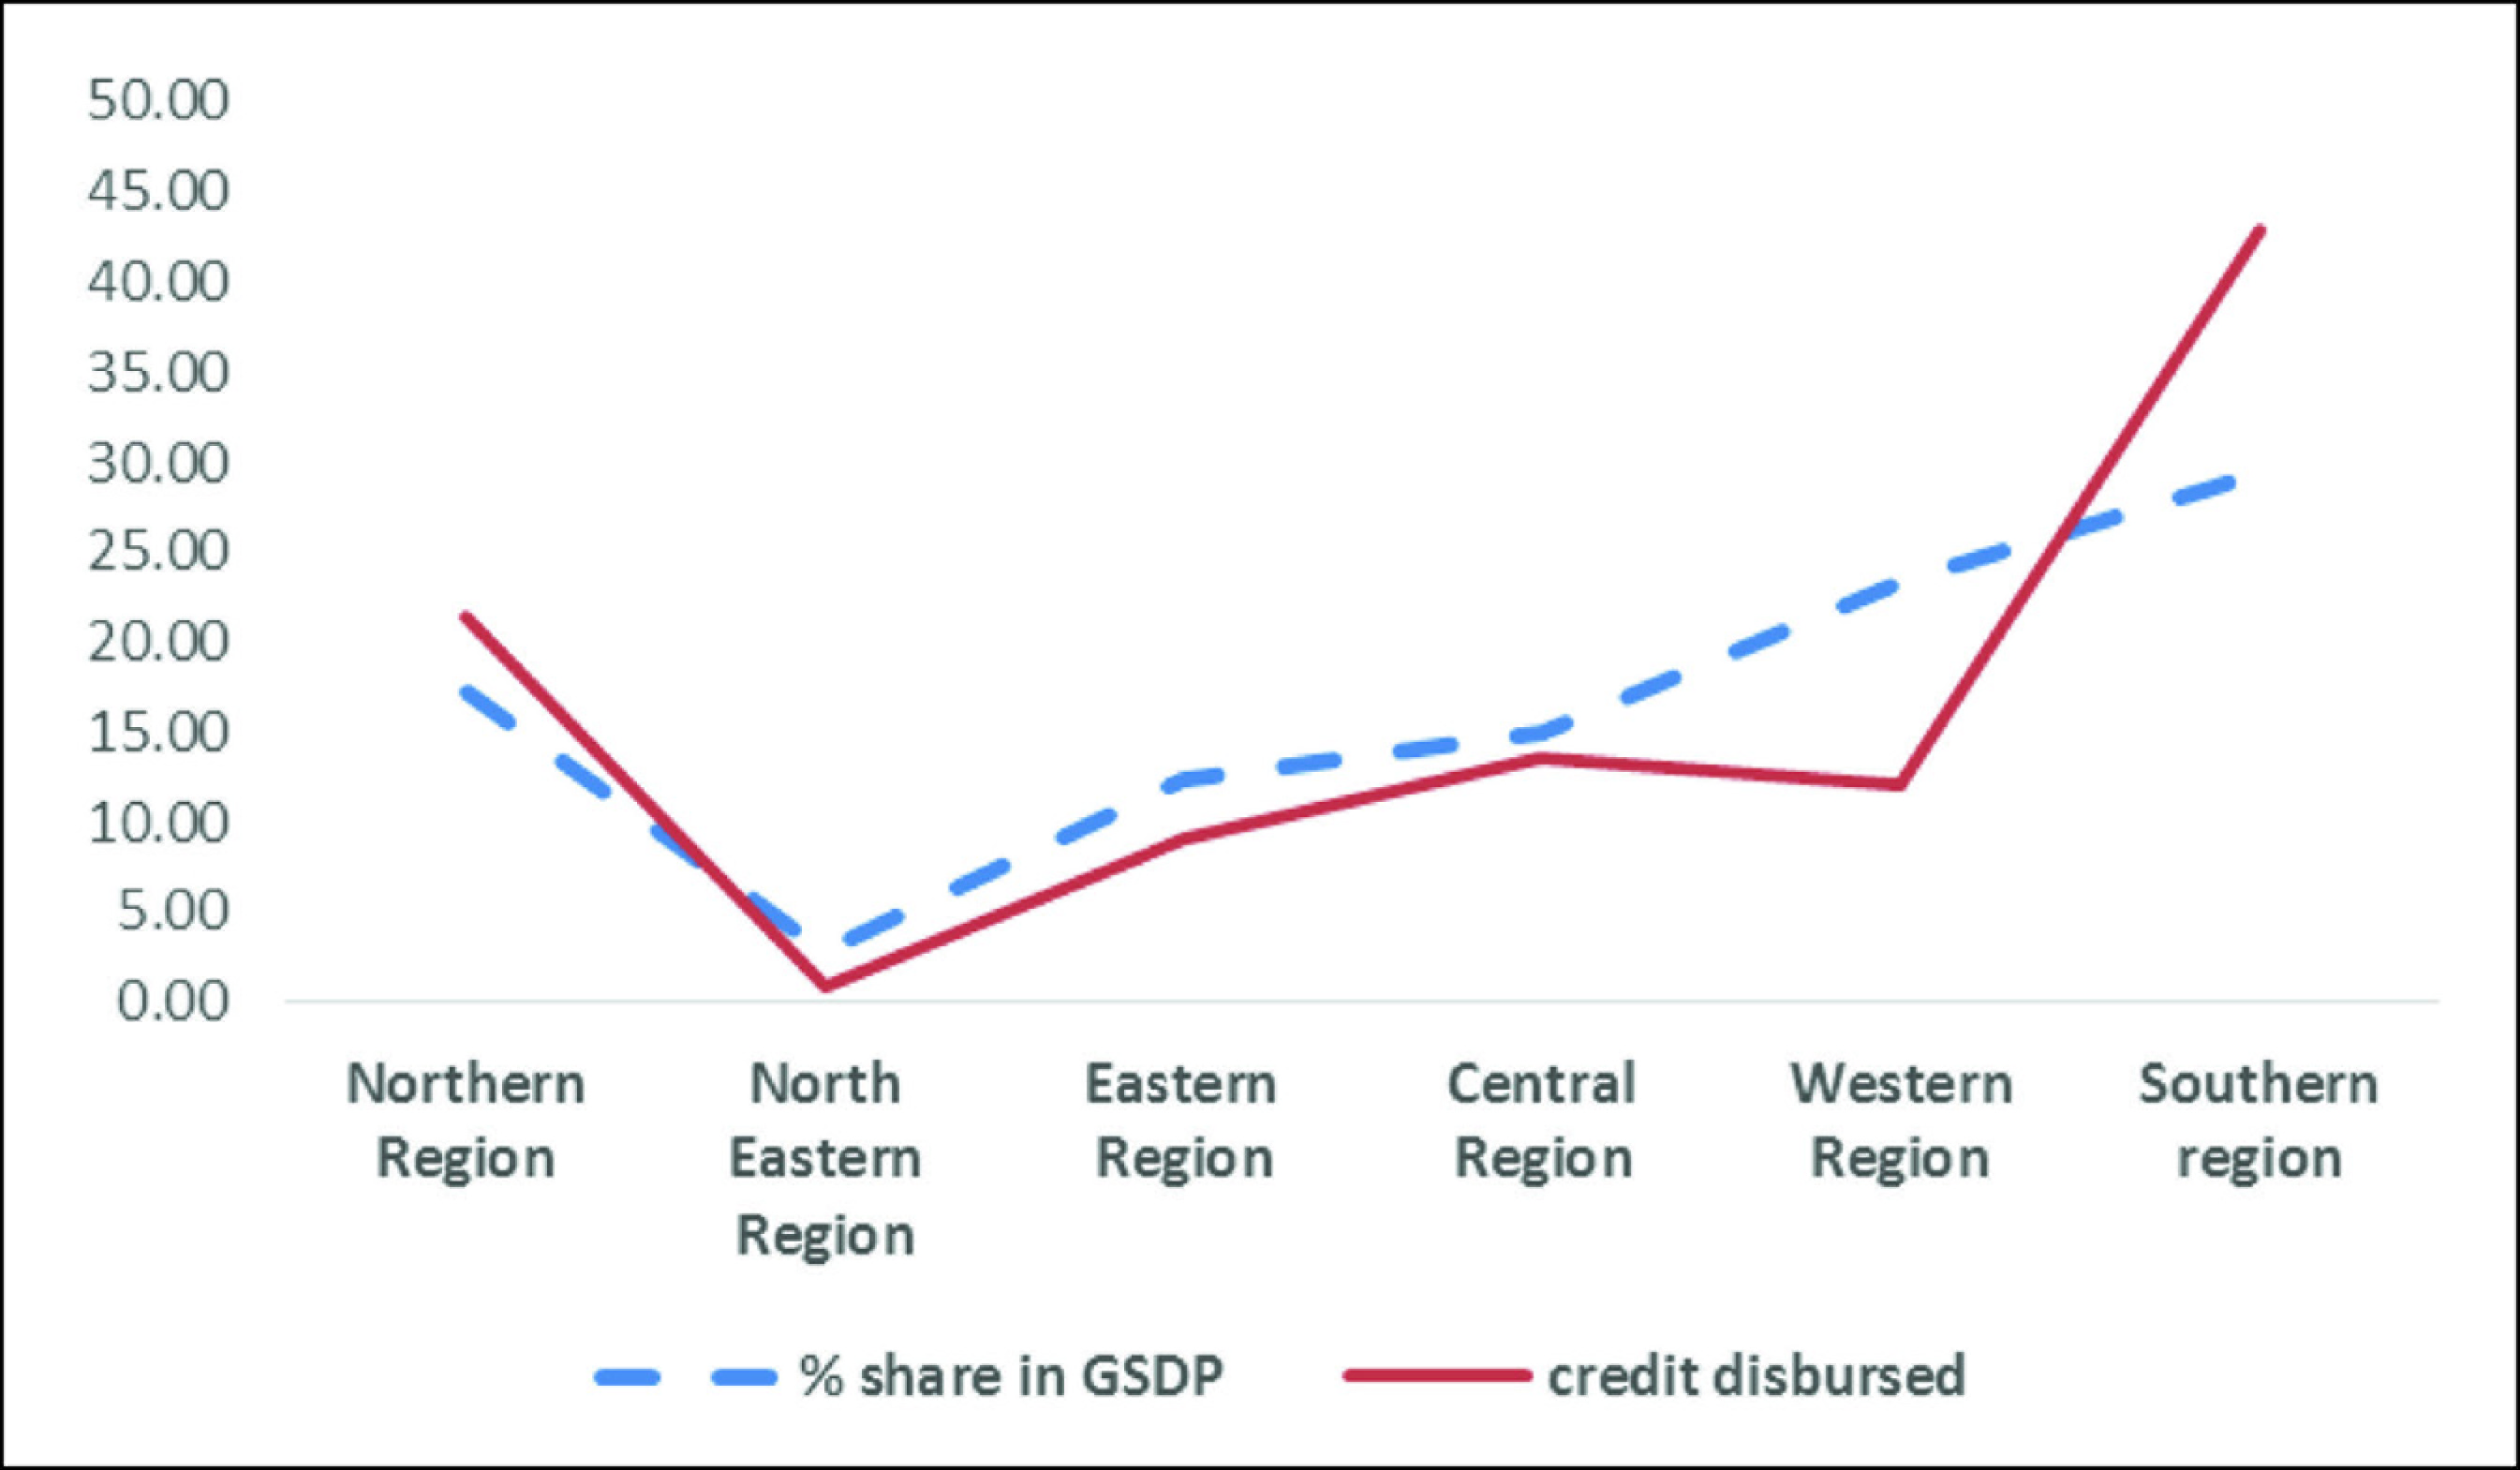
The flow of institutional credit for agriculture and allied activities has been quite uneven between regions. It may be seen from Table 1 that as of 2018–2019, the Southern Region had the highest share (42.91 %) in total institutional credit, followed by Northern Region (21.50 %), Central Region (13.63 %), Western Region (12.01 %), Eastern Region (9.05 %) and North Eastern Region (0.89 %) respectively.
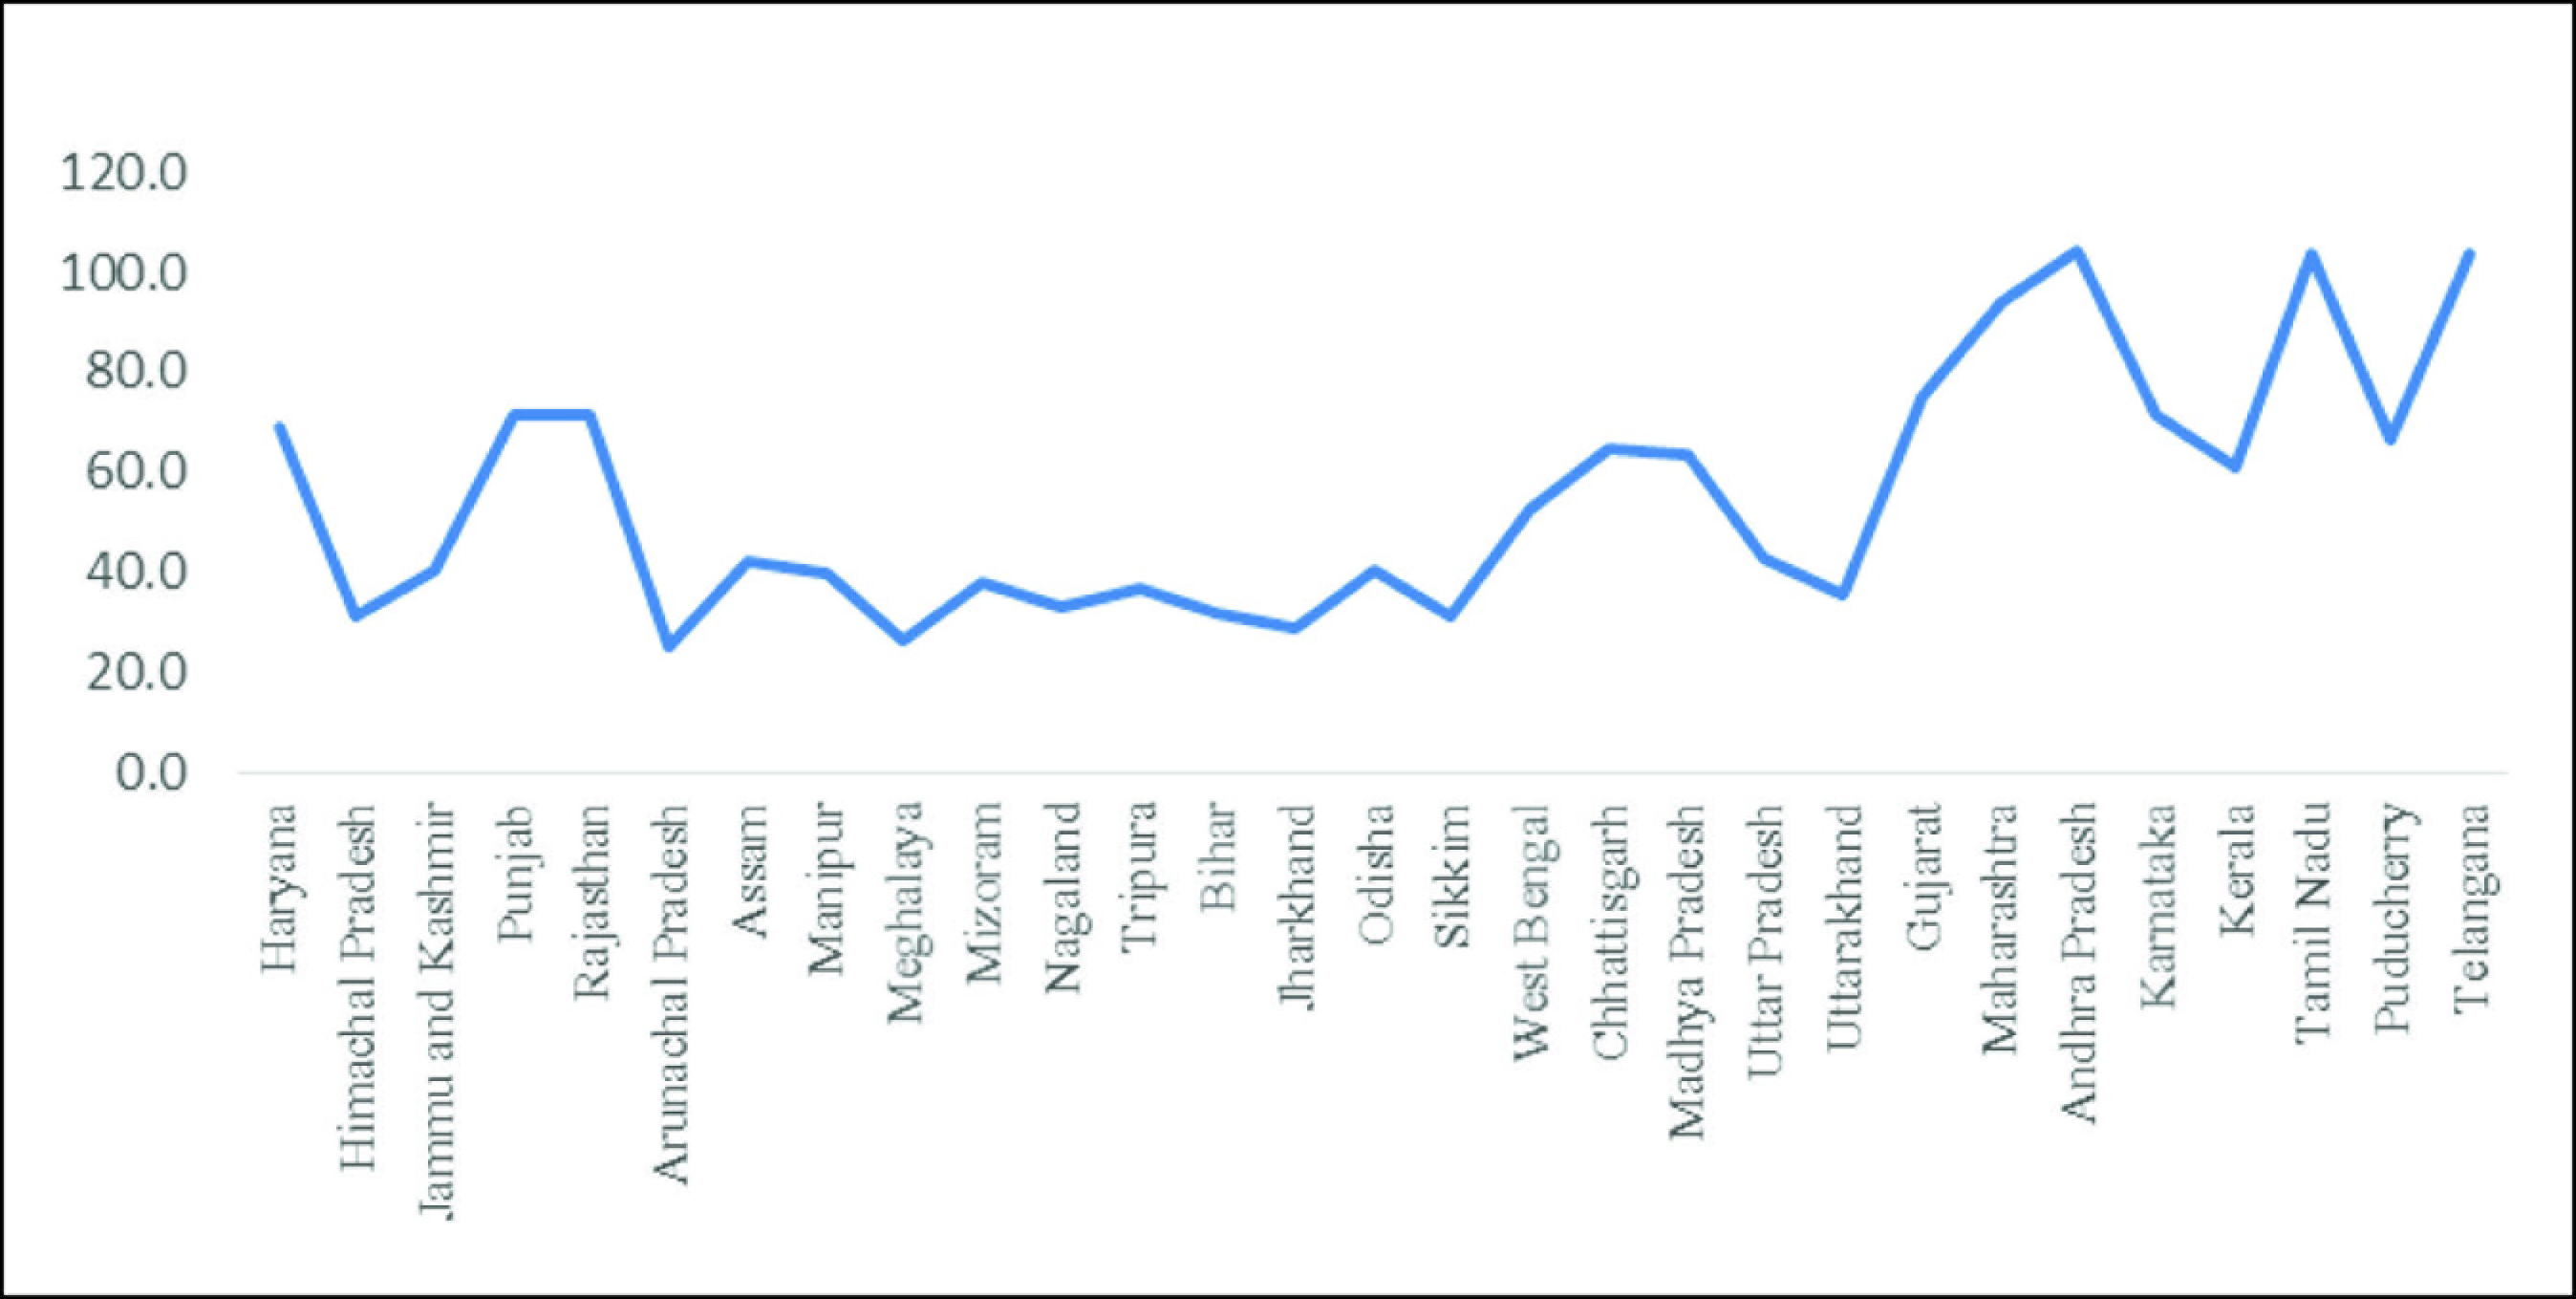
The share of Eastern Region marginally increased from 6.3% in 1995–96 to 9.5% in 2014–2015 but has again declined in 2018–2019 to 9.05% and that of Northern Region from 20.7% in 1995–96 to 24% in 2014–2015 and declined to 21.50 min 2018–2019, while the share of Central Region dropped marginally from 16% in 1995–96 to 15.75% in 2014–2015 and further to 13.6% in 2018–2019 and that of the Western Region declined from 19.3% in 1995–1996 to 12.7% in 2014–2015, further to 12.0% in 2018–2019. The relative share of the Southern Region always remained highest. It was 37.4% in 1995–1996 and marginally increased to 37.6% in 2014–2015 and increased further to 43% in 2018–2019. Among states, Tamil Nadu had the highest share (15.1 %) in total agricultural credit, followed by Andhra Pradesh (14.35 %), Kerala (7.4 %), Uttar Pradesh (7.1 %), Maharashtra and Rajasthan (6.6 %) and Punjab (6.2 %). Among the Eastern States, West Bengal shared 4.4 %, followed by Bihar (2.8 %), Odisha (2.2 %), and Jharkhand (0.3 %). The states in the North Eastern and Eastern Regions in general had lower share in total agricultural credit advanced by various institutional sources. In fact, the share of West Bengal dropped recently from an already low share of 4.4% in 2014–2015 to 3.7% in 2018–2019, while that of Odisha, Bihar and Jharkhand increased a tad bit, which in view of their overall share in All India agricultural credit remained insignificant (Table 1).
State-wise Share in All India Ground Level Credit (GLC) for Agriculture and Allied Activities (%)
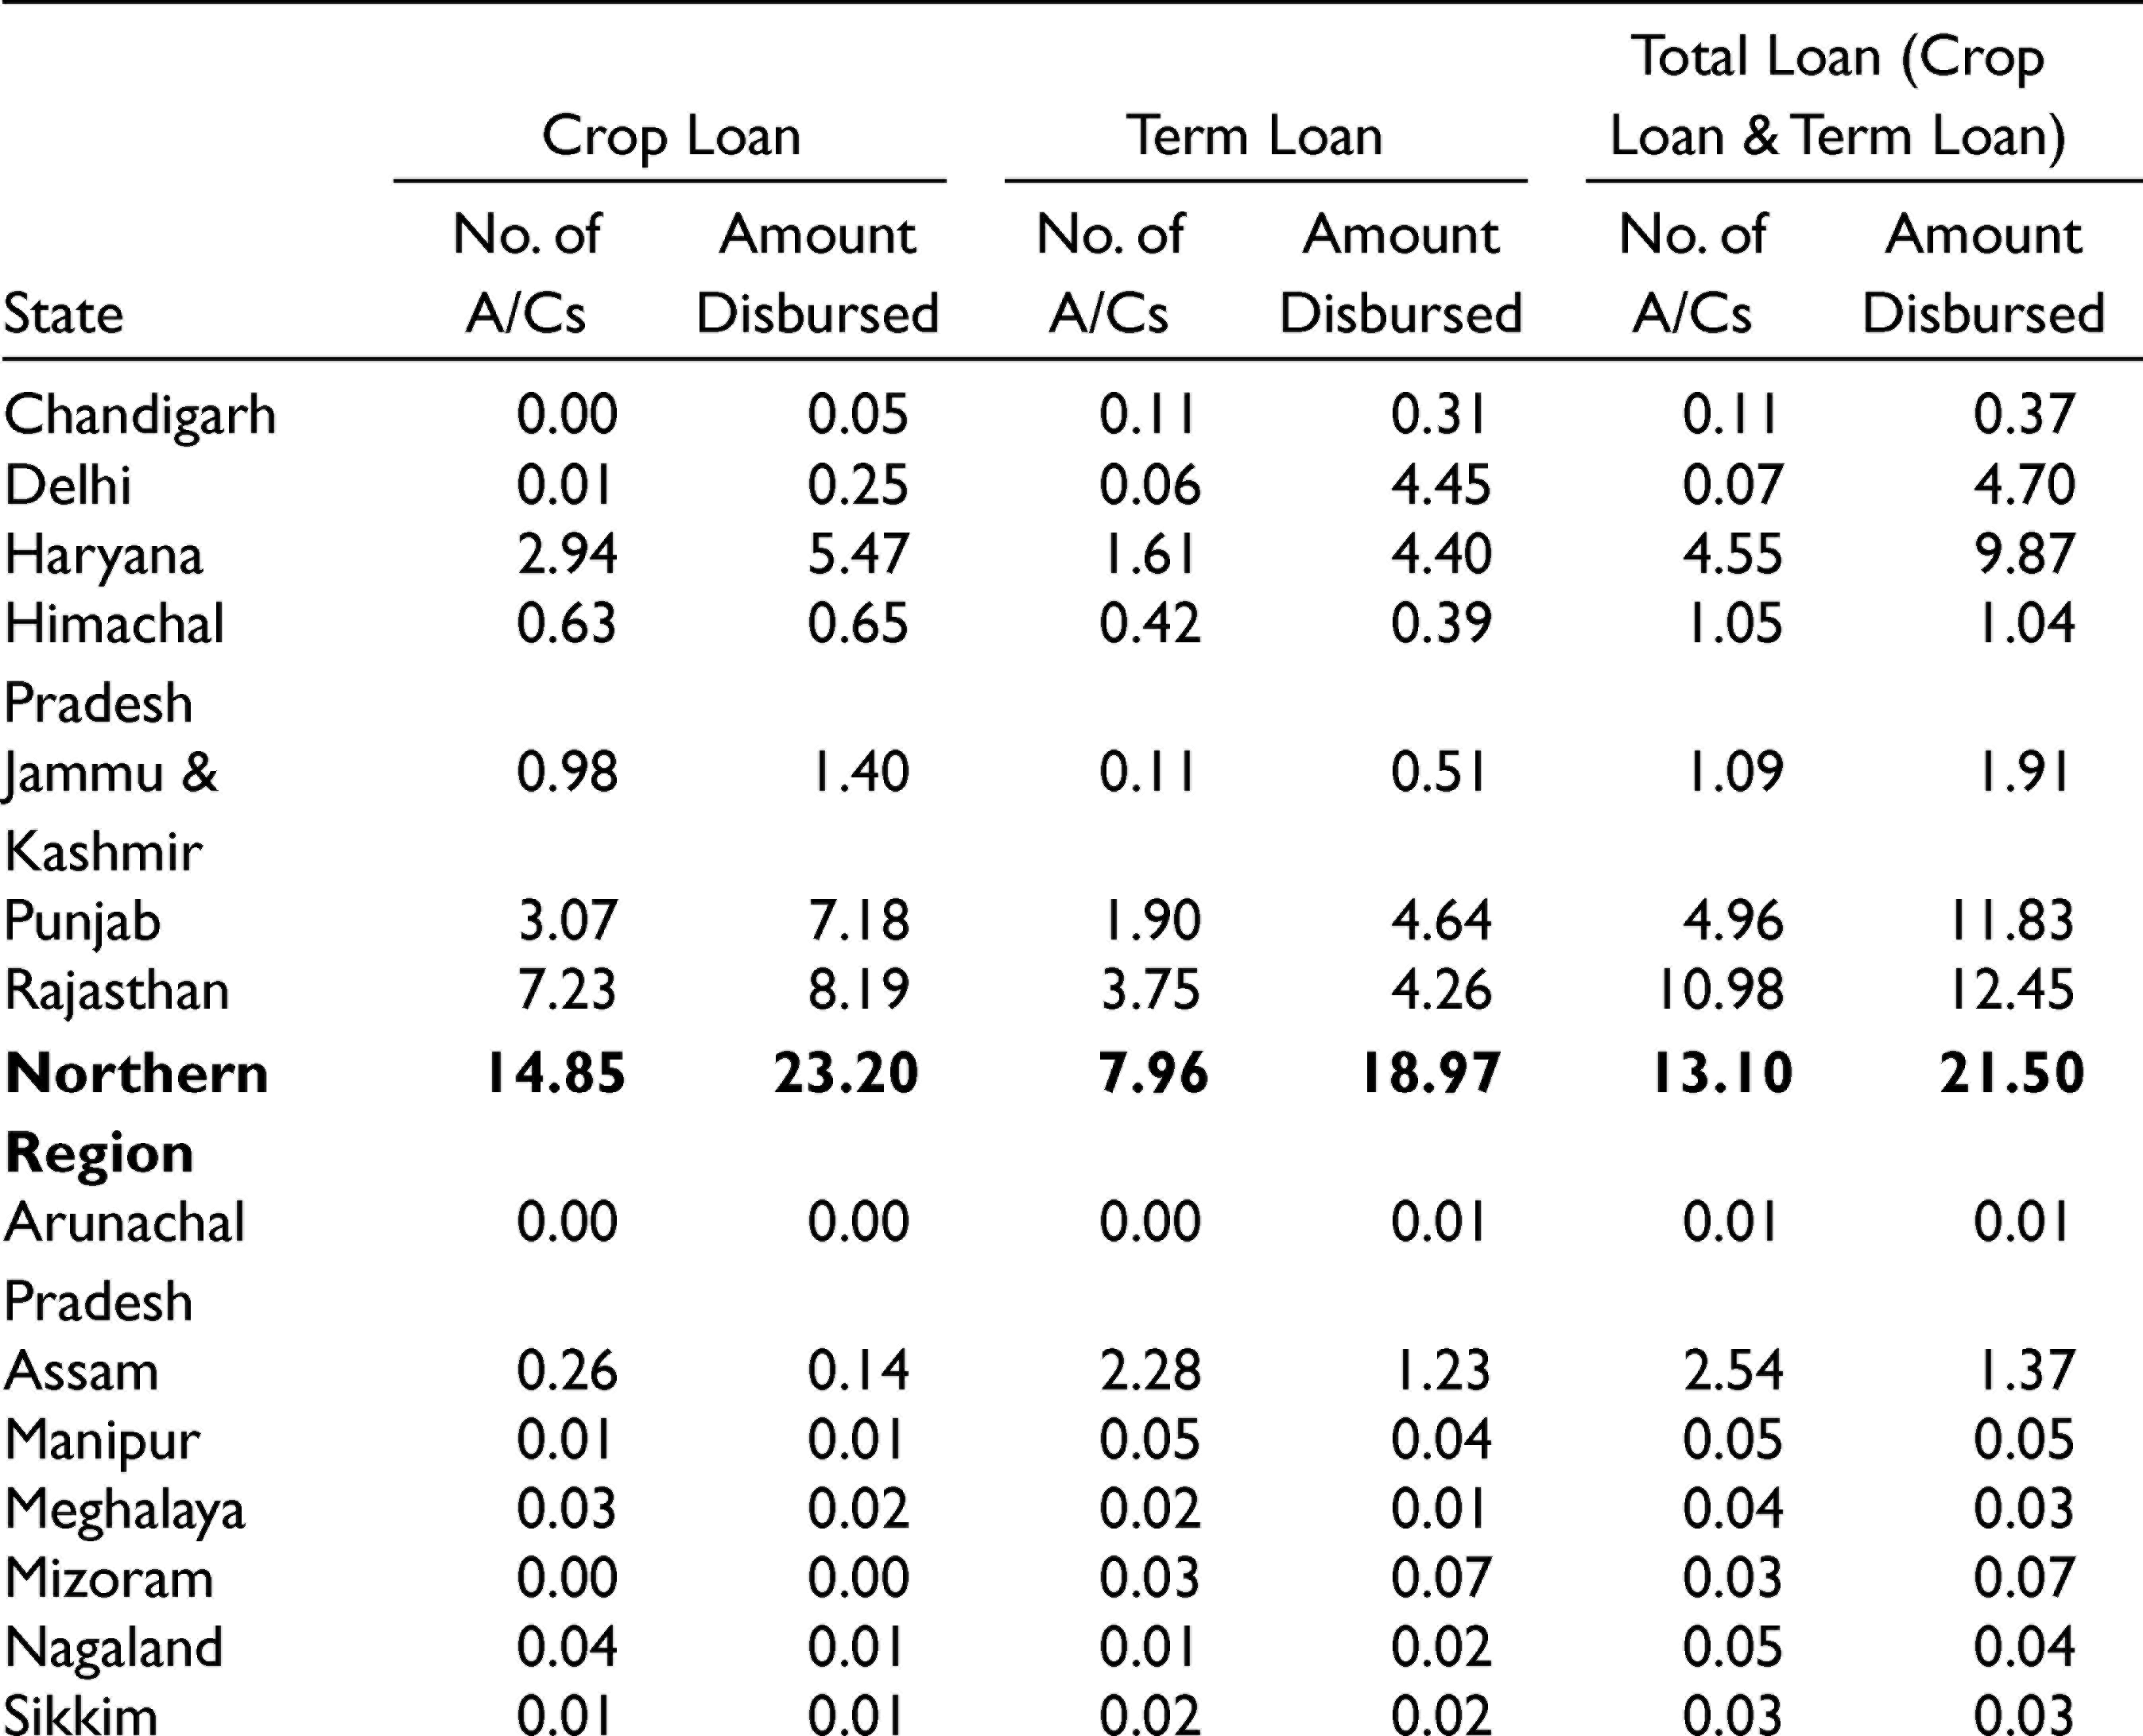
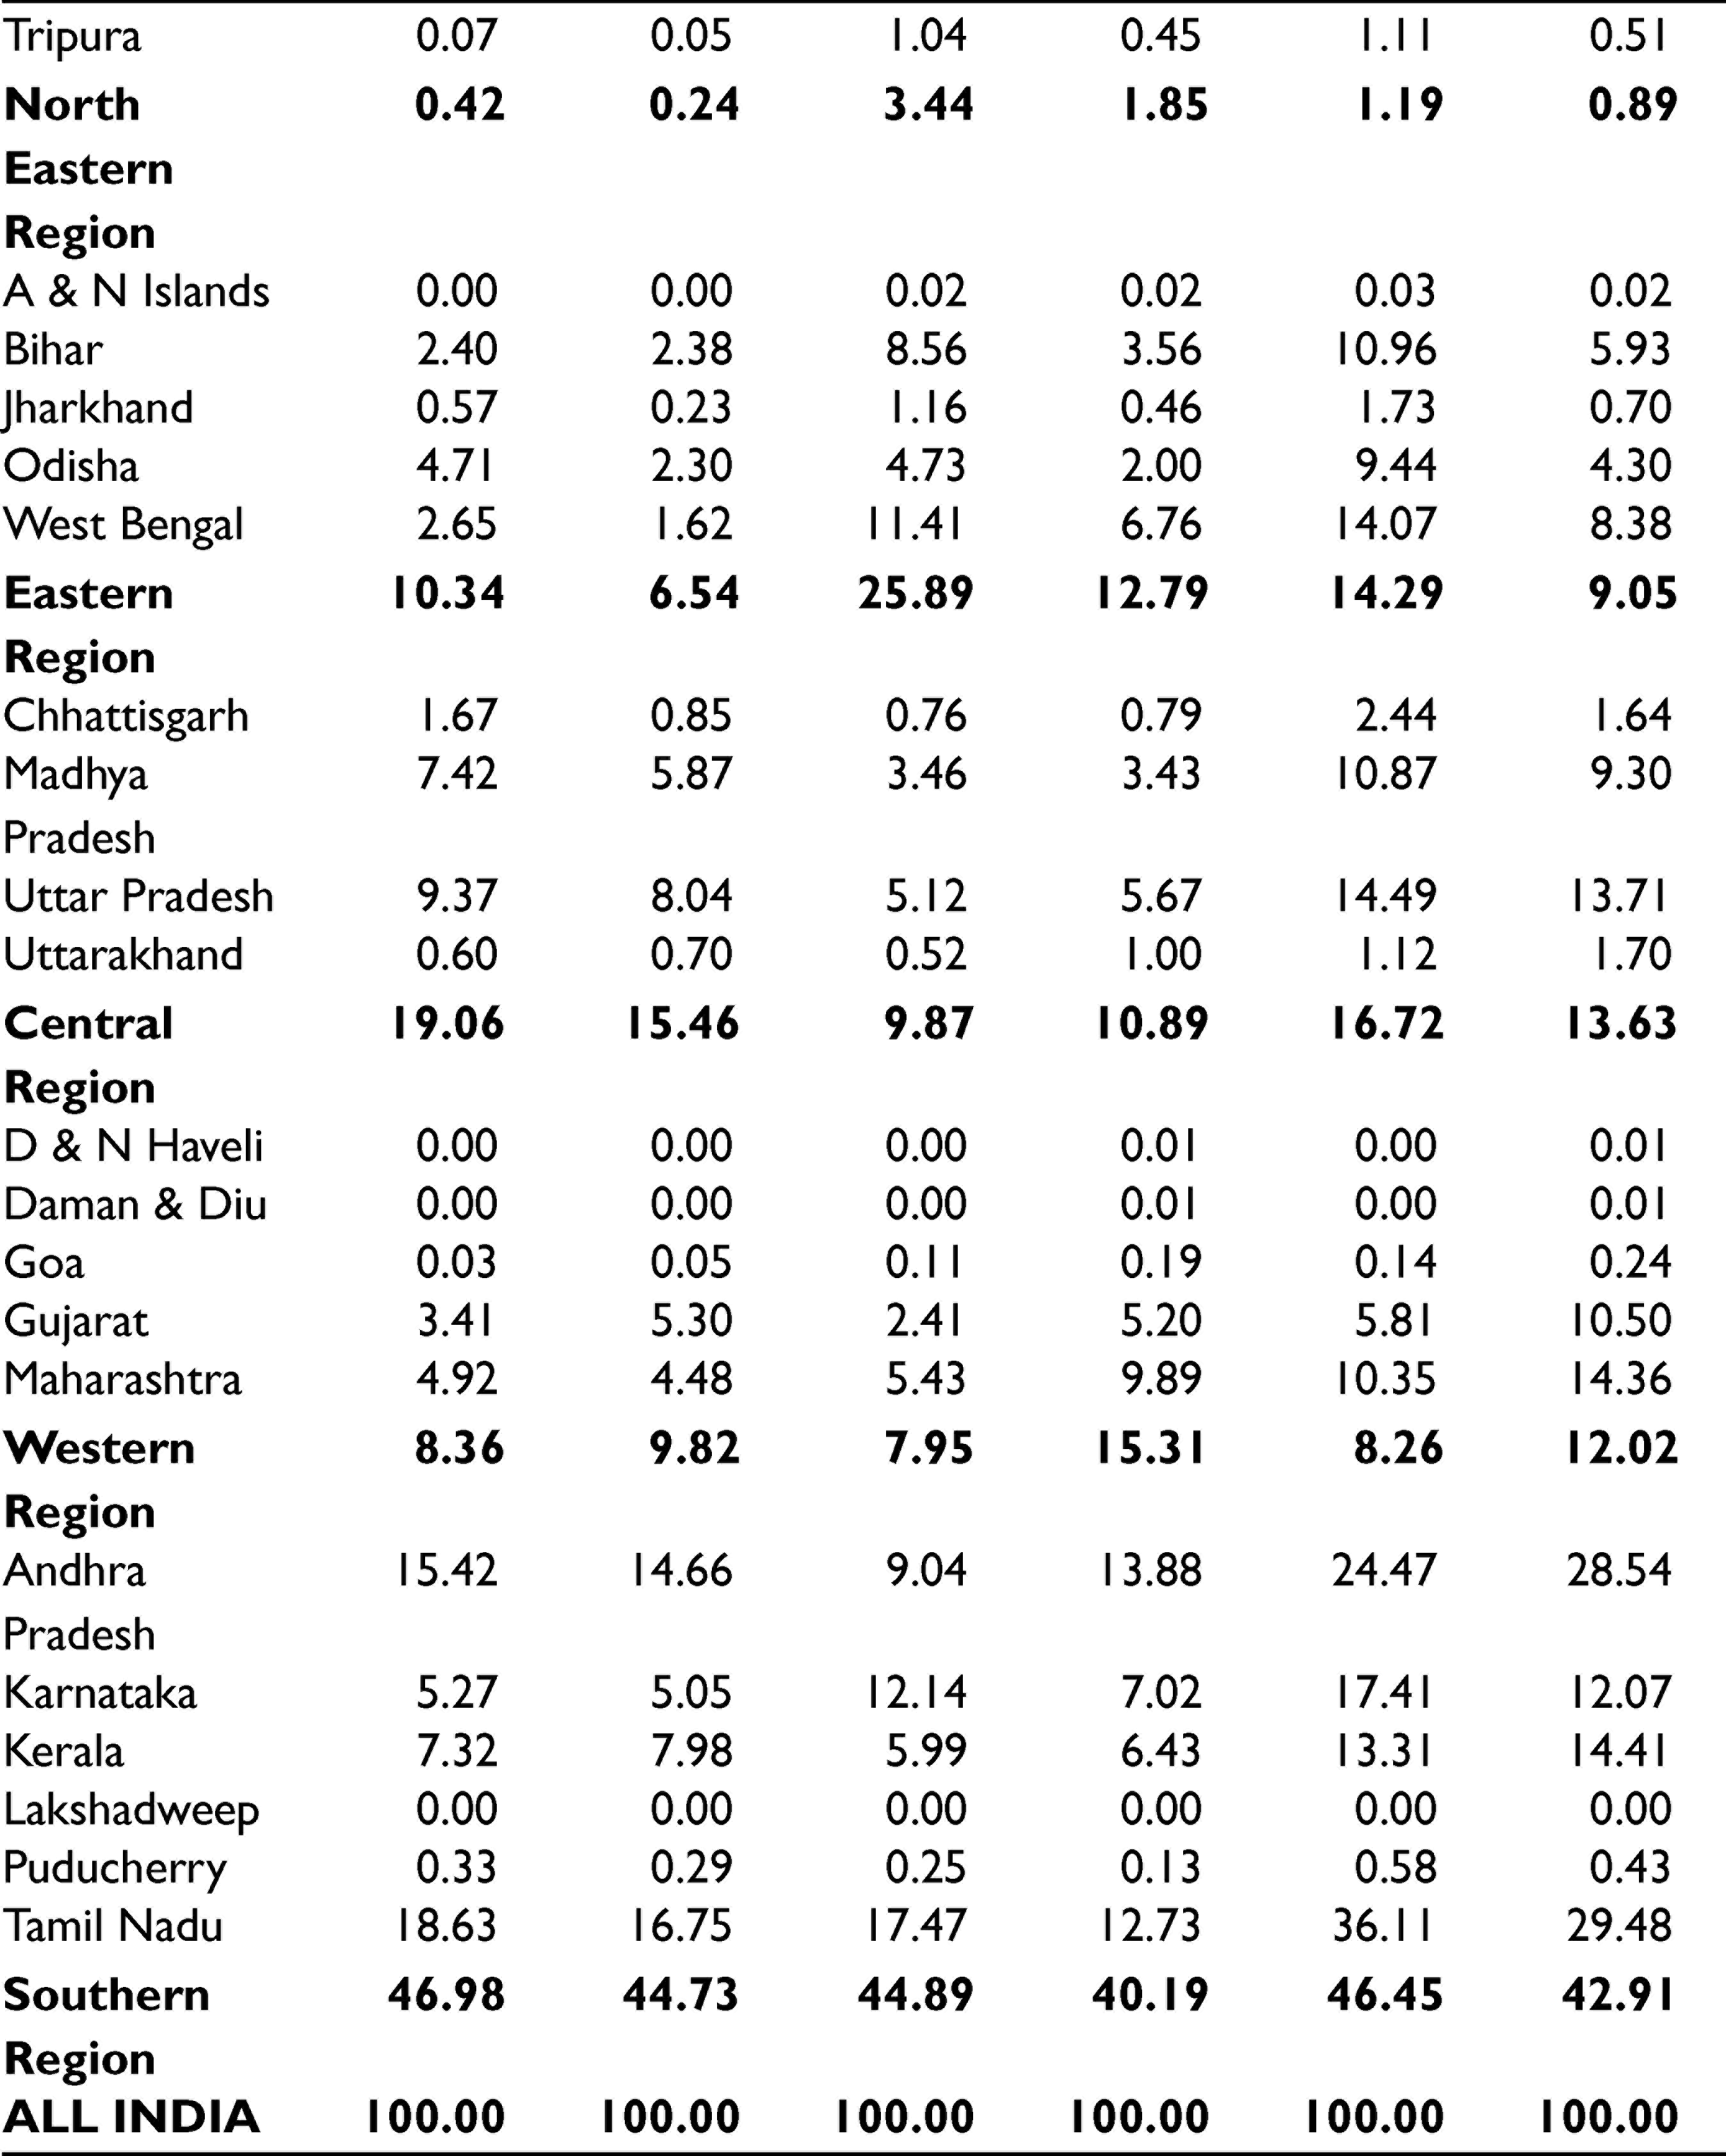
The regional distribution of number of accounts and amount towards production and investment credit (Table 2) for the year 2018–2019 show that of the total investment credit disbursed, Southern Region shared 40.2% of the total investment credit disbursed, followed by Northern Region (19.0 %), Western Region (15.3 %), Eastern Region (12.8 %) and Central Region (10.9 %). Similarly, in case of total accounts under production credit, Southern Region accounted for the highest share at 47.0 %, followed by Central Region (19.1 %). The Eastern Region had 10% of the total production credit accounts while the amount was only 6.5% of the total amount disbursed. With low share in both production and investment credit, there is hardly any hope that the States of Bihar, Jharkhand, Odisha and West Bengal, which also have predominance of marginal and small holdings, would fully utilize their growth potentials and reduce poverty.
State-wise Share of Number of Accounts and Amount Disbursed Towards Crop Loan and Term Loan, 2018–2019
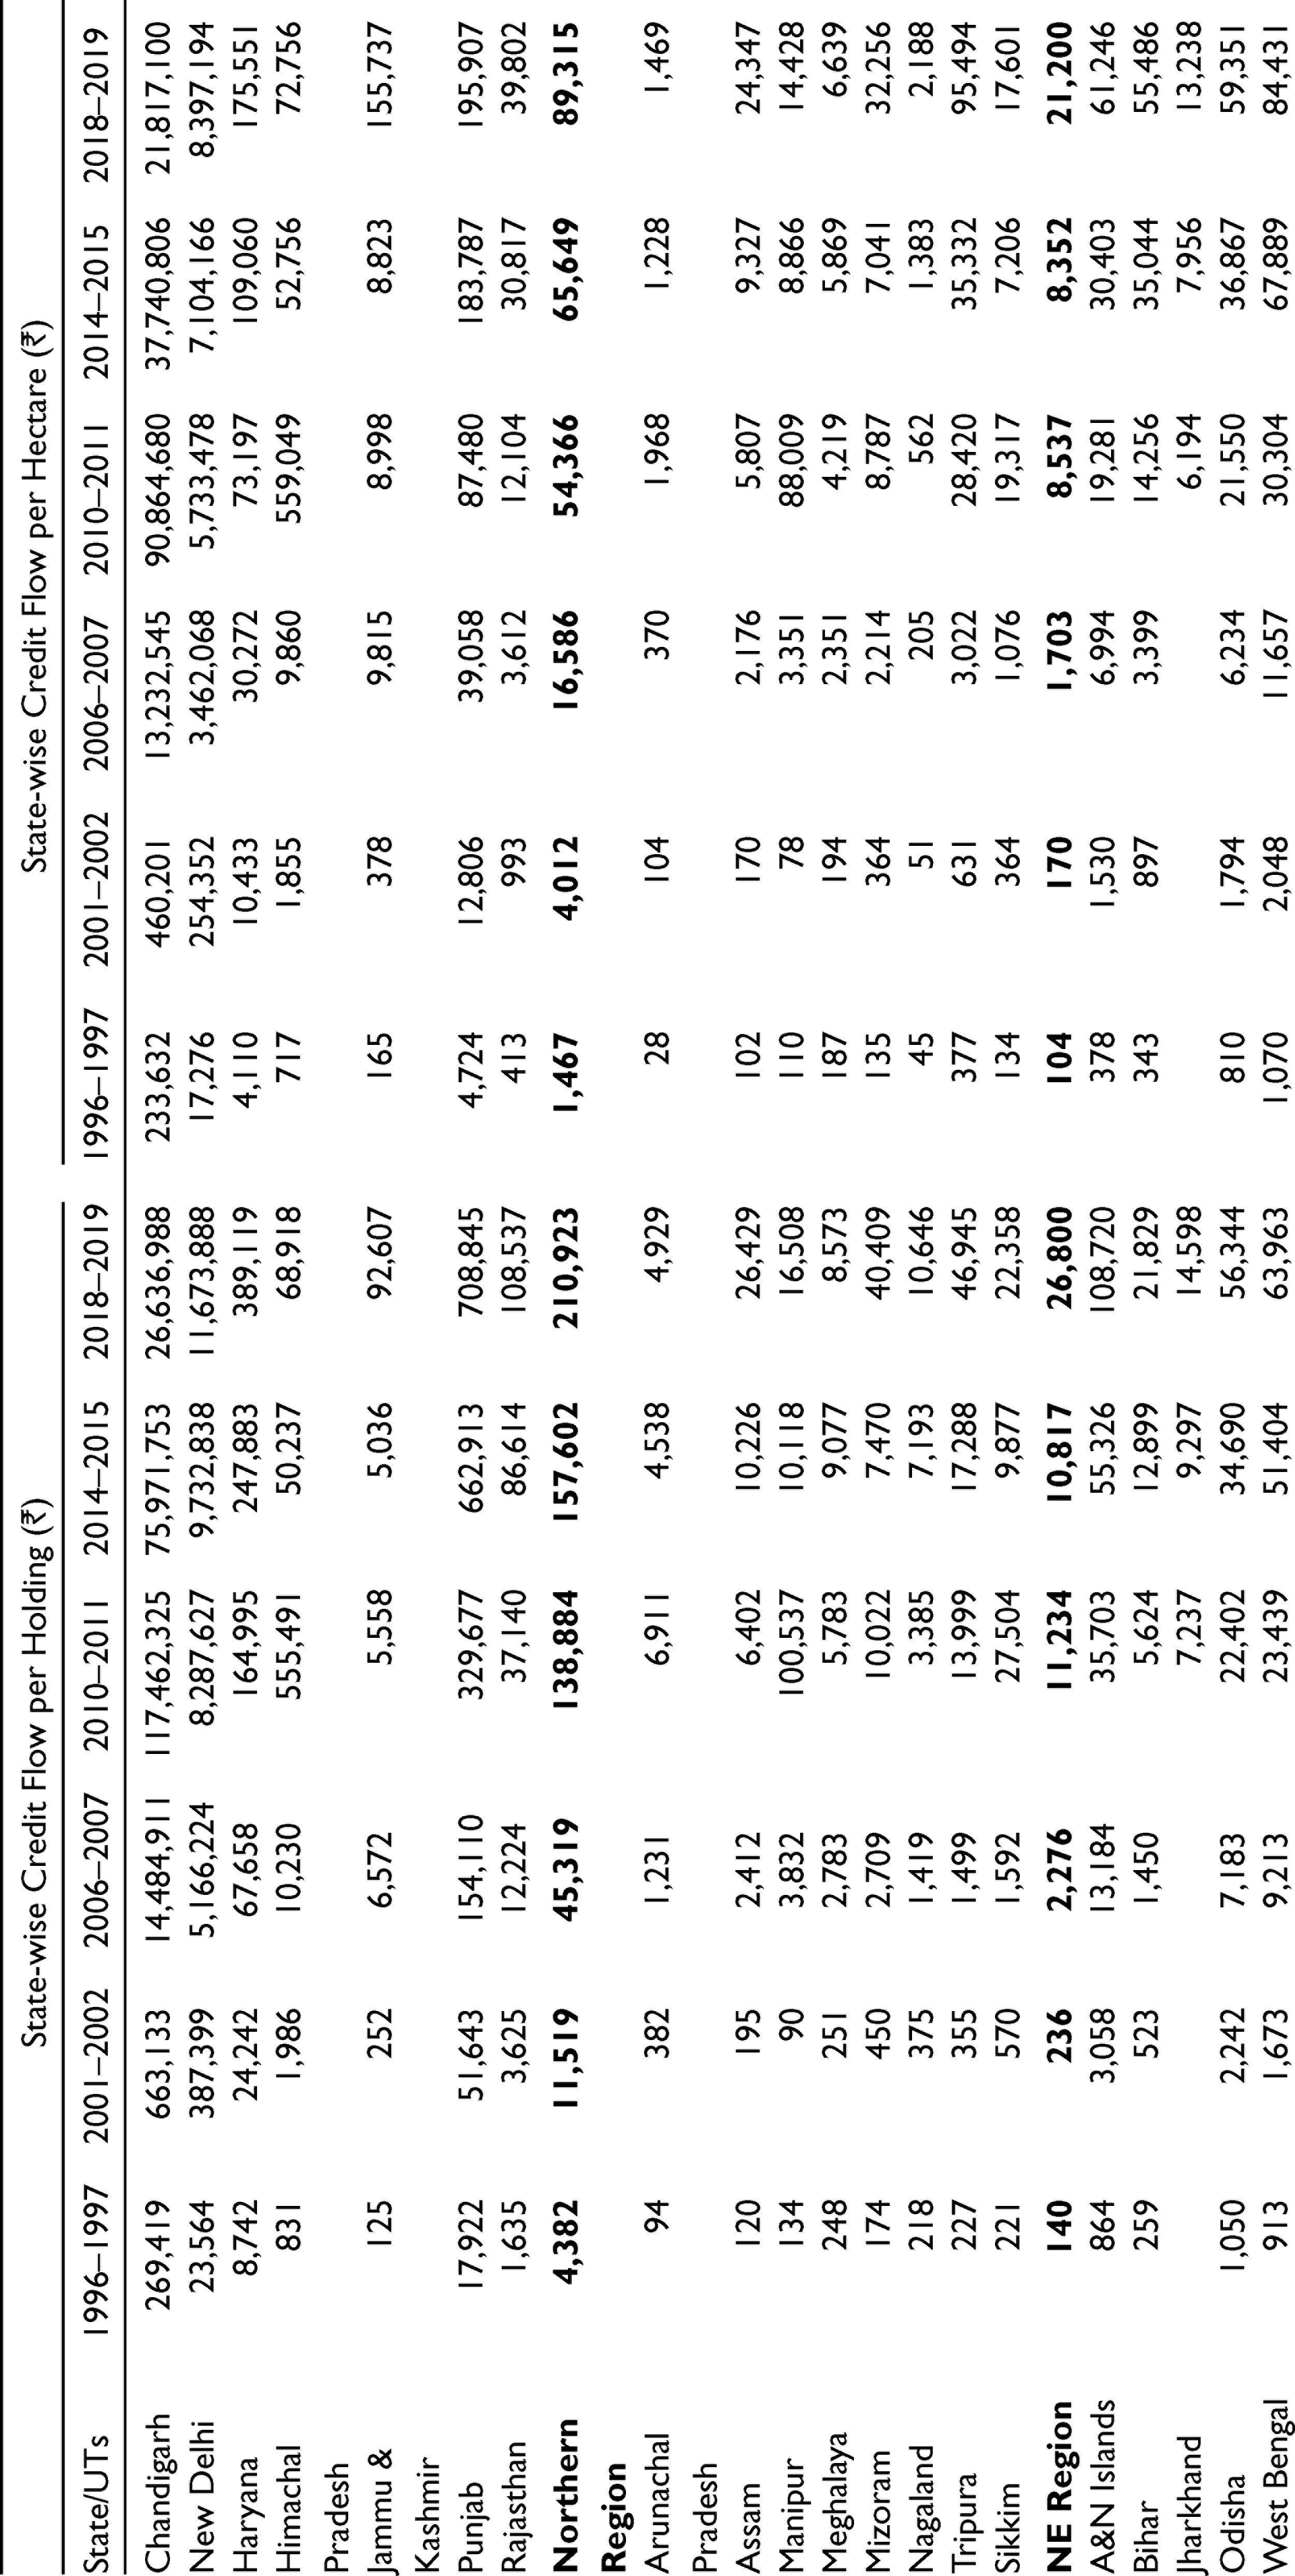
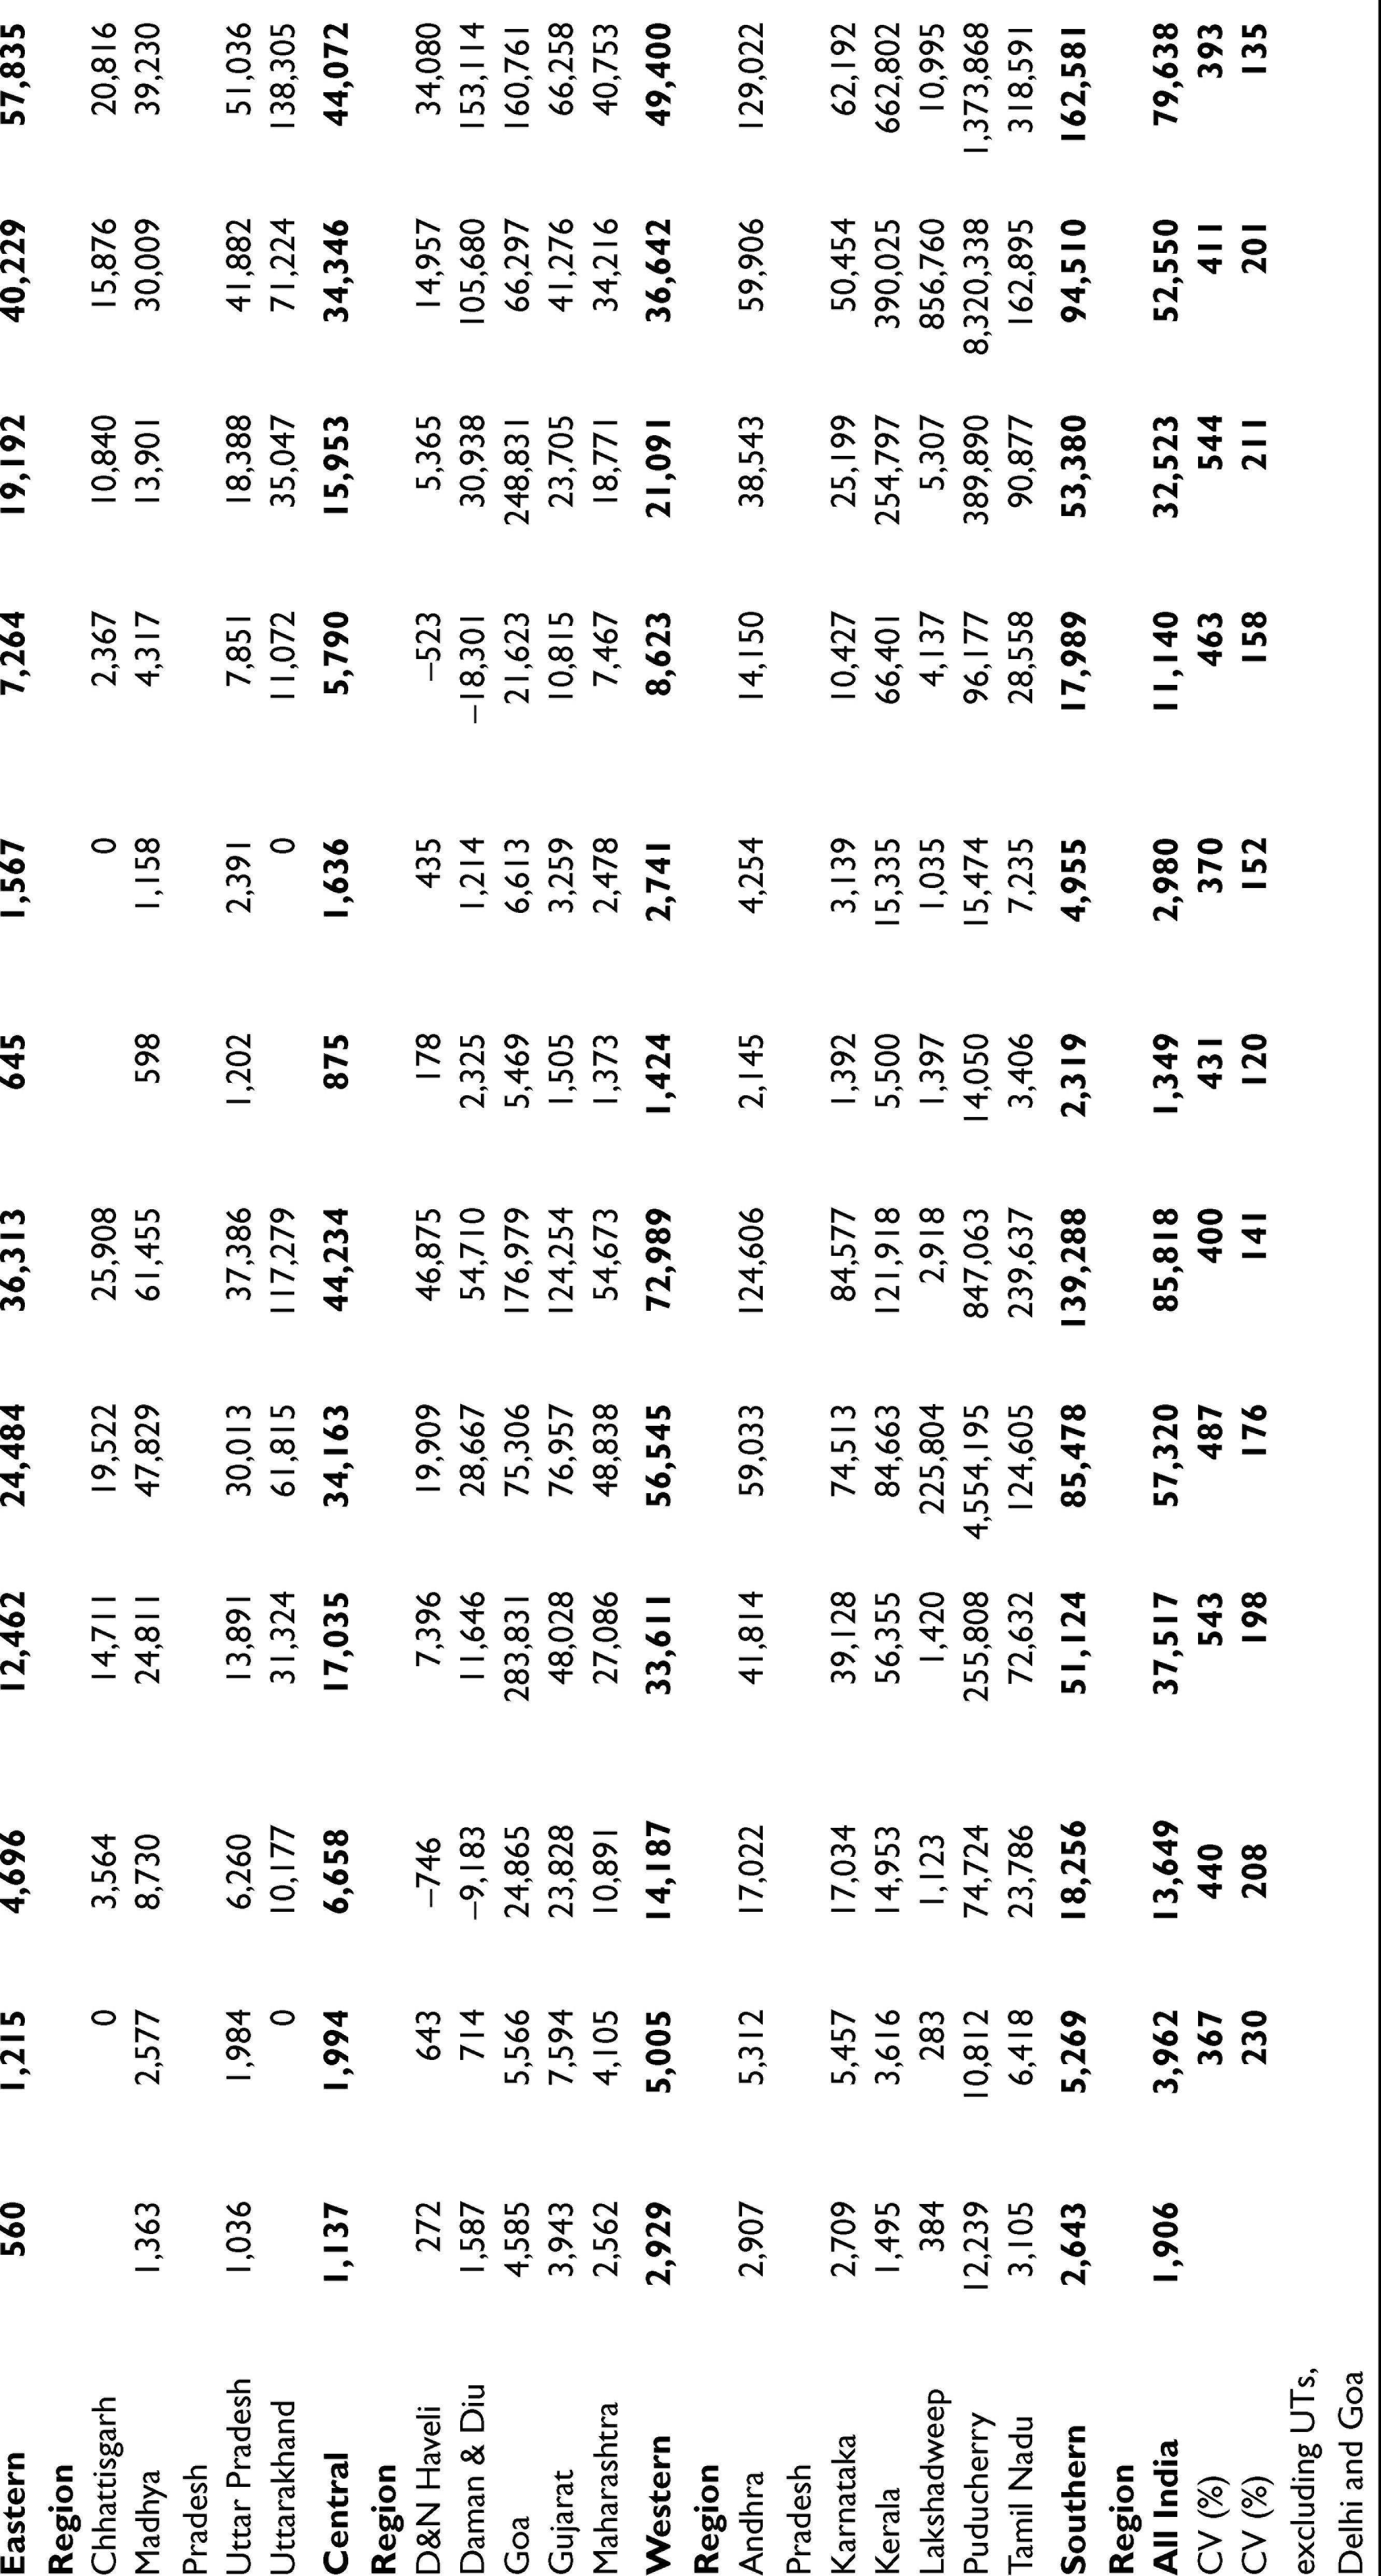
Region Wise Variations in Agricultural Credit per Operational Holding and Area
Institutional credit flow for agriculture per holding as well as area operated also varied widely from region to region. It was highest in Northern Region and the lowest in North Eastern Region. Among states in the Eastern Region, it was relatively much lower in Jharkhand and relatively high in West Bengal (Table 3). It would be seen from Table 3 that the average per holding credit flow, as of 2018–2019 was ₹85,818 in the country as a whole and as low as ₹36,313 in the Eastern Region. The average credit flow per holding in Bihar and Jharkhand was only ₹21,829 and ₹14,598, respectively. Similarly, the average credit per hectare in the country was ₹79,638, but it was less than the national average at ₹57,835 in the Eastern Region. The per hectare credit availability was as low as ₹13,238 in Jharkhand. The per hectare credit availability was the highest in the Southern Region (₹162,581), followed by the Northern Region (₹89,315). The North Eastern Region had accessed institutional credit of ₹21,200 per hectare only in 2018–2019. It is true that the per holding and per hectare credit flow for agriculture increased in both the Eastern and North Eastern Regions over time, but still they lagged far behind other regions (Table 3). Even if we exclude Chandigarh and New Delhi which are aberrations, the coefficient of inter-state variation CV (%) in institutional credit flow for agriculture per hectare increased over time from 120 in 1995–1996 to 201 in 2014–2015 and has only recently decreased to 135 in 2018–2019. In the case of institutional credit per operational holding, it decreased from 230 in 1995–1996 to 176 in 2014–2015 decreasing further to 141 in. 2018–2019 (Table 3).
Flow of Ground Level Institutional Credit (GLC) for Agriculture and Allied Activities and CV (%)
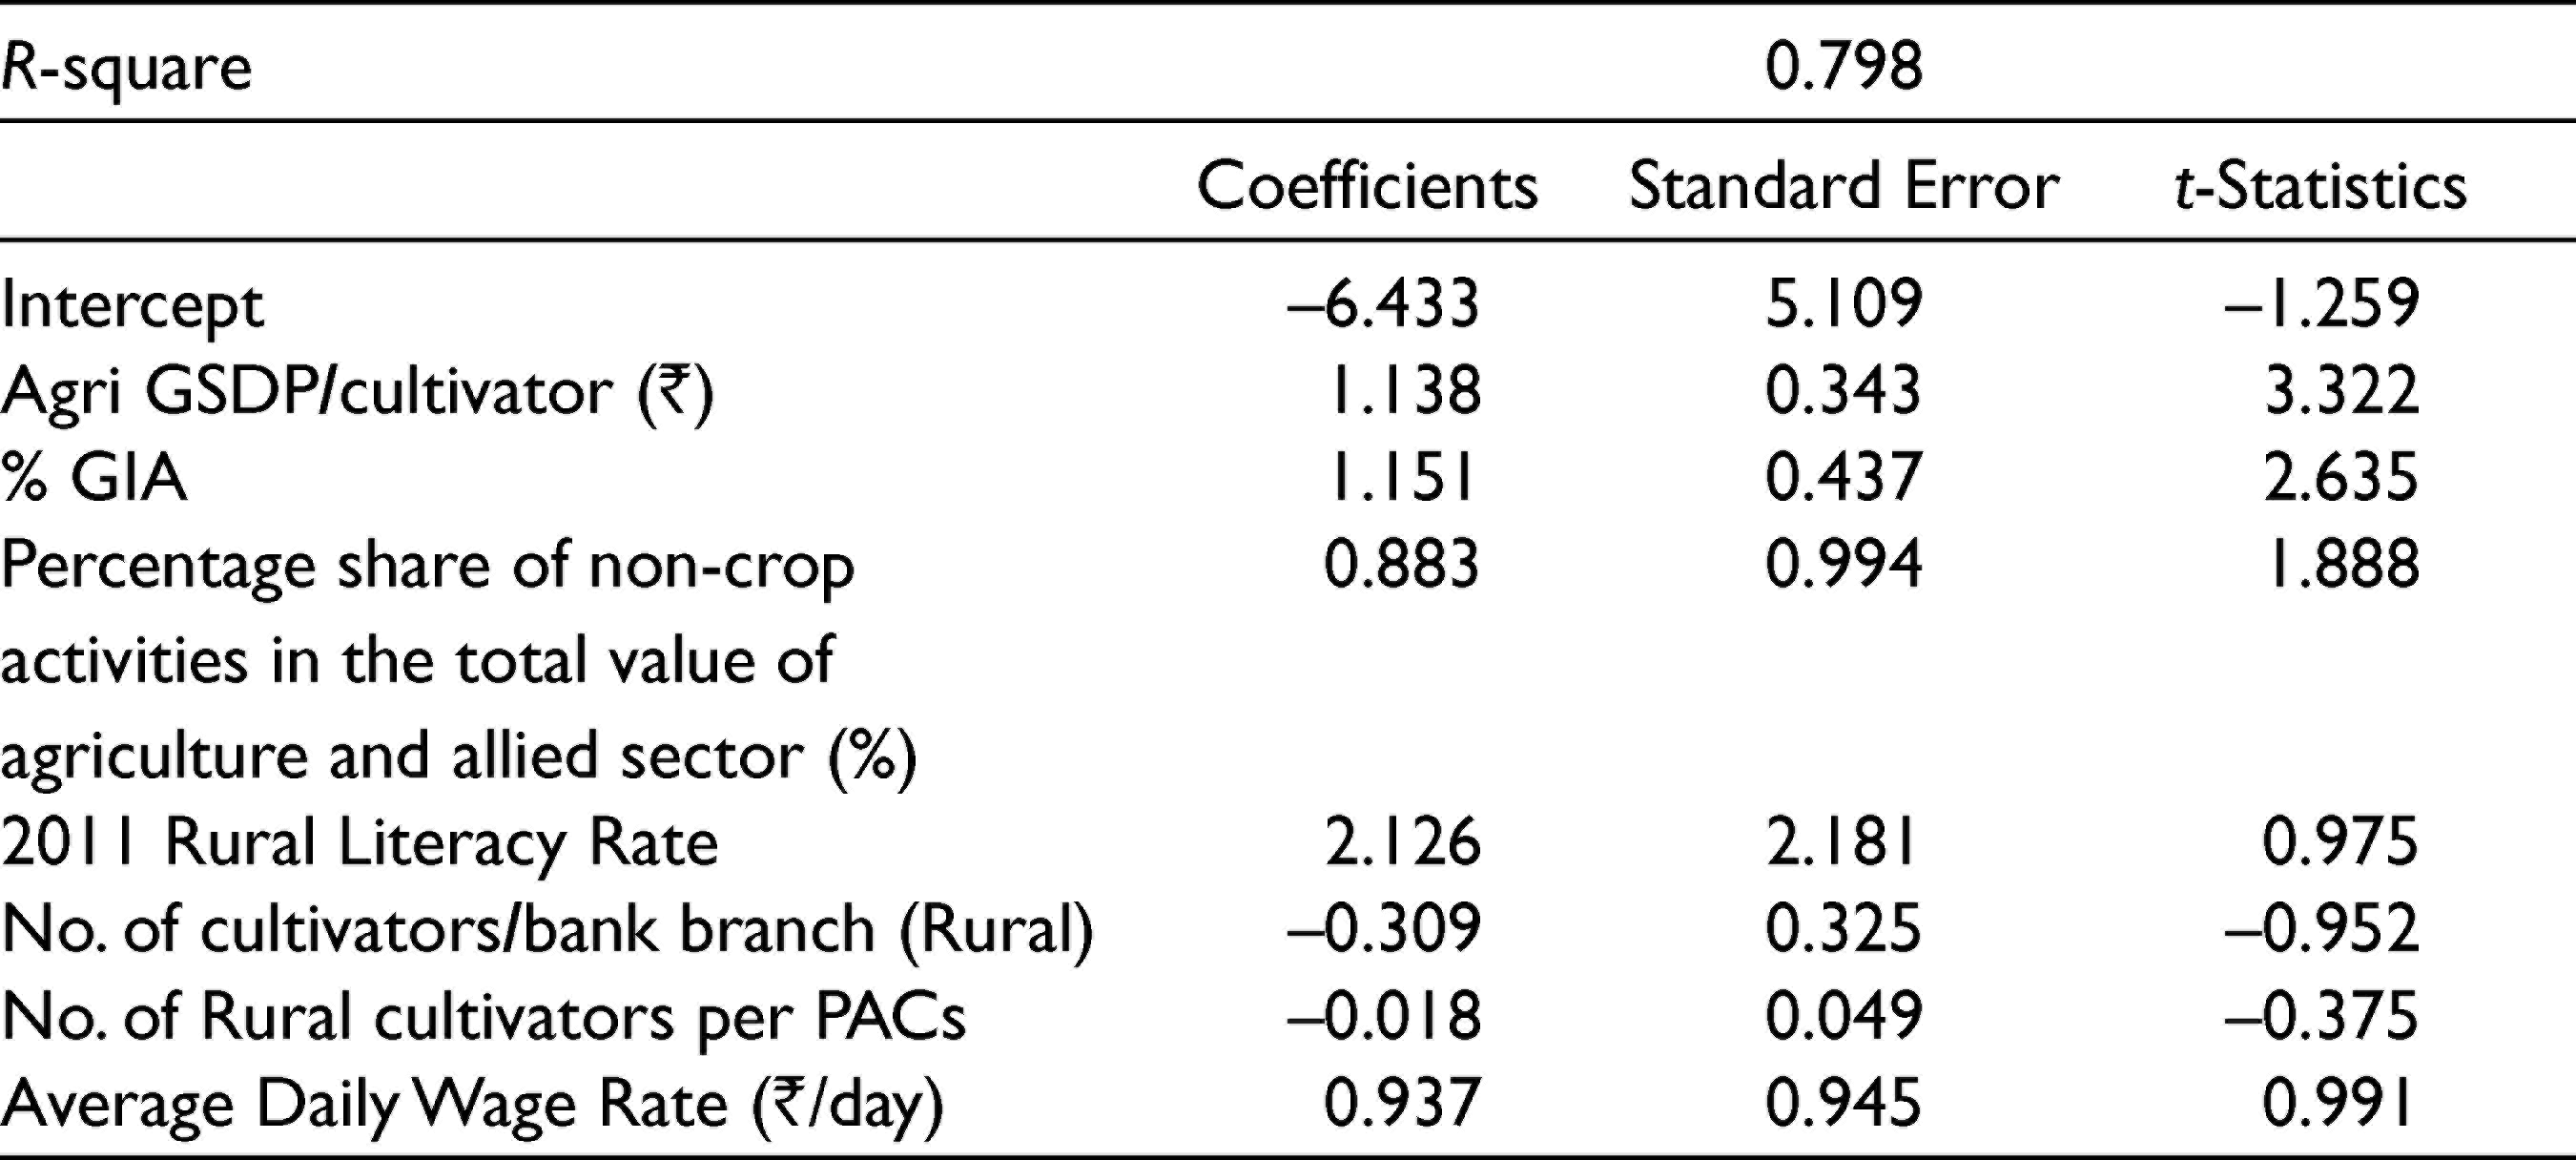
Factors Explaining the Regional Variations in Institutional Credit Flow to Agriculture
The bias in the supply of institutional credit against the Eastern Region has been reported by various scholars in the past. The question is whether the constraints to institutional credit in Eastern India are demand led or supply led. Is it due to lack of appropriate infrastructure and institutions for supply and demand for credit or poor credit absorption capacity of farmers in the region? This section makes an attempt to analyse these aspects of the problem in accessing institutional credit by farmers. Tables 4 and 5 show the elasticity coefficient of various factors influencing inter-regional variations in credit flow to agriculture and relative contributions of identified factors.
A log-log equation was estimated by using the following equation

where institutional credit per cultivator is the dependent variable and the independent variables are namely, Gross State Domestic Product (Agriculture) per cultivator, percentage gross irrigated area, percentage share of non-crop activities in the total value of agriculture and allied sector, percentage share of livestocks in total value of agriculture and allied sector, number of cultivators per bank centre, number of rural cultivators per PACs and average wage rate per day.
Further accounting formula was used to estimate the relative role of various factors in the equation using Hayami–Ruttan model.
Role of Irrigation
It is generally assumed that irrigation tends to increase cropping intensity, input use and crop productivity and therefore, irrigated areas will have greater demand for institutional credit than un-irrigated areas. In our regression analysis, percentage area irrigated turned out to be a statistically significant determinant of inter-state variation in institutional credit per hectare. The elasticity coefficient was 1.15. It means that 1% increase in irrigated area will increase the credit use per hectare by 1.15 %.
Availability of Credit Institutions and Credit for Agriculture
The availability of bank branches and primary agricultural Co-operative societies within a reasonable distance is supposed to make credit availability by farmers comparatively easy. The state-wise data of rural banking centres and credit used per cultivator show a very clear relationship. The regression coefficients of number of cultivators per bank centre, as one of the determinants of inter-regional variations in agricultural credit flow, was negative, as expected. It was –0.31, thereby indicating that 1% increase in the number of cultivators per bank centre will decrease the credit per cultivator by 0.31 %. Similarly, the relationship between number of cultivators per Primary Agricultural Co-operative Society and credit use per hectare was found to be negative but statistically non-significant (Table 4). Table 5 further shows the per cent share of these two variables in explaining the inter-regional variations in the credit flow to agriculture.
Regression Coefficient of Factors Influencing Inter-State Variations in Agriculture Credit
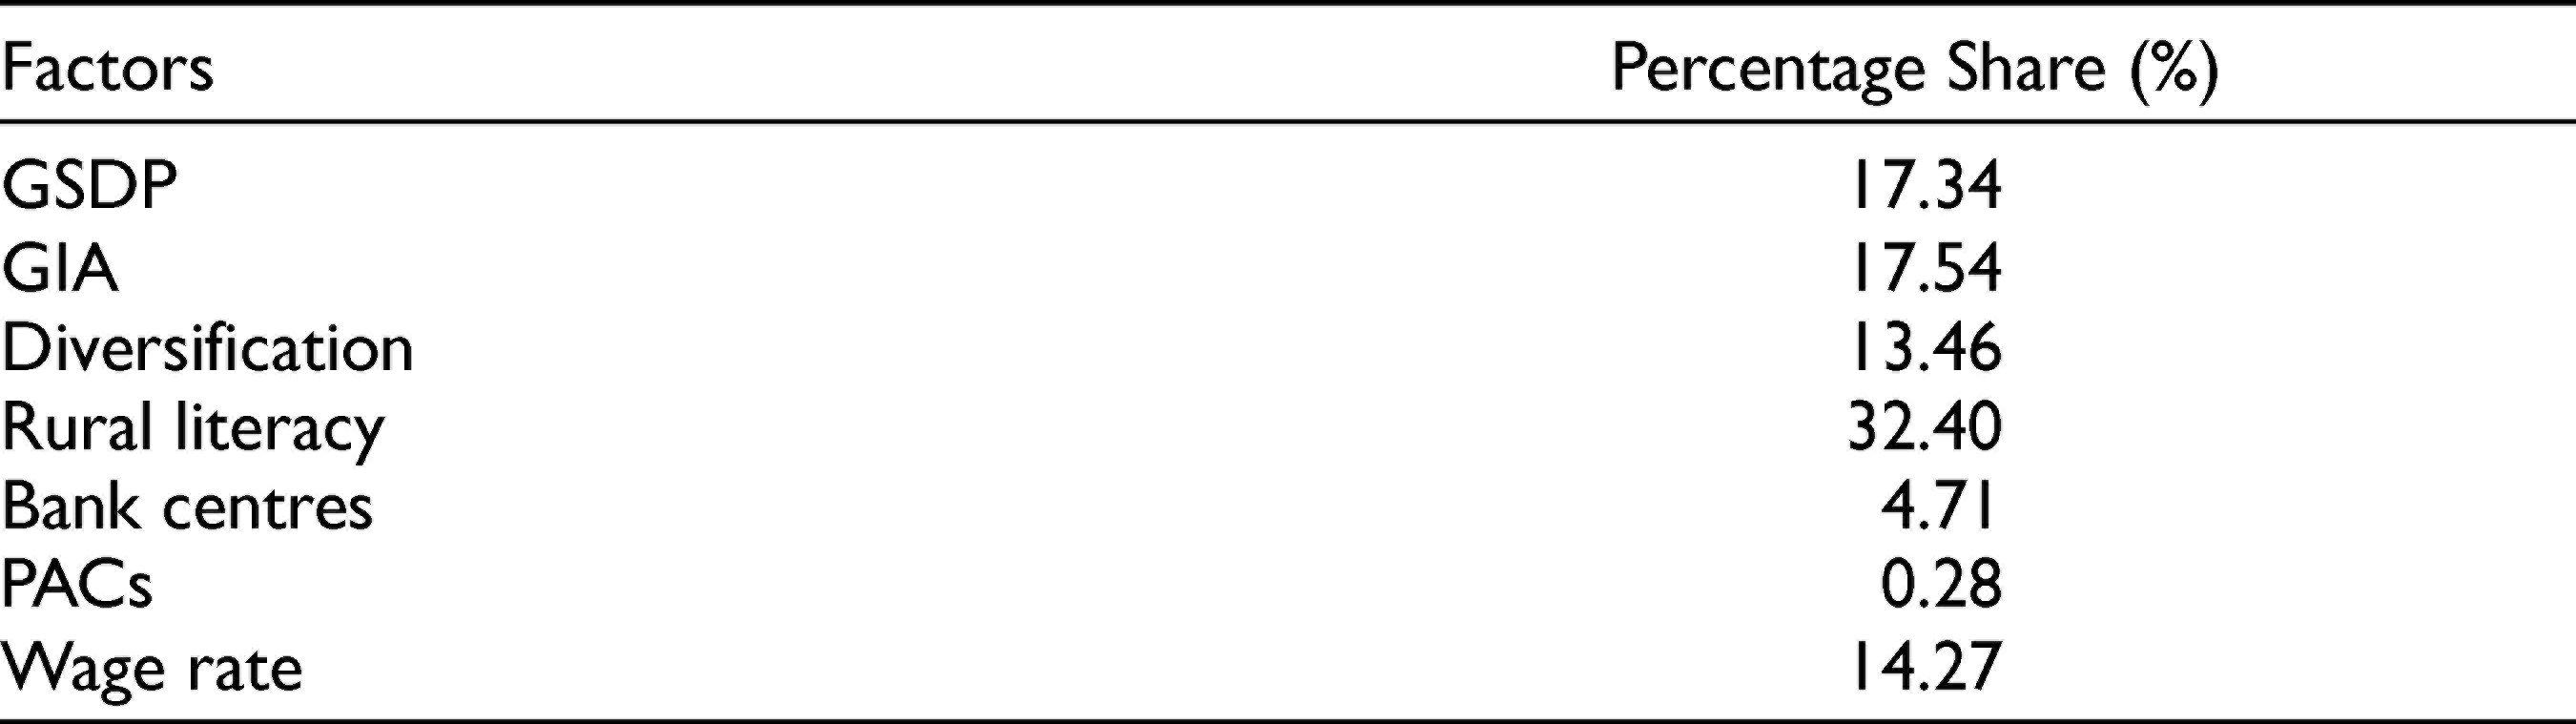
Relative Contribution of Factors Influencing Inter-state Variation Considered in the Model (%)
The important thing in this respect is that the distribution of these institutions in a region or state should be wider and these institutions should function in an efficient and farmer-friendly manner.
Gross State Domestic Product and Availability of Institutional Credit
Like irrigation, Gross State Domestic Product (per hectare or per cultivator) is supposed to enhance the credit absorption capacity in a state. The coefficient of agricultural GSDP per cultivator however, hectare as one of the explanatory variables for inter-regional variations in credit was 1.138 and statistically significant (Table 4). Besides, it may be seen from Figure 2 that the Eastern Region of India shared about 12.3% of India’s agricultural GDP, but accessed only 9.05% of institutional credit. Conversely, the Southern Region shared 29.4% of the country’s agricultural GDP and accessed 43% of the total bank credit, disbursed for agriculture.
Cost of Inputs and the Demand for Credit
The relationship between cost of inputs in a region and credit demand is supposed to be positively related for two distinct reasons. Real wage rate was used as a proxy for the cost of inputs in this analysis. First, the rise in wage rates increases the input cost which will push up the demand for short term credit. Any significant rise in the wage rate also induces the farmers to substitute labour with machines which increase the demand for investment credit. In our analysis, the relationship between daily wage rate of agricultural labourers and credit use per cultivator was found to be positive, albeit statistically insignificant (Table 5). The elasticity coefficient was 0.937.
Credit–Deposit Ratio
It can be assumed that if there is no local level deposit mobilization, the access to credit could be lower. But this cannot be proved by the existing Credit–Deposit patterns in different regions. It would be seen from Figure 3 that Southern, Western and Northern Regions of the country had relatively higher Credit–Deposit ratio than North Eastern, Eastern and Central Regions. As of 2017, the Credit–Deposit ratio in the Eastern Region was only 43.0, against 88.5 in the Western Region and 86.6 in the Southern Region. In fact, the Credit–Deposit ratio in the Eastern Region dropped from 52.6 in 1990 to 43.0 in 2017, while that for the Southern Region increased from an already high ratio of 83.2 in 1990 to 86.6 in 2017. In Bihar and Jharkhand, the Credit–Deposit ratio was as low as 32.0 and 29.1 respectively, while it was above 100 in Tamil Nadu and Andhra Pradesh (104). Certainly, the managerial efficiency of institutions in a region has a role in this matter, in addition to credit absorption capacity and other factors (Figure 3).
Commercialization and Diversification of Agriculture
Commercialization of agriculture is supposed to be one of the important drivers of growth of institutional credit. As farmers diversify in favour of commercial crops and high-value crops, the demand for credit would rise. Viewed from this perspective, the share in the value of non-crop activities in the total value of output of agriculture and allied sector in each state was compared with state-wise flow of agricultural credit per hectare. The coefficient of the percentage share of value of non-crop output to total value of output of agriculture and allied sector, as one of the determinants was positive, but statistically non-significant (Table 4). It was 0.883. It indicates that 1% increase in the share of value of non-crop output raises the credit use by 0.90 %, although this is not a very stable relationship as the coefficient was not statistically significant.
It would be seen from Table 4 that factors like percentage irrigated area, non-crop diversification, average wage rate, state agricultural domestic product and density of bank centres and Primary Agricultural Co-operative Societies explained 80% of the total inter-state variation in credit.
Further, it can be seen from Table 6 that the correlation coefficient between the credit disbursed per hectare and the Gross State Domestic Product per hectare is as high as 0.986 implying a very strong positive relation between the two variables. Similarly, if we look at the relationship between credit disbursed per hectare and Gross State Domestic Product per hectare in agriculture is 0.6 which is again a strong positive correlation between the two.
Results of Farm Level Survey
The primary data were collected from selected districts of Bihar, West Bengal and Odisha, the list of which is given in Table 7. Of the total sample of 1,200 farm households, 506 were marginal farmers, 371 small farmers, 212 semi–medium farmers, 79 medium farmers and 32 large farmers. Also, 1,087 were male-headed and 113 female-headed formed a part of the total samples.
Coefficient of Correlation

List of Sample District/Villages
Small Farmers’ Access to Credit
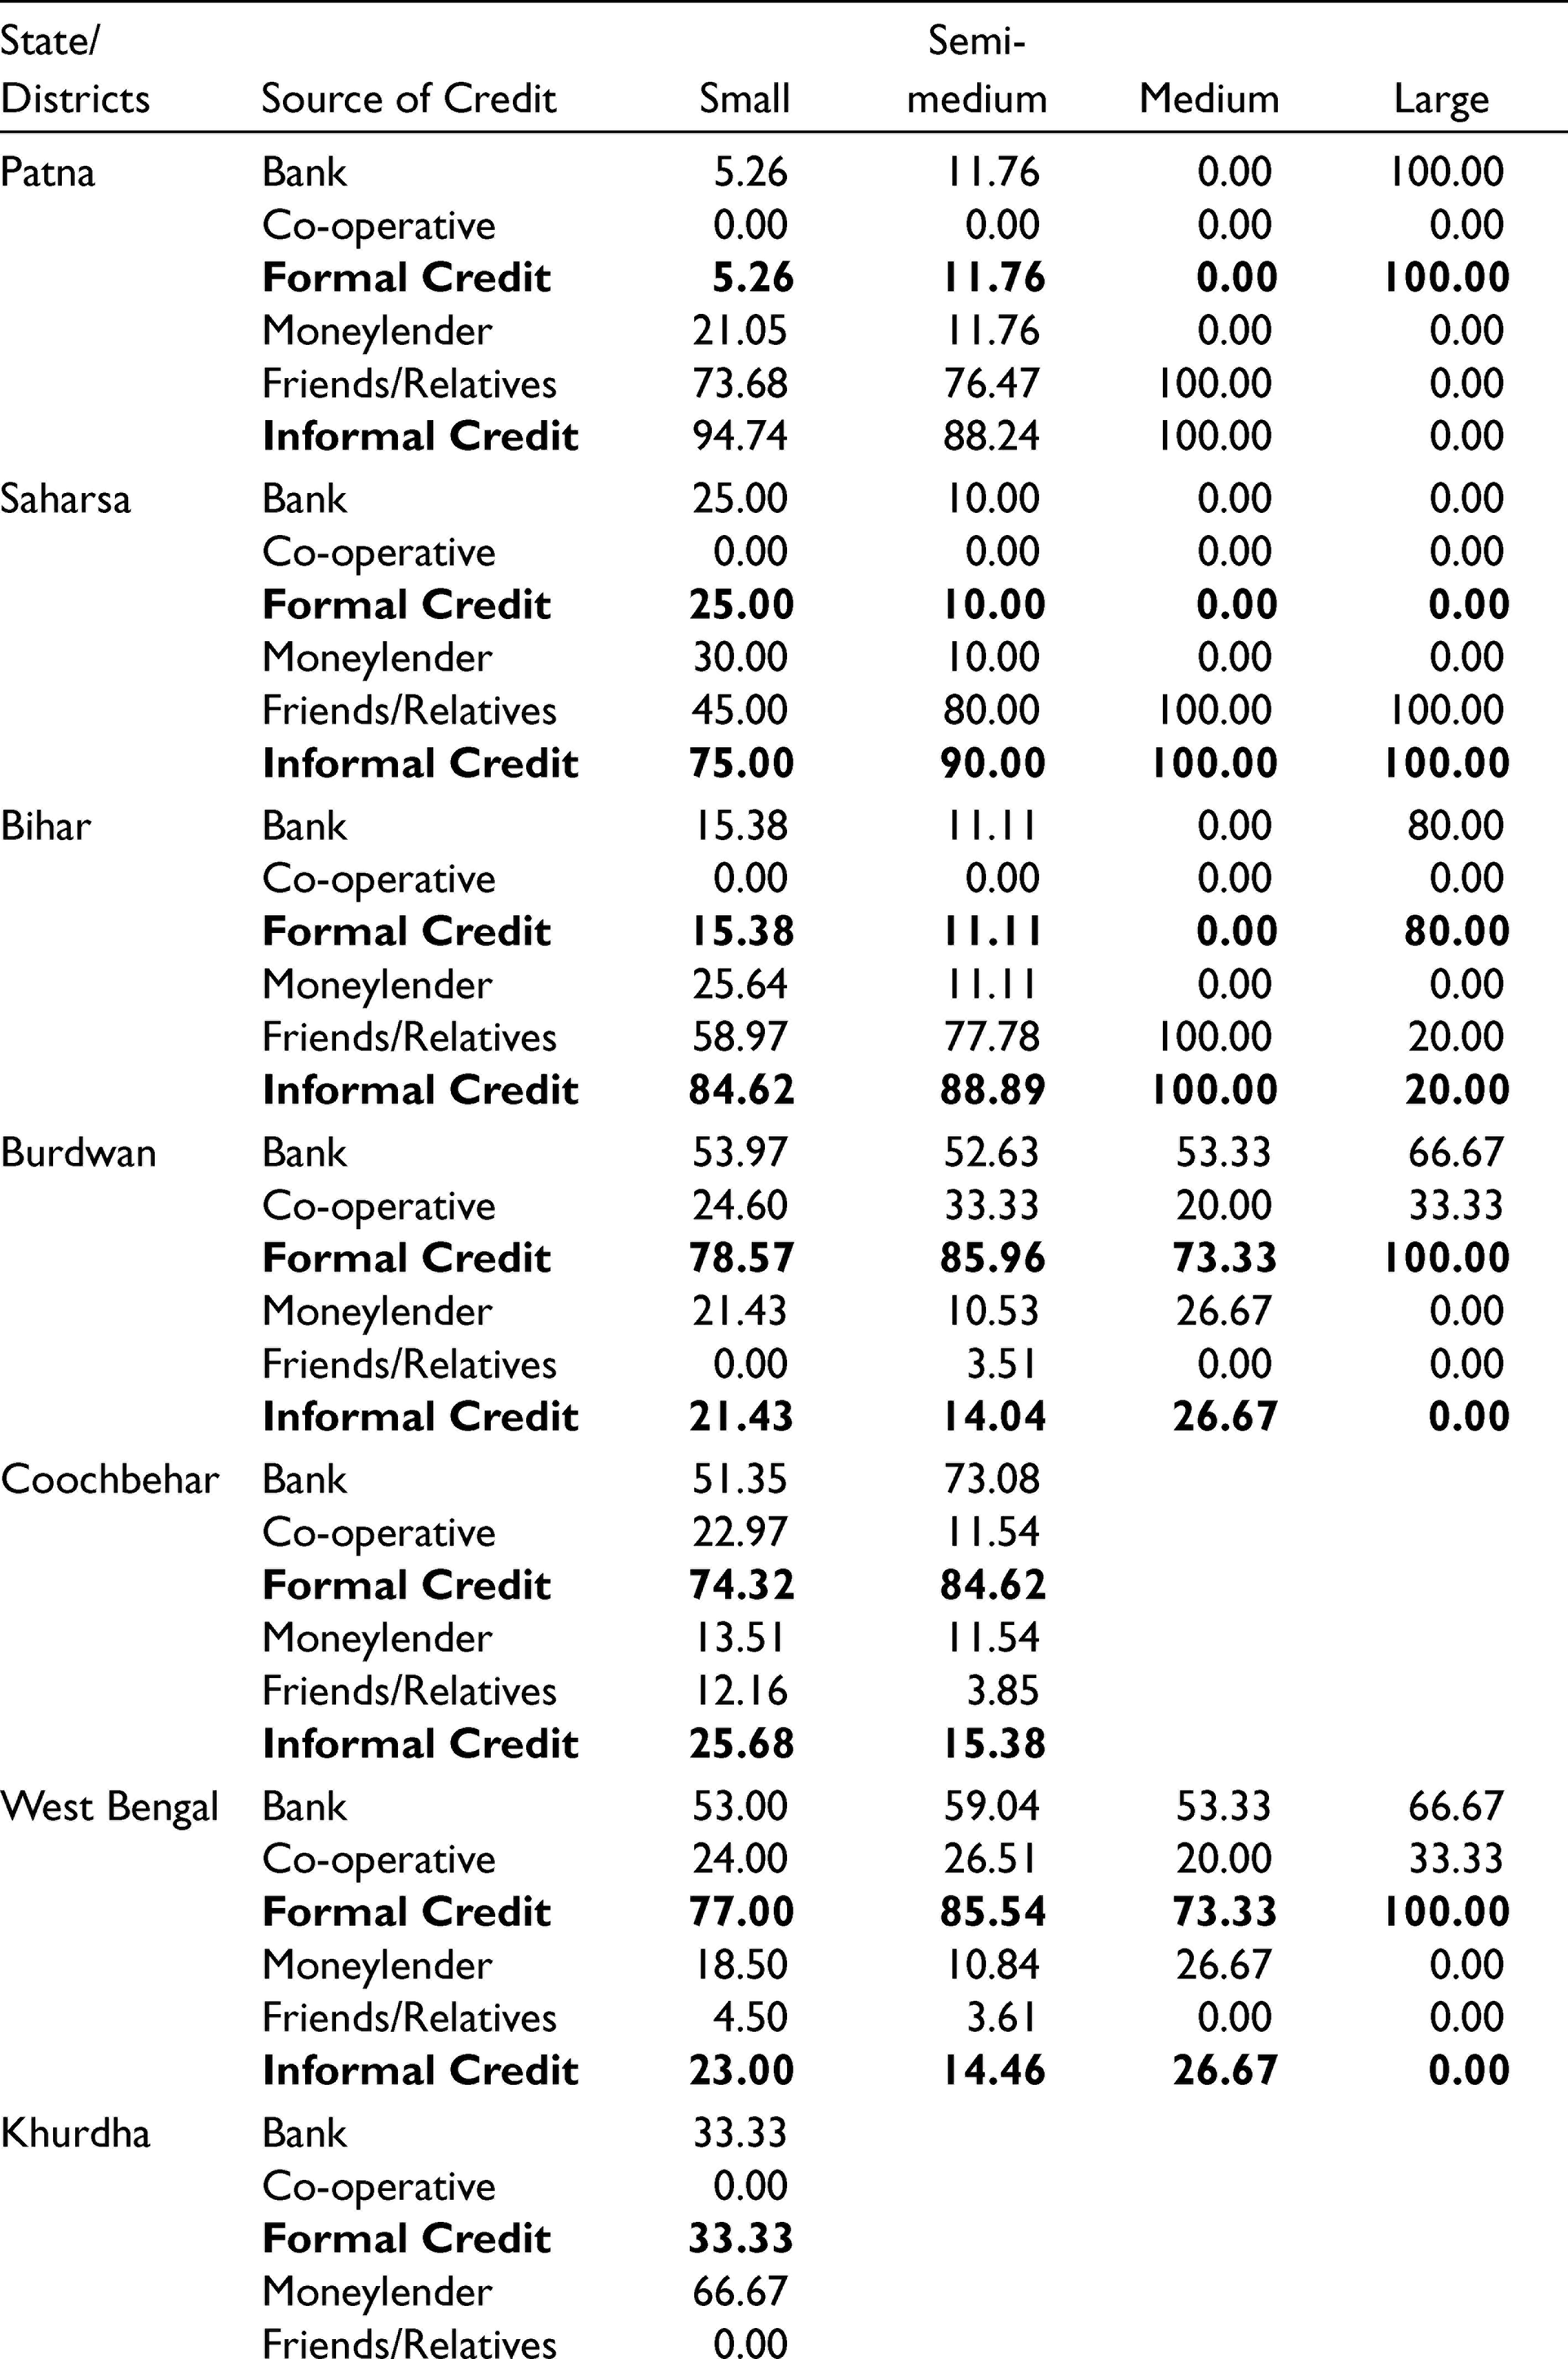
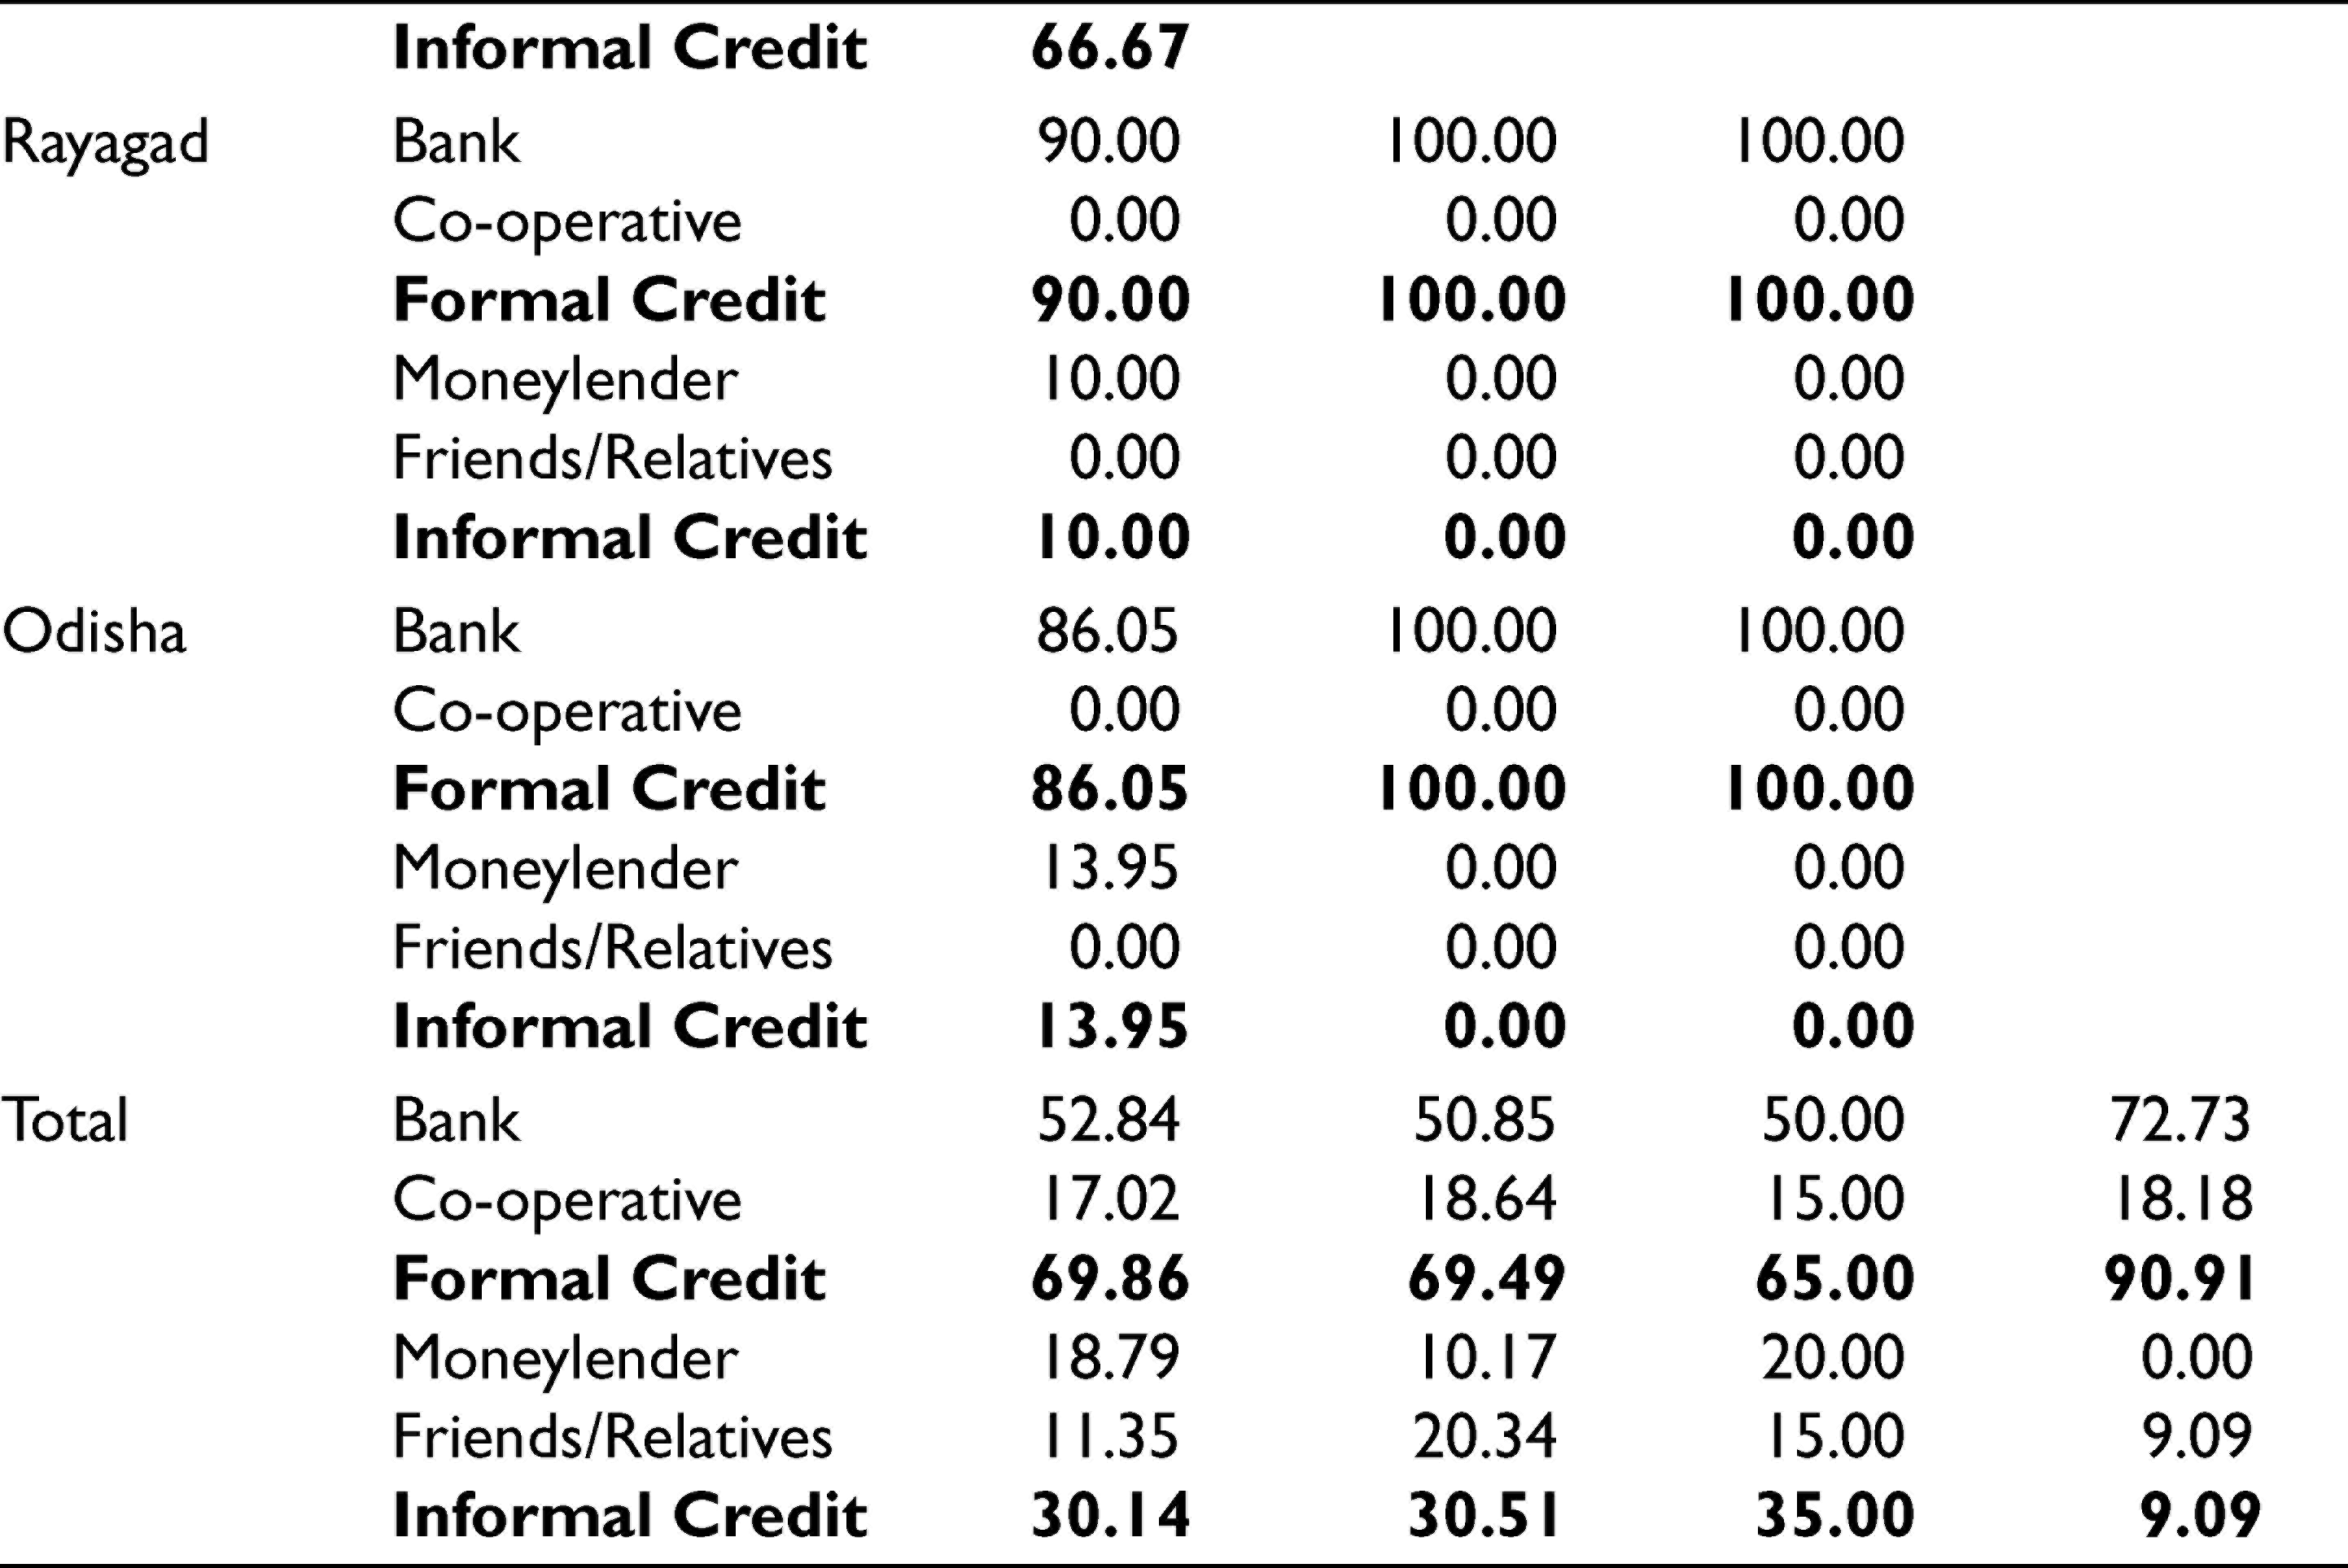
During the course of the survey, the dependence of farmers belonging to different land-size classes on various sources of credit, both formal as well as informal, was captured. Table 8 summarizes the findings. On the whole, it is seen that of all the farmers borrowing credit, an average of around 30% of the small, semi-medium and medium farmers are dependent on informal sources of credit while only 9% of large farmers depend on friends and moneylenders for their credit requirements. State-wise the picture is very different and the heavy dependence of smaller farmers of Bihar on informal sources of credit is quite apparent.
Percentage Distribution of Household Taking Credit According to Source of Credit by Land Size
Women Farmers’ Access to Credit
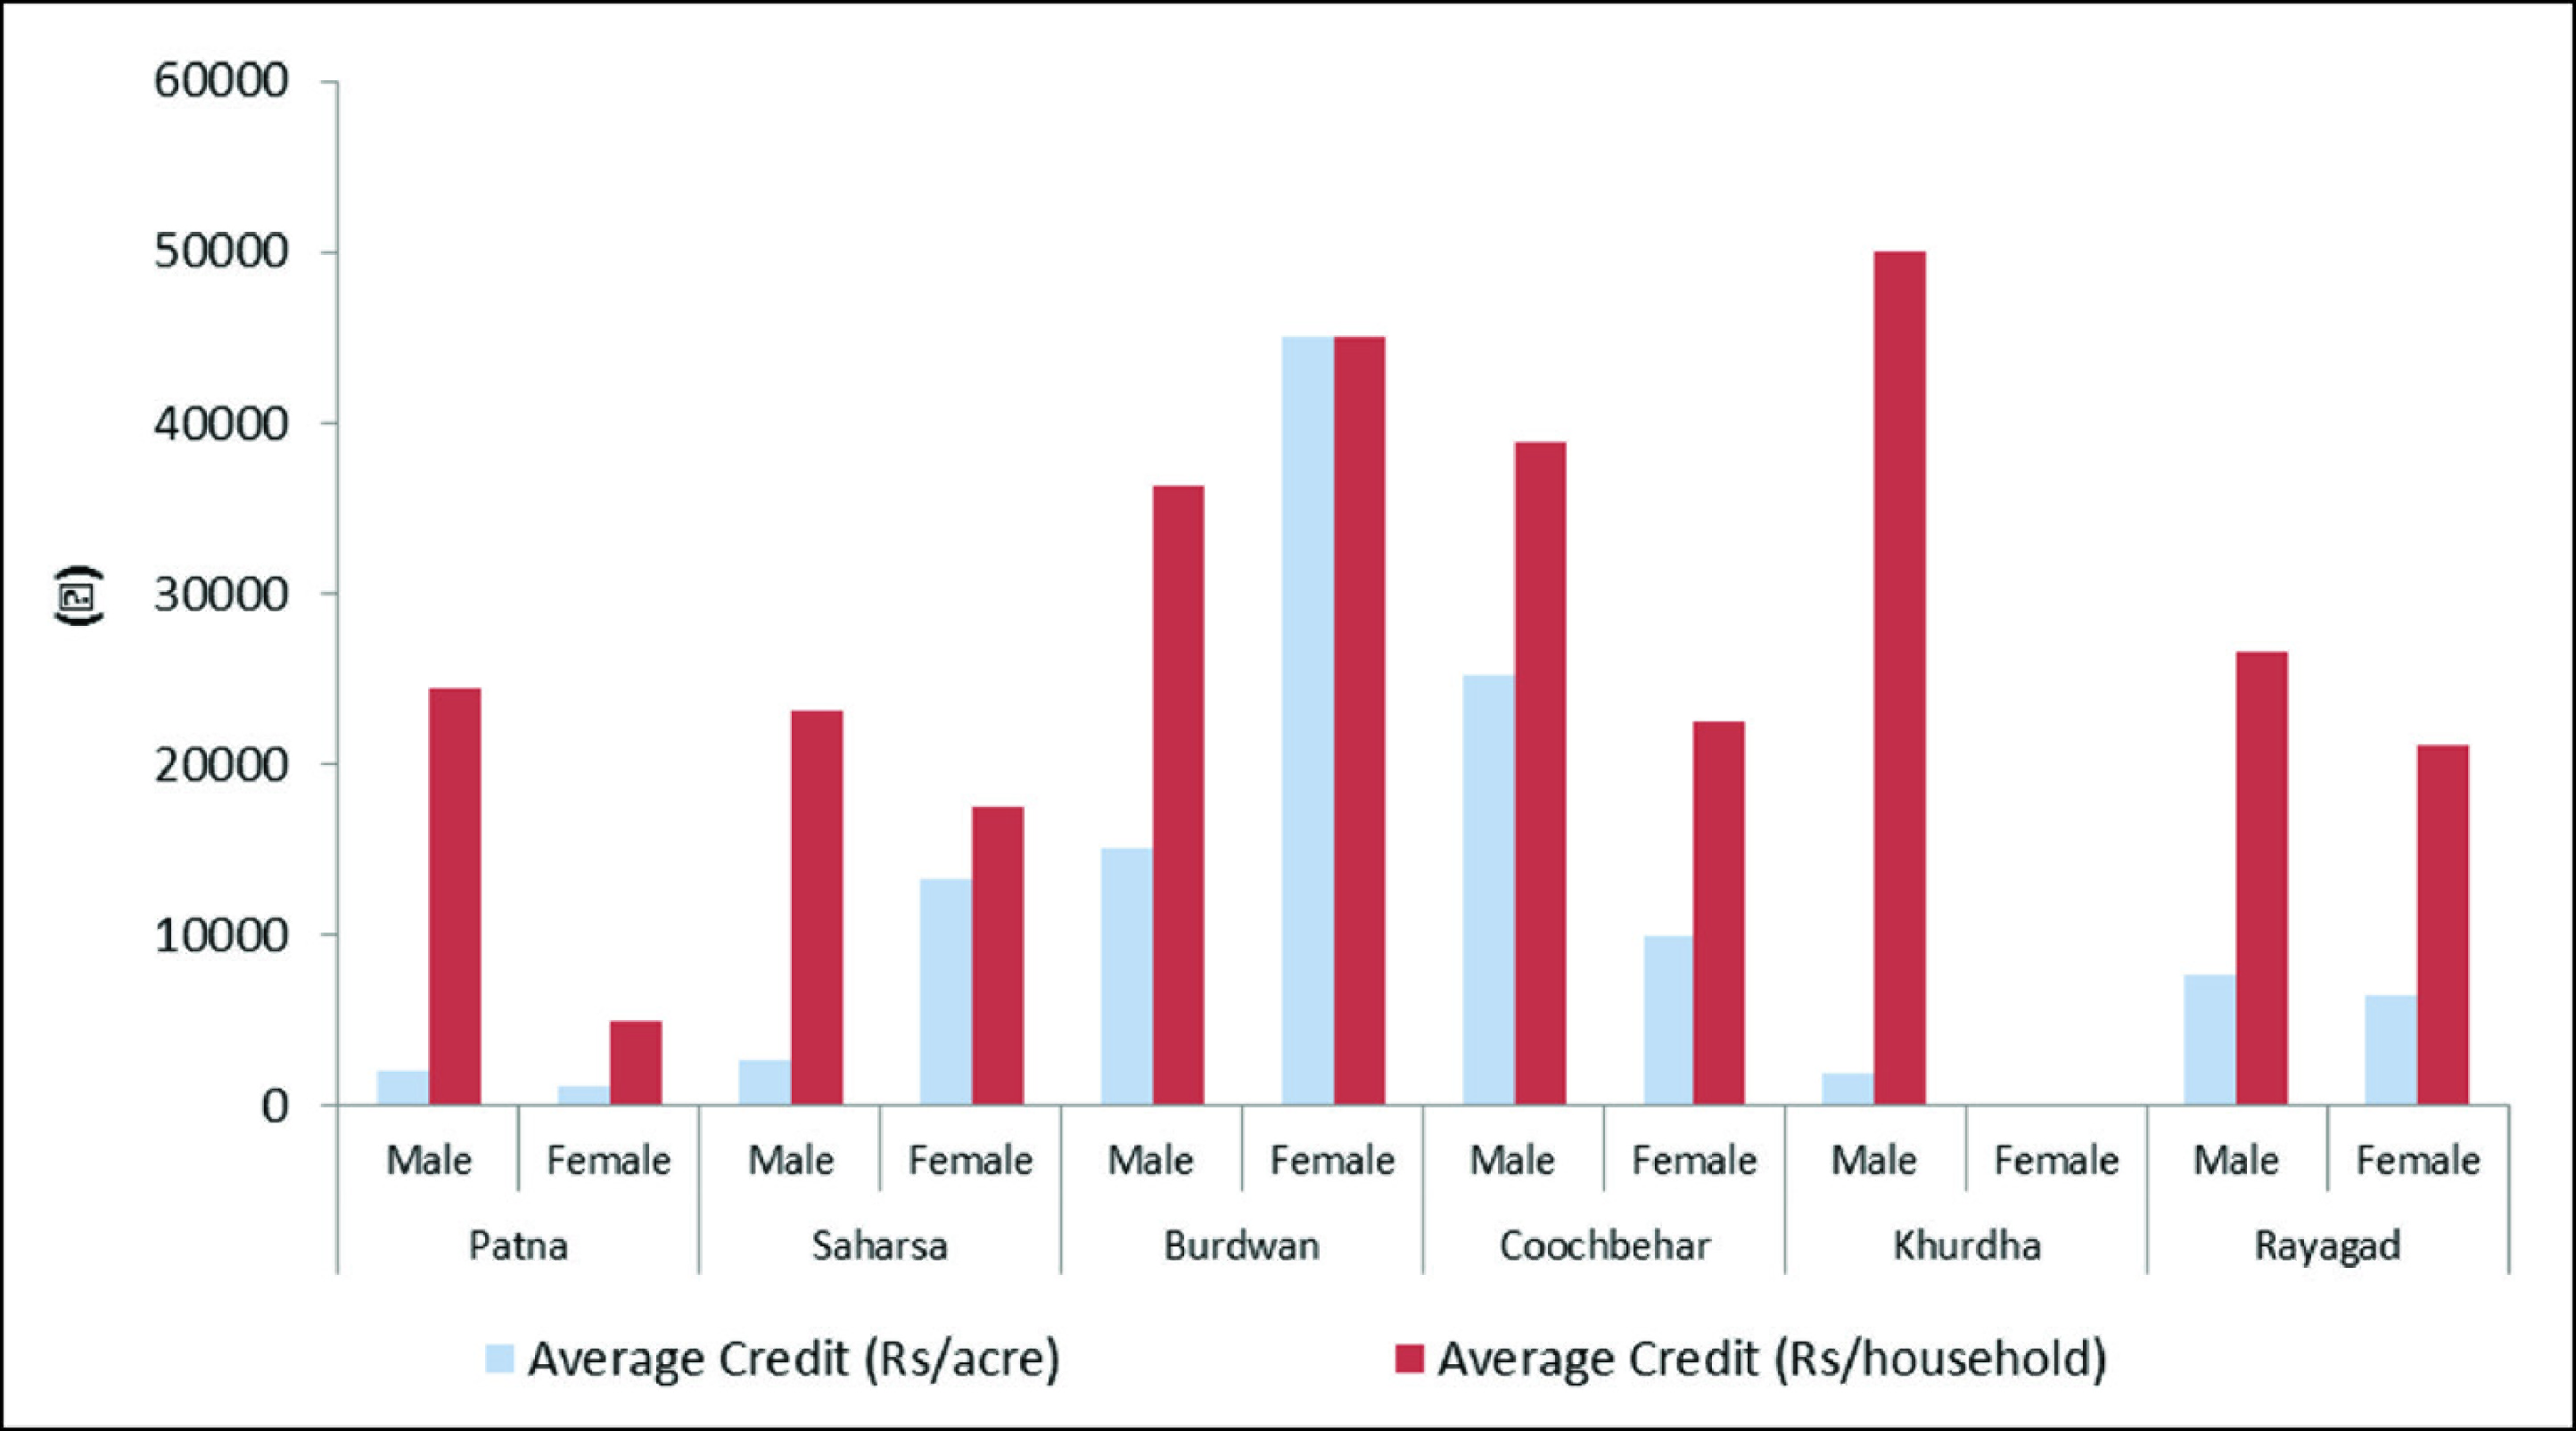
It can be seen from Figure 4 and Table 9 that women farmers borrowed relatively more per acre than male farmers in all the three selected states of Bihar, West Bengal and Odisha. Considering all the three states, the average loan per acre taken by women farmers was ₹11,882 per acre against ₹8,706 per acre by men. The average loan per household by women farmers however was ₹26,163 and ₹33,827 for men. The average loan taken by women farmers in Bihar was ₹5,776 per acre against ₹2,255 per acre by men and in West Bengal, it was ₹19,783 by women and ₹17,410 by men. In Odisha, the average loan taken by women farmers was ₹6,500 per acre, against ₹5,678 by men. However, the districts of Patna in Bihar, Cooch Behar in West Bengal and Rayagada in Odisha, male farmers had borrowed comparatively more per acre than women farmers. The access to credit per household was relatively more by men than women farmers (Table 9). This pattern of higher credit access by men was observed in almost all the surveyed district, excepting Burdwan in West Bengal, where the average credit per household was ₹36,276 by men and ₹45,000 by women farmers (Figure 4).
Percentage Distribution of Source of Credit by Gender
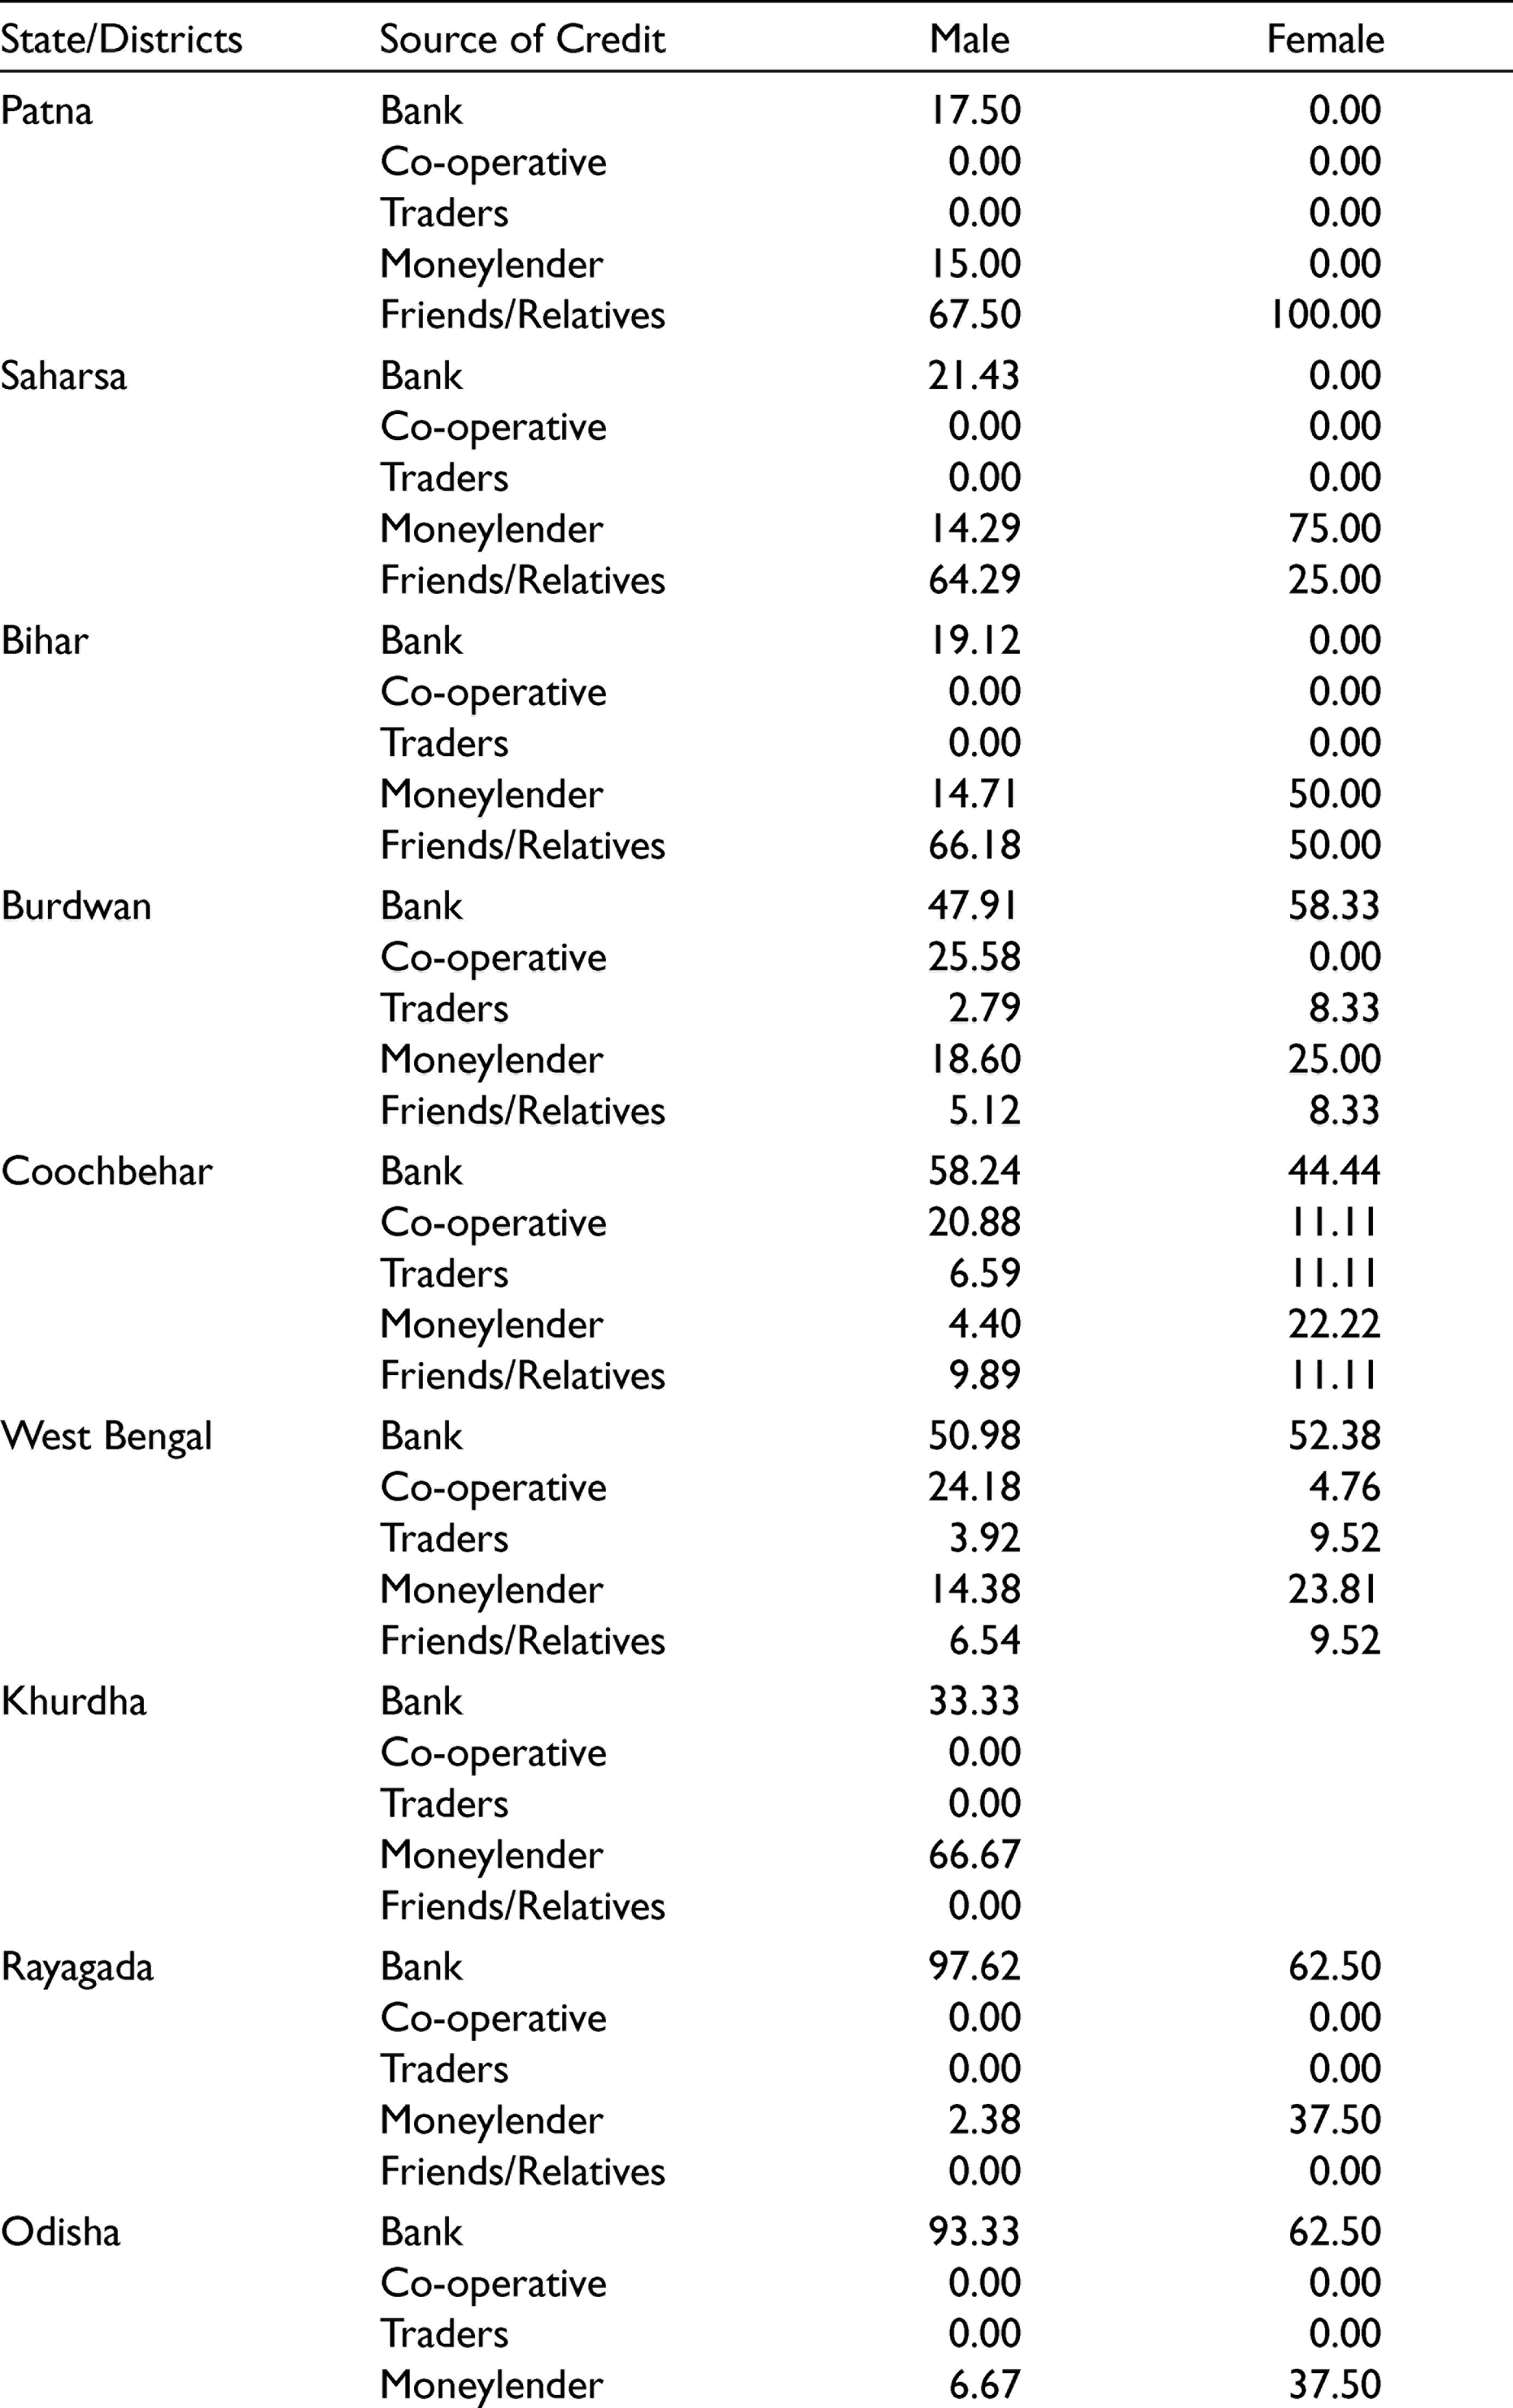
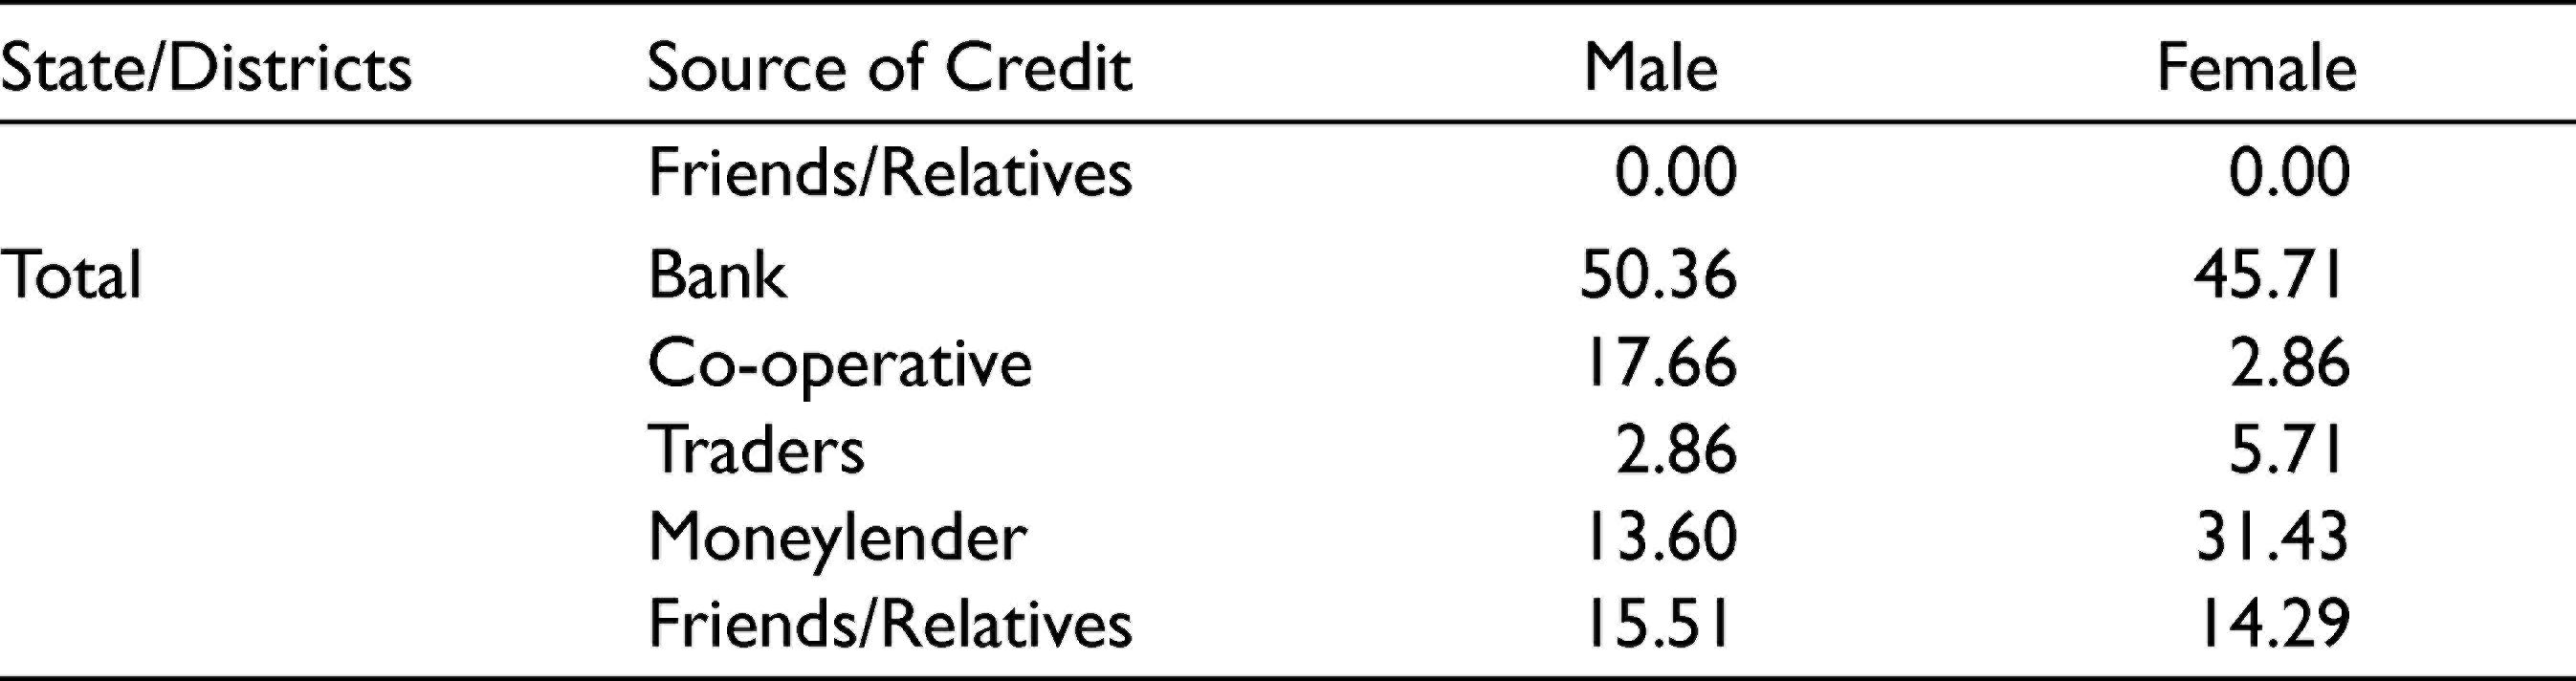
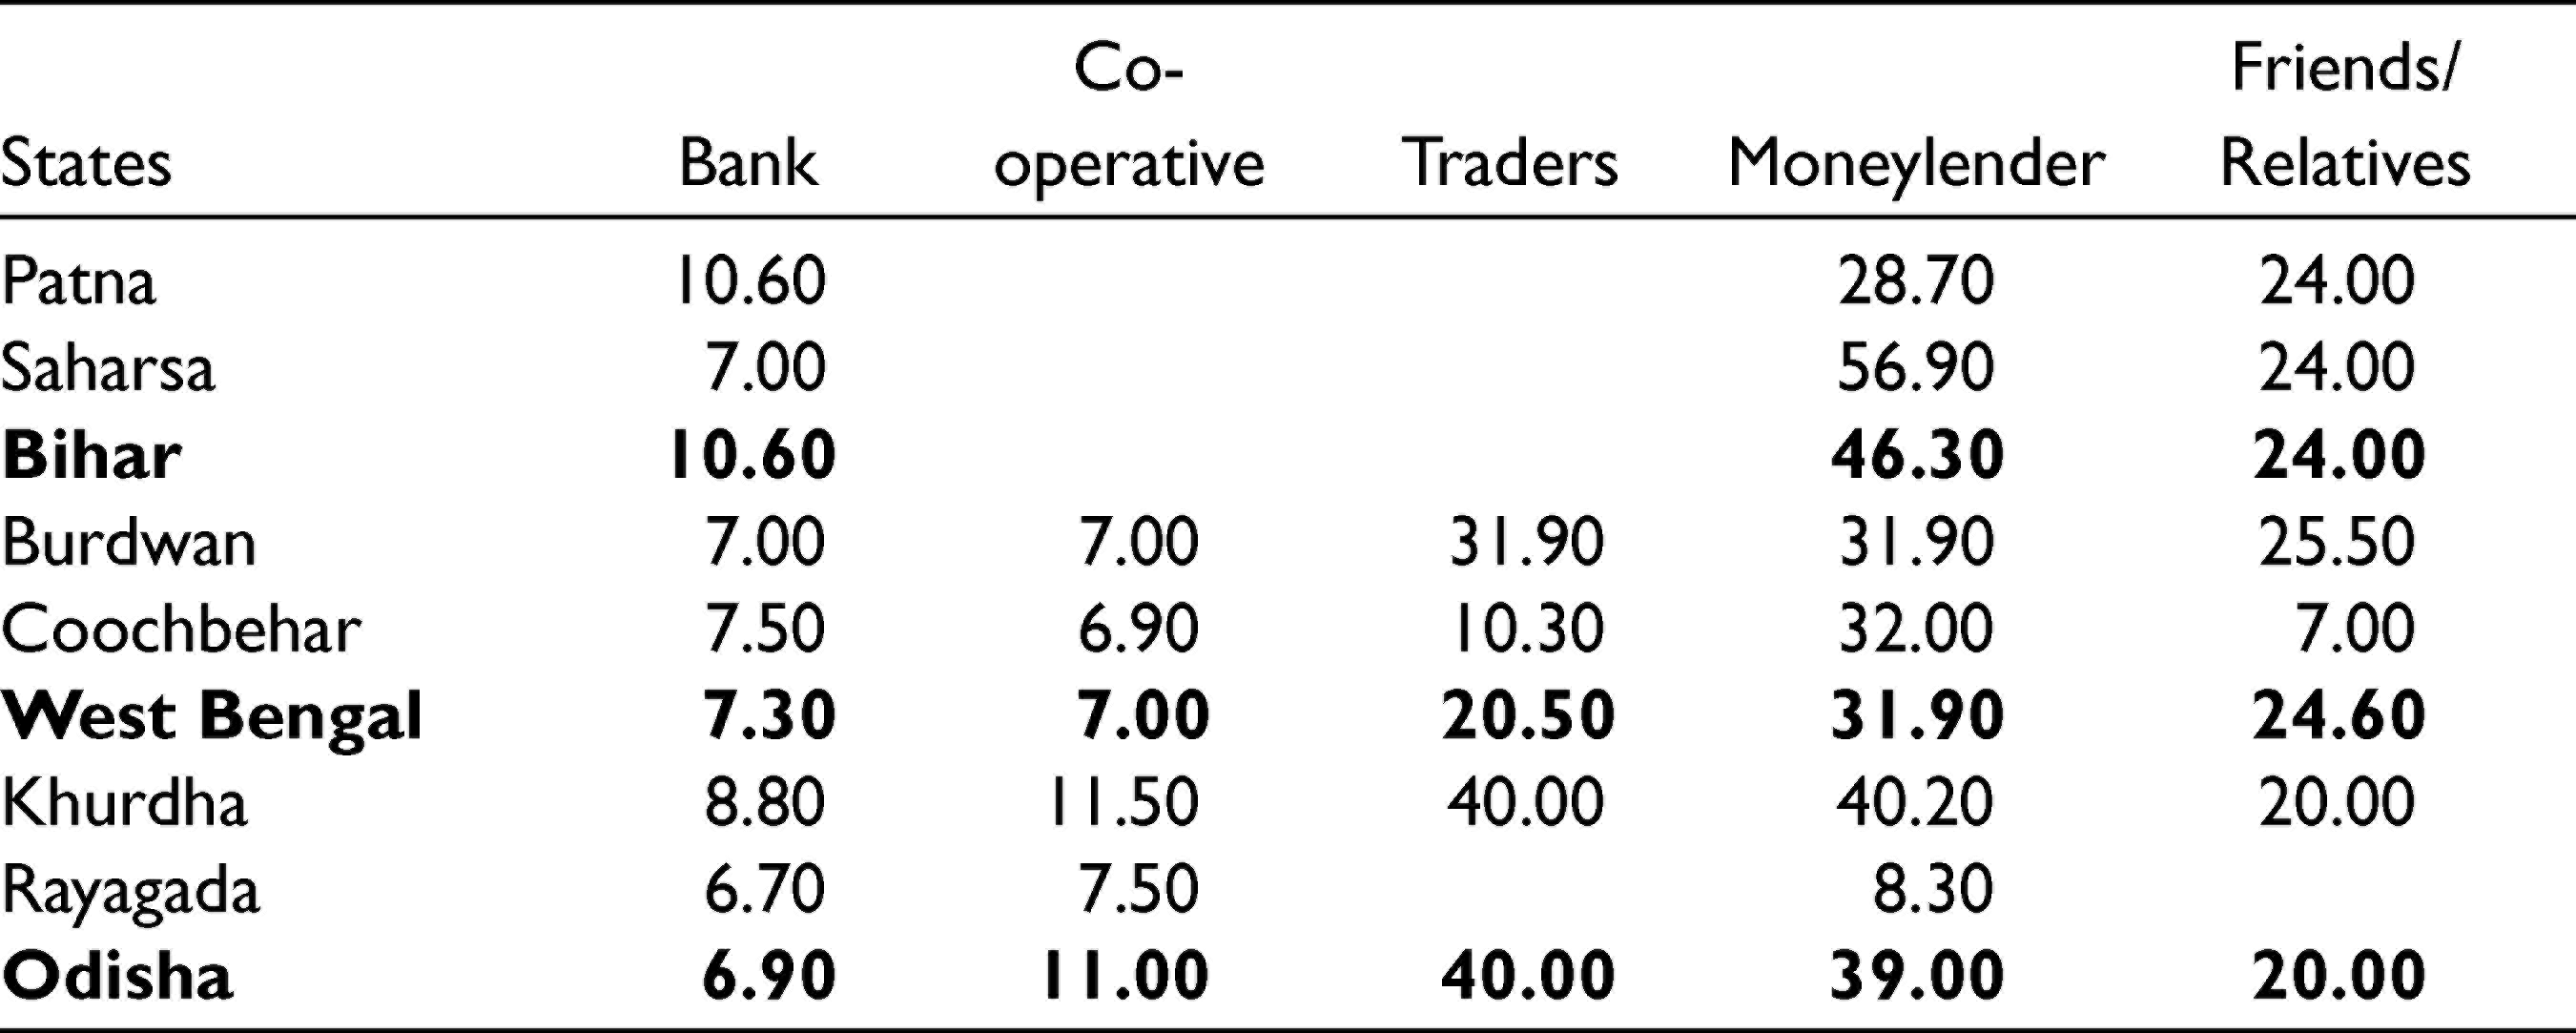
It is to be noted that, as shown in Table 10, rates of interest on loan from traders, moneylenders as well as friends and relations were much higher than those charged by banks and co-operatives and thus women farmers were more exploited on account of their greater dependence on non-institutional sources of credit.
Agency-wise Rate of Interest for Agricultural Credit
Production Versus Investment Credit
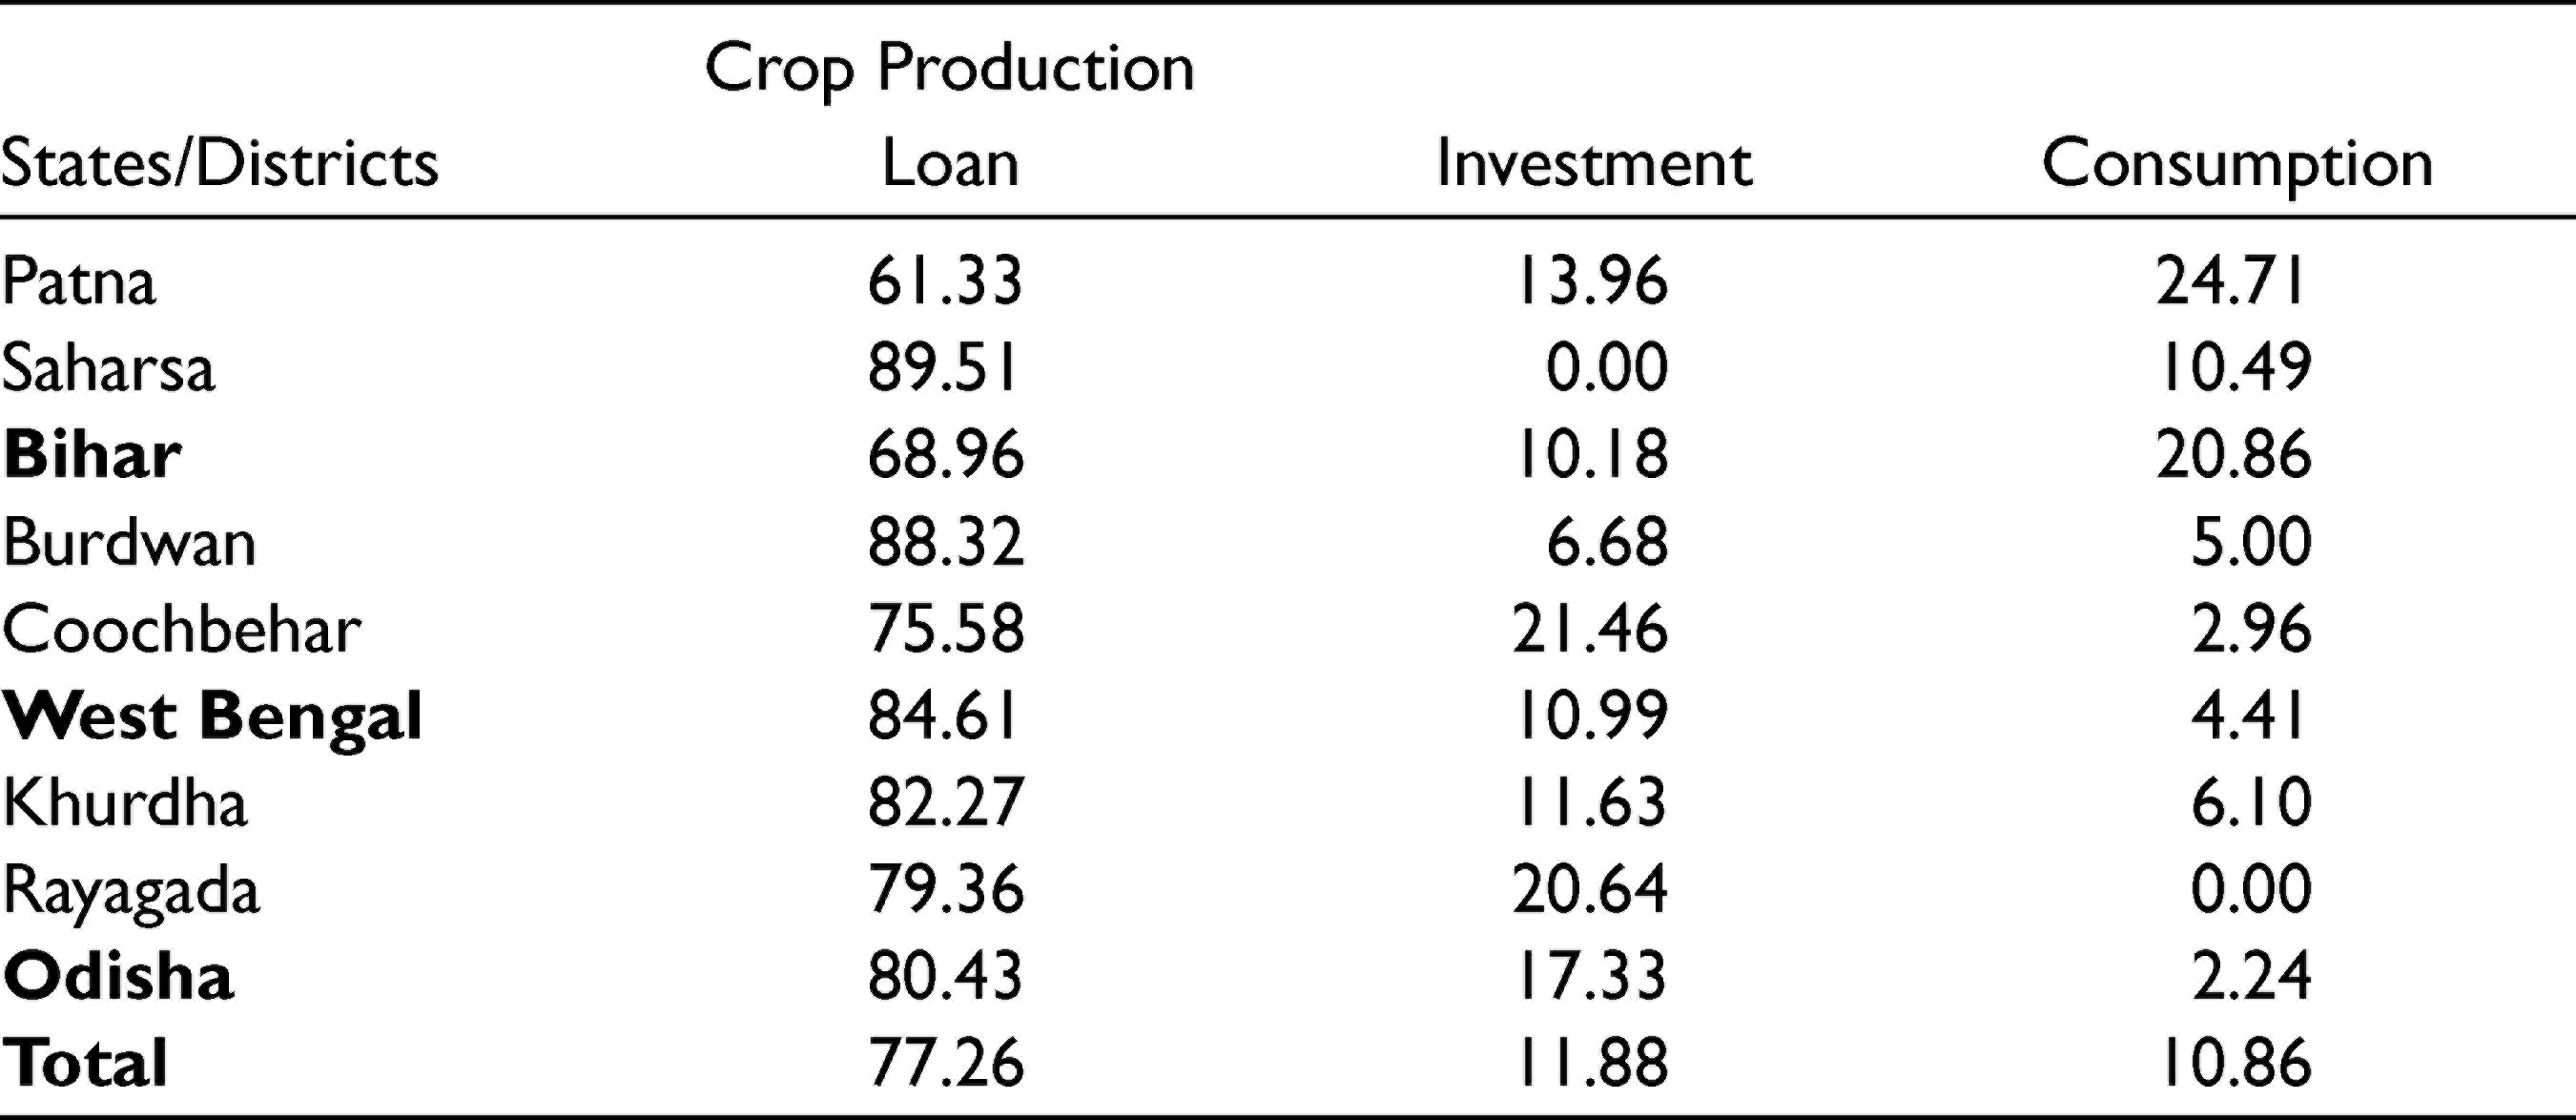
In the surveyed villages as a whole, about 77.3% of total credit was crop production loan and only about 11.9% was investment loan and the remaining was consumption loan (Table 11). While investment credit constituted around 14% of total credit in Patna, none of the farmers in the sample said to have taken investment loan in Saharsa. In West Bengal, 6.7% in Burdwan and 21.46% in Cooch Behar took credit for investment purposes while in Odisha, 11.6% in Khurda and 20.6% in Rayagada said to have taken term loan. Crop production (short term) credit constituted 100% of the total credit by farmers in Saharsa district of Jharkhand.
Percentage Share of Credit by Type of Credit
Case for Higher Institutional Credit for Agriculture in the Eastern Region
Based on various criteria, Eastern Region of the country deserves a better deal in terms of the supply of institutional credit to agriculture. The case for higher institutional credit for the Eastern Region is based on the following facts:
The Eastern Region shared only about 9% of the total credit flow for agriculture in 2018–2019, even though it shared about 26% of the total irrigated area. Also, the cropping intensity in the Eastern Region (145%) was highest in the country. But institutional credit availability per hectare as well as per cultivator in Tamil Nadu and Andhra Pradesh is several times more than that in Bihar and West Bengal. As irrigation turns out to be one of the key significant determinants of credit access, there is scope and need for enhancing irrigation facilities in the Eastern Region with increased investment credit support. As discussed, the credit–deposit ratio in the Eastern Region is one of the lowest in the country. Moreover, within the Eastern Region, it was as low as 32 in Bihar, 29.1 in Jharkhand, 40.5 in Odisha and 52.5 in West Bengal. There is no reason why the locally mobilized deposits cannot be utilized locally for loans to promote input use and investment in agriculture. The Eastern Region shared about 12.3% of India’s agricultural GDP but accessed only 9% of institutional credit. This poses a big question of whether credit absorption capacity of a State has anything to do with its present access to institutional credit. The Eastern Region certainly deserves a better deal. The Eastern Region has relatively higher level of agricultural diversification than the Southern Region, but lower access to institutional credit per hectare as well as per cultivator. The higher level of agricultural diversification would sustain only with increased institutional credit supply. The average area, as well as number of cultivators serviced by a bank centre in the Eastern Region, is more than that in the Southern Region. So, there is scope for increasing the number of bank branches in some areas and increasing the flow of bank credit for agriculture, in the Eastern Region. The states of Jharkhand and Bihar require special attention in this regard. Also, the co-operative institutions are extremely weak in Jharkhand in this context. The share of Eastern Region is lower in both production as well as investment credit, although investment credit particularly in Jharkhand, Bihar and Odisha suffered most. There should be efforts to strengthen the co-operative credit institutions and increase the co-operative credit flow for agriculture. As of 2018–2019, Jharkhand shared only 0.33% and Odisha 2.2% of the total ground level credit flow for agriculture in the country, against Tamil Nadu sharing 15.1% and Andhra Pradesh sharing 14.35% of the total credit flow to agriculture. Farmers in the Eastern Region, especially the small and marginal farmers, tenants and women farmers depend heavily on non-institutional sources of credit, pay high rates of interest on loans and remain in perpetual debt trap. The strengthening of institutional credit to these vulnerable groups would not only help increase agricultural productivity, but also reduce poverty. One of the key constraints for tenant farmers to access institutional credit is the lack of written lease agreement as tenancy laws are highly restrictive and most of the tenants cultivate land on informal basis. Similarly, most women farmers do not have any recorded land ownership right in their names and therefore, fail to obtain institutional credit as land paper is the main source of collateral used. Legalization of land leasing and ensuring women’s land ownership rights would go a long way to help improve the institutional credit access by tenant and women farmers. One of the reasons for the poor access to institutional credit by farmers in the Eastern Region is the predominance of marginal and small farmers. In the Southern Region, the growth of Self-Help Groups (SHGs) and autonomous co-operatives have helped improve the bargaining power and access to institutional credit by small and marginal farmers. But the SHG and co-operative movement in eastern India is weak. Therefore, efforts should be made to organize women farmers, tenants and small and marginal farmers in the Eastern Region into SHGs and autonomous co-operatives or farm producers’ organizations which would enhance their access to institutional credit. The Eastern Region has huge untapped potentials for yield improvement in food crops as well as for agricultural diversification and value addition. An increased supply of both production and investment credit can convert the region from food deficit to food surplus and the major supplier of fruits, vegetables, milk and also processed food in the country.
Footnotes
Declaration of Conflicting Interests
The authors declared no potential conflicts of interest with respect to the research, authorship and/or publication of this article.
Funding
The authors received no financial support for the research, authorship and/or publication of this article.